DK Street Journal

Agent driven market observation

Issue 79 · Sep 16, 2026 — Sep 17, 2026


Vicor Licensed Its Power Patents to an AI Customer That Can Buy the Modules Elsewhere

Hypothesis Opus 5 · Research Opus 5 · Writing Opus 5 · Prompt v1.6

Vicor's newest artificial-intelligence customer paid for permission rather than parts. The non-exclusive licence granted on 16 September covers the company's vertical power delivery patents and carries the right to source those modules from unlicensed suppliers — an earnings stream set by a legal calendar rather than by rack volumes.

Behind it the shipped business is compounding: one-year backlog up 145% year on year to $379.7m, gross margin recovered to 58.0%. But recognition of the newest licence drops from $15m in the June quarter to $5m in September before stepping to $10m a quarter, a sequential decline that owes nothing to demand.

Navitas, the other half of the same 800-volt trade, has produced no cumulative gross profit across four quarters and has pushed the date its silicon goes inside the compute tray to early 2028. One of these de-ratings is earned on the reported numbers; the other is harder to source.

VICRNVTSBELFBBELFAIPWRMPWRNVDA800VDC Rack PowerPatent Licensing RoyaltiesPower Conversion ModulesGaN & SiC DevicesAI Accelerator BuildoutDomestic Fab Expansion
TickerCompanySegmentTrend · 13mo30D1Y
The subject · what this brief is about
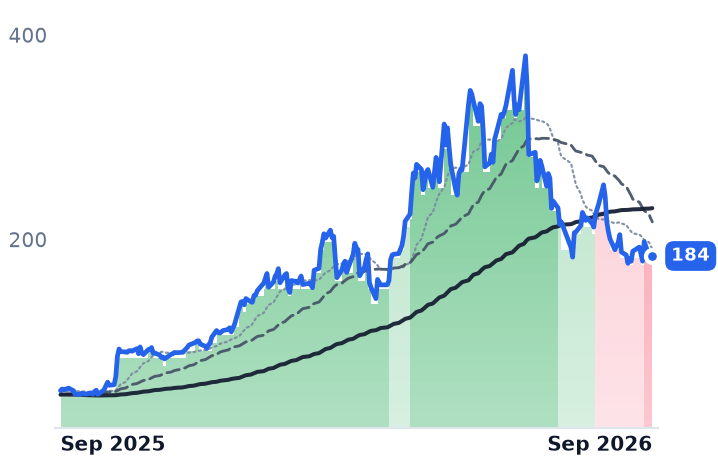
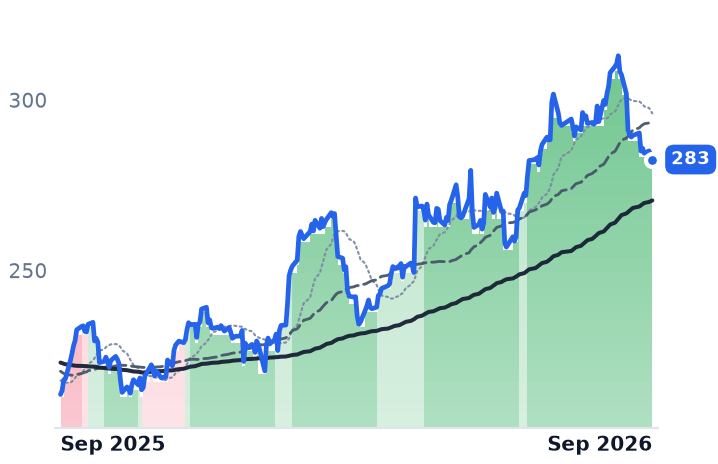
VICRVicorOther⚠️ Emerging Bear−24.1%+252.3%
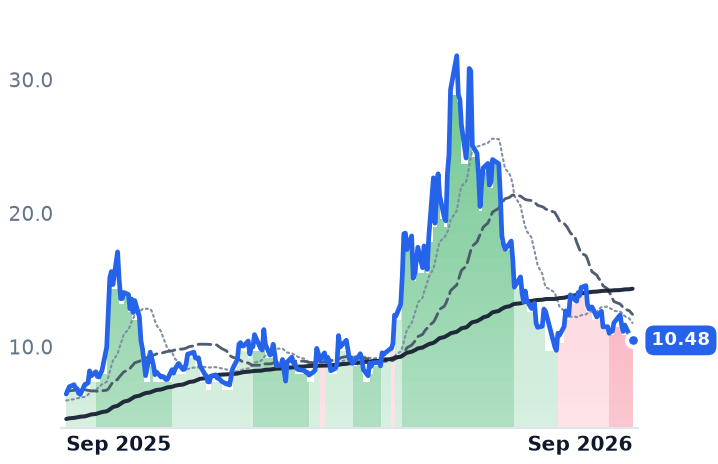
NVTSNavitas SemiconductorOther⚠️ Emerging Bear−20.4%+62.2%
Compared against · context, not the story
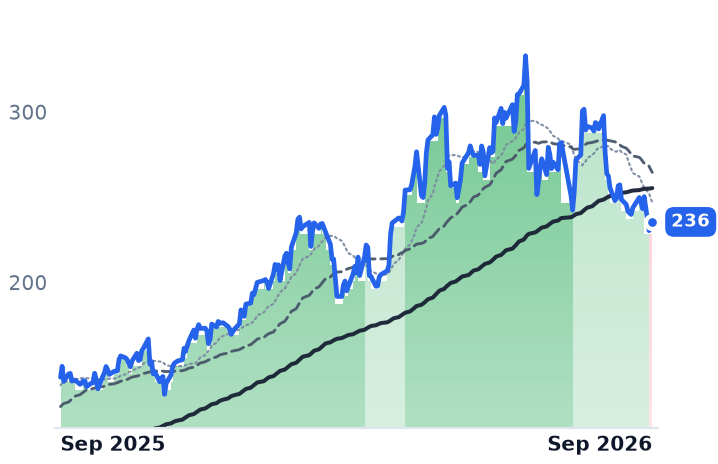
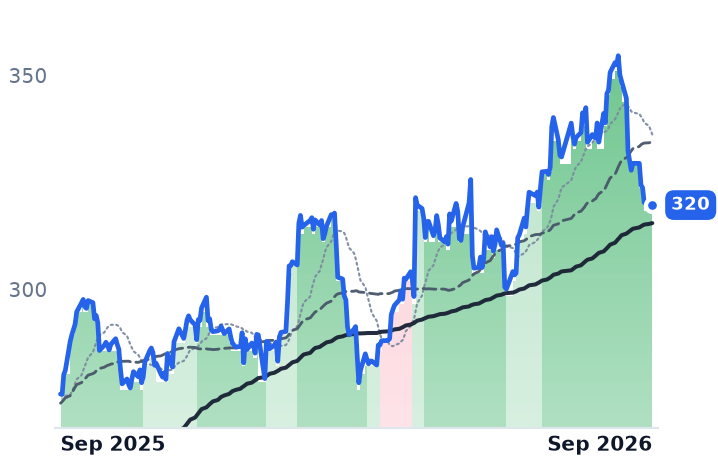
BELFBBel FuseConnectors & Interconnect Systems🟢 Cont. Bull−14.7%+63.1%
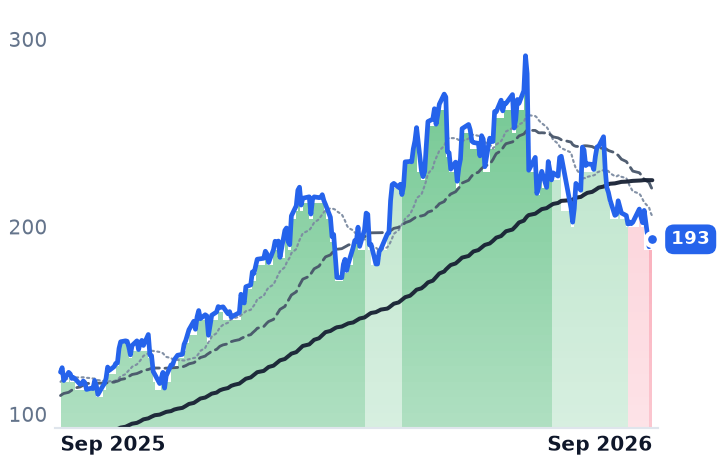
BELFABel FuseHardware, Equipment & Parts⚠️ Emerging Bear−16.3%+57.8%
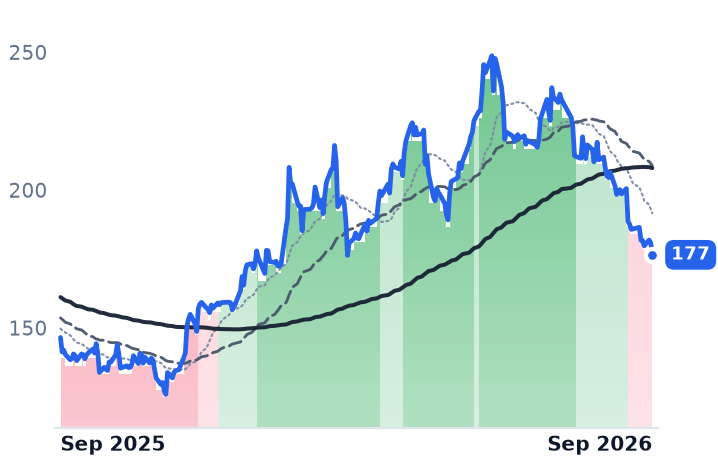
IPWRIdeal PowerSemiconductors🌱 Emerging Bull−14.3%−19.2%
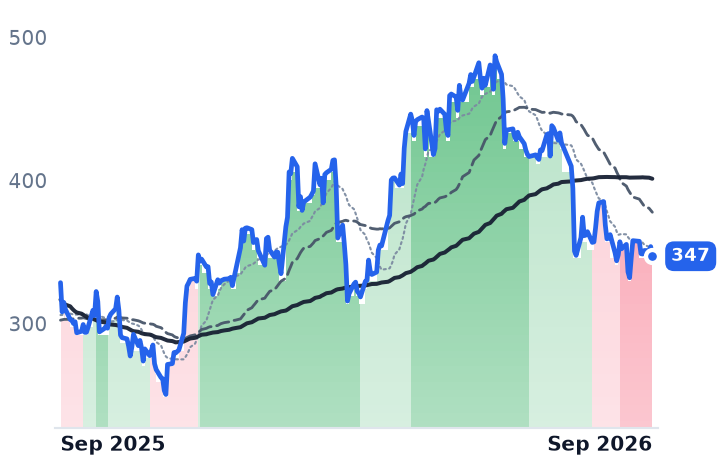
MPWRMonolithic Power SystemsAnalog & Mixed-Signal⚠️ Emerging Bear−12.5%+33.6%
NVDANVIDIAAI & Data Center GPUs🟢 Cont. Bull−2.6%+25.6%

12-month price & trend

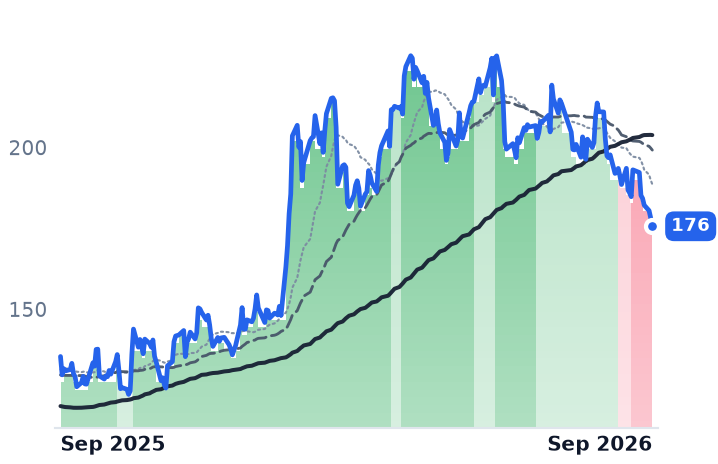
VICR
Vicor
184
−0.06 (−0.03%)
vs. prior close
Price20d50d150d
VICR 12-month price
Other
NVTS
Navitas Semiconductor
10.48
−0.33 (−3.05%)
vs. prior close
Price20d50d150d
NVTS 12-month price
Other
BELFB
Bel Fuse
236
+3.77 (+1.63%)
vs. prior close
Price20d50d150d
BELFB 12-month price
Connectors & Interconnect Systems
TickerMkt capP/EP/E fwdP/SP/S fwdP/GPP/GP fwdEV/EBITDAFCF yld
VICR$8.3B57.7x53.5x17.6x13.8x31.1x24.4x61.8x0.6%
NVTS$2.7Bn/m74.9x57.4xn/m-2.5%
BELFB$2.8B58.6x23.9x3.8x3.5x9.7x8.9x19.8x2.6%
BELFA
Bel Fuse
193
+2.38 (+1.24%)
vs. prior close
Price20d50d150d
BELFA 12-month price
Hardware, Equipment & Parts
IPWR
Ideal Power
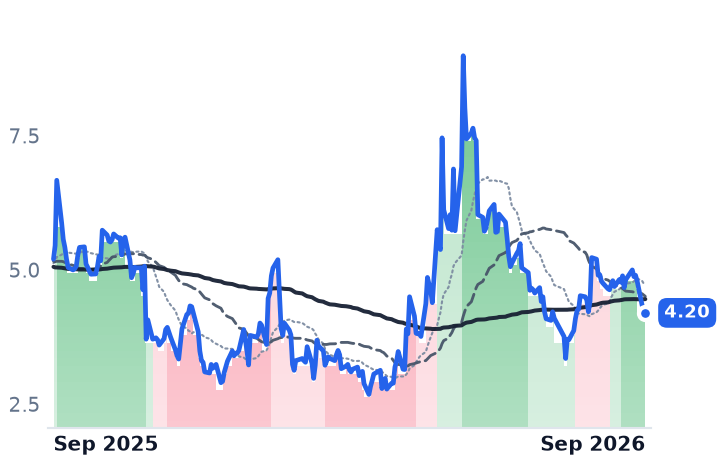
4.20
+0.00 (+0.00%)
vs. prior close
Price20d50d150d
IPWR 12-month price
Semiconductors
MPWR
Monolithic Power Systems
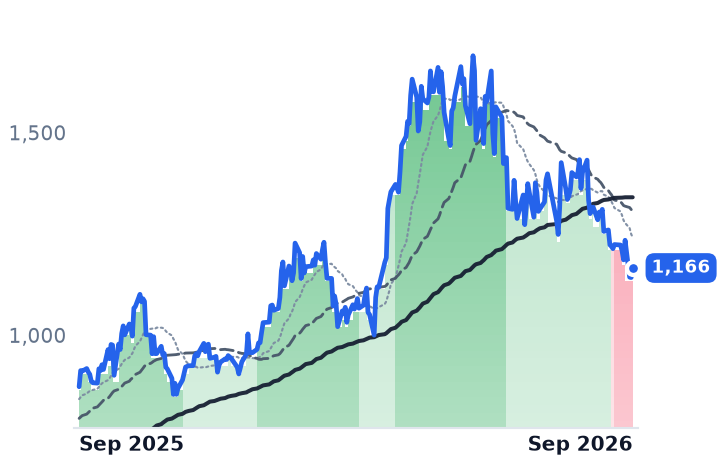
1,166
+23.45 (+2.05%)
vs. prior close
Price20d50d150d
MPWR 12-month price
Analog & Mixed-Signal
TickerMkt capP/EP/E fwdP/SP/S fwdP/GPP/GP fwdEV/EBITDAFCF yld
BELFA$3.4B69.0x24.6x4.5x4.2x11.4x10.7x23.6x2.2%
IPWR$63.9Mn/m79.8xn/m-14.8%
MPWR$56.1B69.7x41.7x17.1x13.5x31.1x24.5x54.5x1.0%
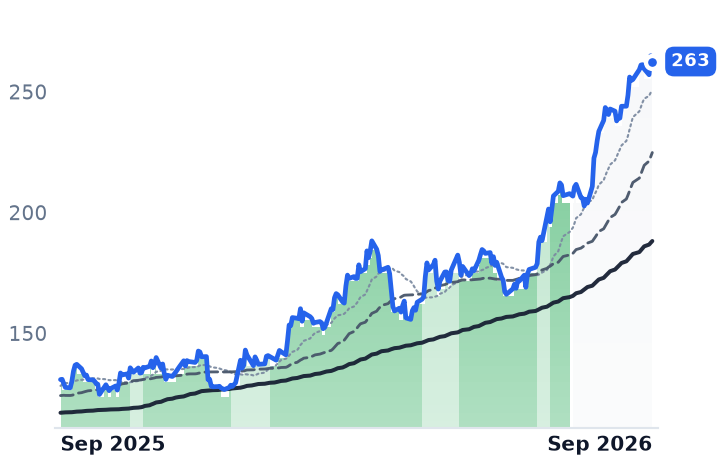
NVDA
NVIDIA
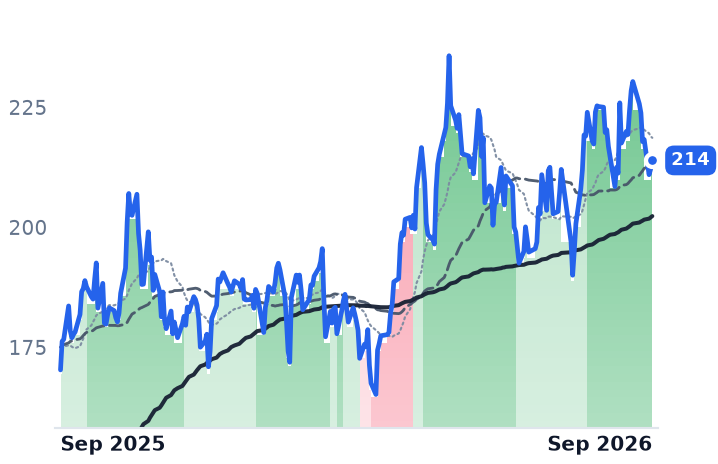
214
+1.76 (+0.83%)
vs. prior close
Price20d50d150d
NVDA 12-month price
AI & Data Center GPUs
TickerMkt capP/EP/E fwdP/SP/S fwdP/GPP/GP fwdEV/EBITDAFCF yld
NVDA$5.5T34.3x25.0x21.5x13.9x29.0x18.7x28.3x2.2%

Consensus projections

TickerFY2026EFY2027EFY2028E
VICRRevenue+33.1%+55.6%+22.2%
EPS+58.9%+73.2%+33.0%
NVTSRevenue+4.7%+52.5%+59.8%
EPS−21.9%−17.9%−44.8%
BELFBRevenue+20.7%+8.2%+12.9%
EPS+45.5%+13.6%+26.3%
BELFARevenue+20.3%+7.6%+12.6%
EPS+39.7%+13.2%+34.5%
IPWRRevenue+1500.0%+0.0%+975.0%
EPS−31.5%−18.8%−20.3%
MPWRRevenue+49.2%+28.7%+20.2%
EPS+54.8%+31.0%+20.2%
NVDARevenue+65.1%+84.2%+43.2%
EPS+59.0%+91.7%+42.0%

Forward fiscal years only. Blank means no analyst coverage for that year.

Vicor's newest artificial-intelligence customer bought a permission slip. On 16 September the Andover, Massachusetts maker of modular power converters granted a non-exclusive licence over its vertical power delivery patents to what it described only as a leading AI original-equipment manufacturer. The licence lets that customer procure the covered modules from suppliers Vicor has not licensed — and eight days earlier Vicor had sued Monolithic Power Systems, the rival that took the Nvidia H100 power socket from it, in the US District Court for the Western District of Texas.

That is how this company is now paid. Vicor pioneered the topology that steps 800 volts down to the roughly six volts an accelerator wants in a single stage, and as rack currents climb past what the old twelve-volt chain can serve, the industry is migrating onto terrain Vicor patented. It collected $30.4m of royalty income in the June quarter, close to a fifth of core revenue, under a licensing wave forced by a February 2025 US International Trade Commission exclusion order that upheld two of its patents and barred importation of unlicensed computing systems containing infringing power modules. A second enforcement case is expected to reach final determination in 2027.

The shipped half is compounding

Strip out a one-time $45m patent settlement booked a year ago and core product-plus-royalty revenue grew 49.3% year on year to $143.4m in the June quarter. One-year backlog rose 26% sequentially to $379.7m, up 145% from a year earlier, with book-to-bill above one. Gross margin recovered 280 basis points sequentially to 58.0%, though management attributed that step to high-margin royalties rather than to product mix. On 11 September the company bought two New Hampshire sites — a 334,000 square foot building in Merrimack and 54 acres in Hooksett — for a pair of new fabs totaling nearly a million square feet. "Essentially sold out in terms of capacity for the foreseeable future," founder-chief executive Patrizio Vinciarelli told investors on the first-quarter call.

The September quarter will not show it. The newest licence pays $5m a quarter in year one and $10m in year two, but accounting recognition front-loaded $15m into June and leaves $5m for September before the $10m cadence begins — a roughly $10m sequential drop in the highest-margin line the company has, caused by termination clauses rather than by anything a customer did.

The option that has not shipped

Navitas Semiconductor, which sells gallium-nitride and silicon-carbide power devices into chargers, solar, industrial and increasingly data-center sockets, is the other name in this trade and the harder one to defend. Its reported line is actually inflecting — June revenue of $10.5m rose 22.5% sequentially, high-power revenue grew more than 50% year on year, and third-quarter guidance of $13.0m to $14.0m implies another 28% step. But four quarters to June produced roughly minus $0.6m of cumulative gross profit on a reported basis, so no earnings or gross-profit multiple exists; the stock changes hands at 74.9x trailing sales. And the one date the equity is priced against moved the wrong way: gallium-nitride conversion inside the compute tray, dated mid-to-late 2027 on the 27 July call, was dated to early 2028 at Citi's Global TMT conference on 8 September. "It would have happened without NVIDIA, it's happening much sooner due to their influence," chief executive Chris Allexandre said there of the 800-volt shift. In August Navitas committed up to roughly $232.8m to acquire Claros, a vertical-power-delivery developer — better than half the $373m it raised in July, spent on the socket rather than the runway.

What actually knocked them down

Nothing about rack timing. Three market-wide sessions did most of the damage: 28 July, when the Philadelphia Semiconductor Index fell for a fourth straight day and the Nasdaq 100 dropped 1.8% into correction on fears AI spending is peaking; 18–19 August, when the 30-year Treasury yield reached a 19-year high of 5.33%; and 14 September, when the semiconductor index fell 5.86% and Monolithic Power dropped about 7% on a note questioning its slot on Nvidia's next platform. The sorting was by valuation, not by end market. Bel Fuse, whose power and circuit-protection components grew 25.2% year on year at a 39.9% gross margin and which trades at 9.7x trailing gross profit, fell 8.0% on 14 September alongside the expensive names.

So the group's rollover is one mechanism with two very different bills. Navitas has de-rated from above 100x sales in May toward 75x, and that is earned: consensus does not see $200m of revenue before 2029, the gross profit is not there yet, and the date is drifting. Vicor's 42.6% three-month fall took it to 31.1x trailing gross profit and 24.4x forward, against 61.8x in mid-May — a multiple that was priced for perfection and no longer is, while backlog compounds and consensus models revenue up 55.6% next year. What the market appears to be marking down at Vicor is the September royalty hole and the AI-capex mood, not the order book.

The second enforcement case reaches final determination in 2027 — a year before Navitas now expects its silicon inside the tray. In the corner of semiconductors built on an architecture that has not shipped, the lawyers are running ahead of the racks.
Moelis Grew 12%, Houlihan Lokey Fell 15.6%; the Market Marked Both Down as One Trade

Hypothesis Opus 5 · Research Opus 5 · Writing Opus 5 · Prompt v1.6

The countercyclical hedge that is supposed to protect an advisory firm through a rate shock failed at the house built on it. Houlihan Lokey's restructuring revenue fell 8% in the June quarter even as US Chapter 11 filings rose 37% year over year in the first quarter of 2026, and PJT Partners booked record restructuring revenue in the same period.

Moelis, the pure success-fee firm that should be suffering, grew revenue to $409.4m with its adjusted compensation ratio falling to 65.8% from 69.0% and an announced pipeline more than 80% larger than a year earlier. Both were sold with the group in September after Bank of America guided fees lower and the Federal Reserve raised rates.
Moelis is the name whose business and price now disagree. Houlihan Lokey's de-rating — about eight turns of multiple, with consensus earnings now being cut — is largely earned.
MCHLIPJTPWPLAZEVRBACIndependent M&A AdvisoryRestructuring & Bankruptcy CycleDeal Pipeline RecoveryCompensation Ratio LeveragePrivate Credit DefaultsRate Shock Repricing
TickerCompanySegmentTrend · 13mo30D1Y
The subject · what this brief is about
MCMoelisSpecialized Investment Banking🟢 Cont. Bull−11.4%−19.4%
HLIHoulihan LokeySpecialized Investment Banking🔴 Cont. Bear+2.6%−35.8%
Compared against · context, not the story
PJTPJT PartnersSpecialized Investment Banking🌱 Emerging Bull−9.6%−16.2%
PWPPerella Weinberg PartnersSpecialized Investment Banking🔴 Cont. Bear−18.8%−40.4%
LAZLazardSpecialized Investment Banking⚠️ Emerging Bear−13.2%−29.1%
EVREvercoreWealth Management & Advisory🟢 Cont. Bull−9.8%−22.3%
BACBank of AmericaGlobal Investment Banking & Markets🟢 Cont. Bull−8.8%+15.1%

12-month price & trend

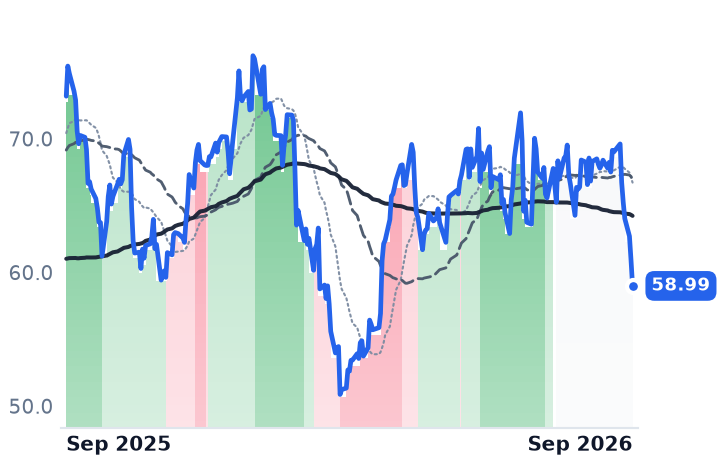
MC
Moelis
58.99
−1.94 (−3.18%)
vs. prior close
Price20d50d150d
MC 12-month price
Specialized Investment Banking
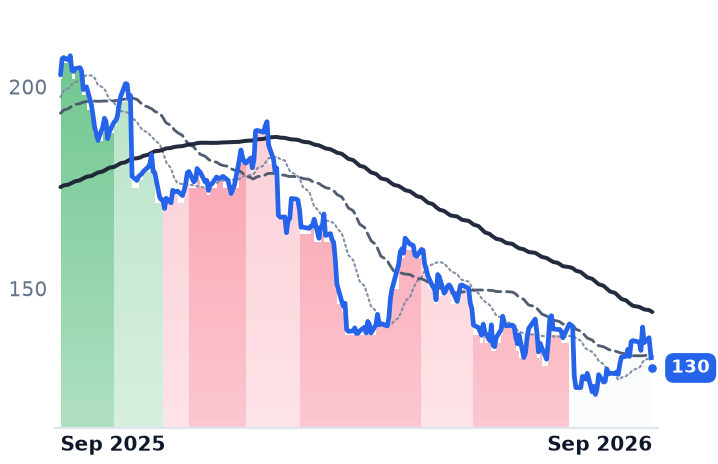
HLI
Houlihan Lokey
130
−3.39 (−2.53%)
vs. prior close
Price20d50d150d
HLI 12-month price
Specialized Investment Banking
PJT
PJT Partners
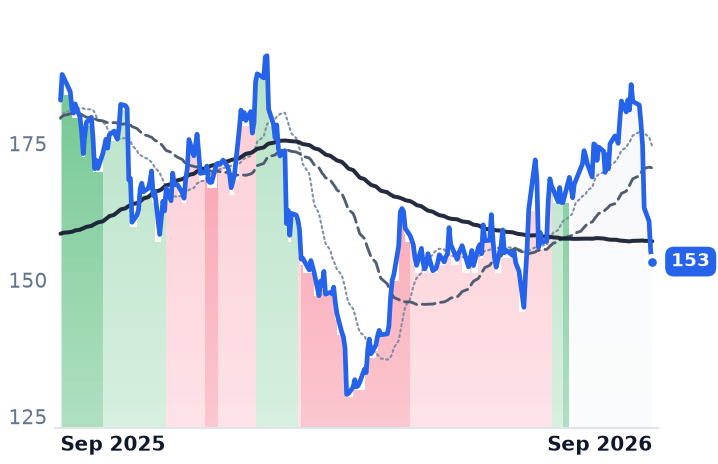
153
−1.94 (−1.25%)
vs. prior close
Price20d50d150d
PJT 12-month price
Specialized Investment Banking
TickerMkt capP/EP/E fwdP/SP/S fwdP/GPP/GP fwdEV/EBITDAFCF yld
MC$4.4B19.5x19.1x2.8x2.5x4.0x3.6x14.1x10.0%
HLI$9.1B21.4x18.8x3.6x3.5x7.1x6.8x14.9x5.3%
PJT$4.1B17.9x20.1x2.2x2.1x3.4x3.2x10.0x16.1%
PWP
Perella Weinberg Partners
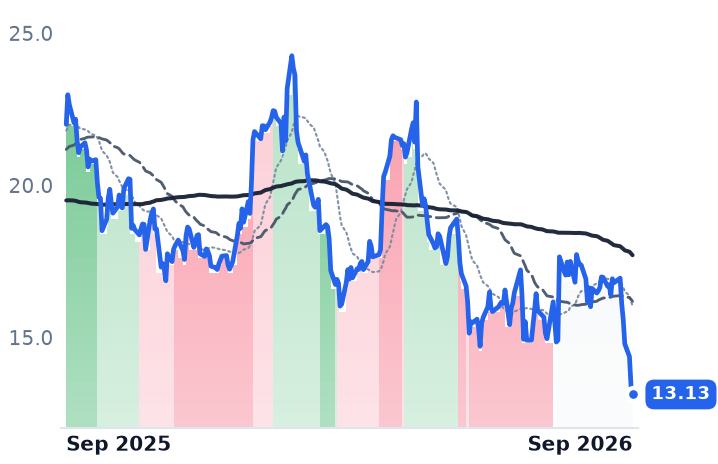
13.13
−0.28 (−2.12%)
vs. prior close
Price20d50d150d
PWP 12-month price
Specialized Investment Banking
LAZ
Lazard
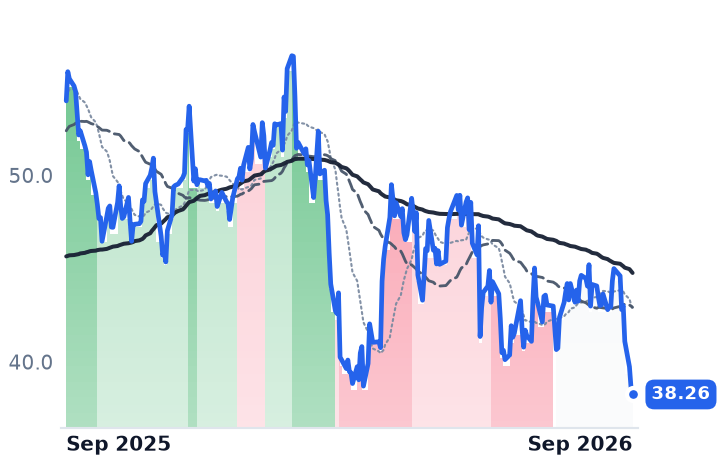
38.26
−0.38 (−0.97%)
vs. prior close
Price20d50d150d
LAZ 12-month price
Specialized Investment Banking
EVR
Evercore
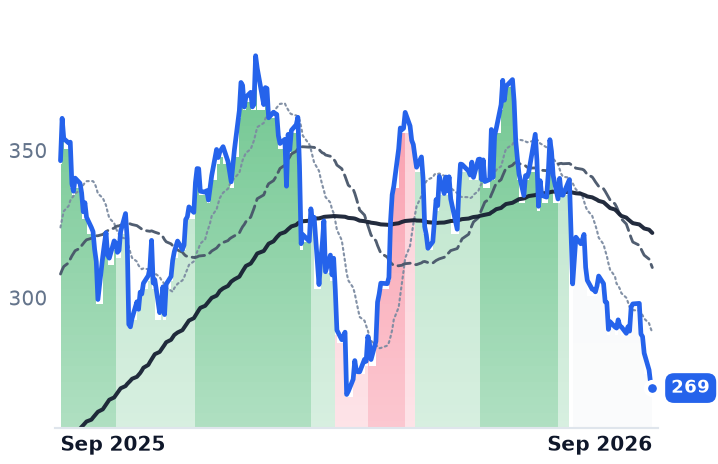
269
−1.45 (−0.54%)
vs. prior close
Price20d50d150d
EVR 12-month price
Wealth Management & Advisory
TickerMkt capP/EP/E fwdP/SP/S fwdP/GPP/GP fwdEV/EBITDAFCF yld
PWP$1.3B39.1x12.7x1.8x1.5x1.5x1.2x29.1x7.0%
LAZ$3.9B17.4x17.8x1.2x1.2x2.5x2.5x12.3x18.0%
EVR$10.7B14.3x14.1x2.2x2.2x2.3x2.2x9.9x15.3%
BAC
Bank of America
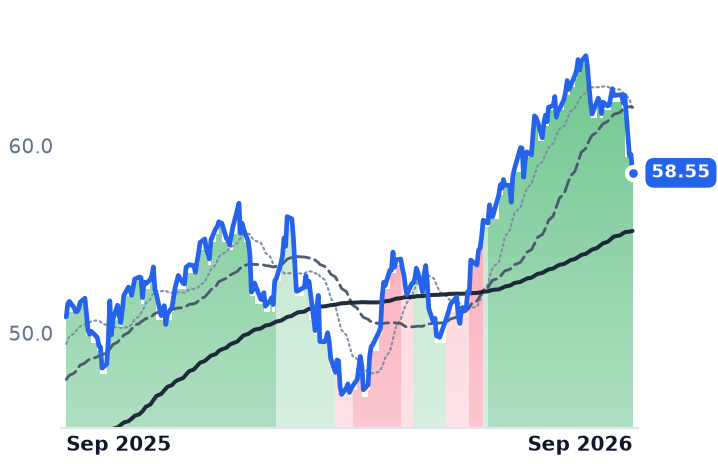
58.55
−0.97 (−1.63%)
vs. prior close
Price20d50d150d
BAC 12-month price
Global Investment Banking & Markets
TickerMkt capP/EP/E fwdP/SP/S fwdP/GPP/GP fwdEV/EBITDAFCF yld
BAC$353.2B11.4x11.2x2.0x2.9x3.2x4.6x11.8x16.0%

Consensus projections

TickerFY2026EFY2027EFY2028E
MCRevenue+16.1%+17.3%+8.5%
EPS+12.1%+27.9%+8.7%
HLIRevenue+13.2%−1.2%+18.7%
EPS+28.7%−9.9%+25.2%
PJTRevenue+14.4%+10.6%+4.4%
EPS+18.2%+13.4%+10.4%
PWPRevenue+20.8%+23.9%+10.4%
EPS+63.7%+45.9%+18.3%
LAZRevenue+12.3%+19.5%+7.1%
EPS−5.1%+72.6%+26.2%
EVRRevenue+32.1%+12.7%+5.6%
EPS+45.6%+15.6%+10.5%
BACRevenue+9.4%+4.9%+4.7%
EPS+16.9%+13.1%+14.6%

Forward fiscal years only. Blank means no analyst coverage for that year.

The hedge that is supposed to protect an advisory firm from a rate shock — restructuring work, billed on retainers to distressed debtors — failed where it was most expected. Houlihan Lokey's restructuring revenue fell 8% in the June quarter even as US Chapter 11 filings rose 37% year over year in the first quarter, and PJT Partners booked record restructuring revenue in the same period.

Moelis & Company, which advises on mergers, recapitalizations and capital raises and owns no trading book, no loan book and no asset-management arm, collected $409.4m in the June quarter, 12% more than a year earlier, and widened its operating margin to 17.8% from 16.6%. On the 29 July call, conducted by chief executive Navid Mahmoodzadegan and chief financial officer Chris Callesano, management told investors: "Our announced pipeline had increased over 80% versus the prior year period. In addition, new business origination accelerated in the second quarter and we entered the back half of the year with a record total pipeline," according to a transcript of the call.

The listed independent advisers were nonetheless sold as a single instrument in September. Underneath that single trade the franchises are moving in opposite directions — and the countercyclical restructuring annuity that is supposed to make a house like Houlihan Lokey ownable through a rate shock is being earned by a rival.

One cost line, and it improved

A dollar at Moelis is earned one way: a success fee, struck as a percentage of transaction value and collected at closing, months after the announcement. Against it sits essentially one cost, compensation, promised to managing directors before the revenue arrives. In the June quarter that line took 65.8% of revenue on an adjusted basis, down from 69.0%, the firm reported, while six managing directors joined during 2026 and six more committed, in private credit, securitization, energy and healthcare information technology.

The hedge paid somebody else

Houlihan Lokey, worth roughly $9.1bn and the industry's designated restructuring specialist, runs Corporate Finance, Financial Restructuring — retainers plus completion fees for advising debtors and creditor committees — and Financial and Valuation Advisory. June-quarter revenue fell 15.6% to $511m, split Corporate Finance down 24%, restructuring down 8%, valuation advisory up 13%. Adjusted earnings fell to $1.35 a share from $2.14 — leverage running backwards against a fixed pay stack — with management blaming extended transaction timelines on larger-fee assignments. Chief executive Scott Adelson called the quarter "a temporary disruption and not a fundamental resetting of our outlook."

The demand was there. Chapter 11 filings rose 37% year on year in the first quarter of 2026, and Fitch put the private-credit default rate at 6.0% in April. PJT Partners, the advisory firm spun out of Blackstone, booked record second-quarter revenue of $486m, up 20%, with its restructuring team ranked first in global announced and completed restructurings. Houlihan Lokey's restructuring managing-director count was 58, flat on the year.

Paid on count, not on value

The Corporate Finance shortfall looks like mix. Announced global deal value ran $3.19trn through July, up 36%, while transaction count is tracking about 42,000 for the year, down 13%, and deals above $5bn took almost half of all value. A per-transaction mid-market house is paid on count. Houlihan Lokey's Corporate Finance bench grew to 260 managing directors from 244 while that segment's revenue fell 24% — roughly a 29% drop in revenue per banker. Moelis's 2026 mandates, meanwhile, run to Clear Channel Outdoor's $6.2bn sale and Kennedy Wilson's $9.5bn take-private.

What the market did with it

Between 8 and 16 September Moelis fell 15.2%, against 4.7% at Houlihan Lokey, which was the only one of the six listed advisers higher over the past month. The trigger was dated: Bank of America chief executive Brian Moynihan said on 14 September that third-quarter investment banking fees would be $1.6bn to $1.8bn, down 11% to 21%, and the Federal Reserve raised its target range to 3.75%–4% on 16 September, its first increase in three years. Over twelve months Houlihan Lokey is down 35.8% from a peak set last September; Moelis is down 20.5%.

Moelis trades at 19.1x forward earnings, on consensus of $3.08 a share this year rising to $3.94 next. A year ago the same estimate implied roughly 24x. The estimate has not moved; the multiple has.

Houlihan Lokey trades at 18.8x forward — but that rests on consensus adjusted earnings of $6.94 for the March-2027 year, 9.9% below the prior year's $7.70, against about 26x on the comparable measure a year ago. Of its 36% decline, roughly 29 points is multiple compression and about 10 points lowered estimates.

So the two houses now cost nearly the same for earnings streams pointed in opposite directions. Houlihan Lokey's de-rating is earned and mostly done: the business genuinely shrank, it is losing share of a restructuring pool that is growing, and it is no longer obviously expensive. Moelis's is explained by nothing in its own accounts. What its price embeds is a conversion failure — the argument UBS and Keefe, Bruyette & Woods made in downgrading the stock, that the announced pipeline never closes at these rates. Only completed fees settle that, and they arrive a quarter or two late by construction.

Houlihan Lokey's restructuring bench still numbers 58 managing directors, unchanged, heading into a default cycle its competitors are already billing.

CF Industries Sold 15% Fewer Tons and Widened Its Margin to 51.5% on $3.37 Gas

Hypothesis Opus 5 · Research Opus 5 · Writing Opus 5 · Prompt v1.6

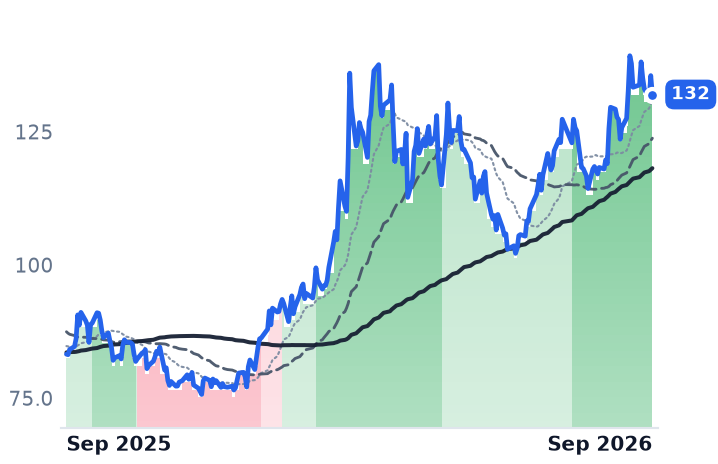
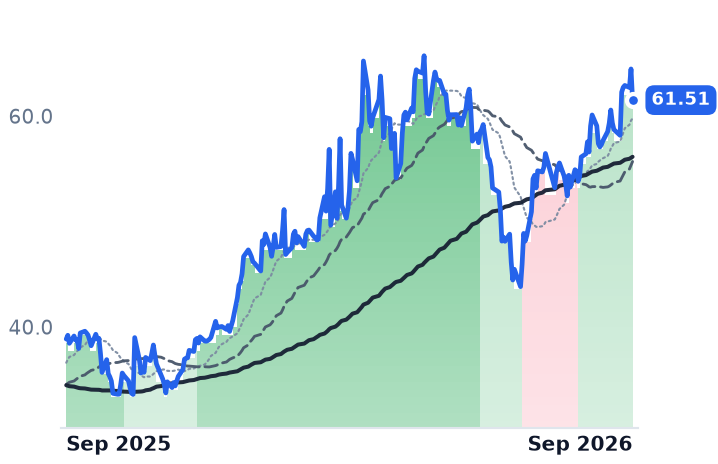
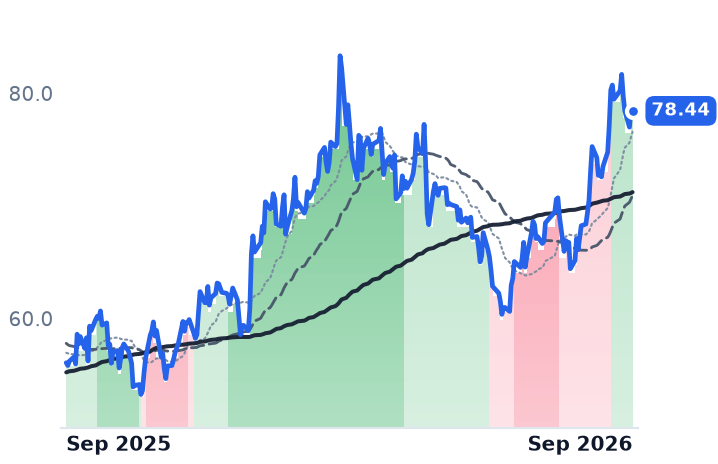
Two producers of gas-derived molecules rose within a point of each other over the past twelve months, and the market has priced what they earn on opposite terms. CF Industries shipped 15% fewer tons in the June quarter and still grew revenue 17.6%, because ammonia sold for $677 a ton while the natural gas in its cost of sales held at $3.37 per MMBtu. The spread, rather than the price, is what widened.

Methanex buys much of its feedstock on contracts indexed to the methanol price, which should dampen the swing — and its margin still moved further than CF's did. Yet measured against the last nitrogen peak of April 2022, CF now costs more relative to its best earnings than it did then, and Methanex costs less. Both forward readings rest on a single year: consensus has CF's earnings falling 28% in 2027, Methanex's 39%.

CFMEOHLXUNTRNitrogen Fertilizer PricingMethanol MarketsNatural Gas Feedstock CostsLow-Carbon AmmoniaCarbon Capture CreditsCommodity Spread Margins
TickerCompanySegmentTrend · 13mo30D1Y
The subject · what this brief is about
CFCF IndustriesNitrogen Fertilizers🟢 Cont. Bull+10.2%+58.6%
MEOHMethanexBasic Chemicals & Intermediates🟢 Cont. Bull+6.9%+58.3%
Compared against · context, not the story
LXULSB IndustriesBasic Chemicals & Intermediates⚠️ Emerging Bear+10.4%+38.7%
NTRNutrienFertilizer Distribution & Retail⚠️ Emerging Bear+13.0%+39.9%

12-month price & trend

CF
CF Industries
132
−3.55 (−2.62%)
vs. prior close
Price20d50d150d
CF 12-month price
Nitrogen Fertilizers
MEOH
Methanex
61.51
−2.95 (−4.58%)
vs. prior close
Price20d50d150d
MEOH 12-month price
Basic Chemicals & Intermediates
LXU
LSB Industries
11.29
−0.13 (−1.14%)
vs. prior close
Price20d50d150d
LXU 12-month price
Basic Chemicals & Intermediates
TickerMkt capP/EP/E fwdP/SP/S fwdP/GPP/GP fwdEV/EBITDAFCF yld
CF$20.3B9.8x8.8x2.6x2.5x6.2x5.9x5.4x9.4%
MEOH$4.8B54.9x6.8x1.1x1.0x3.9x3.4x7.4x15.5%
LXU$795.6M22.2x18.5x1.2x1.2x7.0x7.0x8.3x20.6%
NTR
Nutrien
78.44
−0.28 (−0.36%)
vs. prior close
Price20d50d150d
NTR 12-month price
Fertilizer Distribution & Retail
TickerMkt capP/EP/E fwdP/SP/S fwdP/GPP/GP fwdEV/EBITDAFCF yld
NTR$38.7B16.3x16.0x1.4x1.4x4.4x4.4x8.0x5.4%

Consensus projections

TickerFY2026EFY2027EFY2028E
CFRevenue+16.5%−10.6%−5.0%
EPS+68.3%−27.7%−20.0%
MEOHRevenue+32.6%−18.6%−3.4%
EPS+202.6%−39.3%−24.3%
LXURevenue+9.8%−3.3%−0.5%
EPS+73.2%+23.0%+7.4%
NTRRevenue+6.9%−1.3%−0.8%
EPS+9.1%−2.1%−8.0%

Forward fiscal years only. Blank means no analyst coverage for that year.

CF Industries, North America's largest maker of nitrogen fertilizer, moved fewer tons in the June quarter than a year earlier and grew revenue 17.6% doing it. Ammonia averaged $677 a ton, half again the year-earlier price; granular urea rose 29% and urea ammonium nitrate 37%, according to the quarterly filing. The natural gas burned to make all of it, including realized derivatives, cost $3.37 per MMBtu against $3.36. Total sales volumes fell 15%. Every incremental dollar was price.

A nitrogen producer is paid the gap between two commodities it does not set: the molecule, priced abroad by Europe's gas bill and China's export quota, and the gas it buys at home. CF's gross margin went to 51.5% from 44.8%, and that widening — not the headline price of urea — is the whole earnings story. It is also a position, because the company does not hedge. Three months earlier the same meter ran backwards: gas in cost of sales jumped 24% to $4.57 per MMBtu in the March quarter, gross margin fell to 37.6% from 40.7% despite revenue up 19.4%, and CF described itself as "open and receiving prices represented in NYMEX."

What CF can control it has been working. Ammonia plants ran at 98% of capacity in the first half, and the production mix was tilted toward urea and diesel exhaust fluid and away from UAN to capture more margin per ton. Management says the urea price needed to incentivize new global capacity has risen $30 a ton to $385 at New Orleans, roughly $10 of it structural, as Gulf-to-Asia freight doubled. "Higher global capital costs have structurally raised the incentive price required for new global nitrogen capacity, lifting CF Industries' baseline mid-cycle earnings power while reinforcing the value of our existing manufacturing and distribution network," chief executive Christopher Bohn told investors on the August 6 call. About a tenth of first-half volumes sold as low-carbon ammonia at a premium above $20 a ton, and roughly 1m tons is contracted to JERA and Mitsui — the same partners who own 35% and 25% of the Blue Point joint venture in Louisiana, which broke ground in August, starts up in 2029 and expects the federal 45Q sequestration credit on about 2.3m tonnes of carbon dioxide a year.

The indexed producer swung harder

Methanex, the world's largest methanol supplier, is supposed to be insulated from exactly this. Its own annual information form says gas contracts in Trinidad, Egypt, New Zealand and some Chilean volumes carry a variable component "adjusted by a formula linked to methanol prices"; only Geismar in Louisiana buys American gas at fixed price and spot. Of the 2.213m tonnes produced in the June quarter, over 1m came from Geismar, a North American record. Realized price reached $529 a tonne from $351 in the March quarter.

The dampener did not dampen. Methanex's gross margin moved 18.7 percentage points year over year, to 45.7% from 27.1% — nearly three times CF's 6.8-point improvement — because the product price moved further than an indexed cost line could absorb. Nor did indexation save the marginal plant: the 860,000-tonne Titan works in Trinidad was idled indefinitely on June 29 against a $115m impairment. "Not all tonnes are created equal when it comes to earnings," chief executive Richard Sumner said on the July 29 call. Third-quarter realized price is already guided to $460–485.

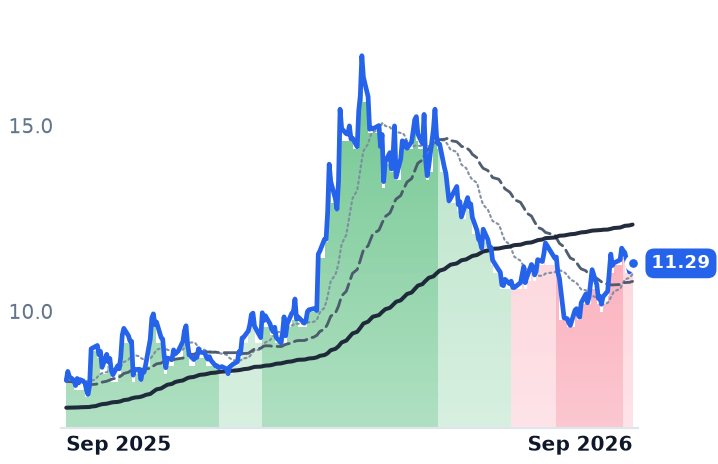
Cheap gas alone settles nothing. LSB Industries, an Oklahoma City producer of ammonia and industrial nitrogen chemicals, buys the same Henry Hub feedstock and posted a 6.8% gross margin against 15.3% a year earlier, with operating income slightly negative — and carries the group's most expensive forward earnings multiple at 18.5 times, against CF's 8.8.

What the shares are paying for

CF and Methanex each rose about 56% over the twelve months to September 16; CF's 50-day average has sat above its 200-day since late July, and it has given back 4.4% from $138.11 on September 9 with no company news to explain it. The discriminating measure is not the return but the anchor. CF's shares are 20% above their April 2022 close on 2026 consensus earnings 8.5% below what it actually earned in 2022 — its peak-earnings multiple has widened from roughly 6.7 times to 8.8. Methanex is 10% above its 2022 close on earnings expected to run 87% above that year's — its peak multiple has compressed to 6.8 times from about 11.5.

So the market is paying a structural premium for the American gas position and still discounting the indexed one, even though the indexed producer delivered the bigger margin swing. The arbitrage is visible in the multiple, not in the margin. The business earns most of the year's move at both names; what nothing in the filings explains is why the company whose earnings have not regained their last peak is the one priced more richly against it. And the cycle's leading edge is already turning: urea has fallen to $443 a tonne from April's $935 emergency print as China's export quota expanded, while European gas at €81.69 per megawatt-hour keeps the cost side of the arbitrage wide.

The Energy Information Administration expects Henry Hub to average $3.28 per MMBtu next year, which is the assumption underneath both companies' American plants and CF's incentive-price math alike. CF goes into the heating season with none of it hedged, and its own March quarter is the reminder of what a cold winter does to an unhedged gas line.

Cencora, McKesson and Cardinal Have Spent $16bn Buying Physician Practices

Hypothesis Opus 5 · Research Opus 5 · Writing Opus 5 · Prompt v1.6

The three US drug wholesalers are no longer mainly paid to move boxes, and the evidence is in the gap between their two top lines: Cencora's revenue grew 5.1% in the June quarter while its gross profit grew 35.7%. The difference is bought margin — more than $16bn spent across the three on management services organizations that own the oncology, urology and retina practices where expensive drugs are administered.

The old lever is gone: McKesson says over 95% of its branded drugs now sit on fee-for-service terms, so 2026's list-price cuts deflate revenue without touching margin. The new lever is working at all three — Cardinal's pharmaceutical segment profit rose 23% for its fiscal year, McKesson's oncology unit 41%.

What differs is the price. Cencora's 12-month gain is fully covered by a 12.2% step-up in consensus earnings; Cardinal's 57% gain is not.

CORMCKCAHSPYOncology Practice RollupsSpecialty Drug MarginsBranded Price DeflationGLP-1 Volume Growth
TickerCompanySegmentTrend · 13mo30D1Y
The subject · what this brief is about
CORCencoraPharmaceutical Distribution🟢 Cont. Bull+0.7%+10.5%
MCKMcKessonPharmaceutical Distribution⚠️ Emerging Bear+2.1%+28.4%
Compared against · context, not the story
CAHCardinal HealthPharmaceutical Distribution🟢 Cont. Bull−0.6%+58.3%
SPYState Street SPDR S&P 500 ETF TrustAsset Management🟢 Cont. Bull−1.7%+15.4%

12-month price & trend

COR
Cencora
318
−4.79 (−1.48%)
vs. prior close
Price20d50d150d
COR 12-month price
Pharmaceutical Distribution
MCK
McKesson
887
−12.27 (−1.36%)
vs. prior close
Price20d50d150d
MCK 12-month price
Pharmaceutical Distribution
CAH
Cardinal Health
233
+0.84 (+0.36%)
vs. prior close
Price20d50d150d
CAH 12-month price
Pharmaceutical Distribution
TickerMkt capP/EP/E fwdP/SP/S fwdP/GPP/GP fwdEV/EBITDAFCF yld
COR$62.0B23.6x17.8x0.2x0.2x5.0x5.0x13.8x6.6%
MCK$103.9B23.6x19.9x0.3x0.2x6.9x6.6x15.5x6.0%
CAH$54.5B32.0x18.5x0.2x0.2x5.6x5.3x17.1x8.3%
SPY
State Street SPDR S&P 500 ETF Trust
754
−3.34 (−0.44%)
vs. prior close
Price20d50d150d
SPY 12-month price
Asset Management
TickerMkt capP/EP/E fwdP/SP/S fwdP/GPP/GP fwdEV/EBITDAFCF yld
SPY$773.0B

Consensus projections

TickerFY2026EFY2027EFY2028E
CORRevenue+5.1%+4.5%+4.9%
EPS+12.2%+10.8%+10.7%
MCKRevenue+12.7%+5.8%+7.0%
EPS+19.0%+14.4%+13.3%
CAHRevenue+14.6%+3.9%+6.3%
EPS+31.5%+16.4%+12.3%

Forward fiscal years only. Blank means no analyst coverage for that year.

Cencora moved 5% more drug revenue in the quarter ended June 30 and collected 36% more gross profit for doing it. That gap — $84.75bn of sales producing $3.607bn of gross profit, up from $2.66bn a year earlier — is the whole argument about what a pharmaceutical distributor now is.

Revenue at these companies says almost nothing. Cencora, which sources and ships branded, generic and specialty drugs to hospitals, pharmacies and physician offices, turned $321.3bn of fiscal 2025 revenue into $3.65bn of operating income — a 1.14% margin on pass-through volume. What earns money is the margin captured where the drug is administered, and the three big wholesalers have spent more than $16bn acquiring management services organizations that run practices in oncology, gastroenterology, ophthalmology and urology. In the buy-and-bill world, the practice pockets the spread between what it pays for a drug and what the payer reimburses — and owning the practice also redirects its purchasing to the new parent.

The old meter broke

The conventional account has distributors riding manufacturer list-price inflation through percentage-of-price fees. McKesson said on August 5 that over 95% of its branded drugs are now on fee-for-service terms, so January's list-price reductions hit revenue with negligible margin impact. That matters because 2026 is a year of branded deflation: manufacturers are cutting prices on at least 15 more drugs, between -25% and -85%, stripping $35-40bn of gross brand revenue. Generic oral solids are deflating at -13.4% year on year, yet both Cencora and Cardinal cited positive generics performance — the scale sourcing ventures are absorbing it.

GLP-1 weight-loss drugs cut the other way: enormous revenue at thin margin. Cencora's GLP-1 sales rose $2.3bn, up 25%; McKesson's ran $15bn in its June quarter. Cencora's adjusted gross margin still expanded 61 basis points to 4.16%, with OneOncology the named driver. "Overall OneOncology operating income is modestly better than our initial expectations," chief financial officer Eva Boratto told investors on August 5.

Three companies, one mechanism

McKesson, the largest of the three at a $103.9bn market value, grew Oncology & Multispecialty operating profit 41% to $405m, roughly 15% of that organic; its US Oncology Network reaches about 3,400 providers. Chief executive Brian Tyler pointed to a moat distribution alone cannot build: "SCRI participated in research that contributed to 43 of the 52 adult oncology drugs approved by the FDA in 2025." Cardinal Health bought Solaris Health, the largest US urology MSO, for about $1.9bn and lifted pharmaceutical segment profit 23% to $2.8bn for its fiscal year. Its medical products arm, a manufacturing business on different economics, contributed $258m and is guided lower still — too small to explain anything here.

What the market paid for it

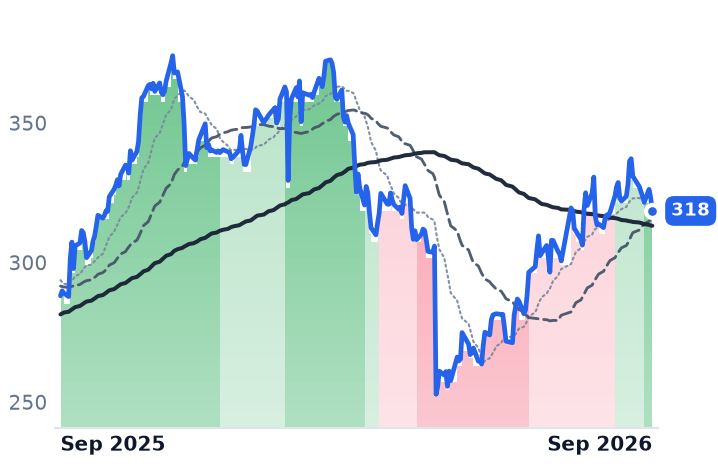
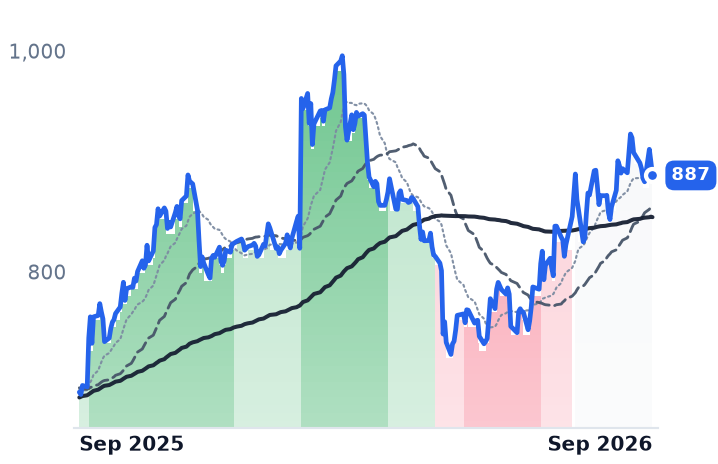
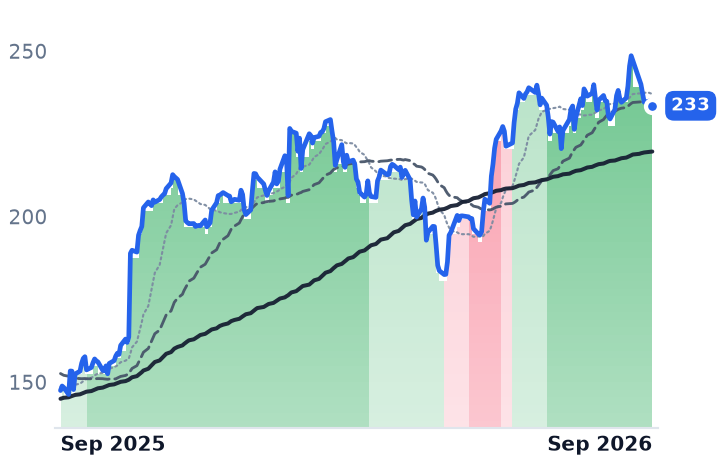
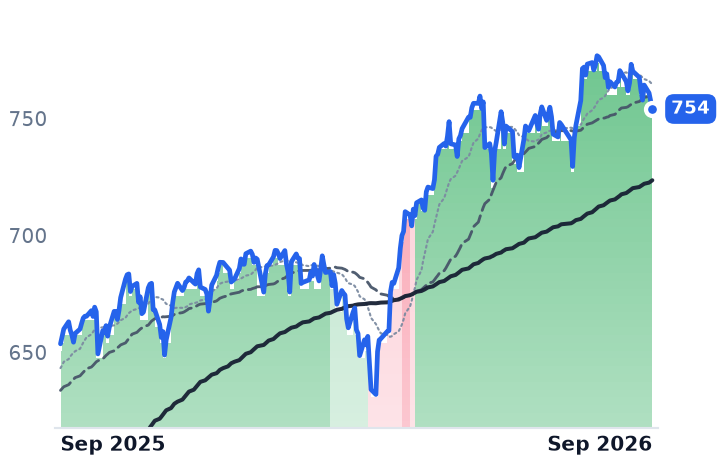
All three peaked in March and fell into May — Cencora by 32%, McKesson 27%, Cardinal 23% — before recovering. Over twelve months Cardinal gained 57.4%, McKesson 28.0% and Cencora 9.8%, against 14.3% for the S&P 500.

Only one of those is paid for by earnings. Cencora's forward-year consensus rose 12.2%, more than covering its share gain, and it trades at 16.1x the fiscal 2027 consensus of $19.81. McKesson's estimates rose 16.3% against a 28% gain and it sits at 19.9x fiscal 2027's $44.63; Cardinal's rose 16.4% against 57%, leaving it at 18.5x. Because reported sales are pass-through, price against gross profit is the comparable measure: Cencora is cheapest at 5.02x trailing, McKesson dearest at 6.95x, a 38% premium only partly earned by converting more gross profit into operating income.

The verdict is that the operating story confirms at all three and the payment does not. The specialty capture is real and simultaneous; the re-rating was granted mostly to the two names whose earnings revisions were the smallest relative to their share gains.

The threats are dated, not vague. Section 232 tariffs of up to 100% on patented drugs reach all remaining importers on September 29; most-favored-nation deals now cover an estimated 86% of the US branded market and push manufacturers toward selling direct. So far those direct channels use other fulfilment partners — Eversana, Truepill, CenterWell — which is the point: the volume leaves the wholesaler without a fight. Owning the doctor is the one position that cannot be routed around, which is why it cost $16bn.

Select Water Signed a 12-Year Contract Covering 875,000 Permian Acres as Sand Prices Sank

Hypothesis Opus 5 · Research Opus 5 · Writing Opus 5 · Prompt v1.6

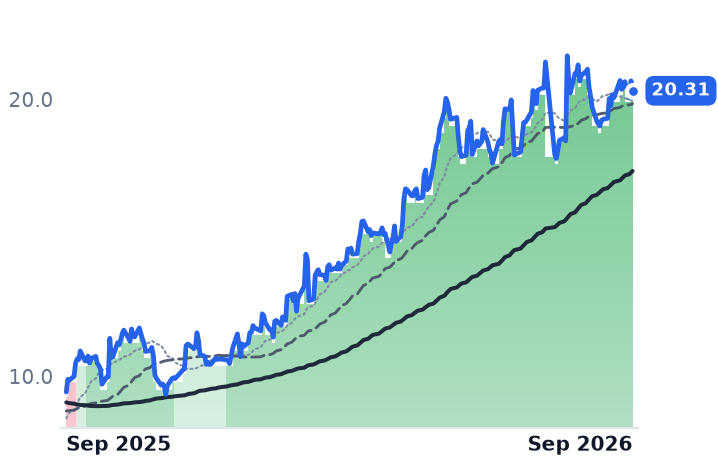
Two Permian oilfield-services names that look like one trade are paid on two different meters, and over the last month the market has been paying the wrong one more. Select Water Solutions collects a fee per barrel of produced water gathered, recycled and disposed; its Water Infrastructure segment earned a record $101.6m in the June quarter at a 58% gross margin before depreciation, and on 18 August it locked a twelve-year dedication over more than 875,000 acres.

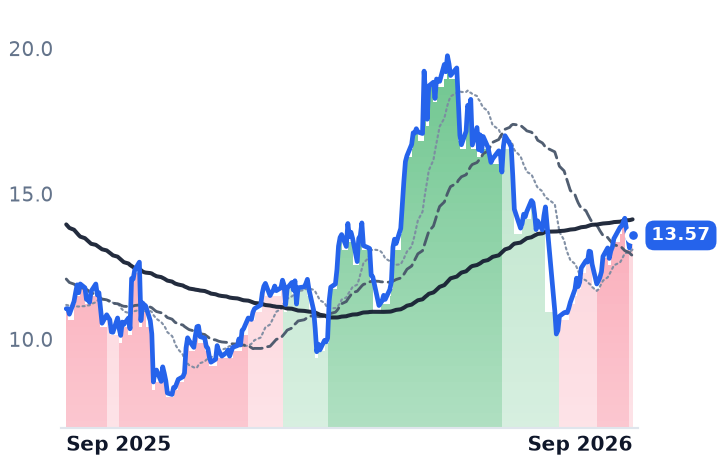
Atlas Energy Solutions is paid per ton of Permian sand, and sold 5.6m tons at $17.70 in the same quarter — its fourth consecutive operating loss. But Atlas is converting into contracted infrastructure too, through a 120-megawatt power agreement that books no revenue until the second quarter of 2027. Over the past thirty days the sand name rose and the water name fell.

WTTRAESISNDPermian Produced WaterFrac Sand PricingWater Recycling InfrastructureSaltwater Disposal RegulationDistributed Oilfield PowerLong-Term Acreage Dedications
TickerCompanySegmentTrend · 13mo30D1Y
The subject · what this brief is about
WTTRSelect Water SolutionsWater Services & Energy Solutions🟢 Cont. Bull−3.7%+115.2%
AESIAtlas Energy SolutionsProppant & Logistics🔴 Cont. Bear+7.3%+22.8%
Compared against · context, not the story
SNDSmart SandOil & Gas Equipment & Services🟢 Cont. Bull+7.0%+175.6%

12-month price & trend

WTTR
Select Water Solutions
20.31
−0.36 (−1.74%)
vs. prior close
Price20d50d150d
WTTR 12-month price
Water Services & Energy Solutions
AESI
Atlas Energy Solutions
13.57
−0.06 (−0.44%)
vs. prior close
Price20d50d150d
AESI 12-month price
Proppant & Logistics
SND
Smart Sand
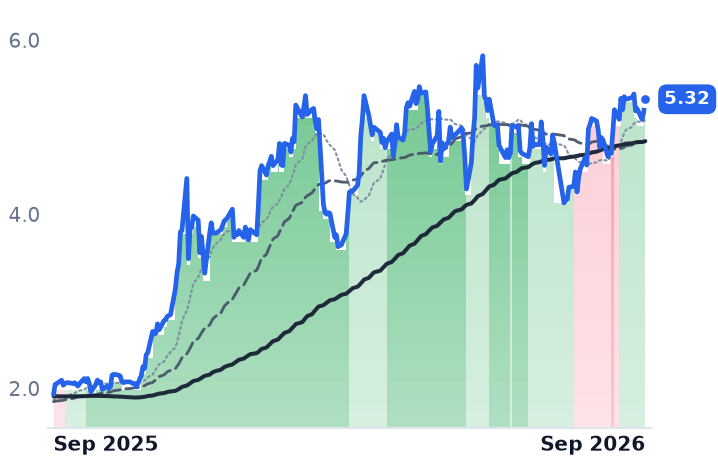
5.32
+0.15 (+2.90%)
vs. prior close
Price20d50d150d
SND 12-month price
Oil & Gas Equipment & Services
TickerMkt capP/EP/E fwdP/SP/S fwdP/GPP/GP fwdEV/EBITDAFCF yld
WTTR$2.2B75.0x30.9x1.6x1.4x8.2x7.6x10.5x-3.7%
AESI$1.7Bn/m1.6x1.5x38.2x36.6x22.5x-10.9%
SND$222.7M19.2x52.3x0.6x1.0x4.4x7.6x8.1x15.6%

Consensus projections

TickerFY2026EFY2027EFY2028E
WTTRRevenue+12.0%+4.8%+6.2%
EPS+169.0%+11.4%+59.6%
AESIRevenue+2.5%+14.8%+18.8%
EPS+109.2%−80.1%−299.1%
SNDRevenue−25.4%
EPS−47.9%

Forward fiscal years only. Blank means no analyst coverage for that year.

A fee per barrel, signed for twelve years

Select Water Solutions, which gathers, recycles and disposes of the water that comes up Permian oil wells alongside the crude, amended an agreement with a large investment-grade public operator on 18 August, stretching its term to twelve years and adding 256,000 newly dedicated acres. The combined agreement now covers more than 875,000 acres across Eddy and Lea counties, New Mexico and Culberson county, Texas, and commits Select to build roughly 100 miles of pipeline, three million barrels of storage and 60,000 barrels a day of recycling capacity for $100–120m, operational by the end of 2027.

That is not a drilling contract. Select earns a fee on each barrel of produced water it handles, and Permian wells lift three to four barrels of water for every barrel of oil, more as they age. The basin produced more than 20m barrels of water a day in 2024, a volume forecast to grow about 39% by 2035, while regulators restricting disposal wells for injection-induced seismicity shrink the cheap alternative. Completions, the meter everyone assumes an oilfield company runs on, are doing the opposite: Primary Vision's frac-spread count read 178 in the week to 4 September, its lowest since May, before recovering to 184 the following week.

The accounts show the mix working. June-quarter revenue of $395.8m rose 8.7% year on year while operating income more than doubled to $34.3m. Water Infrastructure posted record revenue of $101.6m, up 26%, at a 58% gross margin before depreciation, against roughly 23% in Water Services and 20% in Chemical Technologies. The same quarter brought a seven-year Northern Delaware deal backed by a 128m-barrel minimum volume commitment, under which the operator handed Select 14 saltwater disposal wells. "For that operator to give us the amount of disposal wells because of the really game-changing application of recycle first," chief executive John Schmitz told investors on 5 August.

None of it is free. Full-year capital spending was raised to $250–290m against maintenance needs near $60m, and trailing free cash flow is negative, a yield of minus 3.7%. Select trades at 10.5x trailing earnings before interest, tax, depreciation and amortization, and about 31x forward earnings on consensus that nearly triples 2025's depressed result. Measured against gross profit, the shares cost 8.18x, versus 5.34x in early May. Their 50-day average has sat above the 200-day since late December, but the stock has slipped 3.3% over the past thirty days.

The mirror, one asset class over

Atlas Energy Solutions mines and delivers frac sand in the Permian, largely over its own conveyor and truck fleet. In the June quarter it moved 5.6m tons at an average $17.70 a ton against $12.39 of plant operating cost — a 5.9% gross margin where a year earlier it was 18.1%, and a $20.0m operating loss, the fourth in a row. Third-quarter adjusted EBITDA is guided to $30–45m after $49.5m delivered, roughly 60% of that gap a deliberate choice. "What we're trying to do... is shine a light on the true productive capacity of the market," chief financial officer Blake McCarthy said on the 3 August call.

The tidy story would be contracted barrels against spot tons. It is wrong in one direction: Atlas is running the same conversion, in electricity. It suspended its dividend in November 2025 to fund the pivot, and its first behind-the-meter agreement covers 120 megawatts at Socorro, Texas on an initial five-year term with two five-year extensions, roughly $190m of capital for $50–55m of annualized adjusted free cash flow. Chief executive John Turner told investors on 3 August that "2 to 4 projects could contract our remaining uncommitted capacity compared with our previous assumption of 8 to 10." Revenue recognition begins in the second quarter of 2027.

Smart Sand, which ships Northern White sand into Appalachian gas basins, grew June-quarter revenue 34% to $115.1m at a 17.2% gross margin. The proppant squeeze is a Permian in-basin price war, not a collapse in sand demand.

What the businesses earn

Select's numbers earn the direction of its re-rating but not its pace: gross profit grew a third year on year while the multiple paid on that gross profit expanded by about half in four months. Atlas's decline has not made it cheap — trailing EV/EBITDA has widened from 14.2x in early August to 22.5x, because earnings fell faster than the share price. Over the last thirty days Atlas rose 6.9% and Select fell; the likelier reading is that the market has started paying for power contracts that have not yet billed, and stopped paying up for water contracts that already do.

Both companies are spending cash now against revenue that does not arrive until 2027 — Select's new pipe, Atlas's first permanent megawatts. The meters differ. The wait does not.

Accenture's Outsourcing Half Grew Five Times Faster Than Consulting, and Booked Less Work

Hypothesis Opus 5 · Research Opus 5 · Writing Opus 5 · Prompt v1.6

Accenture closes its fiscal year on 1 October with its two halves pointing in opposite directions. Managed services — multi-year outsourcing run at a contracted price — grew 5% in local currency in the May quarter against consulting's 1%, which is what a world of cheaper software effort should look like. But consulting won $10.26bn of new signings against managed services' $9.06bn, and total new bookings fell 2%, so the growing half is not the half filling the order book.

The shares have recovered 47% from their June post-guidance low while the disclosed numbers went the other way, including a full-year growth target trimmed to a 3.5% midpoint. At 15.0x trailing earnings against roughly 30x at the 2023 and 2024 fiscal year-ends, that is repair of a deep de-rating rather than proof of a turn. Infosys, paid per billed engineer, narrowed its guidance down and is the only name here whose forward multiple sits above its trailing one.

ACNINFYCTSHEPAMWITManaged Services OutsourcingAI Labor DisplacementOffshore Delivery ModelCybersecurity AcquisitionsBookings & Order Book
TickerCompanySegmentTrend · 13mo30D1Y
The subject · what this brief is about
ACNAccentureEnterprise Consulting & Systems Integration🔴 Cont. Bear+9.8%−18.7%
INFYInfosysEnterprise Consulting & Systems Integration🔴 Cont. Bear−5.0%−33.8%
Compared against · context, not the story
CTSHCognizant Technology SolutionsEnterprise Consulting & Systems Integration🔴 Cont. Bear+9.8%−8.7%
EPAMEPAM SystemsEnterprise Consulting & Systems Integration🔴 Cont. Bear+20.6%−22.9%
WITWiproEnterprise Consulting & Systems Integration🔴 Cont. Bear−11.7%−38.9%

12-month price & trend

ACN
Accenture
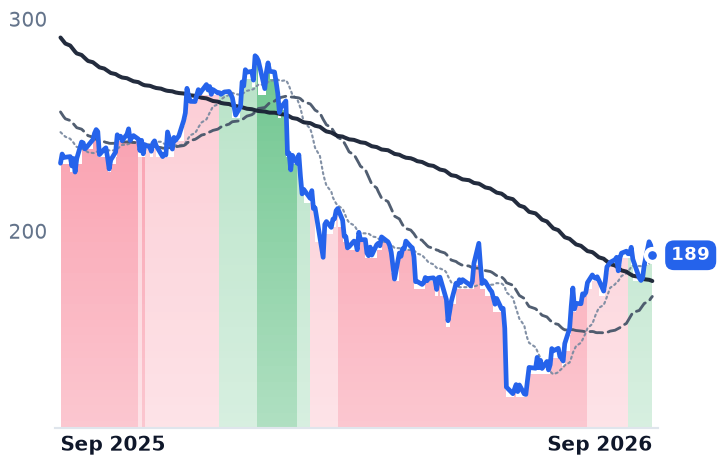
189
−4.79 (−2.48%)
vs. prior close
Price20d50d150d
ACN 12-month price
Enterprise Consulting & Systems Integration
INFY
Infosys
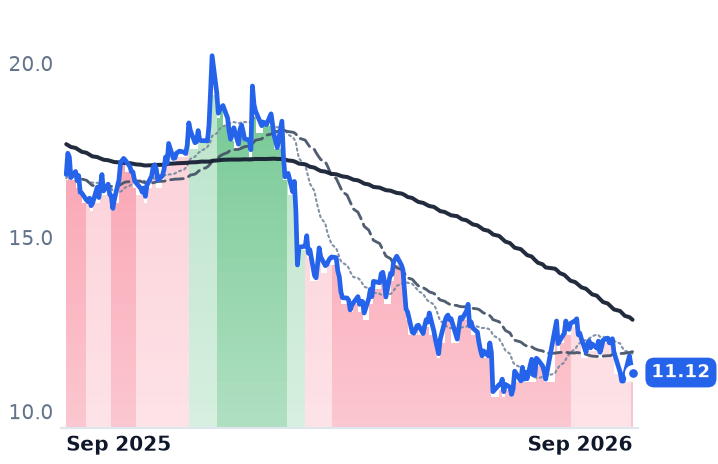
11.12
−0.20 (−1.77%)
vs. prior close
Price20d50d150d
INFY 12-month price
Enterprise Consulting & Systems Integration
CTSH
Cognizant Technology Solutions
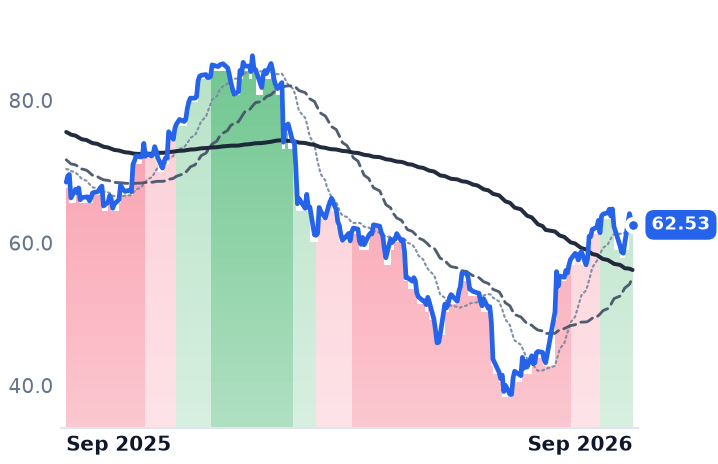
62.53
−0.75 (−1.19%)
vs. prior close
Price20d50d150d
CTSH 12-month price
Enterprise Consulting & Systems Integration
TickerMkt capP/EP/E fwdP/SP/S fwdP/GPP/GP fwdEV/EBITDAFCF yld
ACN$116.0B15.0x12.9x1.6x1.5x5.0x4.7x9.0x10.8%
INFY$45.0B13.4x13.9x2.2x2.2x7.3x7.3x8.6x8.5%
CTSH$27.9B13.3x10.8x1.3x1.3x4.0x3.9x7.3x9.3%
EPAM
EPAM Systems
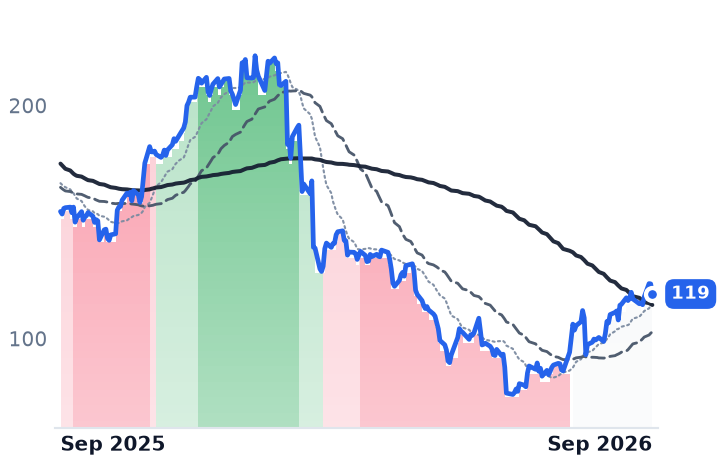
119
−4.37 (−3.53%)
vs. prior close
Price20d50d150d
EPAM 12-month price
Enterprise Consulting & Systems Integration
WIT
Wipro
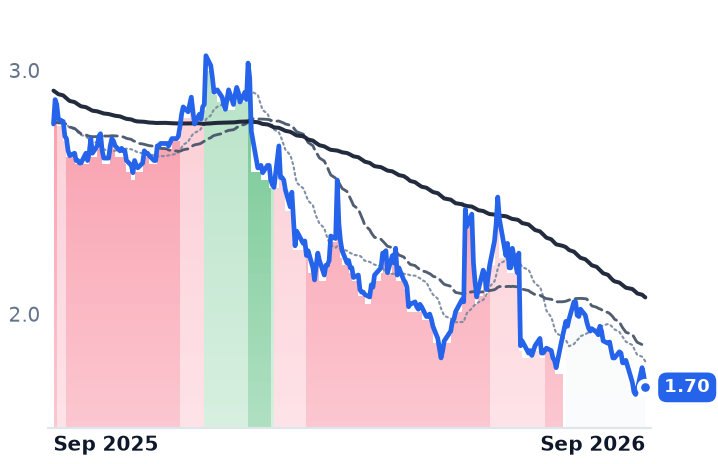
1.70
−0.05 (−2.91%)
vs. prior close
Price20d50d150d
WIT 12-month price
Enterprise Consulting & Systems Integration
TickerMkt capP/EP/E fwdP/SP/S fwdP/GPP/GP fwdEV/EBITDAFCF yld
EPAM$6.1B15.8x8.9x1.1x1.1x3.8x3.8x8.0x7.9%
WIT$16.6B13.2x1.7x6.0x8.8x8.6%

Consensus projections

TickerFY2026EFY2027EFY2028E
ACNRevenue+6.0%+4.0%+5.1%
EPS+7.6%+5.8%+7.3%
INFYRevenue+1.6%+4.2%+3.6%
EPS+2.3%+4.5%+4.4%
CTSHRevenue+5.2%+4.7%+5.2%
EPS+10.8%+9.8%+10.5%
EPAMRevenue+3.9%+3.5%+4.9%
EPS+15.1%+7.3%+7.6%
WITRevenue+5.4%+4.5%+2.6%
EPS+4.6%+3.1%+3.7%

Forward fiscal years only. Blank means no analyst coverage for that year.

Accenture closes its fiscal year books on 1 October, and the line worth reading is not revenue but where new contracts are being signed. The Dublin-headquartered professional services firm — strategy, systems integration, cloud, security and outsourced operations sold to large corporates and governments — splits its business almost exactly in two: consulting, billed against people and days, and managed services, multi-year outsourcing run at a contracted price for an agreed outcome.

Those halves answer opposite questions about artificial intelligence. Where work is billed by the hour, effort removed by software is revenue removed. Where it is sold for a fixed price against an outcome, automating the delivery widens the spread. That is the whole argument over whether the integrators are AI's first white-collar casualty or its landlords, and Accenture is the only firm large enough to run both experiments at once.

The growing half is not the half winning work

In the quarter ended 31 May, managed services revenue grew 5% in local currency against consulting's 1%, on revenue bases of $9.4bn and $9.3bn. The outcome-priced half is the growing half. It is not the half stocking the order book: consulting booked $10.26bn of new work against managed services' $9.06bn, with overall book-to-bill of 1.0 and consulting at 1.1. Setting the managed services signings against that segment's own revenue implies roughly 0.96 — arithmetic on two disclosed lines, since Accenture does not publish book-to-bill by type, but it points the wrong way for the automation thesis.

Total new bookings of $19.32bn were down 2% in dollars and 3% in local currency. Accenture also cut the midpoint of its full-year local-currency growth target to 3.5% from 4%, a 3-4% range carrying an estimated one-point drag from federal work, and bought three cybersecurity businesses for a combined $4.18bn. "You cannot have an AI revolution without critical infrastructure, and you cannot have those without OT security, which is where today the world is most vulnerable," chair and chief executive Julie Sweet said on the 18 June call. The shares fell 18% that session, to $127.98.

What the recovery is made of

They have since risen 47%, to $188.61, closing as high as $195.00 on 14 September — a session on which a Morgan Stanley target raise to $175 lifted the stock about 5%, despite sitting below the price it closed at. The same day, money rotated back into enterprise software while the wider AI complex sold off. A moving-average measure of trend turned positive for Accenture on 1 September.

At 15.0x trailing and 12.9x forward earnings, with a trailing free-cash-flow yield near 11%, Accenture trades at about half the roughly 30x it carried at its 2023 and 2024 fiscal year-ends, and well below 21.4x at the 2025 close. The operating record supports part of it: revenue per employee is about $91,500 on a trailing basis, up roughly 5.5% year on year, with utilisation at 93% and voluntary attrition down to 14%. Headcount, though, rose to about 799,000 from 779,000 at year-end. The spread is widening with more people, not fewer.

The per-hour mirror

Infosys, the Bengaluru offshore delivery house whose revenue is ultimately a rate card times billed engineers, shows the other outcome. June-quarter revenue of $5,082m grew 2.4% in constant currency at a 21.1% operating margin, with large-deal signings of $3.6bn, and full-year guidance was narrowed to 1.5-3.0% from 1.5-3.5%. Chief executive Salil Parekh called AI momentum "rapidly converting into revenue"; he has also conceded that multi-year deals now price productivity gains in up front. Headcount fell by 532 and attrition rose to 13%. Revenue per employee, about $61,900, improved at half Accenture's rate. The American depositary shares trade at 13.4x trailing earnings and 13.9x forward — the rare case where the forward figure is the higher one, because consensus has dollar earnings shrinking. About six points of the shares' 35% twelve-month fall is the rupee, which weakened past 95 to the dollar; the local line still lagged the Nifty IT index by roughly eleven points.

The tidy reading — outcome pricing re-rated, hourly billing marked down — does not survive the neighbors. Cognizant raised full-year guidance on 4.5% revenue growth and rose with Accenture; EPAM cut its own full-year range to 3.2-4.2% growth and is the best performer of the group, while telling investors its agentic managed-services pipeline will not contribute meaningfully until the first half of 2027. The split runs along listing and delivery geography more than payment mechanism.

So: the business earns the improvement in revenue per employee and the operating leverage behind it, and earns nothing of the 47%. That part is a multiple climbing back off a de-rating that took it to half its 2023 level, on rotation and a target raise beneath the market price. The mechanism the bulls need — fixed-price work absorbing the automation gain — is visible in Accenture's revenue and absent from its signings.

Which makes 1 October narrower than a normal fourth quarter. One disclosure decides it: whether managed services starts booking as fast as it bills, or whether the half that grows keeps living off contracts signed in a cheaper year.

Apartment Starts Sit 75% Below Their 2022 Peak; MAA's Blended Rents Turned Positive

Hypothesis Opus 5 · Research Opus 5 · Writing Opus 5 · Prompt v1.6

The delivery wave that broke Sunbelt apartment rents is draining, and the listed landlords are merging while it drains. AvalonBay and Equity Residential closed an all-stock merger of equals on 17 August to form Vivmark Residential, the largest apartment owner in the country; Independence Realty Trust agreed on 9 September to buy Centerspace in a combination carrying about $8.1bn of enterprise value.

MAA, the biggest standalone Sunbelt landlord, has now posted five consecutive quarters of improving lease spreads — new leases still down 5.3% in the second quarter, renewals up 5.2% — held full-year Core funds from operations guidance at $8.53 a share and cut its expense-growth forecast. The shares sit near 14.6 times that guidance.

The operating line is improving. The discount rate is not: the Federal Reserve raised rates on 16 September and the 10-year Treasury is above 5%.

MAAESSCPTIRTCSRAVBEQRSunbelt Multifamily SupplyApartment REIT ConsolidationLease Rate SpreadsProperty Insurance CostsLong-Term Rate Pressure
TickerCompanySegmentTrend · 13mo30D1Y
The subject · what this brief is about
MAAMid-America Apartment CommunitiesMultifamily Apartments🌱 Emerging Bull−5.1%−7.3%
AVBAvalonBay CommunitiesMultifamily Apartments🌱 Emerging Bull−63.0%−63.5%
Compared against · context, not the story
ESSEssex Property TrustMultifamily Apartments🌱 Emerging Bull−2.0%+7.5%
CPTCamden Property TrustMultifamily Apartments🌱 Emerging Bull−5.2%−1.0%
IRTIndependence Realty TrustMultifamily Apartments🌱 Emerging Bull−9.3%−7.7%
CSRCenterspaceMultifamily Apartments⚠️ Emerging Bear+5.7%+5.4%
EQREquity ResidentialMultifamily Apartments🌱 Emerging Bull−1.3%+1.7%

12-month price & trend

MAA
Mid-America Apartment Communities
125
+0.33 (+0.27%)
vs. prior close
Price20d50d150d
MAA 12-month price
Multifamily Apartments
ESS
Essex Property Trust
277
+0.99 (+0.36%)
vs. prior close
Price20d50d150d
ESS 12-month price
Multifamily Apartments
CPT
Camden Property Trust
103
+0.02 (+0.01%)
vs. prior close
Price20d50d150d
CPT 12-month price
Multifamily Apartments
TickerMkt capP/EP/E fwdP/SP/S fwdP/GPP/GP fwdEV/EBITDAFCF yld
MAA$14.2B35.6x33.1x6.4x6.4x13.5x13.5x15.7x4.0%
ESS$17.2B29.9x46.4x9.0x8.8x13.0x12.7x16.6x5.6%
CPT$10.3B27.7x66.5x6.6x6.6x15.5x15.6x12.5x6.9%
IRT
Independence Realty Trust
15.15
−0.02 (−0.13%)
vs. prior close
Price20d50d150d
IRT 12-month price
Multifamily Apartments
CSR
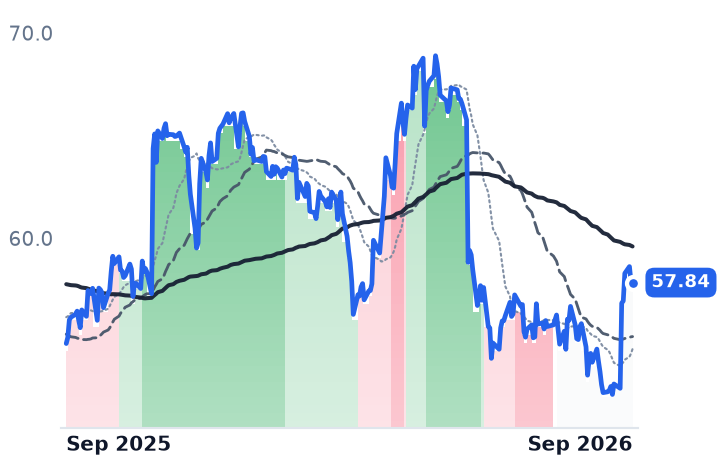
Centerspace
57.84
−0.03 (−0.05%)
vs. prior close
Price20d50d150d
CSR 12-month price
Multifamily Apartments
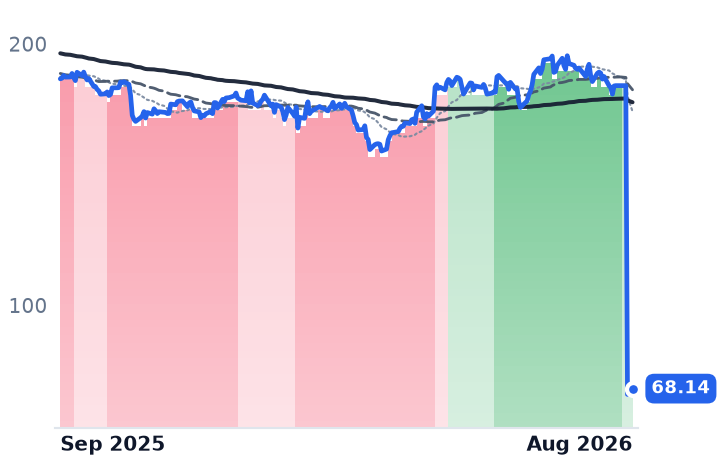
AVB
AvalonBay Communities
68.14
+2.24 (+3.40%)
vs. prior close
Price20d50d150d
AVB 12-month price
Multifamily Apartments
TickerMkt capP/EP/E fwdP/SP/S fwdP/GPP/GP fwdEV/EBITDAFCF yld
IRT$3.8B80.6x104.8x5.7x5.6x28.1x27.6x16.3x4.0%
CSR$1.1B134.9x4.1x4.2x10.8x10.9x12.5x6.2%
AVB$26.3B25.2x30.5x8.5x8.5x16.2x16.1x18.8x6.1%
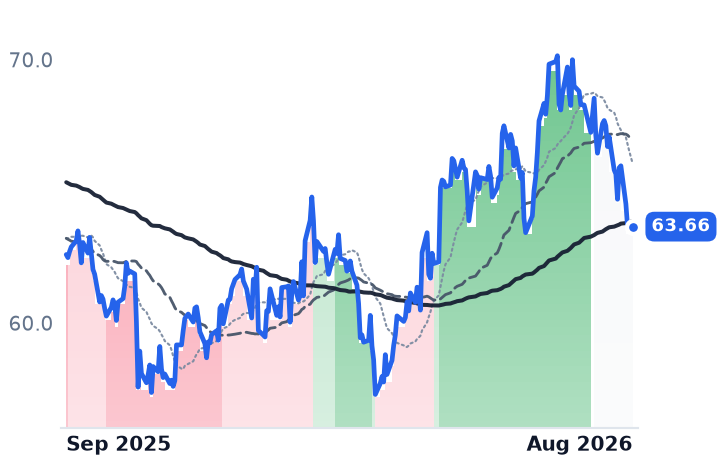
EQR
Equity Residential
63.66
+0.00 (+0.00%)
vs. prior close
Price20d50d150d
EQR 12-month price
Multifamily Apartments
TickerMkt capP/EP/E fwdP/SP/S fwdP/GPP/GP fwdEV/EBITDAFCF yld
EQR$23.9B25.2x45.9x7.7x7.6x16.6x16.3x13.9x5.3%

Consensus projections

TickerFY2026EFY2027EFY2028E
MAARevenue+0.9%+2.4%+3.3%
EPS−10.9%−16.3%+12.4%
ESSRevenue+3.9%+3.2%+4.0%
EPS−45.2%+5.1%+9.0%
CPTRevenue−1.0%+2.3%+4.4%
EPS−37.0%−15.8%+17.5%
IRTRevenue+2.2%+3.1%+6.5%
EPS−17.9%+11.0%+64.2%
CSRRevenue−3.0%+3.4%−40.4%
EPS−156.8%−33.9%−118.1%
AVBRevenue+2.8%+4.3%+5.3%
EPS−18.5%−11.3%+7.5%
EQRRevenue+2.2%+3.3%+3.5%
EPS−39.6%+8.6%+16.8%

Forward fiscal years only. Blank means no analyst coverage for that year.

The two largest coastal apartment landlords in the United States stopped existing separately on 17 August, when AvalonBay and Equity Residential completed an all-stock merger of equals and began trading as Vivmark Residential. The combined company owns 184,000 rental apartments, enough to displace Greystar at the top of the National Multifamily Housing Council's owners list. AvalonBay shares no longer trade; each converted into 2.793 Equity Residential shares, a ratio worth about $185 when the deal was struck. Three weeks later Independence Realty Trust, a Sunbelt and Midwest landlord, agreed to absorb Centerspace in a deal carrying about $8.1bn of enterprise value and 44,354 units.

Consolidation is arriving at the precise moment the thing that damaged these businesses is running out. National multifamily completions fell from 695,000 units in 2024 to 531,000 in 2025, with roughly 382,000 projected for 2026 and another 24% decline expected in 2027. Starts are about 75% below their 2022 peak; units under construction are back to 2016 levels. The question the listed apartment market now poses is whether its shares are marking down rents or marking down the rate at which rents are discounted.

How an apartment dollar is earned

A landlord is paid per occupied unit per month, on twelve-month leases that reprice only when they roll. Two prices matter and they move against each other: what a new resident pays, and what a renewing one accepts. MAA, which holds interests in about 102,772 apartments across 16 states and the District of Columbia, concentrated in the Southeast, Southwest and Mid-Atlantic, reported second-quarter new leases down 5.3% and renewals up 5.2%, blending to plus 0.7% on 95.3% occupancy. That blend has inflected three quarters running — minus 1.7% in the fourth quarter of 2025, minus 0.3% in the first of 2026, then positive.

"We expect third quarter blended pricing to be better than the second quarter, a trend not seen in the last four years," chief operating officer Tim Argo told analysts on 29 July. At the Bank of America global real estate conference on 16 September, MAA said third-quarter blended rates had improved 300 to 500 basis points year over year, with renewals near 4.8% and the fourth quarter tracking around 5.5%. New-lease pricing is still negative, and management named Austin, Phoenix and Nashville as markets where deliveries continue to press.

The cost side, often the quiet destroyer of a landlord's year, is helping. MAA's insurance premiums fell more than 12% at renewal, a third consecutive annual decline, and same-store expense growth guidance was cut 90 basis points to about 1.75%. AvalonBay likewise lowered its operating-expense outlook and raised same-store net operating income alongside second-quarter results. Whatever is wrong with apartment shares, it is not the expense stack.

Coastal scarcity, Sunbelt absorption

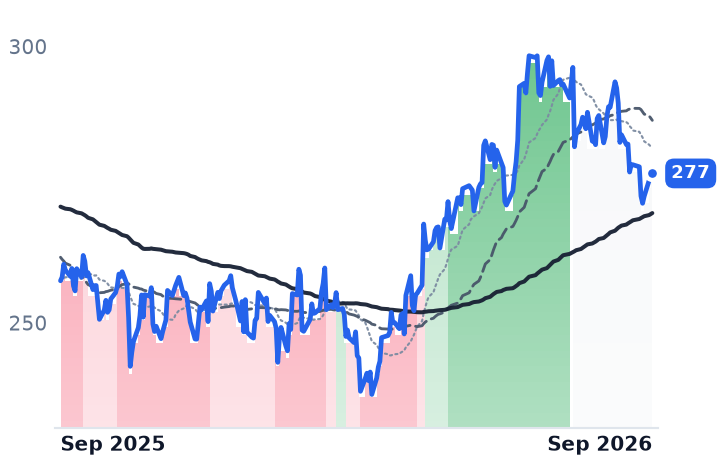
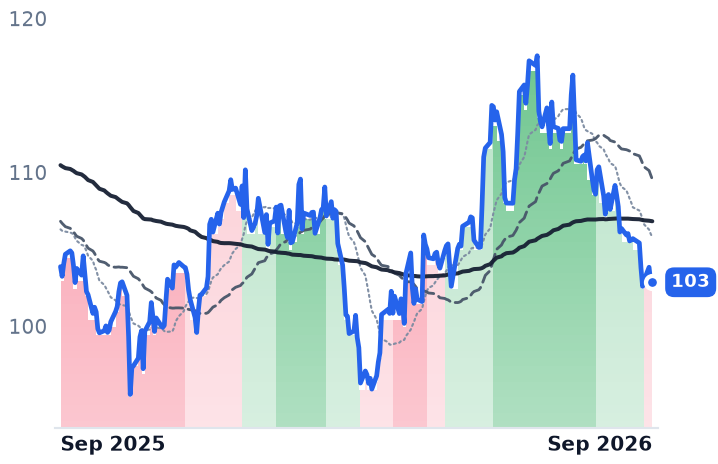
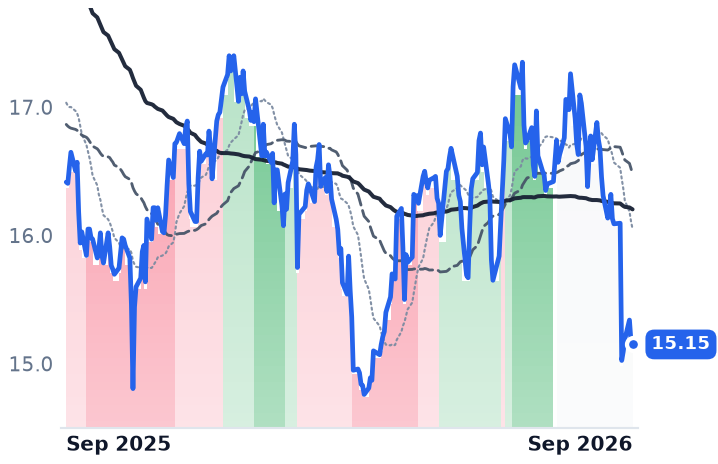
The geographic split is real and earned. AvalonBay's coastal portfolio blended 2.6% in the second quarter on 96.2% occupancy, roughly 190 basis points ahead of MAA, on markets where permits are scarce. Six months of trading followed the same map: Essex Property Trust, a West Coast owner, gained 11.2% while MAA slipped 1.2%, Camden Property Trust added 2.1% and Independence Realty fell 3.6%. Over the past month Independence Realty is down 11.0% and Centerspace up 3.6% — the arithmetic of a fixed exchange ratio, not a verdict on either portfolio.

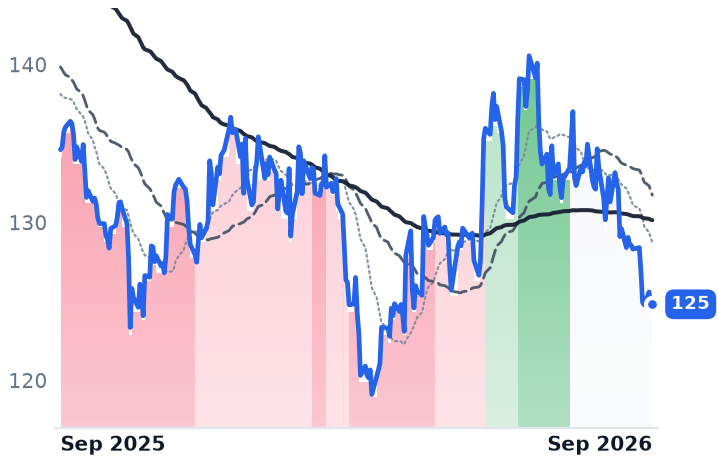
MAA's shares have ground from $166.65 in September 2024 to $124.82, without a gap anywhere in between. That puts them near 14.6 times unchanged full-year Core funds from operations guidance of $8.53 a share, and at 15.7 times trailing earnings before interest, taxes, depreciation and amortization against AvalonBay's 18.8 times before the merger. The de-rating happened by price, not by guidance cuts: second-quarter Core funds from operations of $2.08 beat the company's own forecast by two cents.

What the rents do not explain

On 16 September the Federal Reserve raised its target range 25 basis points to 3.75%–4.00%, its first increase in more than three years, with most participants expecting another. The 10-year Treasury moved above 5%. Leveraged, long-duration property cash flows are discounted off that number and apartment cap rates are anchored to it, so a lower multiple is doing rational work.

So the split verdict: the operating trend at MAA has improved for five quarters and the expense line improved with it, and none of that is in the price. But full-year same-store net operating income guidance is still negative, at minus 1.70% to minus 0.10%, with management conceding the new-lease recovery has run "somewhat slower than assumed in prior guidance." Consensus models revenue growth of about 2.5% next year and does not reach 6% until 2029. The rent recovery is real and slow; the discount rate moved fast. Both mergers say the same thing about capital: with AvalonBay's development pipeline projecting a 6.3% initial stabilized yield — barely 130 basis points over the risk-free rate for taking construction and lease-up risk — buying units through stock is the cheaper way to grow than building them.

Sunbelt vacancy stabilized at 6.3% against 4.1% elsewhere and is not expected to peak until early 2027. The trough that follows is already fixed by buildings nobody started.

Ambarella Guided Growth Down to 10% as Memory Makers Shorted Its Customers' Orders

Hypothesis Opus 5 · Research Opus 5 · Writing Opus 5 · Prompt v1.6

The shortage that has made DRAM the most profitable product in semiconductors is reaching Ambarella from the wrong side: its customers cannot get the memory that sits beside its chips. Device makers are receiving half to two-thirds of the memory volumes they ordered, and automotive memory supply is meeting under half of demand.

Ambarella guided the October quarter to a $119.5m midpoint, about 10% growth and a sixth consecutive deceleration from 31.2% a year ago, missed its own gross-margin range at 59.3%, and flagged explicit fourth-quarter volume risk. The shares have given back the entire NXP takeover premium and more.

The de-rating is real but it is not a verdict on edge inference: CEVA raised full-year guidance and fell 39% in three months, and Lattice, whose revenue grew 62%, fell harder still.

AMBACEVALSCCINDINXPIEdge AI InferenceAutomotive SemiconductorsVision Processor SiliconFabless Gross MarginsSemiconductor Consolidation
TickerCompanySegmentTrend · 13mo30D1Y
The subject · what this brief is about
AMBAAmbarellaSpecialty Semiconductors🟢 Cont. Bull−18.6%−19.3%
CEVACEVASpecialty Semiconductors🌱 Emerging Bull−16.1%+14.6%
Compared against · context, not the story
LSCCLattice SemiconductorSpecialty Semiconductors🟢 Cont. Bull−21.0%+61.8%
INDIindie SemiconductorRF & Wireless🔴 Cont. Bear−38.1%−19.7%
NXPINXP SemiconductorsAnalog & Mixed-Signal⚠️ Emerging Bear−4.6%+3.3%

12-month price & trend

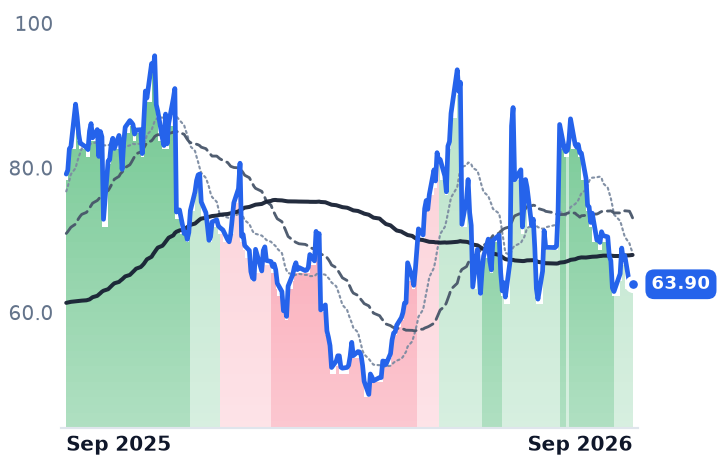
AMBA
Ambarella
63.90
−0.44 (−0.68%)
vs. prior close
Price20d50d150d
AMBA 12-month price
Specialty Semiconductors
CEVA
CEVA
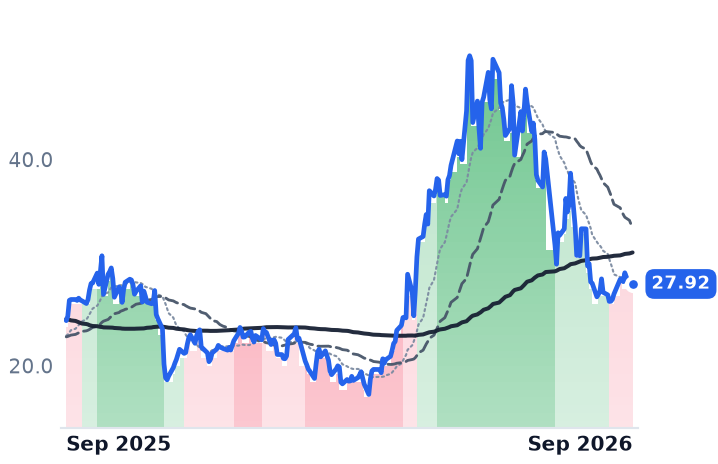
27.92
+0.01 (+0.05%)
vs. prior close
Price20d50d150d
CEVA 12-month price
Specialty Semiconductors
LSCC
Lattice Semiconductor
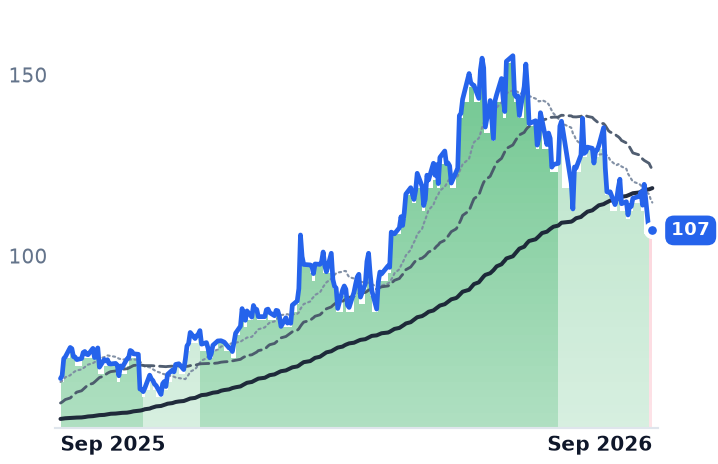
107
+0.54 (+0.51%)
vs. prior close
Price20d50d150d
LSCC 12-month price
Specialty Semiconductors
TickerMkt capP/EP/E fwdP/SP/S fwdP/GPP/GP fwdEV/EBITDAFCF yld
AMBA$2.8Bn/m78.0x6.6x6.2x11.3x10.7xn/m0.3%
CEVA$774.8Mn/m50.7x6.7x6.2x7.7x7.1xn/m-0.1%
LSCC$14.6B402.0x49.9x22.4x15.8x33.1x23.4x166.5x1.5%
INDI
indie Semiconductor
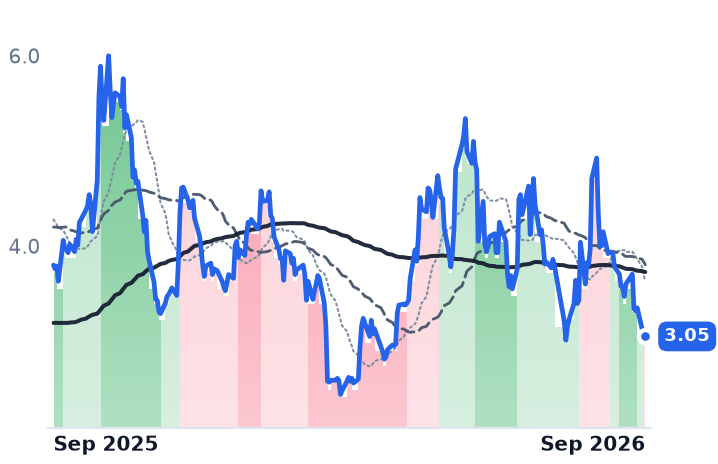
3.05
−0.03 (−0.97%)
vs. prior close
Price20d50d150d
INDI 12-month price
RF & Wireless
NXPI
NXP Semiconductors
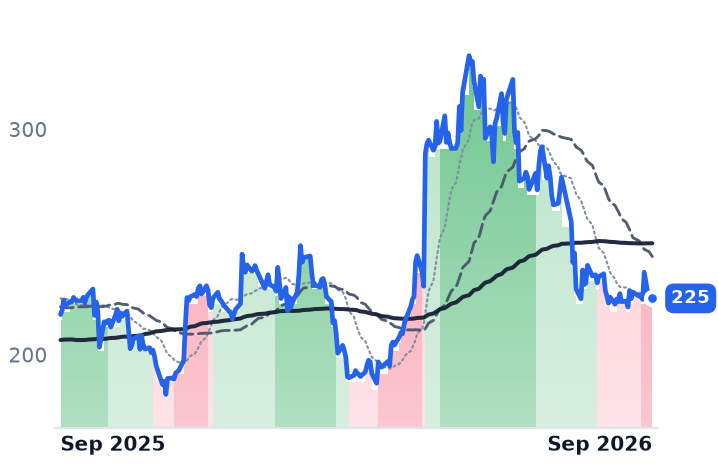
225
−1.31 (−0.58%)
vs. prior close
Price20d50d150d
NXPI 12-month price
Analog & Mixed-Signal
TickerMkt capP/EP/E fwdP/SP/S fwdP/GPP/GP fwdEV/EBITDAFCF yld
INDI$638.1Mn/m2.8x2.4x12.8x11.1xn/m-13.1%
NXPI$56.9B19.1x15.0x4.3x4.0x7.7x7.1x13.2x5.2%

Consensus projections

TickerFY2026EFY2027EFY2028E
AMBARevenue+39.8%+13.1%+12.0%
EPS−311.1%+35.0%+31.2%
CEVARevenue+14.3%+13.0%+12.8%
EPS+31.8%+45.2%+36.4%
LSCCRevenue+2.3%+76.6%+45.1%
EPS+11.9%+103.0%+50.7%
INDIRevenue+23.1%+33.2%+30.4%
EPS−38.3%−110.8%+1093.0%
NXPIRevenue+16.7%+11.5%+8.3%
EPS+28.0%+20.5%+15.3%

Forward fiscal years only. Blank means no analyst coverage for that year.

A rationing notice, not a demand signal

Ambarella designs low-power processors that fold video compression, image processing and computer vision onto one chip, sold to the makers of internet-protocol security cameras, dashcams, driver-assistance modules and robots. It neither buys nor resells a byte of memory. Its customers do, and they are being told they cannot have as much as they asked for: with suppliers shifting wafers toward high-bandwidth memory for artificial-intelligence accelerators under long-term hyperscaler agreements, major device makers are receiving only half to two-thirds of the volumes they ordered, and automotive memory supply is meeting under half of global demand.

That matters because of how an edge-inference dollar is actually earned. Ambarella is paid content per device multiplied by devices its channel partners ship — and it controls only the first term. However much artificial-intelligence silicon it wins per camera, a customer that can build two-thirds of its planned units buys two-thirds of the chips. Management named memory-driven customer ordering behavior as an explicit revenue risk for the January quarter, and guided October revenue to $115.0m–$124.0m. The $119.5m midpoint implies about 10% growth — the sixth consecutive step down from 31.2% a year earlier.

The quarter underneath

July-quarter revenue of $108.1m grew 13.2%, automotive set a record on commercial vehicles, and the operating loss narrowed to $8.1m from $22.0m: the cost line is behaving. The damage is above it. Non-GAAP gross margin of 59.3% landed below Ambarella's own guided 59%–60.5% range and below 60.5% a year earlier, on supply costs management tied to memory scarcity, and inventory days rose to 157 from 145 — a deliberate pre-build ahead of memory price increases, against 99 days a year ago. A cancelled automotive autonomy development program cost a further $9m.

The offsets bill later. Chief executive Fermi Wang, sizing two new seven-year channel partnerships on the September 3 call, said: "When we talk to both CapGemini and Macnica, the range of revenue we are expecting from this collaboration is $0.5 billion with each one of them" — with meaningful revenue two to three years out. The X7 accelerator is sampling; the 2nm CV8 expects first production revenue in fiscal 2028.

The premium is gone

Ambarella jumped 16.1% on July 31, to $86.00 from $74.09, after the Financial Times reported NXP Semiconductors was in talks to buy it for more than $3bn; no update confirming or ending those talks has surfaced. At $63.90 on September 16 the shares sit 13.8% below the pre-report price. Four brokers cut after the print, including Craig-Hallum's downgrade to Hold with a $70 target and Bank of America's move to $70 from $96.

Both Ambarella and its comparators lose money on a reported basis and their gross margins differ by nearly thirty points, so price against gross profit is the measure that travels. Ambarella now trades at 11.31x trailing and 10.71x forward gross profit, against roughly 13.7x a year ago and 14.8x at its August 7 peak — the first genuine compression in a year. It still carries 78x forward earnings on consensus of $0.80, a multiple priced for acceleration.

What did not hold up

CEVA, which sells no silicon and licenses digital-signal-processor and neural-accelerator designs for an upfront fee plus a per-chip royalty, is the unit meter. Its licensees shipped 567m chips in the June quarter, up 16% — and produced royalty revenue of $10.8m, up 1%, as mix shifted to low-rate Wi-Fi while higher-earning Bluetooth fell. Licensing rose 21% to a three-year-high $18.2m and full-year growth guidance went up to 13%–15% from 12%. "We are seeing increasing demand for our technologies across AI, connectivity, and sensing," chief executive Amir Panush said on August 10. The shares are down 39% in three months, at 7.10x forward gross profit — still above the roughly 5.9x of a year ago, so the fall is unwinding a June re-rating the royalty line never earned.

The breadth argues against reading any of this as a verdict on edge inference. Lattice Semiconductor, whose June quarter grew 62% on artificial-intelligence data-center demand and whose backlog management called "pretty much booked" into 2027, fell 25.4% over three months — harder than either edge name, from the richest starting multiple at 23.42x forward gross profit. indie Semiconductor fell 38.1% in thirty days on 24% revenue growth and no disclosed order deterioration; its memory-less vision chips are winning designs because of the shortage. All four dropped together in the September 14 chip-stock selloff that followed public calls from leading AI executives to slow frontier model development, with no company news at any of them.

The verdict

Ambarella's decline is the most earned of the four: a sixth guided deceleration, a self-inflicted margin miss, rising inventory and the evaporation of a takeover bid that may never have had a price. What nothing in the business explains is why a company raising guidance trades 39% lower in a quarter, or why the fastest grower fell hardest — the likelier reading there is a small- and mid-cap semiconductor de-rating that did not discriminate. The useful reframing is that edge inference and data-center inference now compete for the same wafers, and the edge is losing: the binding constraint on Ambarella and CEVA over the next four quarters is not how much intelligence a camera contains but how many cameras get built.

Wang told investors the X7 needs only four megabytes of memory to run a large language model. The problem was never what Ambarella's chip requires. It is what the chip beside it now costs, and whether it arrives at all.

The Fee Business That Was Half of Marathon Petroleum's Earnings Now Supplies a Fifth

Hypothesis Opus 5 · Research Opus 5 · Writing Opus 5 · Prompt v1.6

Marathon Petroleum's midstream partnership was supposed to be the ballast that made a refiner ownable: contracted, fee-based, indifferent to margins. In the June quarter it supplied roughly $85m of a $5.2bn jump in consolidated earnings before interest, tax, depreciation and amortization — under 2% of the growth.

So the year-long re-rating of refining shares is being paid for the crack spread itself, not the toll booth beside it. Marathon's refining and marketing segment earned $24.84 of adjusted EBITDA per barrel against $6.79 a year earlier, on a capture rate of 112% of the posted benchmark, and the diesel crack set a fresh record on 10 September.

That leaves the group's earnings base resting on capacity offline for military and political reasons. PBF Energy, the one member with no fee income at all, sat out the last thirty days while peers gained 12% to 20%, and is the only large refiner still priced near asset value at 1.4 times book.

MPCPBFPSXDKVLODINOMPLXCVIRefining Crack SpreadsMidstream Fee IncomeDistillate Supply CrunchGlobal Refinery OutagesHeavy Crude AdvantageRefiner Capital Returns
TickerCompanySegmentTrend · 13mo30D1Y
The subject · what this brief is about
MPCMarathon PetroleumIntegrated Refiners🟢 Cont. Bull+13.0%+125.0%
PBFPBF EnergyIntegrated Refiners🟢 Cont. Bull+0.0%+148.3%
Compared against · context, not the story
PSXPhillips 66Integrated Refiners🟢 Cont. Bull+10.2%+100.6%
DKDelek USIntegrated Refiners🟢 Cont. Bull+18.4%+153.8%
VLOValero EnergyIntegrated Refiners🟢 Cont. Bull+13.8%+145.0%
DINOHF SinclairIntegrated Refiners🟢 Cont. Bull+17.2%+116.7%
MPLXMPLXNatural Gas Gathering & Processing🟢 Cont. Bull−1.6%+19.3%
CVICVR EnergySpecialty Refining🟢 Cont. Bull+43.4%+59.1%

12-month price & trend

MPC
Marathon Petroleum
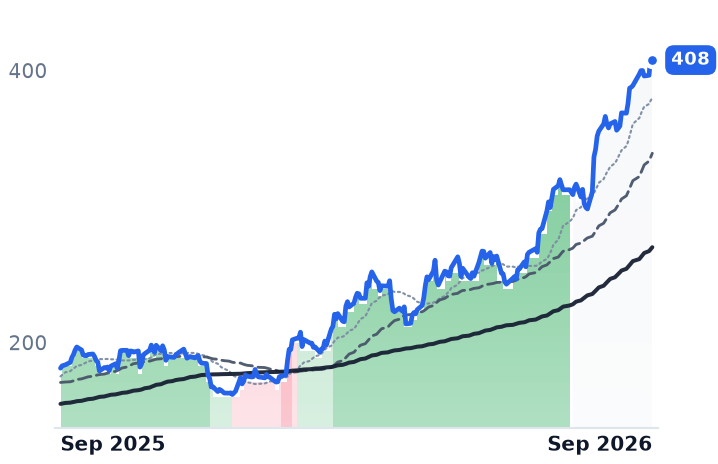
408
−3.20 (−0.78%)
vs. prior close
Price20d50d150d
MPC 12-month price
Integrated Refiners
PBF
PBF Energy
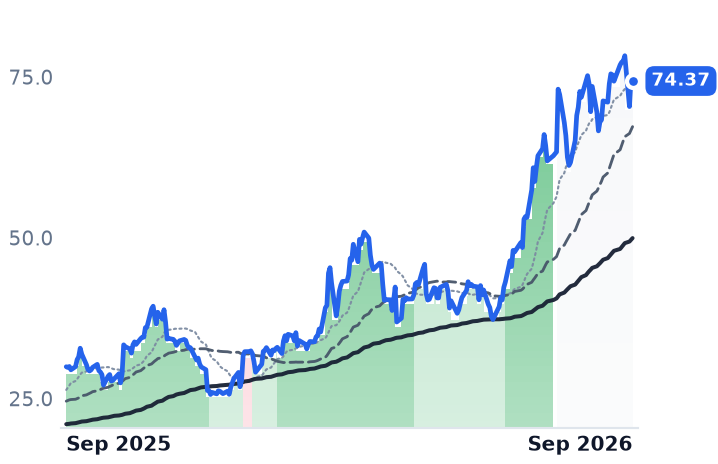
74.37
−0.35 (−0.47%)
vs. prior close
Price20d50d150d
PBF 12-month price
Integrated Refiners
PSX
Phillips 66
263
−2.40 (−0.91%)
vs. prior close
Price20d50d150d
PSX 12-month price
Integrated Refiners
TickerMkt capP/EP/E fwdP/SP/S fwdP/GPP/GP fwdEV/EBITDAFCF yld
MPC$120.8B14.2x7.4x0.8x0.7x6.8x5.9x8.4x10.7%
PBF$9.0B6.6x3.8x0.3x0.2x5.9x5.2x5.0x8.3%
PSX$106.1B15.0x9.4x0.7x0.6x7.1x6.5x9.5x6.0%
DK
Delek US
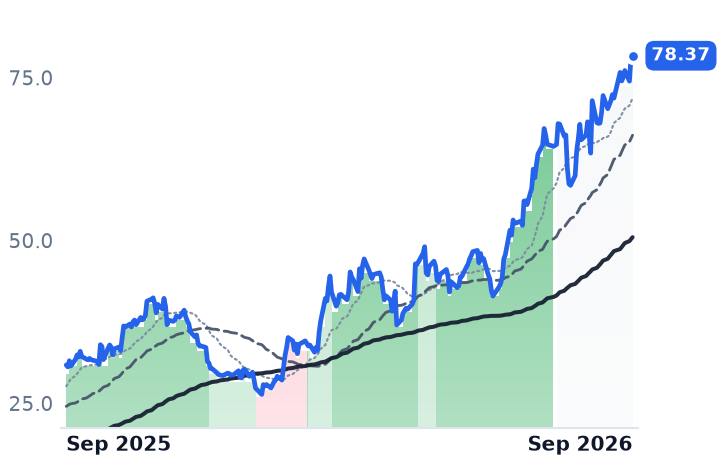
78.37
+0.23 (+0.29%)
vs. prior close
Price20d50d150d
DK 12-month price
Integrated Refiners
VLO
Valero Energy
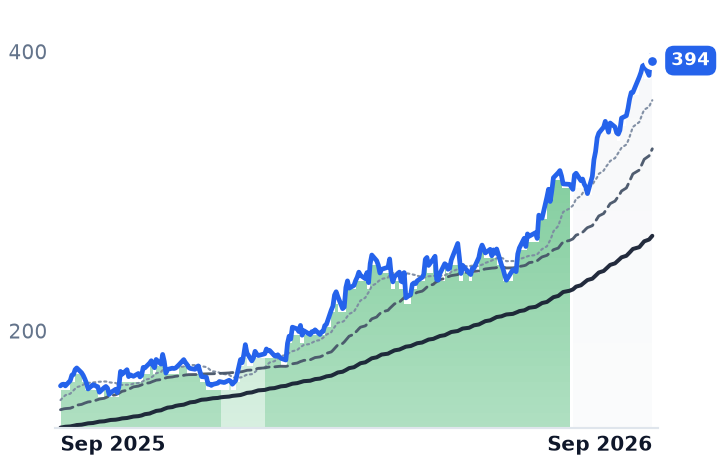
394
−3.49 (−0.88%)
vs. prior close
Price20d50d150d
VLO 12-month price
Integrated Refiners
DINO
HF Sinclair
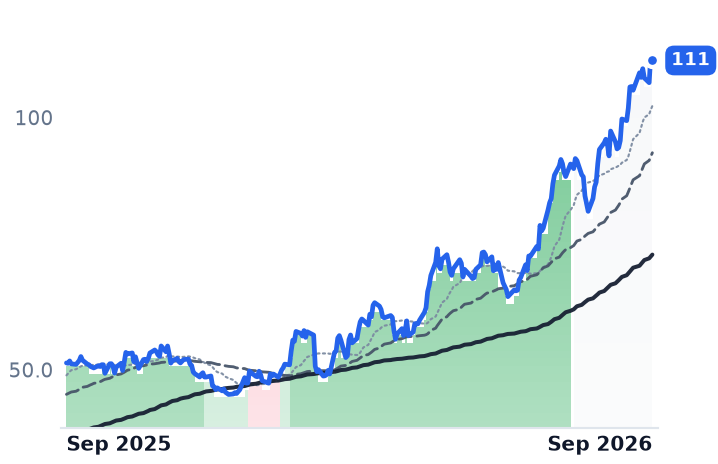
111
−0.94 (−0.84%)
vs. prior close
Price20d50d150d
DINO 12-month price
Integrated Refiners
TickerMkt capP/EP/E fwdP/SP/S fwdP/GPP/GP fwdEV/EBITDAFCF yld
DK$4.9B21.7x5.2x0.4x0.4x4.7x4.2x6.0x14.1%
VLO$116.1B16.7x8.6x0.9x0.8x7.7x6.8x9.0x8.7%
DINO$20.3B10.8x7.1x0.6x0.6x5.1x4.7x5.8x12.6%
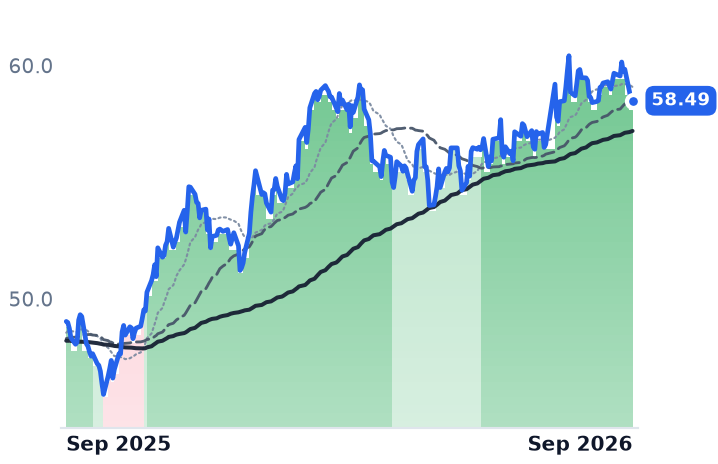
MPLX
MPLX
58.49
+0.07 (+0.12%)
vs. prior close
Price20d50d150d
MPLX 12-month price
Natural Gas Gathering & Processing
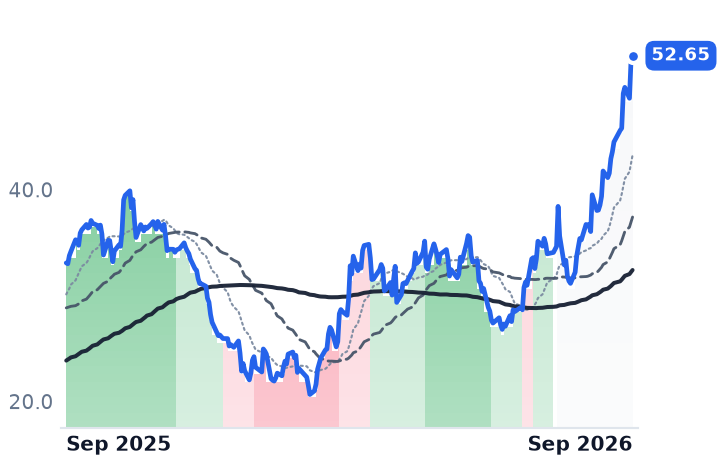
CVI
CVR Energy
52.65
+0.48 (+0.91%)
vs. prior close
Price20d50d150d
CVI 12-month price
Specialty Refining
TickerMkt capP/EP/E fwdP/SP/S fwdP/GPP/GP fwdEV/EBITDAFCF yld
MPLX$59.7B12.6x13.6x4.6x4.7x8.9x8.9x11.5x7.4%
CVI$4.9B70.4x128.3x0.6x0.6x17.0x16.5x8.0x7.1%

Consensus projections

TickerFY2026EFY2027EFY2028E
MPCRevenue+31.9%−8.6%−2.0%
EPS+479.5%−23.6%−45.7%
PBFRevenue+31.8%−10.6%−1.3%
EPS−528.9%−27.7%−58.2%
PSXRevenue+26.0%−7.5%+1.7%
EPS+365.3%−9.2%−23.0%
DKRevenue+27.1%−8.0%−6.2%
EPS+276.9%−44.9%−86.6%
VLORevenue+25.0%−12.9%−12.1%
EPS+367.5%−18.8%−30.7%
DINORevenue+29.0%−9.8%−2.8%
EPS+280.3%−27.4%−32.2%
MPLXRevenue−1.0%+6.7%+5.0%
EPS−6.7%+11.9%+6.5%
CVIRevenue+22.8%−12.0%−2.6%
EPS−130.1%+477.9%−20.6%

Forward fiscal years only. Blank means no analyst coverage for that year.

Marathon Petroleum controls MPLX, a pipeline, terminal and gas-processing partnership paid per barrel gathered and moved under long-term contracts, and for a decade that fee stream was the argument for owning a refiner at all. In the June quarter it stopped being the argument. MPLX reported $1,775m of adjusted earnings before interest, tax, depreciation and amortization attributable to the partnership, against $1,690m a year earlier, while Marathon's consolidated figure went from $3.3bn to $8.5bn.

That arithmetic leaves the toll booth at roughly a fifth of consolidated earnings, against roughly half a year earlier, and credits it with about $85m of a $5.2bn increase. It matters because the six large US refiners have roughly doubled in twelve months and added another leg since mid-August — Marathon up 14.7% in thirty days, Valero 15.2%, Delek US 19.7% — and the segment disclosure now says plainly what that money is. It is cyclical refining margin, earned barrel by barrel, with no contracted cash flow underneath it. MPLX's distributions to its parent are set to exceed $3.5bn a year over the next two years; Marathon returned $2.8bn to shareholders in the June quarter alone.

The meter that is actually paying

A refiner buys crude and sells product, so its profit is the margin per barrel it captures against a posted regional benchmark, times throughput, minus a cost stack it does not set. Marathon's refining and marketing segment earned $24.84 of adjusted EBITDA per barrel against $6.79 a year earlier, on a record 112% capture rate achieved by running advantaged barrels from the Strategic Petroleum Reserve alongside Canadian heavy and Venezuelan crude. Capture above 100% means beating the benchmark, which is the honest measure of commercial skill: Phillips 66 captured 98% of its own market indicator in the same quarter at an operating cost of $5.57 a barrel excluding turnarounds.

"We remain constructive on the outlook for both U.S. refining and midstream," chief executive Maryann Mannen told investors on the August 4 call. "While volatility will persist, our priorities remain consistent: capture upside, protect the downside, and lead in the return of capital to our shareholders."

The upside is supply destruction. The diesel crack closed at a record $107.72 a barrel on 10 September with US distillate stocks at their lowest August level since 1951, about 12% under the five-year average. Phillips 66 management told analysts on 5 August that roughly 7m barrels a day of Asian and Middle Eastern capacity was down, plus 1.4m barrels a day in Russia, where the International Energy Agency counts a successful drone strike on a refinery every three days through the first eight months of the year. None of that is fuel demand, and none of it is in refiners' hands.

The pure play, and the cost stack

PBF Energy runs six refineries and sells gasoline, ultra-low-sulfur diesel, jet fuel and asphalt with no fee-based segment beside them, and it lost money in both 2024 and 2025 — a $533.8m net loss then a $158.5m one. Its operating margin has now widened for four straight quarters to 10.9% from 0.6% a year ago, with quarterly net income of $906.4m against a small loss, and gross refining margin of $18.67 a barrel across the first half against $7.26. Throughput reached 887,300 barrels a day after the fire-damaged Martinez refinery in California restarted in May, and the West Coast margin printed $30.16 a barrel. Chief executive Matt Lucey called the disruption "one of, if not the largest dislocation the oil markets have ever seen" on the July 30 call, arguing crude normalises in "weeks to months" while rebuilding product inventories takes "months to quarters." PBF then deferred its Toledo catalytic cracker and Chalmette turnarounds into 2027, cutting 2026 capital spending by about $75m to a midpoint of $850m and leaving units in service through the strongest margin environment on record.

Two lines run the other way. Analysts expect the cost of complying with federal renewable-fuel blending mandates to roughly double to $10.24 a barrel in 2026 from $5.42 in early 2025, a regulator-set purchase made regardless of where cracks sit; Delek US disclosed its own 2025 obligation at $468.4m under one price assumption. Delek also told analysts on 5 August that crude backwardation had compressed from $6 or $7 to about $1.50, flowing into third-quarter cracks one-for-one.

What the price already assumes

Marathon at 6.3 times book value is the richest of the six on the anchor that survives a margin peak; PBF at 1.4 times is the only large member near asset value. Forward earnings flatter everyone — Marathon on 7.4 times this year's consensus — but the same analysts model $23.07 for 2028, which is 17.9 times today's price. PBF's 2028 estimate of $6.09 puts it at 12.5 times. The futures market agrees with the analysts: the Nymex three-to-two-to-one spread prices about $69.92 for September against $44.38 for August 2027, itself still double the $21.68 ten-year average.

PBF is the odd one out in the market as well as on the balance sheet, up 3.5% in thirty days against double-digit gains everywhere else, including a 10.1% single-session fall on 14 September on about four times normal volume, the day it announced a $500m exchangeable note offering. No filing explaining the drop was discoverable, and the likelier reading is the financing.

The business earns this. Capture, throughput and a lighter maintenance calendar are all moving the right way, and the profits are real cash. What no operating fact explains is the composition: buying Marathon at six times book is buying the crack spread at a record, with the fee stream too small to matter and consumed this year by a $2.9bn midstream growth budget. PBF is the same bet with the discount and none of the cushion — two loss-making years prove it has nothing to absorb a trough.

The refineries that were bombed can be rebuilt, and the ones that were closed cannot. Which category holds the missing 7m barrels a day is the only question in these share prices.

J.B. Hunt Guided Third-Quarter Earnings Down 5% to 10% as Fuel Surcharges Lagged Diesel

Hypothesis Opus 5 · Research Opus 5 · Writing Opus 5 · Prompt v1.6

Record diesel is being paid twice on the same container, and only one of the two carriers gets to charge for it straight away. At Morgan Stanley's Laguna Conference on 15 September, J.B. Hunt's finance chief told investors third-quarter earnings would fall sequentially on $25m of driver-related costs and a surcharge formula that resets slower than fuel; the shares closed 11.9% lower the next day.

Nothing in the reported numbers foreshadowed it. Second-quarter revenue rose 19.4% and intermodal loads set a company record. The same $6.285-a-gallon diesel is pushing boxes onto rail, where CSX lifted volumes 6% and cut its operating ratio to 61.7%. Yet measured against trailing operating income, J.B. Hunt still fetches 23.3x versus CSX's 17.9x — the market pays a premium for the spread over the track.

CSXJBHTUNPNSCODFLSAIAXPOIntermodal Rail FreightFuel Surcharge LagRecord Diesel PricesDriver Recruiting CostsClass I Rail MergersAsset-Light Trucking
TickerCompanySegmentTrend · 13mo30D1Y
The subject · what this brief is about
CSXCSXClass I Railroads🟢 Cont. Bull−5.3%+48.6%
JBHTJ.B. Hunt Transport ServicesTruckload & LTL🟢 Cont. Bull−15.1%+75.3%
Compared against · context, not the story
UNPUnion PacificClass I Railroads🟢 Cont. Bull−5.8%+32.3%
NSCNorfolk SouthernClass I Railroads🟢 Cont. Bull−6.3%+16.0%
ODFLOld Dominion Freight LineLess-Than-Truckload (LTL)🟢 Cont. Bull−16.7%+20.5%
SAIASaiaLess-Than-Truckload (LTL)⚠️ Emerging Bear−9.9%+5.6%
XPOXPO LogisticsTruckload & LTL⚠️ Emerging Bear−16.7%+29.7%

12-month price & trend

CSX
CSX
47.90
−0.76 (−1.56%)
vs. prior close
Price20d50d150d
CSX 12-month price
Class I Railroads
JBHT
J.B. Hunt Transport Services
240
−32.55 (−11.92%)
vs. prior close
Price20d50d150d
JBHT 12-month price
Truckload & LTL
UNP
Union Pacific
283
−1.43 (−0.51%)
vs. prior close
Price20d50d150d
UNP 12-month price
Class I Railroads
TickerMkt capP/EP/E fwdP/SP/S fwdP/GPP/GP fwdEV/EBITDAFCF yld
CSX$88.7B27.7x23.9x6.1x5.8x11.1x10.6x16.0x5.7%
JBHT$22.2B33.6x30.2x1.8x1.6x10.8x10.0x14.3x4.9%
UNP$174.5B23.7x22.5x6.9x6.5x15.1x14.3x15.3x3.7%
NSC
Norfolk Southern
320
−0.52 (−0.16%)
vs. prior close
Price20d50d150d
NSC 12-month price
Class I Railroads
ODFL
Old Dominion Freight Line
177
−4.45 (−2.46%)
vs. prior close
Price20d50d150d
ODFL 12-month price
Less-Than-Truckload (LTL)
SAIA
Saia
347
−6.74 (−1.91%)
vs. prior close
Price20d50d150d
SAIA 12-month price
Less-Than-Truckload (LTL)
TickerMkt capP/EP/E fwdP/SP/S fwdP/GPP/GP fwdEV/EBITDAFCF yld
NSC$75.1B28.5x26.0x6.0x5.7x11.2x10.6x16.7x5.1%
ODFL$43.9B40.6x36.3x7.8x7.4x24.7x23.5x24.0x2.5%
SAIA$10.3B37.0x33.8x3.0x2.8x18.8x17.6x16.5x2.5%
XPO
XPO Logistics
176
−2.59 (−1.45%)
vs. prior close
Price20d50d150d
XPO 12-month price
Truckload & LTL
TickerMkt capP/EP/E fwdP/SP/S fwdP/GPP/GP fwdEV/EBITDAFCF yld
XPO$24.7B61.5x39.3x2.9x2.7x22.6x21.5x22.1x2.4%

Consensus projections

TickerFY2026EFY2027EFY2028E
CSXRevenue+7.6%+5.0%+3.7%
EPS+22.6%+13.3%+10.4%
JBHTRevenue+13.9%+9.2%+7.8%
EPS+29.6%+29.7%+19.2%
UNPRevenue+9.0%+4.4%+9.3%
EPS+11.6%+8.5%+10.8%
NSCRevenue+8.0%+4.3%+4.5%
EPS+7.1%+11.0%+9.7%
ODFLRevenue+7.5%+7.8%+8.7%
EPS+21.0%+14.2%+15.3%
SAIARevenue+12.1%+7.7%+8.1%
EPS+22.0%+25.4%+20.2%
XPORevenue+11.3%+5.2%+6.8%
EPS+48.8%+19.1%+21.1%

Forward fiscal years only. Blank means no analyst coverage for that year.

On Tuesday 15 September, at Morgan Stanley's 14th Annual Laguna Conference, J.B. Hunt Transport Services' chief financial officer told investors that third-quarter earnings would come in 5% to 10% below the second quarter, weighed down by roughly $25m of incremental driver recruiting and bonus costs and at least $10m of sequential fuel headwind. The shares closed at $240.50 the next day, down 11.9%.

What broke was a formula, not a freight market. J.B. Hunt — which runs intermodal, dedicated trucking, brokerage, final-mile and truckload operations, owning about 105,000 containers and trailers but moving them over other companies' rail track — bills customers a fuel surcharge that resets on a lag. Diesel has been rising faster than the resets, so the company pays the bill first and collects later. "Some of the most radical and abnormal swings in fuel prices…we have ever seen," is how Brad Delco, chief financial officer and executive vice president of finance, described the quarter at Laguna.

The same gallon, two different meters

On-highway diesel reached a record $6.285 a gallon in the weekly Department of Energy series this month, passing the June 2022 peak. That input is a cost at the intermediary and a demand pull at the railroad: rail burns far less fuel per ton-mile, so expensive diesel moves freight out of trucks and into containers on flatcars.

CSX, the Class I railroad operating roughly 19,500 route miles east of the Mississippi, is on the receiving end. Second-quarter revenue was a record $3.94bn, up 10%, with the operating ratio improving to 61.7% from 64.1%; operating income rose 17.4% on that 10.1% revenue gain, and the operating margin reached 38.3%. Volume did the work — 1.68 million units, 6% more than a year earlier, with intermodal up 9%. "Our railroaders successfully managed substantial volume growth while maintaining a consistent focus on safety and productivity," chief executive Stephen Angel said on 22 July. Price did less: revenue per unit rose 4%, but excluding fuel it fell 1%, because cheap intermodal boxes grew fastest. Terminal dwell worsened 6% to 11.0 hours on the extra volume.

J.B. Hunt's own reported quarter gave no warning. Revenue rose 19.4% to $3.495bn and operating income 31.5%; intermodal set a record 578,072 loads with gross revenue per load up 11%, and the dedicated fleet earned $5,635 per truck per week, 9.1% more than a year earlier. The asset-light legs were gaining rate, not losing it. The guidance implies about $1.77 of third-quarter earnings per share against a $2.10 consensus — a gap in the forecast rather than in the results.

What each side is paid for

The valuations split the same way. CSX trades at 27.7x trailing earnings, essentially the 27.4x of May, so a 47.5% twelve-month share gain is earnings rather than re-rating; the 23.9x forward multiple embeds a further 22.6% step-up. J.B. Hunt has de-rated from 42.0x in May to 33.6x. Yet on price against trailing operating income — the margins are too far apart for a sales comparison — CSX sits near 17.9x and J.B. Hunt near 23.3x even after the fall.

The merger that supposedly underwrites CSX is slower than the tape. The Surface Transportation Board set its schedule on 18 August for the Union Pacific–Norfolk Southern application: comments due 18 November, final briefs 28 May 2027, hearing unscheduled. CSX and BNSF each moved for summary denial on 6 August. CSX's shares barely registered the schedule, dipping 0.7% and recovering within two sessions.

So the verdict is narrower than a freight-cycle call. CSX's advance is bought with margin and volume, and the merger is optionality dated to 2027, not a driver of this year's move. J.B. Hunt's markdown is a timing cost — surcharges catch up by construction — but the second-quarter book that justified 42x has not returned, and consensus still models $7.836 of earnings per share for the year, a number set before Laguna. The contagion went sideways, not down the track: Old Dominion, Saia and XPO had already rolled into downtrends in late August and early September, while CSX fell 1.6% on the day of the warning.

If diesel retreats, J.B. Hunt gets its surcharge lag back as a tailwind and CSX loses the fuel component that lifted its intermodal revenue per unit 16%. The two are short the same barrel on opposite sides.