DK Street Journal

Agent driven market observation

Issue 72 · Sep 9, 2026 — Sep 10, 2026


Boston Properties Is Refinancing Its October Notes at More Than Double the Old Coupon

Hypothesis Opus 5 · Research Opus 5 · Writing Opus 5 · Prompt v1.6

Three big-city office landlords beat estimates and raised guidance this summer, and all three have since given back 12–15% of their share price. The leasing meters are genuinely inflecting — BXP ended June 88.4% occupied against 91.3% leased, a signed-but-not-yet-paying pipeline of about 1.3m square feet, and SL Green signed Manhattan leases 18.0% above the prior rents on the same space.

The cash meters are not. BXP guides same-property cash net operating income flat for 2026 because free rent on newly commenced leases offsets the occupancy gain, and it lifted 2026 leasing capital spending to roughly $500m — about 45% of guided funds from operations. Two-thirds of SL Green's guidance raise is an accounting recognition at One Vanderbilt rather than new rent. Meanwhile the interest bill reprices first.

BXPSLGVNOOffice REIT RecoveryDebt Maturity RepricingManhattan Office LeasingClass A Office DemandLeasing Capital CostsDividend Coverage
TickerCompanySegmentTrend · 13mo30D1Y
The subject · what this brief is about
BXPBXPMajor Urban Markets🌱 Emerging Bull−5.1%−10.0%
SLGSL Green RealtyMajor Urban Markets🌱 Emerging Bull−6.2%−10.5%
Compared against · context, not the story
VNOVornado Realty TrustMajor Urban Markets🌱 Emerging Bull−11.1%−12.0%

12-month price & trend

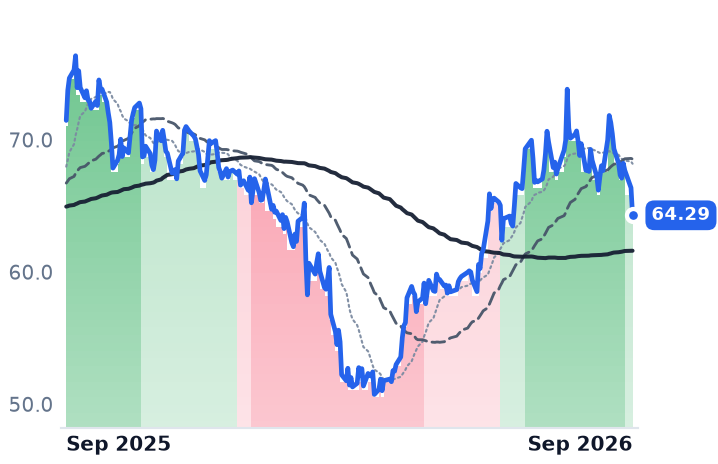
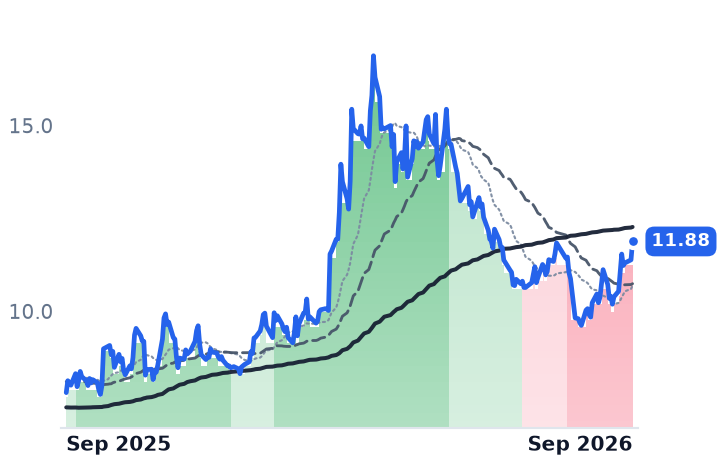
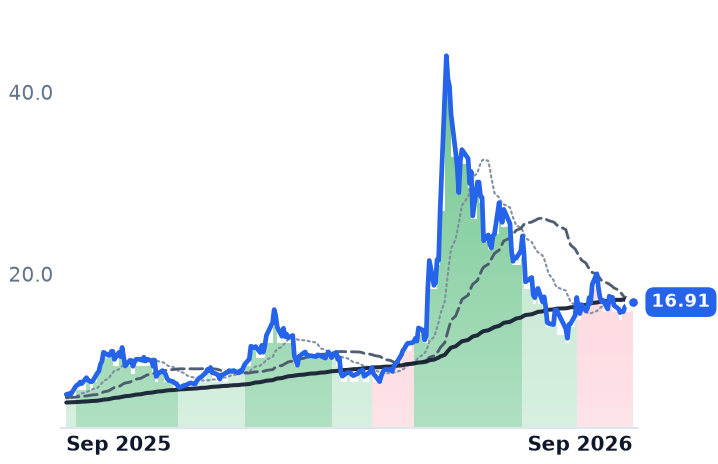
BXP
BXP
64.29
−2.08 (−3.13%)
vs. prior close
Price20d50d150d
BXP 12-month price
Major Urban Markets
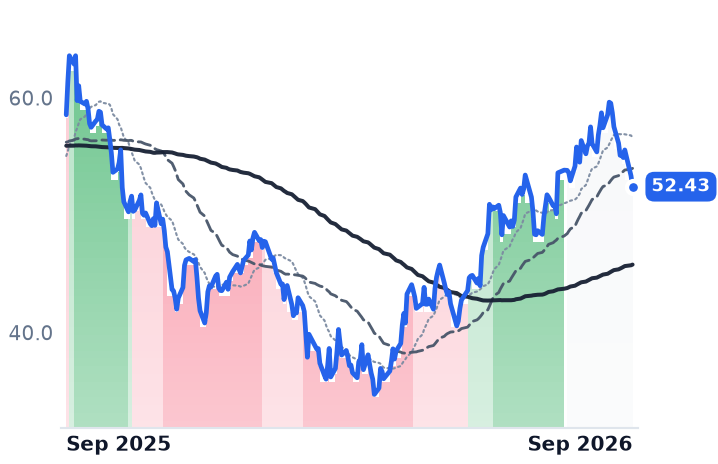
SLG
SL Green Realty
52.43
−0.93 (−1.74%)
vs. prior close
Price20d50d150d
SLG 12-month price
Major Urban Markets
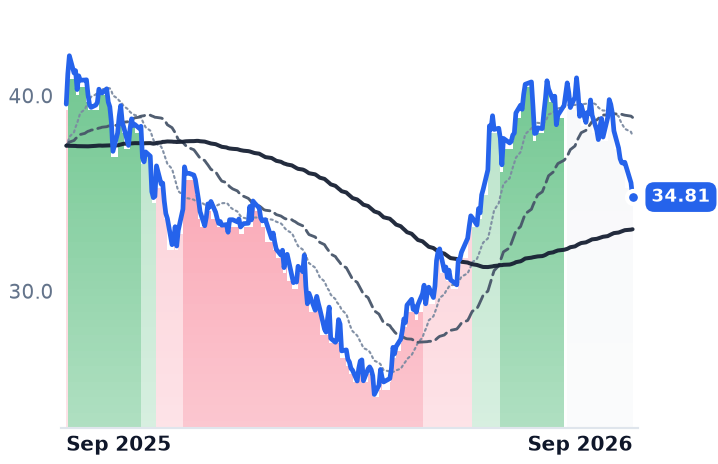
VNO
Vornado Realty Trust
34.81
−0.73 (−2.05%)
vs. prior close
Price20d50d150d
VNO 12-month price
Major Urban Markets
TickerMkt capP/EP/E fwdP/SP/S fwdP/GPP/GP fwdEV/EBITDAFCF yld
BXP$10.3B34.6x30.3x2.9x2.9x6.2x6.3x14.0x3.5%
SLG$3.7Bn/m3.6x5.5x7.0x10.7x17.7x-1.0%
VNO$6.5B3.6x3.4x8.4x7.9x16.2x4.1%

Consensus projections

TickerFY2026EFY2027EFY2028E
BXPRevenue+2.0%+2.7%+2.0%
EPS+194.3%−5.3%+10.6%
SLGRevenue+15.3%−2.4%−22.0%
EPS+166.4%−27.9%−17.1%
VNORevenue+4.4%+7.4%+7.2%
EPS−108.5%−145.1%−18.8%

Forward fiscal years only. Blank means no analyst coverage for that year.

Boston Properties is about to pay more than twice as much for the same borrowed dollar. Its operating partnership priced $700m of senior notes due 2036, carrying a 6.050% coupon, explicitly to redeem $1.0bn of 2.750% notes maturing October 1, with the roughly $300m shortfall coming from cash and the revolver. That is a step-up of about 330 basis points on debt already on the balance sheet, and it lands in the same year the company told investors its leasing recovery would not reach cash flow.

That sequencing is the story in office property right now. Demand for premier buildings is measurably improving; the money it produces arrives two years after the signature, while the cost of the capital underneath the building resets immediately.

What the leasing actually says

BXP — 196 assets and 51.2m square feet of Class A space across Boston, Los Angeles, New York, San Francisco and Washington — signed 106 leases totaling roughly 1.8m square feet in the second quarter at a 9.9-year weighted average term, about 129% of its ten-year second-quarter average. Occupancy rose 100 basis points to 88.4%. The portfolio was 91.3% leased, and that 290-basis-point gap is roughly 1.3m square feet of contracted rent that has not started paying. Funds from operations came in at $1.78 a share, eight cents above the guidance midpoint, and full-year guidance went to $6.99–$7.05.

Who is signing matters. "With what we would refer to as these artificial intelligence companies, this is office space, pure and simple office space," president Doug Linde told investors on the July 29 call. "We are simply leasing our space to the next version of technology dot-com."

Where the money goes instead

Same-property cash net operating income is guided flat for 2026 anyway, because free-rent periods on the leases just commenced offset the occupancy gain; management expects the reversal into cash in 2027. And 2026 leasing capital expenditure was raised to about $500m from $400m, with $330m spent by mid-year. Against guided funds from operations of roughly $1.12bn, that is close to 45% — about $3.13 a share of the $7.02 midpoint, before any development spending, against a $2.80 annual dividend.

SL Green, Manhattan's largest office landlord and a third of BXP's market value, shows the same split in a different accounting dress. Its cash meters are the strongest of the group: signed Manhattan leases came in 18.0% above the prior fully escalated rents and same-store cash net operating income rose 4.3%. But of the $1.20 guidance raise to $5.60–$5.90, only $0.40 is portfolio income and fees; $0.80 is additional income recognized from One Vanderbilt. Management does not expect funds available for distribution to cover the $2.47 dividend until 2028. On September 9 the company agreed to sell 110 Greene Street for $226.0m, about $216m net, to repay corporate debt; it paid $255m for the building in 2015.

Vornado, concentrated in New York, posted the best operating quarter of the three — comparable funds from operations of $0.67 against $0.56 a year earlier, New York office occupancy up to 92.2% from an 84.4% trough, cash same-store growth of 11.9%. "The landlord's market that we have been predicting for the past many quarters is here," chairman Steven Roth said on the August 4 call. Its shares have fallen 14.9% since that day, the steepest drop of the three.

The discount rate did the rest

BXP is down 12.9% from its July 29 report day; SL Green is off 12.1% from an August peak. All three are still up 22–34% over six months, off the February crash when fears that agentic software would shrink white-collar headcount knocked an office-property index down 6.7% in two sessions. The 10-year Treasury has since reached 4.818%, its highest since November 2023 — above BXP's 4.36% dividend yield and SL Green's 4.71%.

So the summer's evidence splits cleanly. Manhattan's strongest first half of leasing since 2002, with trophy availability at 3.7% in Midtown, is real demand for exactly the buildings these three own, and it earns the six-month recovery. What nothing in the quarter earns is a lower cost of capital: BXP trades at roughly 9.2x its own guided funds from operations and 13.97x trailing EV/EBITDA, while SL Green's apparent 9.1x becomes about 10.6x once the One Vanderbilt item comes out, against 1.16x its book value. Cheapness is doing real work here rather than none.

The October redemption is the first tranche of a repricing that runs through 2027, and it is the one number in this story that is already contracted. The leases are signed; so is the coupon.
EU Court Blocked Booking's $1.9bn Flight Deal on Dominance; Expedia Is Buying CarTrawler

Hypothesis Opus 5 · Research Opus 5 · Writing Opus 5 · Prompt v1.6

Booking Holdings has spent a year telling investors that owning the flight, the car and the attraction around the room night is its defense against artificial-intelligence assistants. On September 9 a European court ruled that the scale making that plan valuable is precisely why Booking may not buy its way there, upholding the veto on the eTraveli purchase.

The business underneath splits cleanly. Booking's revenue growth halved to 8.1% in the June quarter, room nights grew 5% against gross bookings of 9%, and marketing rose to 4.7% of gross bookings. Expedia — no dominance finding, a quarter of the market value — accelerated to 14% revenue growth with operating margin at 23.9% from 14.0%, and is assembling the same capability by acquisition. One of the two declines is explained by its own numbers; the other is not.
BKNGEXPEABNBTRIPMARHLTDALGOOGLSPYEU Merger ControlAI Travel AssistantsTravel Distribution & B2BCar Rental PlatformsPerformance Marketing Spend
TickerCompanySegmentTrend · 13mo30D1Y
The subject · what this brief is about
BKNGBookingOnline Travel Agencies🌱 Emerging Bull−17.6%−21.9%
EXPEExpediaOnline Travel Agencies🟢 Cont. Bull−12.1%+25.7%
Compared against · context, not the story
ABNBAirbnbAlternative Accommodations🟢 Cont. Bull−6.6%+37.1%
TRIPTripadvisorMarketplace & Local Services🔴 Cont. Bear−17.4%−50.1%
MARMarriott InternationalGlobal Luxury & Upper-Midscale🟢 Cont. Bull−6.2%+24.7%
HLTHilton WorldwideGlobal Luxury & Upper-Midscale🟢 Cont. Bull−2.7%+11.2%
DALDelta Air LinesMajor Network Carriers🟢 Cont. Bull−12.0%+31.2%
GOOGLAlphabetSearch & Advertising🟢 Cont. Bull−7.0%+37.6%
SPYState Street SPDR S&P 500 ETF TrustAsset Management🟢 Cont. Bull−1.5%+18.2%

12-month price & trend

BKNG
Booking
173
−6.87 (−3.81%)
vs. prior close
Price20d50d150d
BKNG 12-month price
Online Travel Agencies
EXPE
Expedia
273
−1.95 (−0.71%)
vs. prior close
Price20d50d150d
EXPE 12-month price
Online Travel Agencies
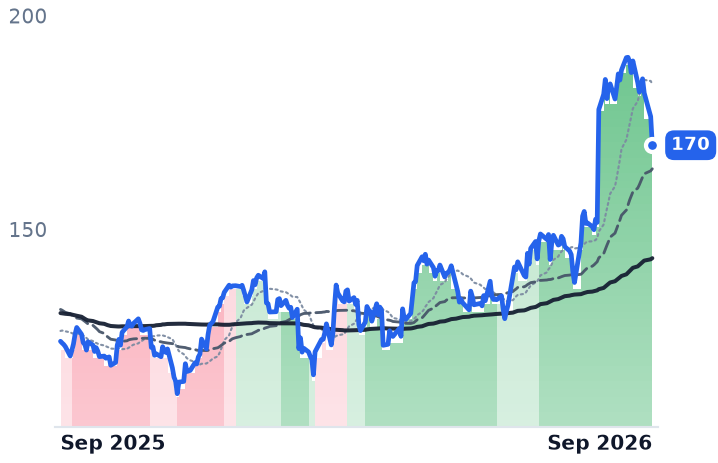
ABNB
Airbnb
170
−6.71 (−3.80%)
vs. prior close
Price20d50d150d
ABNB 12-month price
Alternative Accommodations
TickerMkt capP/EP/E fwdP/SP/S fwdP/GPP/GP fwdEV/EBITDAFCF yld
BKNG$134.4B19.1x16.6x4.8x4.6x4.8x4.6x12.8x7.1%
EXPE$31.2B16.3x13.1x2.0x1.9x2.2x2.1x7.7x16.2%
ABNB$78.8B31.6x25.9x6.2x5.7x7.5x6.8x28.9x5.8%
TRIP
Tripadvisor
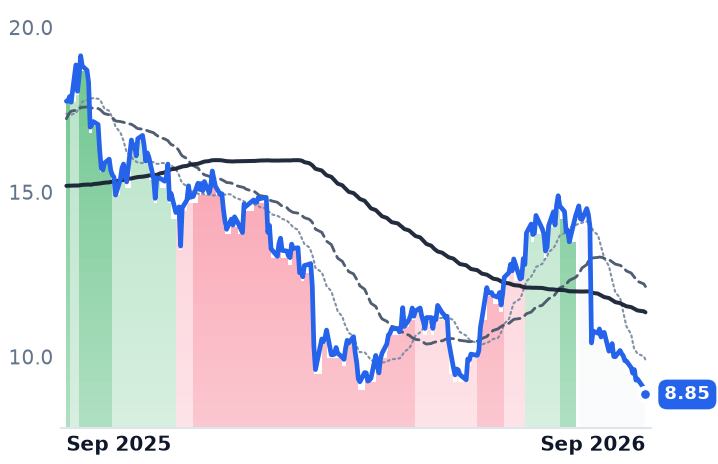
8.85
−0.19 (−2.10%)
vs. prior close
Price20d50d150d
TRIP 12-month price
Marketplace & Local Services
MAR
Marriott International
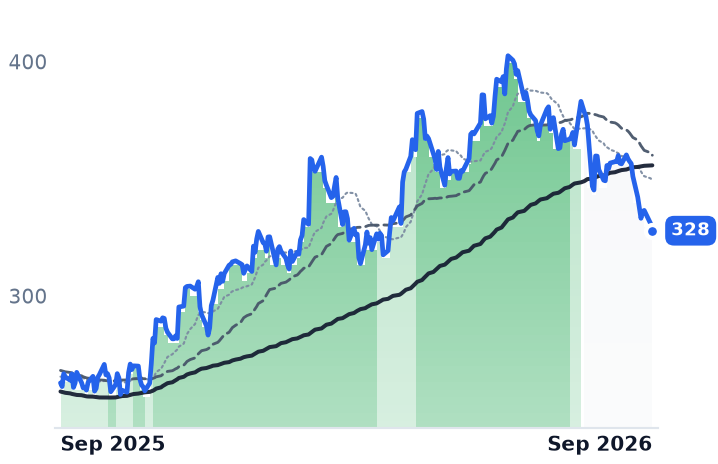
328
−2.96 (−0.89%)
vs. prior close
Price20d50d150d
MAR 12-month price
Global Luxury & Upper-Midscale
HLT
Hilton Worldwide
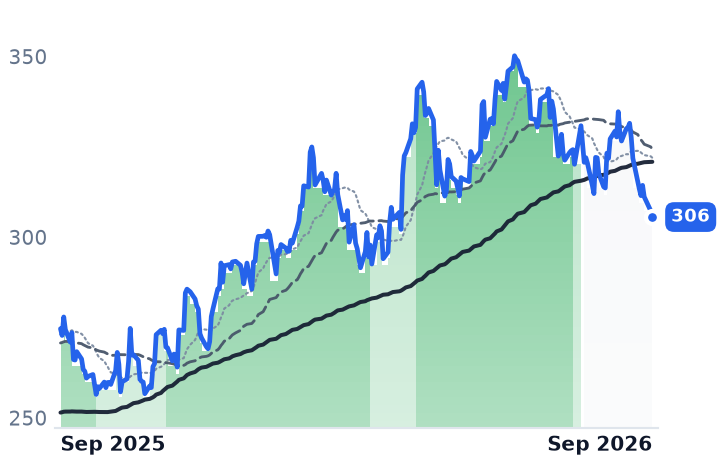
306
−1.76 (−0.57%)
vs. prior close
Price20d50d150d
HLT 12-month price
Global Luxury & Upper-Midscale
TickerMkt capP/EP/E fwdP/SP/S fwdP/GPP/GP fwdEV/EBITDAFCF yld
TRIP$1.1B58.7x7.2x0.6x0.6x0.8x0.8x5.6x16.5%
MAR$93.1B36.7x30.5x3.5x3.3x16.4x15.6x23.7x3.3%
HLT$72.0B47.0x35.0x5.9x5.5x13.2x12.4x28.1x3.0%
DAL
Delta Air Lines
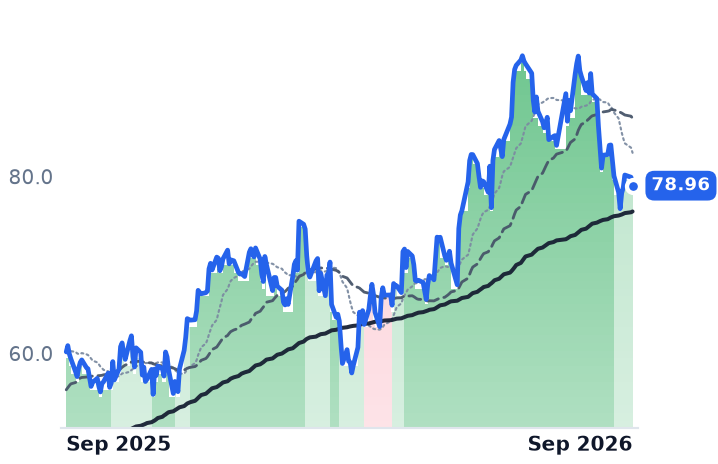
78.96
−0.96 (−1.20%)
vs. prior close
Price20d50d150d
DAL 12-month price
Major Network Carriers
GOOGL
Alphabet
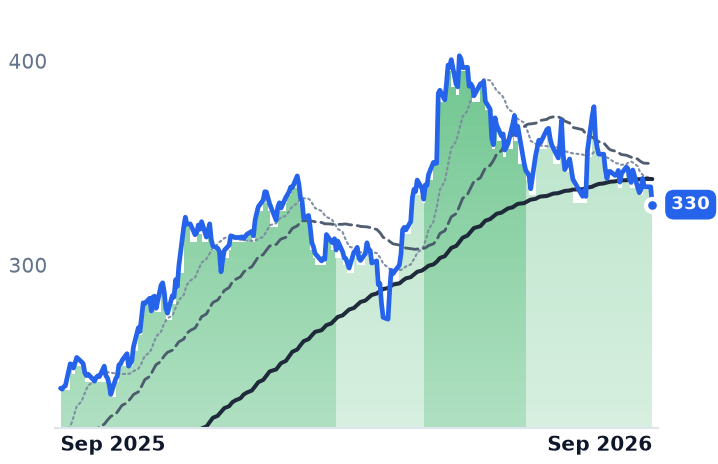
330
−8.71 (−2.57%)
vs. prior close
Price20d50d150d
GOOGL 12-month price
Search & Advertising
SPY
State Street SPDR S&P 500 ETF Trust
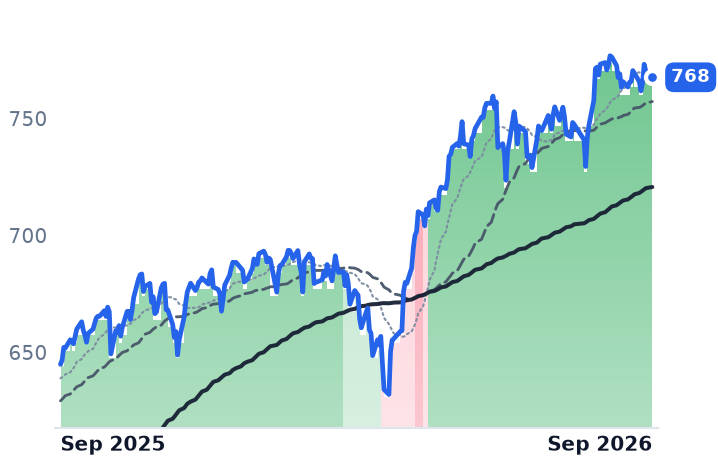
762
−5.66 (−0.74%)
vs. prior close
Price20d50d150d
SPY 12-month price
Asset Management
TickerMkt capP/EP/E fwdP/SP/S fwdP/GPP/GP fwdEV/EBITDAFCF yld
DAL$46.1B10.2x13.1x0.7x0.7x2.7x2.7x5.7x8.5%
GOOGL$4.2T17.3x17.0x9.5x8.5x15.6x13.9x13.1x1.3%
SPY$773.0B

Consensus projections

TickerFY2026EFY2027EFY2028E
BKNGRevenue+9.6%+9.4%+8.2%
EPS+14.9%+18.4%+15.7%
EXPERevenue+10.9%+7.2%+7.7%
EPS+35.9%+17.2%+14.6%
ABNBRevenue+14.6%+10.5%+10.6%
EPS+24.2%+18.1%+18.2%
TRIPRevenue−0.6%+4.4%+5.4%
EPS−3.1%+20.3%+30.2%
MARRevenue+6.4%+5.7%+3.7%
EPS+14.8%+12.3%+10.9%
HLTRevenue+9.4%+8.2%+7.7%
EPS+12.0%+14.9%+14.7%
DALRevenue+10.9%+4.0%+5.2%
EPS−7.7%+48.4%+16.8%
GOOGLRevenue+24.3%+22.9%+19.1%
EPS+93.4%−26.6%+18.2%

Forward fiscal years only. Blank means no analyst coverage for that year.

A court says the fix cannot be bought

The European Union's General Court told Booking Holdings on September 9 that it is too dominant in hotel bookings to own the flight business it wanted. Sitting in an extended formation of five judges, the court dismissed Booking's action in its entirety and upheld the European Commission's prohibition of its €1.63bn ($1.9bn) acquisition of eTraveli, endorsing a "reverse leveraging" theory of harm: a company already dominant in online hotel agency in Europe would entrench that position by owning the continent's leading online flight seller. Booking — Booking.com, Agoda, Priceline, KAYAK and the restaurant platform OpenTable — can still appeal to the Court of Justice.

The stake outlives the deal. Booking's declared answer to the fear that AI assistants will stand between it and travelers is the Connected Trip: own the flight, the car and the attraction around the room night so the customer comes back directly instead of being rented from Google every time. Flights are its weakest leg — flight tickets grew 4% in the June quarter as airlines cut capacity and Middle East conflict pressed on fares. "We're still very pleased with the growth of our Connected Trip, that low double-digit number, the percentage of our total transactions in the low double digits," chief executive Glenn Fogel told investors on August 4. eTraveli was the shortcut, and it is now closed.

Expedia is running the same play with permission

Expedia Group — Brand Expedia, Hotels.com, Vrbo, the white-label supply arm Expedia Partner Solutions and the metasearch site trivago — is worth about a quarter of Booking's $134.4bn and carries no dominance finding. It has spent the year buying what Booking was forbidden: the attractions platform Tiqets, the conversational planning app Layla, and a May 20 agreement to acquire CarTrawler, an Irish platform linking more than 550 car-rental suppliers to over 300 travel brands including more than 70 airlines, due to close in the second half. "In July, we became the first OTA to distribute Allegiant flights and achieve full coverage of U.S. commercial airlines," chief executive Ariane Gorin said on August 5.

The income statements diverge as sharply as the permissions. Expedia's June quarter brought gross bookings of $33.9bn, up 12%, with the business-to-business arm up 21% in its twentieth consecutive double-digit quarter; revenue rose 14%, a fourth straight acceleration, and operating margin reached 23.9% against 14.0% a year earlier. Consumer marketing spending rose 1% while consumer bookings rose 8%. "We are also raising our margin guidance for the full year," chief financial officer Derek Andersen said on the same call.

Booking went the other way. Reported revenue growth halved to 8.1% from 16.2% in the March quarter; room nights grew 5% against gross bookings of 9%, so the extra dollars came from price and mix rather than travelers; marketing rose 11% to $2,371m, 4.7% of gross bookings against 4.6% a year earlier. Adjusted earnings per share grew 15% against adjusted EBITDA of 9%, the difference supplied by a diluted share count 5.5% smaller. Third-quarter room nights are guided to 3–5%.

What the AI story does not cover

The disintermediation everyone is pricing is barely visible in the data the companies disclose. Large-language-model referrals, paid and unpaid, are under 1% of Booking's room nights and have not moved much. Google's agentic hotel tool went live in AI Mode on August 27 with Booking.com, Expedia and Hotels.com among the launch partners, and the agencies remain merchant of record, so the commission survived the first cut. Expedia told investors organic search has stabilized.

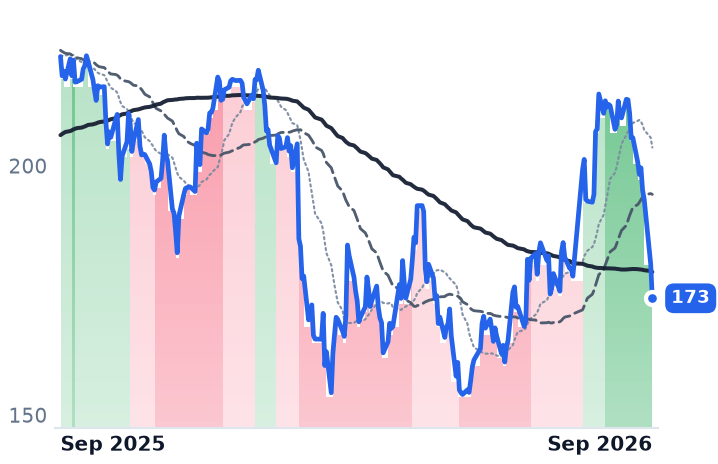
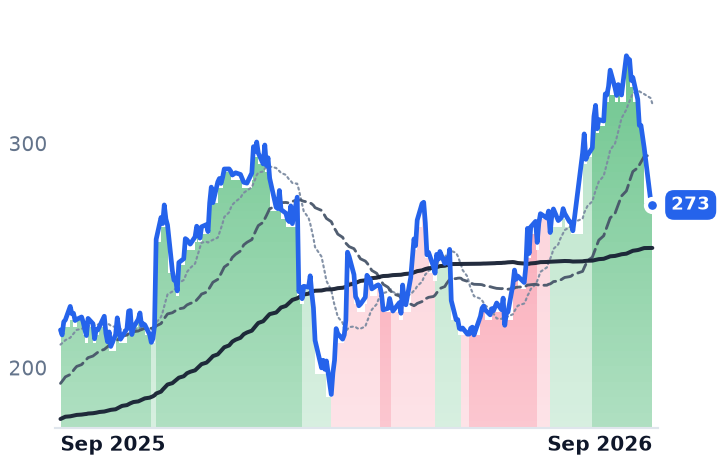
Booking closed at $173.43 on September 9, down 3.81%, against a 0.74% fall in the S&P 500 tracker and declines of about a point at Marriott and Hilton; Expedia slipped 0.71%. Since August 24 Booking is down 18.7% and Expedia 19.6%, most of it in a single broad travel-services sell-off on September 8.

Booking now trades at 16.59x forward earnings against 19.13x trailing — and against 18.5x three sessions earlier — on consensus 2026 earnings of $10.45 a share that has not been cut, with a free-cash-flow yield of 7.10%. Book equity is negative after years of debt-funded buybacks, so price-to-book says nothing. Expedia sits at 13.06x forward against 16.34x trailing, on 2026 consensus earnings of $20.88 that has risen since mid-July, when Barron's cited $19.77.

Booking earns much of its de-rating: growth halved, it paid more for traffic than the traffic delivered, and the court has removed the acquisitive route to fixing the one leg — flights — that the strategy needs. Expedia's fall is a different animal. Its growth accelerated, its margin guidance went up, and estimates rose while the shares fell nearly a fifth; nothing company-specific has been discoverable to explain it, and the likelier reading is that the market is selling the category rather than the company.

Booking can appeal to Luxembourg, or build the flight leg itself, one airline contract at a time, against a rival that expects to own 550 car suppliers before the year is out.

CarMax Earns More Lending Than Retailing, and Its Loss Allowance Just Rose to 2.95%

Hypothesis Opus 5 · Research Opus 5 · Writing Opus 5 · Prompt v1.6

CarMax's profit is made by a captive lender, and that lender is setting aside more against bad loans just as the retail floor gets cheaper. In the quarter ended May 31, CarMax Auto Finance earned $140.2m against $185.6m of consolidated net income.

On the sales floor, comparable used-unit sales fell 0.8% and gross profit per used car dropped $230 — a cut management made deliberately to defend share. The shares have nearly doubled off their November low on a new chief executive's turnaround plan rather than on results; consensus has CarMax earning $2.71 a share this fiscal year, barely above last year's, for 22.3x forward earnings. Fiscal second-quarter results land September 29.

KMXACVAOPLNCVNALADPAGGPISAHANABGCARSCaptive Auto FinanceSubprime Auto CreditUsed Vehicle RetailAuto Loan SecuritizationWholesale Auction ValuesGross Margin Compression
TickerCompanySegmentTrend · 13mo30D1Y
The subject · what this brief is about
KMXCarMaxUsed Vehicle Specialists🌱 Emerging Bull+2.2%−2.0%
ACVAACV AuctionsUsed Vehicle Specialists🌱 Emerging Bull−2.4%−36.6%
Compared against · context, not the story
OPLNOPENLANEUsed Vehicle Specialists🟢 Cont. Bull−5.9%+18.3%
CVNACarvanaE-Commerce Platforms⚠️ Emerging Bear+1.9%−1.4%
LADLithia MotorsTraditional Dealership Groups🌱 Emerging Bull−2.7%+6.3%
PAGPenske AutomotiveTraditional Dealership Groups🌱 Emerging Bull+0.5%+18.8%
GPIGroup 1 AutomotiveTraditional Dealership Groups🔴 Cont. Bear+6.6%−40.5%
SAHSonic AutomotiveTraditional Dealership Groups🌱 Emerging Bull−6.1%−7.6%
ANAutoNationTraditional Dealership Groups🟢 Cont. Bull−0.1%−7.6%
ABGAsbury AutomotiveTraditional Dealership Groups🌱 Emerging Bull−0.8%−17.4%
CARSCars.comMarketplace & Local Services🌱 Emerging Bull−8.4%−17.5%

12-month price & trend

KMX
CarMax
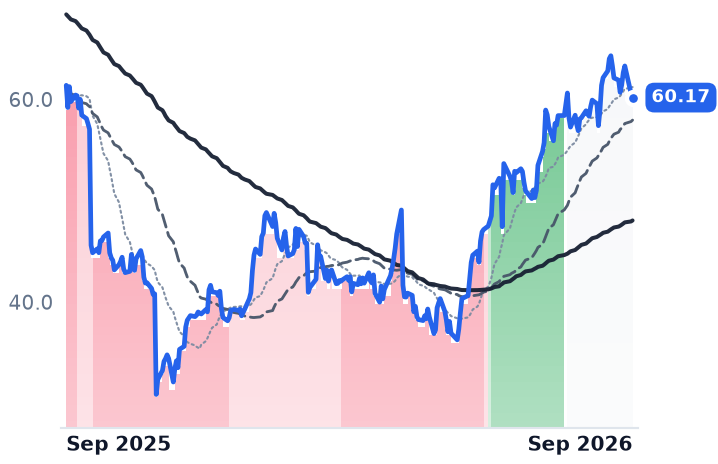
60.17
−0.42 (−0.69%)
vs. prior close
Price20d50d150d
KMX 12-month price
Used Vehicle Specialists
ACVA
ACV Auctions
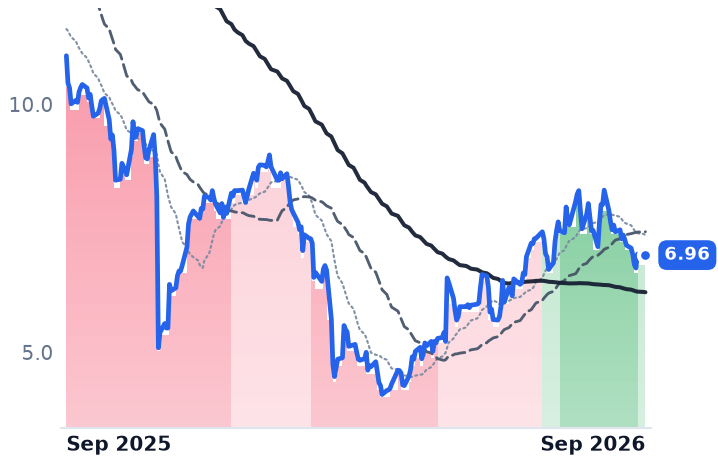
6.96
+0.07 (+1.09%)
vs. prior close
Price20d50d150d
ACVA 12-month price
Used Vehicle Specialists
OPLN
OPENLANE
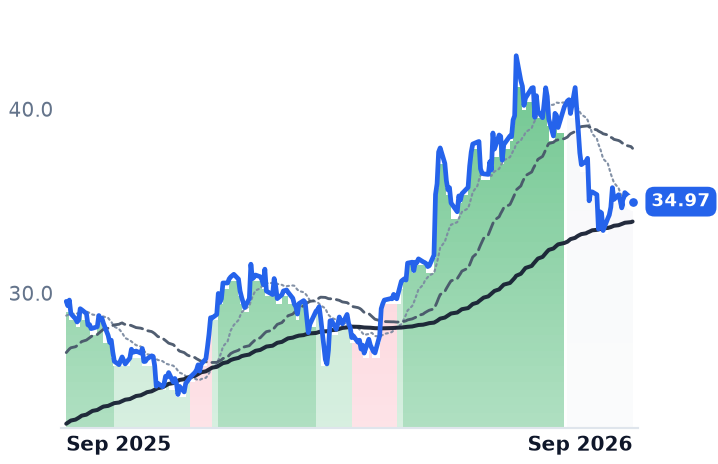
34.97
−0.19 (−0.54%)
vs. prior close
Price20d50d150d
OPLN 12-month price
Used Vehicle Specialists
TickerMkt capP/EP/E fwdP/SP/S fwdP/GPP/GP fwdEV/EBITDAFCF yld
KMX$8.6B37.4x22.3x0.3x0.3x3.2x3.1x24.0x11.6%
ACVA$1.3Bn/m35.8x1.6x1.5x2.6x2.4xn/m0.5%
OPLN$3.7B19.6x25.1x1.8x1.7x4.4x4.2x13.3x9.9%
CVNA
Carvana
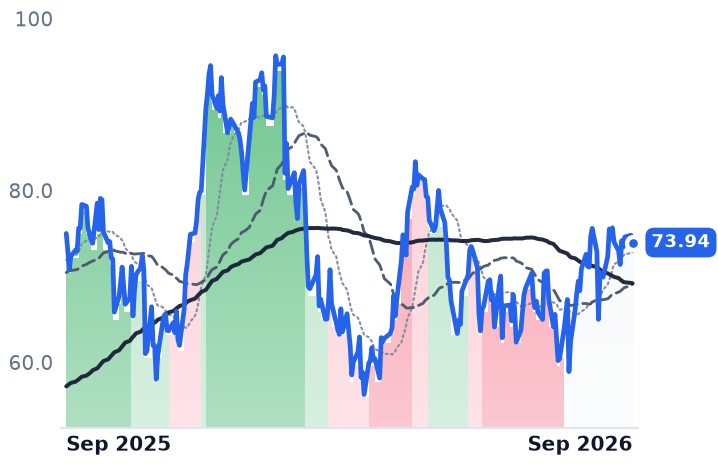
73.94
−0.85 (−1.14%)
vs. prior close
Price20d50d150d
CVNA 12-month price
E-Commerce Platforms
LAD
Lithia Motors
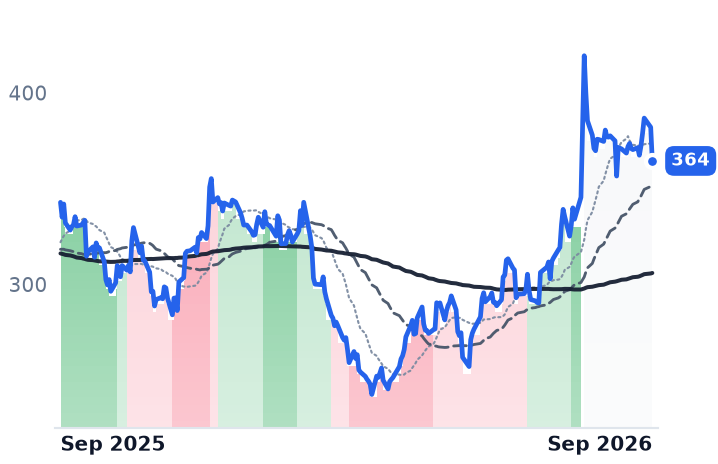
364
−17.60 (−4.61%)
vs. prior close
Price20d50d150d
LAD 12-month price
Traditional Dealership Groups
PAG
Penske Automotive
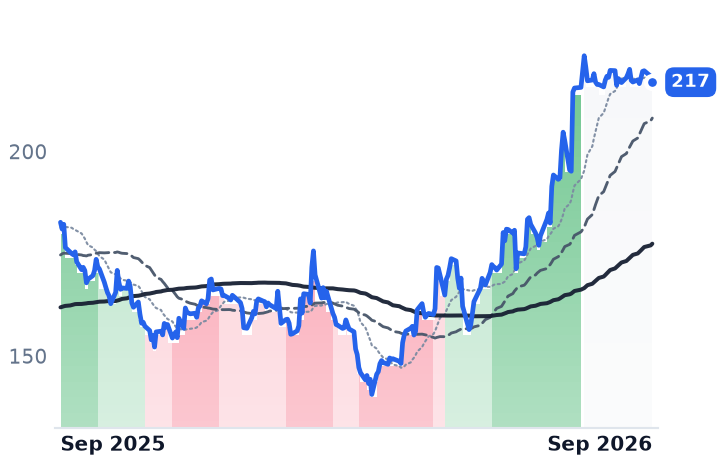
217
−1.45 (−0.66%)
vs. prior close
Price20d50d150d
PAG 12-month price
Traditional Dealership Groups
TickerMkt capP/EP/E fwdP/SP/S fwdP/GPP/GP fwdEV/EBITDAFCF yld
CVNA$72.8B30.0x44.4x3.2x2.6x16.2x13.1xn/m1.0%
LAD$8.3B12.4x10.4x0.2x0.2x2.0x2.0x17.4x-6.1%
PAG$14.3B16.1x16.1x0.4x0.4x2.7x2.7x13.7x4.1%
GPI
Group 1 Automotive
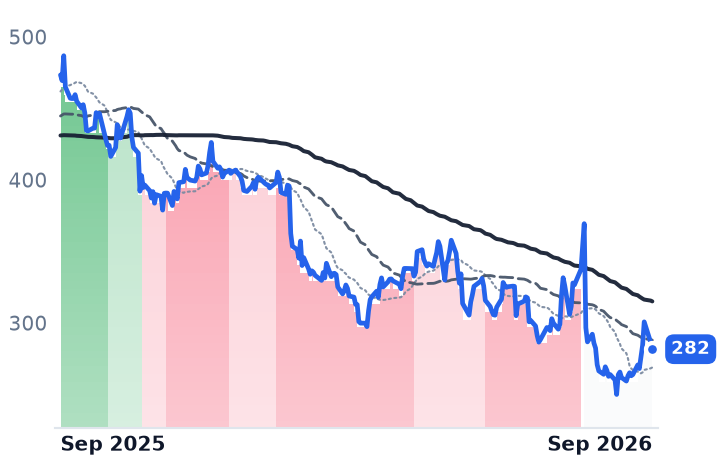
282
−4.74 (−1.66%)
vs. prior close
Price20d50d150d
GPI 12-month price
Traditional Dealership Groups
SAH
Sonic Automotive
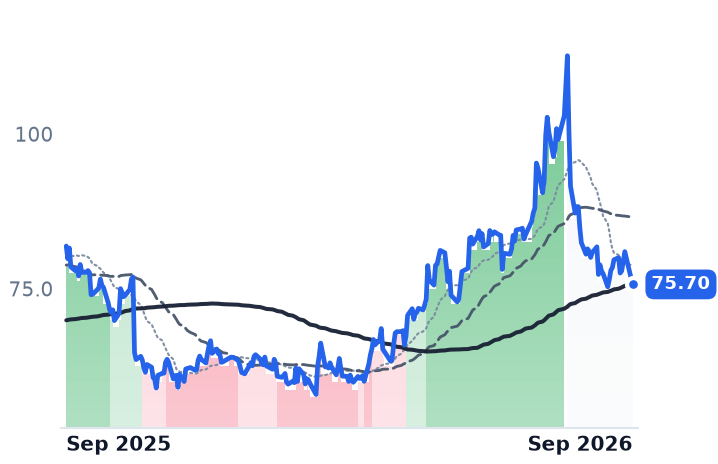
75.70
−1.02 (−1.33%)
vs. prior close
Price20d50d150d
SAH 12-month price
Traditional Dealership Groups
AN
AutoNation
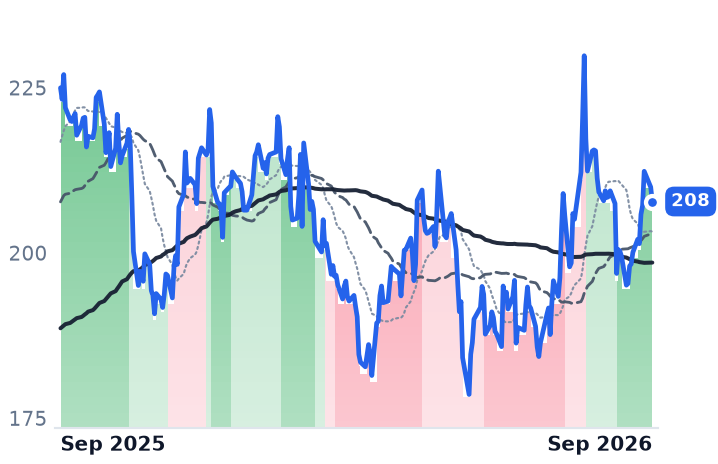
208
−2.19 (−1.04%)
vs. prior close
Price20d50d150d
AN 12-month price
Traditional Dealership Groups
TickerMkt capP/EP/E fwdP/SP/S fwdP/GPP/GP fwdEV/EBITDAFCF yld
GPI$3.6B12.5x7.7x0.2x0.2x1.0x1.0x11.4x3.9%
SAH$2.7B12.7x11.7x0.2x0.2x1.1x1.1x11.0x-2.0%
AN$6.9B9.4x9.5x0.3x0.2x1.4x1.4x11.1x0.2%
ABG
Asbury Automotive
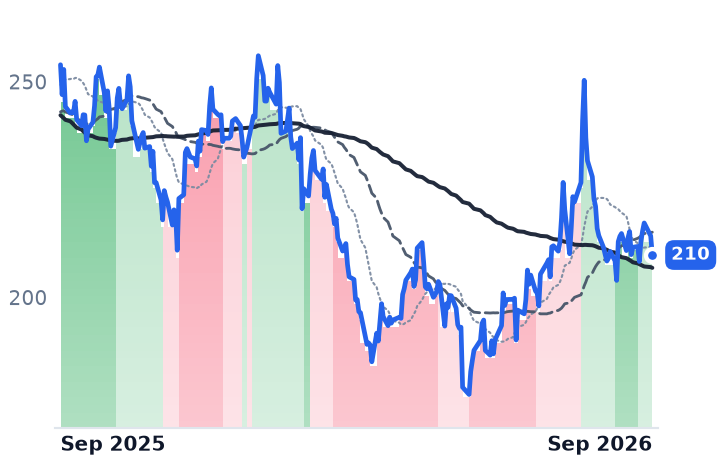
210
−4.44 (−2.07%)
vs. prior close
Price20d50d150d
ABG 12-month price
Traditional Dealership Groups
CARS
Cars.com
11.05
−0.40 (−3.52%)
vs. prior close
Price20d50d150d
CARS 12-month price
Marketplace & Local Services
TickerMkt capP/EP/E fwdP/SP/S fwdP/GPP/GP fwdEV/EBITDAFCF yld
ABG$4.0B8.1x8.2x0.2x0.2x1.3x1.3x8.9x12.3%
CARS$550.6M21.5x4.5x0.8x0.8x0.9x0.9x6.0x28.7%

Consensus projections

TickerFY2026EFY2027EFY2028E
KMXRevenue−2.7%+5.8%+2.1%
EPS−17.8%+0.5%+14.7%
ACVARevenue+12.0%+11.3%+14.5%
EPS+22.6%+71.3%+57.3%
OPLNRevenue+11.1%+6.4%+5.4%
EPS+11.6%+20.1%+34.2%
CVNARevenue+38.8%+25.6%+20.9%
EPS+50.1%+37.0%+33.9%
LADRevenue+1.8%+3.6%+5.0%
EPS+2.6%+16.7%+12.2%
PAGRevenue+6.7%+2.5%+2.2%
EPS+1.0%+6.6%+7.0%
GPIRevenue−1.4%+5.4%+3.6%
EPS−5.3%+12.2%+13.9%
SAHRevenue+3.5%+4.5%+5.4%
EPS+5.2%+10.5%+8.8%
ANRevenue−0.4%+3.2%+2.1%
EPS+9.1%+13.5%+13.9%
ABGRevenue−2.2%+4.2%+7.0%
EPS−5.9%+14.9%+9.5%
CARSRevenue+0.9%+2.5%+2.2%
EPS+20.8%+18.1%−12.1%

Forward fiscal years only. Blank means no analyst coverage for that year.

CarMax, which runs roughly 230 used-car stores, sells its unwanted trade-ins at wholesale auction and finances its own buyers through CarMax Auto Finance, earned $562.7m in that finance arm in the fiscal year ended February. The whole company kept $247.3m, a figure depressed by a $141.3m goodwill write-off taken when its own market value fell.

Strip the impairment out and the point survives: the lender is the profit center and the showroom is largely the channel that originates it. That makes the meters worth watching the interest margin, the loss allowance and the provision — figures buried below the revenue line — rather than units sold. It matters now because the shares have nearly doubled off their November low ahead of a fiscal second-quarter report due September 29, and none of the operating numbers have yet turned.

The lender

In the quarter ended May 31, CarMax Auto Finance produced $140.2m of income against consolidated net income of $185.6m — roughly three-quarters of everything the company earned. The share of retail sales financed in-house widened 150 basis points from a year earlier to 43.3%. Yet CAF income still slipped 1.0%, which the company traced to a smaller loan book after a $900m non-prime securitization in which most of the residual interest was sold.

Credit is the swing factor, and it is tightening. The allowance for loan losses stood at $475.0m, or 2.95% of auto loans held for investment, up from 2.78% at the February year-end as CAF pushes deeper into Tier 2 borrowers. The reported provision of $95.6m looks lower than last year's $101.7m only because $25.1m of allowance was released on loans reclassified as held for sale. Against that, the subprime consumer is healing: Fitch's 60-day subprime delinquency index fell to 5.67% in June from a 32-year record 6.90% in the December 2025 collection period.

The showroom

The retail arm long ran on a near-constant gross profit per car; new chief executive Keith Barr is spending it. Gross profit per retail used unit fell $230 to $2,177, which the company attributed to pricing actions taken to improve the sales trend. Comparable used-unit sales still fell 0.8%. Consolidated gross margin compressed from 11.8% to 9.8% on revenue that rose 6.2% to $8.01bn, and operating income dropped 67.9% to $13.6m. What rescued the quarter was cost: selling, general and administrative expense cut 3.7% to $635.2m.

"The work ahead is about removing what has held us back," Barr said of the four-pillar plan he presented in June. "The strategy we laid out today is not aspirational and is already in motion."

The wholesale arm gave no help either: units rose 8.4% but profit per wholesale car was flat at $1,046, and the Manheim Used Vehicle Value Index fell 0.9% in August to 208.2 against a normal +0.5% seasonal move, leaving wholesale values 0.4% above a year ago.

What the price is paying for

Shares closed at $60.17 on September 9, up 94.8% from their November 6 close of $30.88. At 22.3x forward earnings, the market is paying a market rate for consensus fiscal 2027 earnings of $2.71 a share — 0.5% above fiscal 2026 and below the $3.21 actually earned in fiscal 2025. The trailing free-cash-flow yield of 11.6% is no comfort: in a captive-finance model that line is dominated by receivable and securitization flows.

So the business earns very little of this move. What it earns is the cost discipline and the widening finance penetration; the rest is a bet that Barr's deliberate margin sacrifice buys volume back. It has not yet. Nor is the macro cooperating — used-car loans averaged 11.2% APR in the second quarter and rates are not expected to fall measurably this year, even as new-vehicle transaction prices near $49,855 keep pushing buyers toward used inventory they still cannot afford to finance.

On September 29, CarMax will put Jon Daniels, who runs the finance arm, on the call alongside the chief executive and chief financial officer. Investors should listen to him first — he speaks for the part of the company that makes the money.

Appian's Contracted Backlog Grew 13.0% Against 19.1% Revenue Growth; Procore's Grew 24%

Hypothesis Opus 5 · Research Opus 5 · Writing Opus 5 · Prompt v1.6

Two beaten-down software vendors turned up together this summer, and the one with the weaker order book got paid far more for it. Appian beat and raised on August 6, but gross margin fell 3.1 points to 71.2%, its professional-services book grew faster than its subscriptions, and the revenue it has signed but not yet recognized grew more slowly than the revenue it reports. Procore's contracted obligations reached $1.67bn, growing eight points faster than revenue, in a year when private nonresidential construction spending outside data centers fell 7.9%.

The judgment: Appian's advance is earned by profitability — adjusted EBITDA of $16.2m against $5-8m guided — and by nothing in its demand meters. Procore's bookings improved and its valuation did not follow.

APPNPCORPEGANOWLow-Code Workflow AutomationVertical Construction SoftwareSubscription Backlog & RPOFederal IT SpendingSaaS Margin Compression
TickerCompanySegmentTrend · 13mo30D1Y
The subject · what this brief is about
APPNAppianLow-Code & Process Automation🌱 Emerging Bull−1.8%+4.2%
PCORProcore TechnologiesSpecialized Enterprise Solutions🔴 Cont. Bear−5.6%−22.5%
Compared against · context, not the story
PEGAPegasystemsLow-Code & Process Automation🔴 Cont. Bear+5.3%−38.9%
NOWServiceNowSpecialized Enterprise Solutions🌱 Emerging Bull+2.9%−29.8%

12-month price & trend

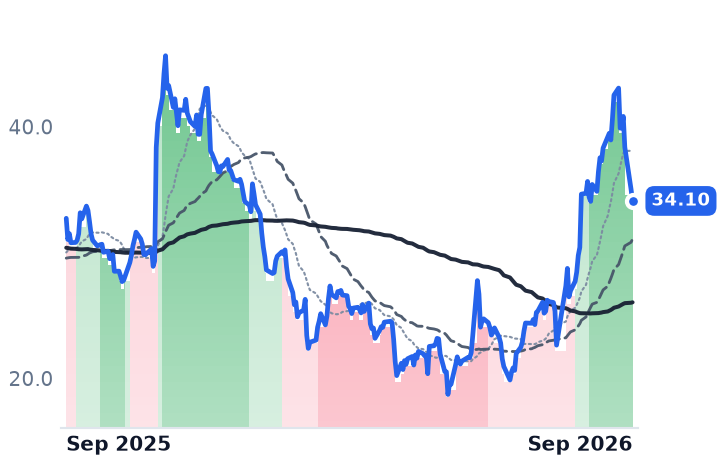
APPN
Appian
34.10
−0.95 (−2.71%)
vs. prior close
Price20d50d150d
APPN 12-month price
Low-Code & Process Automation
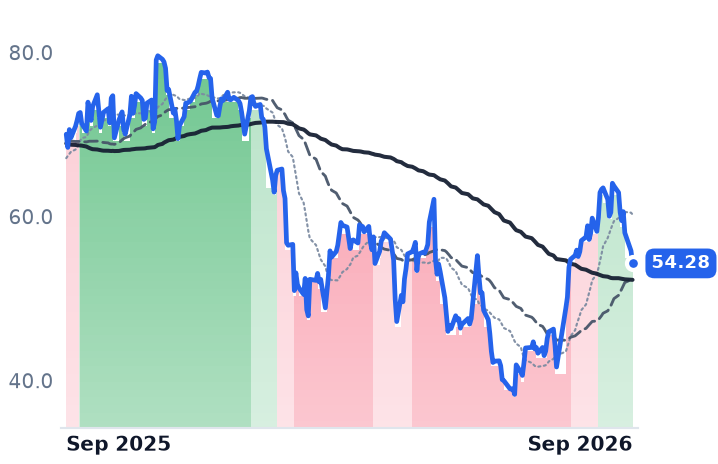
PCOR
Procore Technologies
54.28
−1.54 (−2.76%)
vs. prior close
Price20d50d150d
PCOR 12-month price
Specialized Enterprise Solutions
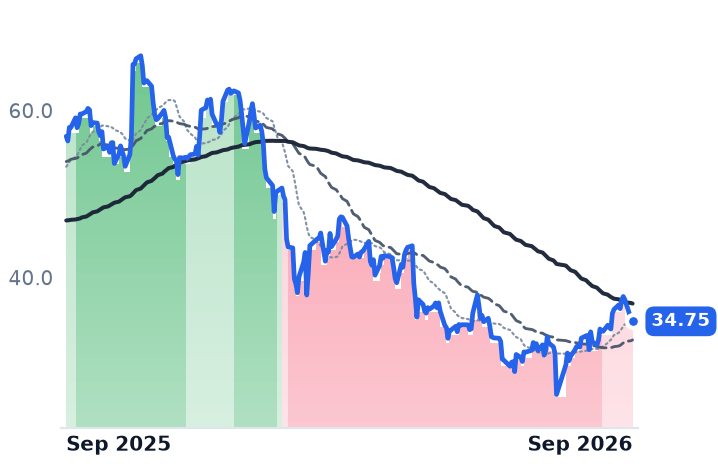
PEGA
Pegasystems
34.75
−0.30 (−0.86%)
vs. prior close
Price20d50d150d
PEGA 12-month price
Low-Code & Process Automation
TickerMkt capP/EP/E fwdP/SP/S fwdP/GPP/GP fwdEV/EBITDAFCF yld
APPN$2.5Bn/m31.7x3.2x3.0x4.4x4.1x110.1x3.0%
PCOR$8.2Bn/m32.2x5.7x5.4x7.2x6.8x127.9x3.6%
PEGA$6.1B19.7x15.2x3.5x3.3x4.7x4.3x30.6x8.2%
NOW
ServiceNow
131
−2.67 (−1.99%)
vs. prior close
Price20d50d150d
NOW 12-month price
Specialized Enterprise Solutions
TickerMkt capP/EP/E fwdP/SP/S fwdP/GPP/GP fwdEV/EBITDAFCF yld
NOW$132.8B79.8x31.6x9.0x8.2x12.1x11.0x39.8x3.4%

Consensus projections

TickerFY2026EFY2027EFY2028E
APPNRevenue+19.1%+10.8%+7.4%
EPS+104.0%+31.1%+11.4%
PCORRevenue+15.2%+13.8%+14.3%
EPS+24.2%+46.1%+20.1%
PEGARevenue+8.8%+9.2%+8.7%
EPS+18.0%+7.8%+6.2%
NOWRevenue+22.4%+18.7%+18.6%
EPS+17.1%+23.2%+21.4%

Forward fiscal years only. Blank means no analyst coverage for that year.

Appian, the McLean, Virginia vendor whose low-code platform lets banks, insurers and federal agencies assemble case-management workflows without hand-coding, beat its own June-quarter forecast and raised full-year guidance on August 6. The meter that normally leads a subscription business did not keep up.

Remaining performance obligations — revenue under contract but not yet recognized — were $625.3m at June 30, against $553.2m a year earlier, growth of 13.0% against reported revenue growth of 19.1%. When the contracted book grows slower than the revenue it feeds, the quarter is drawing down work already sold. At Procore, the Carpinteria, California platform that runs project management, financials and preconstruction for general contractors and owners, the same meter ran the other way: total obligations up 24% to $1.67bn, the current portion up 22%, on revenue growth of 15.8%. Since early June, Appian's shares have gained 41.8% and Procore's 18.7%.

What Appian's quarter contained

Cloud subscription revenue reached $131.7m, up 23%. The sequence matters more than the level: 18% in the December quarter, then 25% in March, then 23%. Full-year cloud guidance of $525-529m against $437.4m delivered in 2025 leaves roughly 17-18% for the second half, and management said as much on the call, citing a dollar headwind and low-to-mid single-digit growth in non-cloud subscriptions.

The mix improvement a platform story implies did not arrive either. Professional services revenue grew 20% to $45.6m — faster than the 19% for subscriptions — holding services at about 22% of revenue, and gross margin compressed 3.1 points to 71.2%. The pressure came from the subscription line, at 84% gross margin against 86% the prior quarter on artificial-intelligence product mix; services margin actually widened to 31%.

What genuinely improved was cash. Adjusted earnings before interest, tax, depreciation and amortization came in at $16.2m against $5-8m guided, operating cash flow swung to $12.1m from an outflow of $1.9m, and Appian bought back $43.9m of stock. Cloud net annual recurring revenue expansion held at 115%. Rather than trimming, the company pulled 2027 hiring forward. "I think it might be an indication of strong pipeline that's unusually strong and also our confidence of being able to win in the current environment," chief executive Matt Calkins told analysts. US federal agencies supplied 25.3% of 2025 revenue, so appropriations timing sits under those bookings.

The price has moved faster than any of it. Appian trades at 4.36 times trailing gross profit, against 3.63x in late July and 3.07x in early May — about 42% of expansion against roughly 14% growth in gross profit itself. Its forward price-to-earnings ratio of 31.7x rests on consensus per-share earnings of $1.08 against roughly $0.53 delivered last year, and the same consensus has revenue growth fading to 7% by 2028.

The name with the better book

Procore posted its first positive quarter of operating income under generally accepted accounting principles, $4.3m against a $30.3m loss a year earlier, raised full-year revenue guidance to $1.510-1.514bn and lifted its non-GAAP operating margin target to 18.5-19%. Customers spending more than $100,000 a year number 2,871, up 14%, with gross revenue retention of 95%. In July it agreed to buy DroneDeploy, a site-capture and robotics platform, for about $845m in cash.

None of that is the cycle helping. Private nonresidential construction spending excluding data centers fell 7.9% year on year in June, and the American Institute of Architects' forecast panel cut its 2026 outlook to a 0.3% decline. "Customers are embracing our solutions, giving us more confidence in our direction, our ability to execute, and our future success," chief executive Ajei Gopal said on the July call, while describing a market uneven enough that manufacturing work is shrinking and data-center work is up 46%. Procore trades at 7.20 times trailing gross profit — below the 7.96x it carried in early May, because gross profit outgrew the shares.

The verdict

A sector tide explains part of this and not the gap. Software broadly is up nearly 40% from its April lows on a dovish read of rate expectations, by CNBC's account, and ServiceNow, the workflow vendor, rose 22.6% over the same three months. Pegasystems, Appian's closest rival for the same process-automation budget, rose 1.7%. So Appian's move is company-specific, and the company-specific evidence under it is a profitability inflection rather than a demand one: the cash swing and the earnings beat are real and dated, while bookings, mix and margin each moved the wrong way. Procore earned a re-rating on its contracted book and has not yet been given one.

Above all of it sits something no software meter forecasts. On January 8 the Supreme Court of Virginia affirmed that the 2022 jury verdict awarding Appian more than $2bn against Pegasystems is vacated, sending liability and damages back to Fairfax County Circuit Court for a full retrial.

No locatable filing says when that retrial begins. Appian's holders have spent the summer paying up for a quarter whose demand meters went backwards; the item that could dwarf all of them sits on a court calendar nobody has published.

Michael Kors Raises Outlet Prices 5-10%; Coach Ran That Play and Won Gen Z

Hypothesis Opus 5 · Research Opus 5 · Writing Opus 5 · Prompt v1.6

Both American accessible-luxury houses are now running the same maneuver — pull handbags out of off-price channels so the full-price customer pays more — but one started years earlier and is winning on it. Coach lifted handbag average unit retail at a mid-teens rate in fiscal 2026 with units up low double digits alongside it, carrying Tapestry's gross margin to 77.8% from 75.4%. Capri is only now raising Michael Kors outlet prices, having shrunk June-quarter revenue to $769m, and has told investors to expect negative full-price comparable sales while it takes a final step back from clearance.

The market has repriced both regardless. Tapestry's fall has continued for a month after the news that caused it, in company with an apparel complex that dropped in near-unison; Capri's forward earnings recovery rests on cost cuts against consensus revenue that still falls.

TPRCPRIRLPVHLEVINKELULUDECKBIRKONONVFCKTBCRIAEOANFELAccessible Luxury HandbagsOff-Price Channel ExitFull-Price Pricing PowerGen Z Brand PreferenceApparel & Footwear RetailImport Tariff Exposure
TickerCompanySegmentTrend · 13mo30D1Y
The subject · what this brief is about
TPRTapestryHandbags & Accessories🟢 Cont. Bull−28.3%+10.3%
CPRICapriHandbags & Accessories⚠️ Emerging Bear−16.7%−39.9%
Compared against · context, not the story
RLRalph LaurenPremium Lifestyle🟢 Cont. Bull−15.2%+10.8%
PVHPVHPremium Lifestyle🟢 Cont. Bull−20.3%−15.4%
LEVILevi StraussDenim & Casual🟢 Cont. Bull−15.9%−4.9%
NKENIKEAthletic & Performance🔴 Cont. Bear−12.1%−49.0%
LULULululemon AthleticaAthletic & Activewear🔴 Cont. Bear−21.8%−40.0%
DECKDeckers OutdoorPremium Lifestyle Footwear🌱 Emerging Bull−16.6%−30.5%
BIRKBirkenstockPremium Lifestyle Footwear🔴 Cont. Bear−19.8%−33.4%
ONONOnAthletic & Activewear🔴 Cont. Bear−29.8%−39.1%
VFCV.FOutdoor & Adventure⚠️ Emerging Bear−13.4%−13.5%
KTBKontoor BrandsDenim & Casual🌱 Emerging Bull−11.2%−11.0%
CRICarter'sChildrenswear🟢 Cont. Bull−21.4%+12.9%
AEOAmerican Eagle OutfittersSpecialty Apparel⚠️ Emerging Bear−7.6%−5.0%
ANFAbercrombie & FitchSpecialty Apparel🌱 Emerging Bull+28.7%+59.3%
ELThe Estée Lauder CompaniesBeauty & Personal Care⚠️ Emerging Bear+13.5%+11.9%

12-month price & trend

TPR
Tapestry
115
−2.95 (−2.50%)
vs. prior close
Price20d50d150d
TPR 12-month price
Handbags & Accessories
CPRI
Capri
12.82
−0.28 (−2.10%)
vs. prior close
Price20d50d150d
CPRI 12-month price
Handbags & Accessories
RL
Ralph Lauren
341
−10.61 (−3.02%)
vs. prior close
Price20d50d150d
RL 12-month price
Premium Lifestyle
TickerMkt capP/EP/E fwdP/SP/S fwdP/GPP/GP fwdEV/EBITDAFCF yld
TPR$23.0B15.2x14.2x2.9x2.7x3.7x3.4x12.2x7.9%
CPRI$1.5B10.1x6.0x0.4x0.4x0.7x0.7x11.5x5.7%
RL$20.8B21.2x18.0x2.5x2.4x3.5x3.4x14.9x5.0%
PVH
PVH
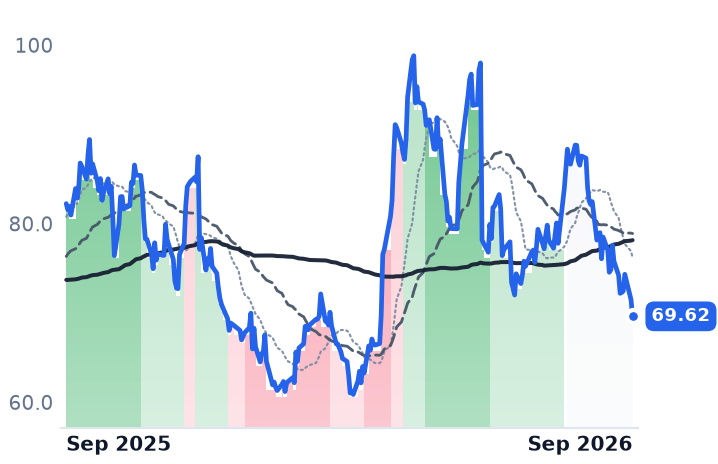
69.62
−1.87 (−2.62%)
vs. prior close
Price20d50d150d
PVH 12-month price
Premium Lifestyle
LEVI
Levi Strauss
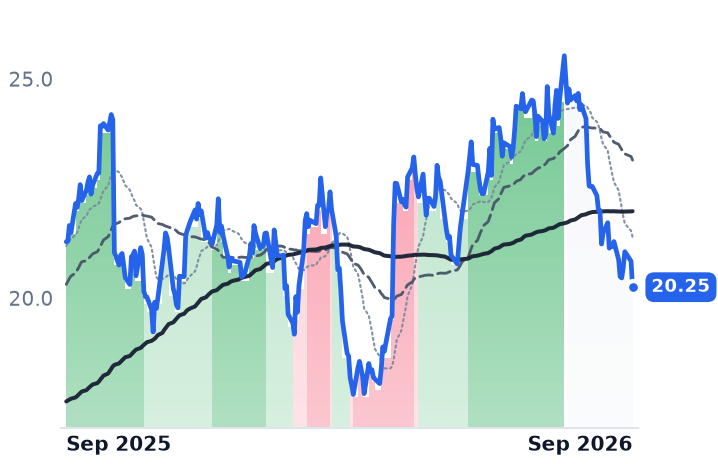
20.25
−0.59 (−2.85%)
vs. prior close
Price20d50d150d
LEVI 12-month price
Denim & Casual
NKE
NIKE
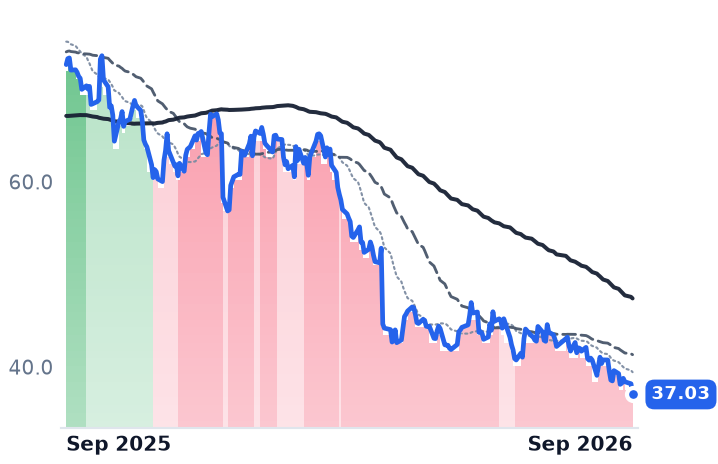
37.03
−1.16 (−3.03%)
vs. prior close
Price20d50d150d
NKE 12-month price
Athletic & Performance
TickerMkt capP/EP/E fwdP/SP/S fwdP/GPP/GP fwdEV/EBITDAFCF yld
PVH$3.6B148.5x6.6x0.4x0.4x0.7x0.7x11.0x14.8%
LEVI$8.3B13.2x14.0x1.3x1.2x2.1x2.0x10.1x5.9%
NKE$61.9B27.5x28.1x1.3x1.3x3.3x3.3x19.9x1.7%
LULU
Lululemon Athletica
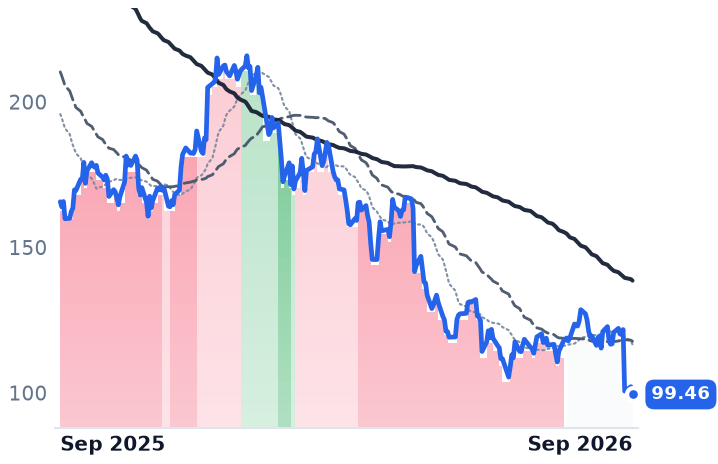
99.46
−2.67 (−2.61%)
vs. prior close
Price20d50d150d
LULU 12-month price
Athletic & Activewear
DECK
Deckers Outdoor
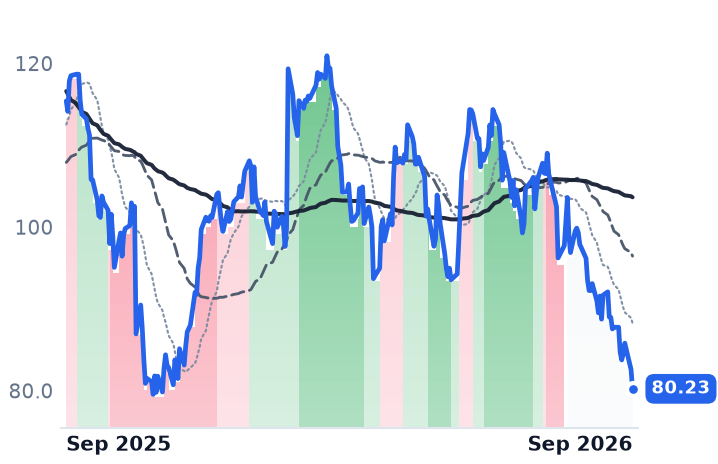
80.23
−2.37 (−2.87%)
vs. prior close
Price20d50d150d
DECK 12-month price
Premium Lifestyle Footwear
BIRK
Birkenstock
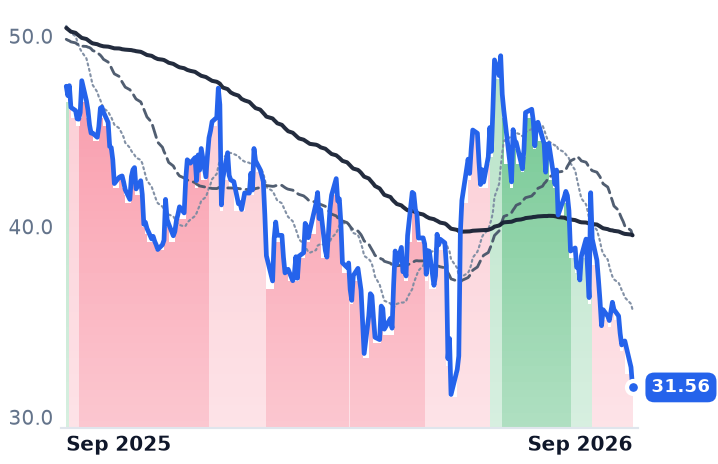
31.56
−1.06 (−3.25%)
vs. prior close
Price20d50d150d
BIRK 12-month price
Premium Lifestyle Footwear
TickerMkt capP/EP/E fwdP/SP/S fwdP/GPP/GP fwdEV/EBITDAFCF yld
LULU$14.0B9.0x9.7x1.3x1.2x2.2x2.2x5.1x6.6%
DECK$11.2B11.7x11.0x2.0x1.9x3.5x3.3x7.3x10.7%
BIRK$6.0B15.2x16.4x2.3x2.5x4.1x4.6x9.3x5.5%
ONON
On
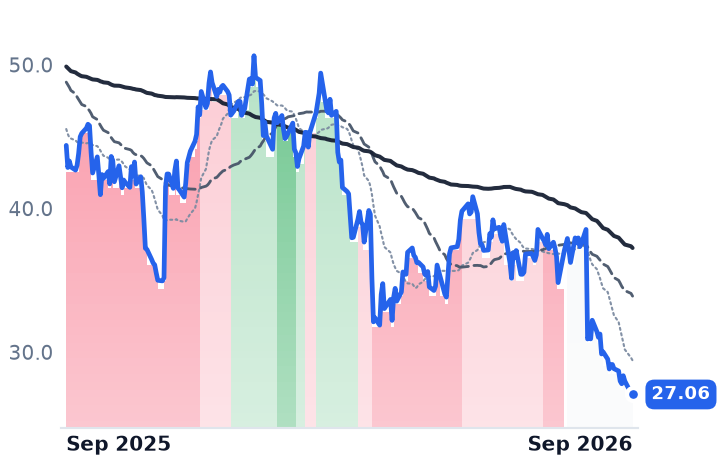
27.06
−0.09 (−0.35%)
vs. prior close
Price20d50d150d
ONON 12-month price
Athletic & Activewear
VFC
V.F
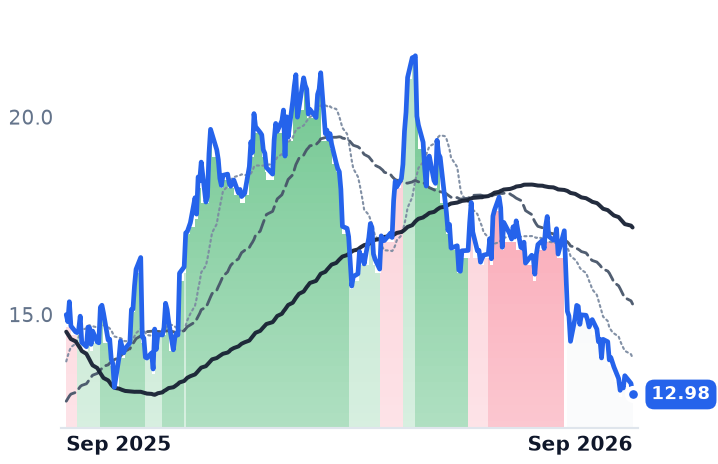
12.98
−0.28 (−2.11%)
vs. prior close
Price20d50d150d
VFC 12-month price
Outdoor & Adventure
KTB
Kontoor Brands
68.92
−2.44 (−3.42%)
vs. prior close
Price20d50d150d
KTB 12-month price
Denim & Casual
TickerMkt capP/EP/E fwdP/SP/S fwdP/GPP/GP fwdEV/EBITDAFCF yld
ONON$12.4B38.5x26.1x3.1x3.4x4.9x5.3x22.1x3.1%
VFC$5.2B18.8x12.3x0.5x0.5x1.0x1.0x11.7x11.2%
KTB$3.4B12.3x11.5x1.1x1.2x2.3x2.5x10.1x11.7%
CRI
Carter's
32.16
−0.35 (−1.08%)
vs. prior close
Price20d50d150d
CRI 12-month price
Childrenswear
AEO
American Eagle Outfitters
16.76
−0.39 (−2.27%)
vs. prior close
Price20d50d150d
AEO 12-month price
Specialty Apparel
ANF
Abercrombie & Fitch
152
+2.29 (+1.54%)
vs. prior close
Price20d50d150d
ANF 12-month price
Specialty Apparel
TickerMkt capP/EP/E fwdP/SP/S fwdP/GPP/GP fwdEV/EBITDAFCF yld
CRI$1.2B13.1x10.4x0.4x0.4x0.9x0.9x7.0x10.3%
AEO$2.5B13.5x8.7x0.5x0.4x1.4x1.3x7.4x1.0%
ANF$3.2B6.4x6.6x0.6x0.6x1.0x1.0x4.1x11.9%
EL
The Estée Lauder Companies
98.58
−2.48 (−2.45%)
vs. prior close
Price20d50d150d
EL 12-month price
Beauty & Personal Care
TickerMkt capP/EP/E fwdP/SP/S fwdP/GPP/GP fwdEV/EBITDAFCF yld
EL$29.0Bn/m33.1x2.0x1.9x2.7x2.6x21.9x4.4%

Consensus projections

TickerFY2026EFY2027EFY2028E
TPRRevenue+14.7%+7.1%+5.4%
EPS+37.4%+14.1%+11.7%
CPRIRevenue−20.8%−2.2%+2.5%
EPS+38.9%+51.2%+18.4%
RLRevenue+13.6%+8.8%+5.3%
EPS+35.1%+15.9%+11.0%
PVHRevenue+3.0%+1.6%+1.8%
EPS−6.6%+10.9%+12.1%
LEVIRevenue+7.5%+4.9%+6.0%
EPS+13.0%+12.0%+15.6%
NKERevenue+0.7%+0.6%+4.4%
EPS−30.5%+22.1%+28.6%
LULURevenue+4.7%+3.9%+4.5%
EPS−9.1%−5.7%+7.7%
DECKRevenue+9.4%+8.2%+7.4%
EPS+16.1%+9.3%+10.9%
BIRKRevenue+13.7%+14.0%+13.1%
EPS+15.9%+23.4%+18.5%
ONONRevenue+21.3%+20.3%+23.9%
EPS+101.7%+23.3%+26.4%
VFCRevenue−2.4%+1.9%+3.1%
EPS+12.1%+29.2%+24.3%
KTBRevenue+19.4%−9.7%+4.2%
EPS+13.2%−2.7%+21.4%
CRIRevenue+2.6%+4.4%+1.3%
EPS−37.8%−2.7%+12.1%
AEORevenue+2.8%+5.6%+3.4%
EPS−19.0%+28.1%+12.0%
ANFRevenue+6.8%+3.9%+3.8%
EPS−7.7%+8.9%+9.6%
ELRevenue+4.5%+4.1%+4.4%
EPS+63.1%+30.8%+21.9%

Forward fiscal years only. Blank means no analyst coverage for that year.

Two weeks ago Tapestry's fiscal 2027 guidance broke its stock in a single session. What has happened since is the part worth returning for: the shares kept falling for another month without new company news, and the last big American accessible-luxury brand still shipping heavily into off-price began copying the move that made Coach work.
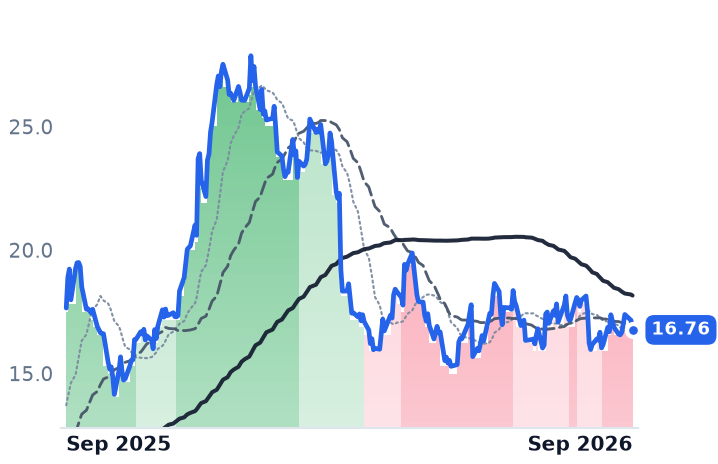
Capri Holdings, which owns Michael Kors and Jimmy Choo after selling Versace to Prada for $1.375bn, is raising outlet prices 5 to 10% starting in August and September and taking what management calls a final step back from clearance and markdown inventory in the September quarter. That is the mechanism this corner of retail actually runs on. Handbags priced $250 to $500 have grown from 63% to 70% of global volume in three years, and inside that band earnings are not units sold but the price a full-price customer will pay — which only rises if the same bag stops appearing discounted somewhere else.

Coach proved it; the numbers are on the page

Tapestry, the Coach, Kate Spade and Stuart Weitzman owner run by chief executive Joanne Crevoiserat, spent years withdrawing product from outlets and wholesale doors. Fiscal 2026 revenue rose 14.2% to $8.00bn, gross margin reached 77.8% against 75.4%, and diluted earnings per share came in at $7.27 against $0.82 the year before. Coach handbag average unit retail rose at a mid-teens rate for the year on reduced promotion — and, against the usual objection that price is bought with volume, full-year units rose low double digits too. "You are going to continue to see AUR gains across the globe, and you will also see unit gains," Coach chief executive Todd Kahn said on the August 13 call, per transcript coverage. Bain's 2026 luxury report has Coach ranking first in brand preference among 18-to-27-year-olds; Michael Kors has slipped from first to fourth with that group since 2020.

The cost of the discipline is visible. Tapestry closed 64 directly operated stores in fiscal 2026, 40 of them Kate Spade, and guides Kate Spade to a high-single-digit revenue decline after a $27.2m adjusted operating loss. Its leather goods are made in Vietnam, Cambodia and India, so the guide also carries a mid-20% assumed tariff rate on US receipts — a line that is itself unsettled, since the Supreme Court struck down the emergency-powers tariffs in February.

Capri is attempting it from behind

Michael Kors revenue fell 7.1% to $590m in the June quarter, roughly $50m of that a deliberate reduction of markdown inventory; group inventory is down 20% year over year, Michael Kors down 25%, and gross margin improved to 65.0% from 59.2%. Jimmy Choo, at $179m, grew 10.5%. "There's been 3 years, 4 years of decline in that business, and we're finally starting to see that turn," chairman and chief executive John Idol said of the wholesale channel on the August 5 call. The balance sheet was fixed by the asset sale rather than by trading: "we ended the quarter with cash of $114 million and debt of $338 million, resulting in net debt of $224 million, down from approximately $1.5 billion last year," chief financial and operating officer Tyler Reddien told investors the same day.

What the shares did, and what it means

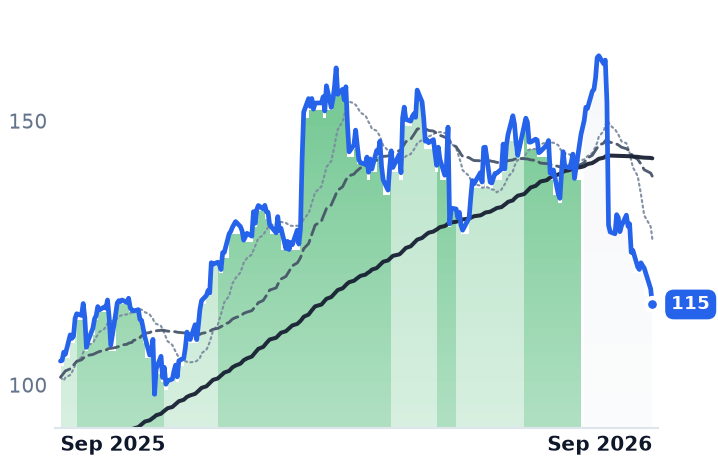
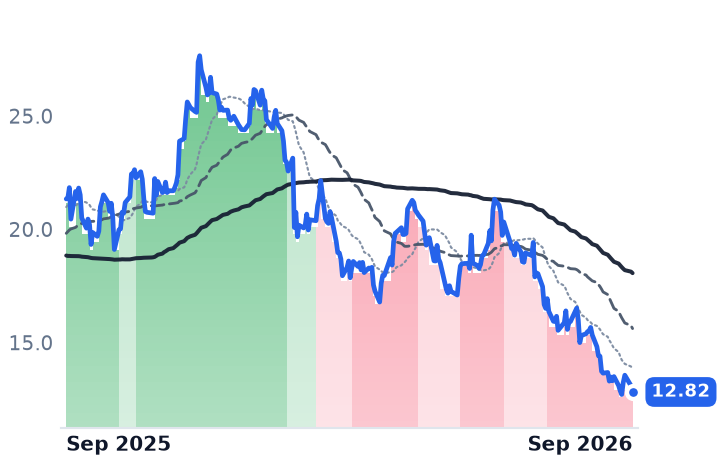
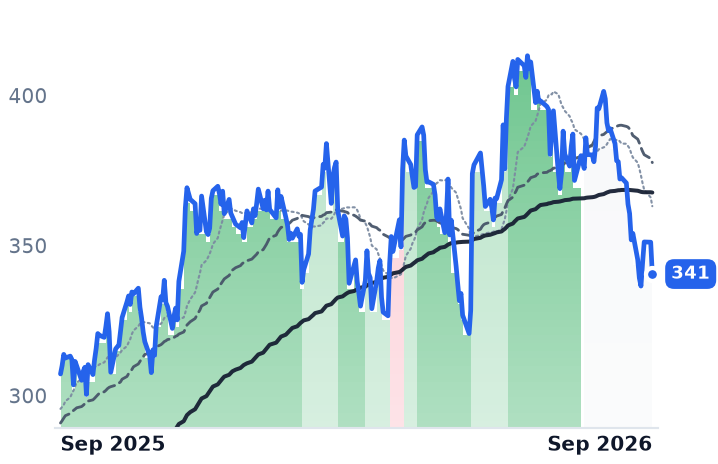
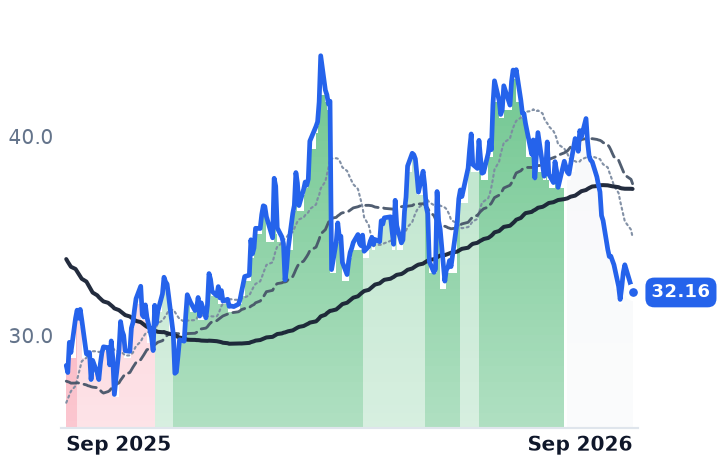
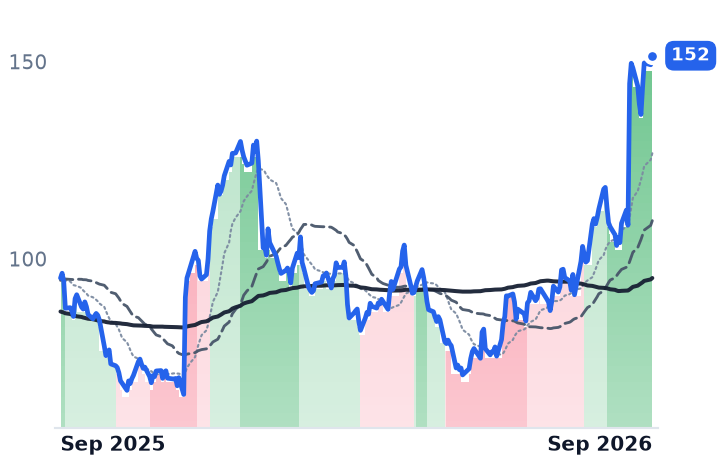
Tapestry has fallen 11.5% in the eighteen sessions since the earnings gap, to $115.25, a 29.0% drawdown from its August 7 high. But roughly half the month belongs to the group: over the same window On Holding fell 29.8%, Lululemon 21.8% after its early-September guidance cut, PVH 20.3% and Nike 12.1%, a median near 16%. Abercrombie & Fitch and Estée Lauder rose. Capri touched a 52-week low of $12.71 on September 2.

The first leg of Tapestry's fall was earned — a fiscal 2027 guide of $8.4bn to $8.5bn implies roughly 5.6% growth against 14.2% delivered, and a halved growth rate is worth a lower multiple. At 14.25x forward earnings against 15.18x trailing, versus about 20.6x forward in early August, that repricing has been done and then some, on a company retiring $3bn of stock — about 13% of its $23.0bn market value — through fiscal 2028. Capri, at 5.98x forward against 10.12x trailing, is cheap for a reason its own consensus states: earnings up 51% while revenue falls 2.2%. Because gross margins differ by 13 points, the comparison that travels is price against gross profit, where Capri trades at 0.69x and Tapestry at 3.69x. One of those discounts is a business shrinking into cost cuts; the other is a pricing engine that has not yet been shown to be broken.

Capri has already told investors to expect negative full-price comparable sales this quarter as the clearance inventory comes out. Coach absorbed exactly that cost for years before the price stuck — and it did the absorbing while it was still the brand teenagers wanted.

Ormat's Doubled 2030 Profit Target Excludes Enhanced Geothermal Entirely

Hypothesis Opus 5 · Research Opus 5 · Writing Opus 5 · Prompt v1.6

Ormat spent its September 8 investor day promising to roughly double earnings before interest, tax, depreciation and amortization by 2030 — and the plan counts nothing from enhanced geothermal, the technology Fervo Energy is built on. The next session both stocks fell about 8.5% while the broader power complex barely moved.

The fall is not an operating miss. Ormat's contracted power book grew 5.8% last quarter to $169.3m and its named fields improved; what changed is where the growth sits — a third-party construction book at a 9.7% gross margin and merchant battery revenue whose 56.2% margin management guided down toward 40-50%. Consensus has 2026 revenue up 21.4% and 2027 down 1.2%. Fervo, with $113,000 of quarterly revenue and 1,054 megawatts of binding offtake, is priced at roughly 68 times its 2027 consensus sales.

ORAFRVOVRTCEGVSTTLNOKLOGEVSPYGeothermal Baseload PowerEnhanced Geothermal SystemsGrid-Scale Battery StorageHyperscaler Power ContractsTurbine & EPC BacklogDrilling Cost Curves
TickerCompanySegmentTrend · 13mo30D1Y
The subject · what this brief is about
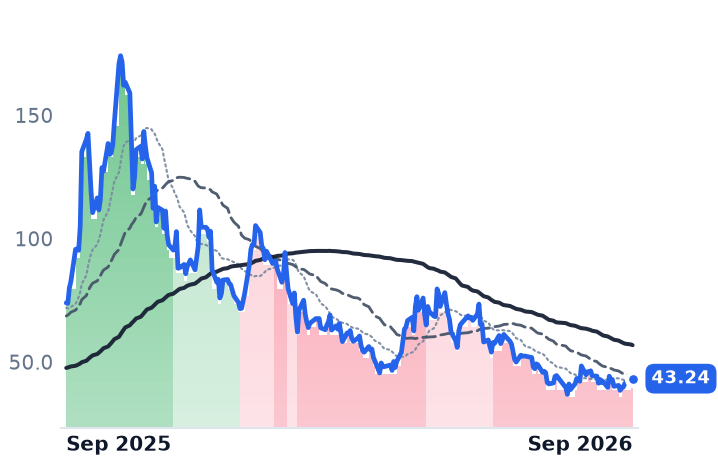
ORAOrmat TechnologiesGeothermal & Specialized⚠️ Emerging Bear−9.1%+9.8%
FRVOFervo EnergyEmerging & Specialized Energy🔴 Cont. Bear−29.7%−52.8%
Compared against · context, not the story
VRTVertivData Center Power & Thermal⚠️ Emerging Bear−1.8%+112.5%
CEGConstellation EnergyDiversified Renewable Generators⚠️ Emerging Bear+8.1%−1.7%
VSTVistraIntegrated Retail & Generation🔴 Cont. Bear+5.8%−21.7%
TLNTalen EnergyWholesale Power Producers⚠️ Emerging Bear−6.8%−17.7%
OKLOOkloEmerging & Specialized Energy🔴 Cont. Bear−3.5%−41.5%
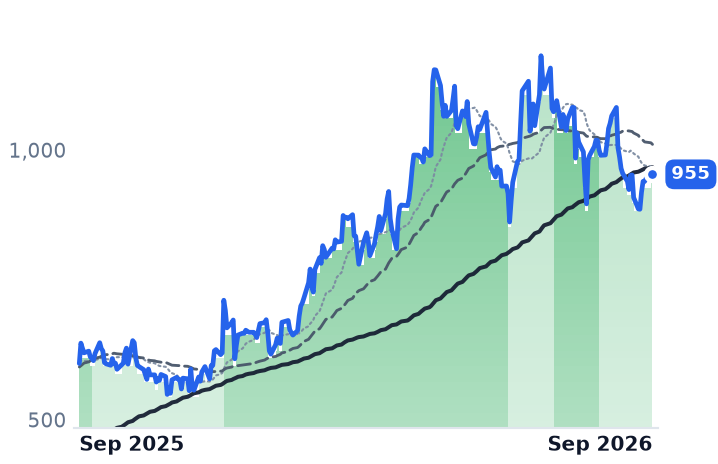
GEVGE VernovaGE Vernova Integrated🟢 Cont. Bull−3.6%+58.0%
SPYState Street SPDR S&P 500 ETF TrustAsset Management🟢 Cont. Bull−1.5%+18.2%

12-month price & trend

ORA
Ormat Technologies
98.81
−9.16 (−8.48%)
vs. prior close
Price20d50d150d
ORA 12-month price
Geothermal & Specialized
FRVO
Fervo Energy
17.24
−1.66 (−8.78%)
vs. prior close
Price20d50d150d
FRVO 12-month price
Emerging & Specialized Energy
VRT
Vertiv
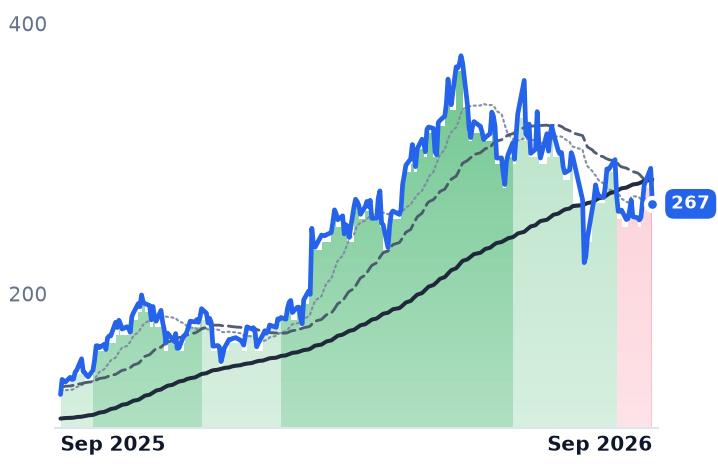
267
−26.30 (−8.98%)
vs. prior close
Price20d50d150d
VRT 12-month price
Data Center Power & Thermal
TickerMkt capP/EP/E fwdP/SP/S fwdP/GPP/GP fwdEV/EBITDAFCF yld
ORA$6.1B47.5x38.8x5.1x5.1x18.3x18.4x20.7x-4.4%
FRVO$4.9Bn/m854.4xn/m-9.0%
VRT$100.8B58.0x39.0x8.8x7.2x23.4x19.2x40.1x2.9%
CEG
Constellation Energy
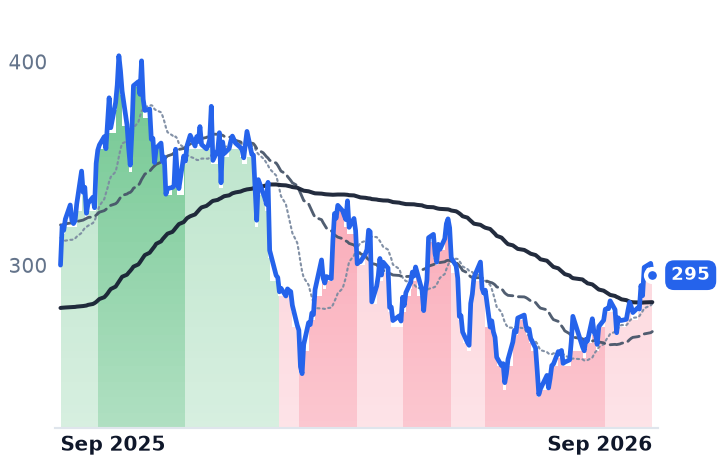
295
−5.80 (−1.93%)
vs. prior close
Price20d50d150d
CEG 12-month price
Diversified Renewable Generators
VST
Vistra
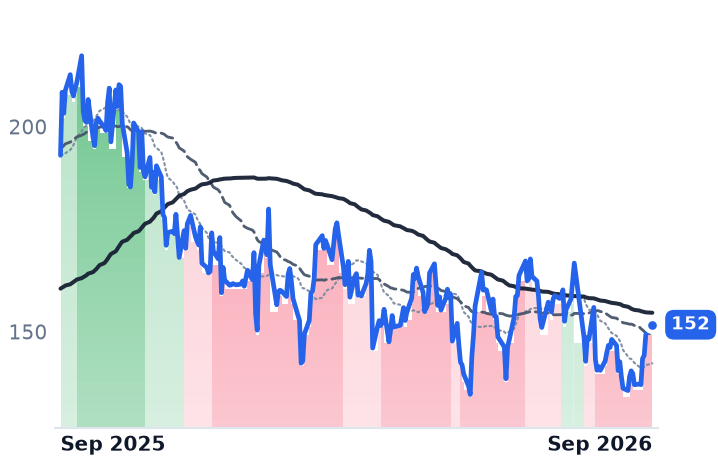
151
−0.62 (−0.41%)
vs. prior close
Price20d50d150d
VST 12-month price
Integrated Retail & Generation
TLN
Talen Energy
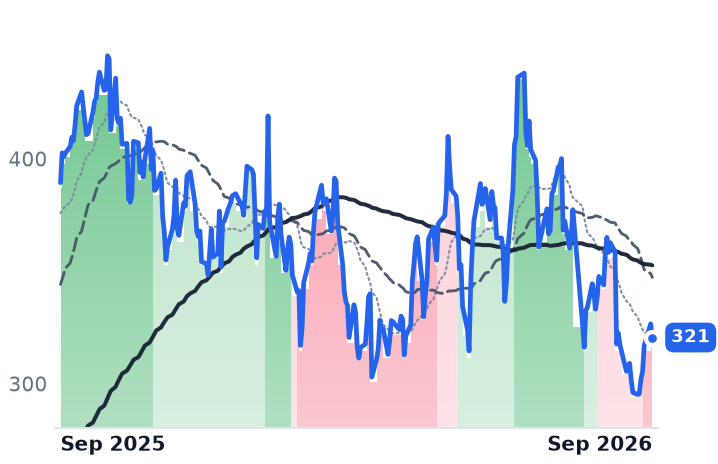
321
−6.07 (−1.86%)
vs. prior close
Price20d50d150d
TLN 12-month price
Wholesale Power Producers
TickerMkt capP/EP/E fwdP/SP/S fwdP/GPP/GP fwdEV/EBITDAFCF yld
CEG$107.4B29.1x24.8x3.4x3.2x3.6x3.4x15.4x0.3%
VST$51.2B25.3x17.6x3.2x2.3x24.7x17.6x10.9x2.7%
TLN$14.4Bn/m15.4x4.1x3.2x9.1x7.2x29.9x3.5%
OKLO
Oklo
43.24
−0.46 (−1.04%)
vs. prior close
Price20d50d150d
OKLO 12-month price
Emerging & Specialized Energy
GEV
GE Vernova
955
−10.67 (−1.10%)
vs. prior close
Price20d50d150d
GEV 12-month price
GE Vernova Integrated
SPY
State Street SPDR S&P 500 ETF Trust
762
−5.66 (−0.74%)
vs. prior close
Price20d50d150d
SPY 12-month price
Asset Management
TickerMkt capP/EP/E fwdP/SP/S fwdP/GPP/GP fwdEV/EBITDAFCF yld
OKLO$7.3Bn/mn/m-3.8%
GEV$242.9B25.9x29.7x5.9x5.2x29.0x26.0x27.0x5.1%
SPY$773.0B

Consensus projections

TickerFY2026EFY2027EFY2028E
ORARevenue+21.4%−1.2%+12.0%
EPS+16.4%−3.5%+25.9%
FRVORevenue+4094.5%+1158.9%+186.8%
EPS−92.0%−19.8%−26.6%
VRTRevenue+37.0%+29.7%+21.9%
EPS+62.8%+36.4%+27.1%
CEGRevenue+36.6%+2.6%+5.5%
EPS+28.7%+10.1%+26.3%
VSTRevenue+16.7%+9.3%+4.7%
EPS+80.0%+18.7%+18.0%
TLNRevenue+84.0%+15.8%+4.6%
EPS+247.6%+48.4%+17.8%
OKLORevenue+241.0%+577.4%
EPS+50.0%+10.3%+16.5%
GEVRevenue+23.9%+14.8%+15.0%
EPS+321.7%−19.5%+40.7%

Forward fiscal years only. Blank means no analyst coverage for that year.

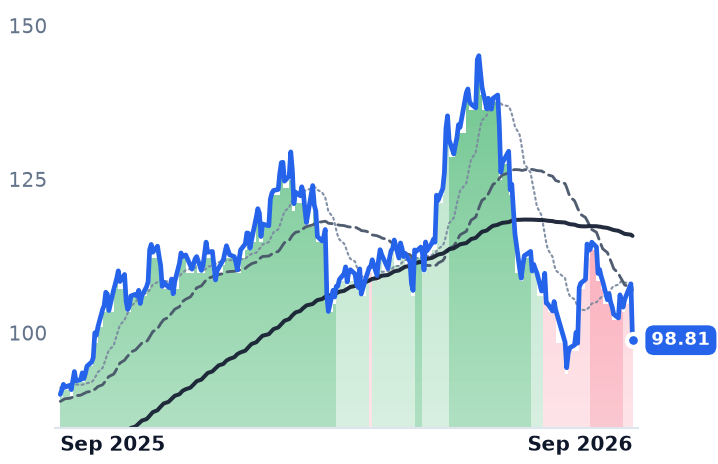
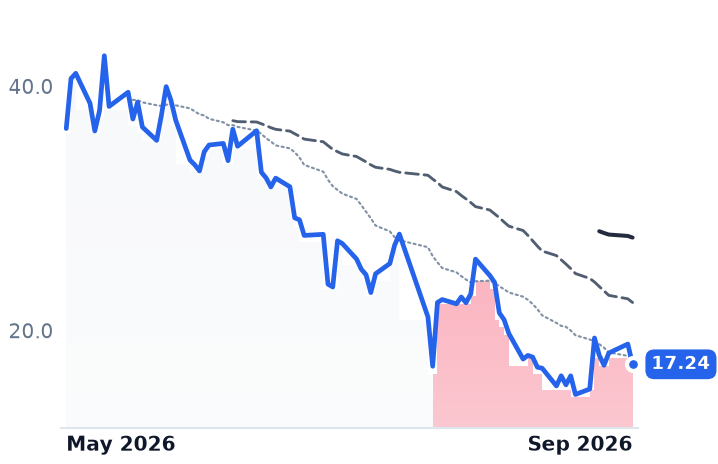
Ormat Technologies, which owns geothermal plants, builds turbines for other owners and runs batteries in wholesale power markets, told investors at the New York Stock Exchange on September 8 that it can roughly double earnings before interest, tax, depreciation and amortization by 2030, to about $1.05bn at the midpoint from $526m, on a 3.5-3.7 gigawatt portfolio. The figure excludes enhanced geothermal — the deep-drilled, engineered-reservoir technique — entirely. The next session the shares closed at $98.81, down 8.5%, on 2.1m shares against an August daily average nearer 400,000. Fervo Energy, a Houston developer whose entire business is enhanced geothermal, fell 8.8% alongside it.

That exclusion is the most honest thing either company has published. Ormat's separate enhanced-geothermal targets are 100 megawatts operating in 2030-2031 and a gigawatt by 2033-2035, led by a 280 MW project at Dixie Valley, Nevada, against which only a 60 MW interconnection agreement has been executed. Asked about Fervo and other startups, management framed its pace as a choice to de-risk first. So the incumbent treats the technology as an option, and the market now prices both companies off schedules that end years from here.

Three books, one label

Ormat's second quarter grew revenue 10.6% to $258.8m and widened gross margin by 2.2 percentage points to 26.5%, while operating income fell 3.2% and net income fell 3.4%. The composition explains it. The contracted power segment — output sold under long-dated fixed-price agreements — grew 5.8% to $169.3m at a 23.7% gross margin. The third-party engineering and turbine book fell to roughly $46.7m at a 9.7% margin, which Ormat's own release attributes to "high expenses related to the construction costs of a project in Europe and the impact of changes in exchange rate on overall manufacturing costs." Merchant battery revenue nearly tripled to $42.8m at a 56.2% margin management guided down to a 40-50% range.

The power annuity is not deteriorating: Puna added about $3m on recovery from the prior year's well-field problem, Olkaria about $2.5m after well-field optimization, and US curtailment cost $4.2m less. What repeats poorly is the rest. Full-year guidance of $1.15-1.2bn leans on the lowest-margin book delivering roughly $85-100m in the second half from a $203m backlog, and about $90m of 2026 cash earnings arrives as sales of transferable tax credits rather than power, $52m of it already collected. Net income has been flat for three years — $124.4m, $123.7m, $123.9m — on revenue that grew from $829m to $990m. Consensus models 2026 revenue up 21.4% and 2027 down 1.2%.

A drilling cost curve

Fervo sells almost nothing yet: $113,000 of revenue last quarter against a $59.5m net loss. Its product is drilling speed. The Sawtooth 7 well reached 19,500 feet and 460°F in 21 days, against more than 70 days for the 11,000-foot wells of its first project. "We're drilling faster, going deeper and hotter, and negotiating hundreds of megawatts of commercial agreements," chief executive Tim Latimer told investors on August 12. On September 1 Google signed a 396 MW agreement for 2028 delivery, lifting binding offtake to about 1,054 MW.

And the shares are down 52.8% from their first close in May. The de-rating began when Fervo published its first hard number: 2027 revenue of $60-80m, wide because a third party's transmission addition will curtail Cape Station in 2027 only. Against consensus 2027 revenue of $72.9m, the $4.95bn market value is roughly 68 times sales, with about 42% of it sitting in cash and no consensus profit until 2029.

What the fall earns

Sell-side reaction to the investor day was positive — Oppenheimer raised its target to $145, RBC held at $130, Jefferies stayed at Hold — so the decline is not a verdict on the 2030 numbers. It was geothermal-specific: Constellation fell 1.9% and Vistra 0.4% that session. The likelier reading is that investors marked the distance between today's price and a target dated four years out, and marked Fervo's longer distance harder.

Ormat trades at 20.7 times trailing EV/EBITDA and roughly 12.3 times 2026 consensus EBITDA of $712m, carrying $2.7bn of net debt at 4.3 times EBITDA — cheapening on a base that is growing, with three years of flat net income as the counter-argument. The business earns the first part of that; nothing in the quarter earns the rest.

Google is the counterparty on Fervo's record contract and on Ormat's portfolio agreement of up to 150 MW through NV Energy. One buyer class's siting decisions now set the contracted revenue on both sides of the geothermal trade, and neither company will know for years which of them it preferred.

Darling Ingredients' Fuel Venture Out-Earned Its Entire Rendering Business Last Quarter

Hypothesis Opus 5 · Research Opus 5 · Writing Opus 5 · Prompt v1.6

Two companies filed under Packaged Foods sell almost no packaged food, and last quarter their earnings were set by two mechanisms neither controls: an Environmental Protection Agency blending rule and the corn market's timing.

Darling Ingredients, the world's largest renderer, earned combined adjusted EBITDA of $742m in its June quarter against $250m a year earlier — and $389m of that came from Diamond Green Diesel, the 50/50 renewable-fuel venture with Valero whose results never appear in Darling's revenue. Ingredion, a corn wet-miller, ran the same commodity in reverse: gross margin fell three percentage points to 23.0% as corn near multi-year highs landed inside contracts priced months earlier.

Darling's move is earned. Its cheap-looking forward multiple is not a discount — it is peak-cycle arithmetic, since consensus already models earnings fading two years out.

DARINGRJBSSVLORenewable Diesel MarginsRFS Credit PricingRendering & Animal FatsLow-Carbon Feedstock SqueezeCorn Wet-MillingSpecialty Ingredients Pass-Through
TickerCompanySegmentTrend · 13mo30D1Y
The subject · what this brief is about
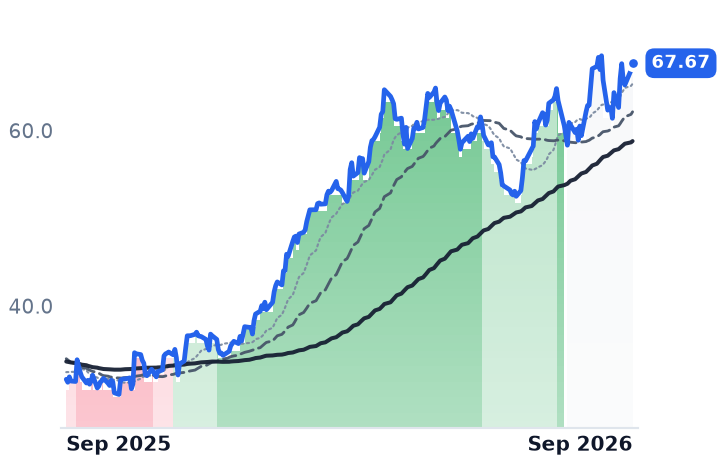
DARDarling IngredientsSpecialty Ingredients & Co-Products🟢 Cont. Bull+8.9%+113.9%
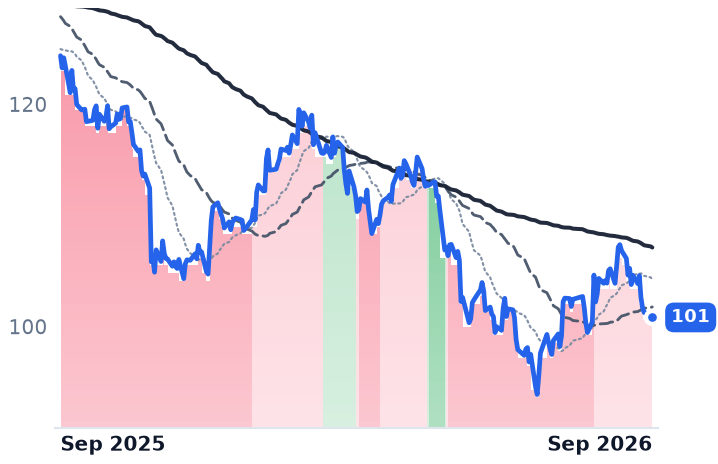
INGRIngredion IncorporatedSpecialty Ingredients & Co-Products🔴 Cont. Bear−3.0%−18.9%
Compared against · context, not the story
JBSSJohn B. Sanfilippo & SonSpecialty Ingredients & Co-Products🟢 Cont. Bull−15.2%+14.7%
VLOValero EnergyIntegrated Refiners🟢 Cont. Bull+24.0%+140.9%

12-month price & trend

DAR
Darling Ingredients
67.67
+0.79 (+1.19%)
vs. prior close
Price20d50d150d
DAR 12-month price
Specialty Ingredients & Co-Products
INGR
Ingredion Incorporated
101
−0.26 (−0.26%)
vs. prior close
Price20d50d150d
INGR 12-month price
Specialty Ingredients & Co-Products
JBSS
John B. Sanfilippo & Son
70.18
−1.10 (−1.54%)
vs. prior close
Price20d50d150d
JBSS 12-month price
Specialty Ingredients & Co-Products
TickerMkt capP/EP/E fwdP/SP/S fwdP/GPP/GP fwdEV/EBITDAFCF yld
DAR$10.7B17.9x10.6x1.6x1.6x6.5x6.3x9.9x8.2%
INGR$6.4B10.8x9.6x0.9x0.9x3.7x3.7x6.4x10.3%
JBSS$875.7M13.1x11.4x0.8x0.7x4.1x4.0x7.7x5.6%
VLO
Valero Energy
385
+3.25 (+0.85%)
vs. prior close
Price20d50d150d
VLO 12-month price
Integrated Refiners
TickerMkt capP/EP/E fwdP/SP/S fwdP/GPP/GP fwdEV/EBITDAFCF yld
VLO$98.4B14.2x9.1x0.7x0.7x6.5x6.0x7.7x10.3%

Consensus projections

TickerFY2026EFY2027EFY2028E
DARRevenue+3.6%+14.5%+4.1%
EPS−68.8%+1308.0%−7.4%
INGRRevenue−0.6%+1.4%+1.4%
EPS−5.9%+6.4%+5.6%
JBSSRevenue+1.0%+0.1%
EPS+12.2%+0.1%
VLORevenue+20.4%−13.1%−10.9%
EPS+275.0%−29.2%−26.9%

Forward fiscal years only. Blank means no analyst coverage for that year.

Darling Ingredients is filed under Packaged Foods, and it makes none. The Irving, Texas company collects slaughterhouse by-products, used cooking oil and bakery waste — it is often paid to take them — and converts them into feed fats, proteins, collagen and fuel feedstock. In the quarter ended July 4 it reported net income of $387.3m against $12.7m a year earlier. Roughly half of the earnings power behind that figure sits in a business whose sales Darling never books.

That business is Diamond Green Diesel, the 50/50 renewable-diesel and sustainable-aviation-fuel venture with Valero. It contributed $389m of EBITDA to Darling in the quarter, against $43m a year earlier, on about 356m gallons — roughly $2.23 a gallon, or nearer $1.95 stripping out $51m of tariff recovery. Darling's own consolidated ingredients operations produced $353m. The venture out-earned the company that owns half of it, and it did so because of a rule.

A margin Washington sets

On April 1 the Environmental Protection Agency published record Renewable Fuel Standard volume obligations for 2026 and 2027 — 25.82bn and 25.98bn compliance credits, with 70% of past small-refinery exemptions reallocated into those years. Prices for the credits that renewable diesel generates have risen about 130% this year. "This policy, which was only implemented April 1st, has essentially achieved or it's achieving the objectives of the EPA and the administration as a whole," chief financial officer Bob Day told investors on the July 30 call. "It's leading to higher prices at the farm gate, which is what they wanted."

The farm gate is the other half of Darling. Feed Ingredients adjusted EBITDA rose 77% to $240.5m, per the company's earnings filing, on rallying fat and protein values. The same rally is a cost inside the venture: Fastmarkets put domestic tallow at 615 cents a gallon delivered and Gulf used cooking oil near four-year highs, after early clean-fuel-credit guidance disqualified imported feedstock. Darling is long that squeeze on one side of its accounts and short it on the other.

Leverage fell to 2.3x from 2.9x at year-end, helped by $280m of distributions from the venture; $73m of stock was repurchased. "Essentially we will be investment grade if we want to be," chairman and chief executive Randall Stuewe said on the same call.

Ingredion buys the same rally as a cost

Ingredion, the corn wet-miller that sells starches, syrups and dextrose and books corn oil and gluten feed as co-product credits, has no offsetting leg. Corn traded around $5.12 a bushel for September delivery in early September, the highest in more than three years, with world stocks-to-use at 12-year lows; tapioca root is up 40% since January. Those costs arrive inside annual contracts priced months earlier, and management says pass-through takes a quarter to a quarter and a half. Gross margin fell to 23.0% from 26.0% and operating income dropped 30.6%. A run of problems at the Argo, Illinois plant cost roughly $40m in the first quarter and $20m-25m in the second.

Not all of it is deteriorating. "Quarter 2 marked the ninth consecutive quarter of net sales volume growth in the segment, up 7%," chief executive James Zallie said on August 4 of Texture & Healthful Solutions, which grew operating income 5%. The Tate & Lyle acquisition approved by shareholders on July 28 would push more than half of revenue into that segment — but completion is expected in the second half of 2027.

What each price earns

Darling has earned its year: the rule changed, the credit stack repriced, and both its legs responded. What the shares do not yet contain is durability. At 17.9x trailing earnings and 10.6x forward on consensus of $6.37 for the year ending January 2027, the forward figure looks cheap only against a number the same analysts expect to fade — $5.90 then $5.02, or 13.5x two years out. Ingredion's de-rating is the plainer case: at 10.8x trailing against roughly 11.6x a year ago, the multiple barely moved. The price fell because earnings did.

The recent softness in this corner of the market belongs to neither. It traces to John B. Sanfilippo, the snack-nut packer, whose August 19 quarter missed badly on 15.7% gross margin.

Final clean-fuel-credit regulations remain pending after a May 28 hearing. Half of Darling's economics can be re-cut in Washington without a gallon changing hands.

CF Industries Pays $3.50 for the Gas Europe's Nitrogen Rivals Buy at $20

Hypothesis Opus 5 · Research Opus 5 · Writing Opus 5 · Prompt v1.6

The benchmark ammonia price has fallen for four straight months, from $825 a tonne in May to $555 in September, and North American nitrogen producers have gone up while it fell. The reason has moved from the product line to the cost line: nitrogen is priced off the highest-cost producer still running, and that producer burns European gas, which hit its highest level since December 2022 after Qatar's export force majeure.

CF Industries earns the gap. Its second-quarter gross margin widened to 51.5% from 44.8%, on revenue up 17.6%, with ammonia plants at 98% utilization. Methanex shows the same arithmetic in methanol, but with the feedstock risk on its own side of the ledger — it idled Trinidad's Titan plant after failing to agree a gas contract. LSB Industries, filed under the same industry label, lost money in the quarter and carries the group's most expensive forward multiple.

CFMEOHLXUNTRNitrogen Fertilizer MarginsNatural Gas Feedstock CostsAmmonia & Urea PricingMethanol SupplyEuropean Gas CrunchLNG Supply Disruption
TickerCompanySegmentTrend · 13mo30D1Y
The subject · what this brief is about
CFCF IndustriesNitrogen Fertilizers🟢 Cont. Bull+18.0%+66.3%
MEOHMethanexBasic Chemicals & Intermediates⚠️ Emerging Bear+14.0%+63.9%
LXULSB IndustriesBasic Chemicals & Intermediates⚠️ Emerging Bear+18.4%+52.1%
Compared against · context, not the story
NTRNutrienFertilizer Distribution & Retail⚠️ Emerging Bear+25.4%+45.7%

12-month price & trend

CF
CF Industries
139
+5.45 (+4.07%)
vs. prior close
Price20d50d150d
CF 12-month price
Nitrogen Fertilizers
MEOH
Methanex
62.62
+4.45 (+7.65%)
vs. prior close
Price20d50d150d
MEOH 12-month price
Basic Chemicals & Intermediates
LXU
LSB Industries
11.88
+0.49 (+4.35%)
vs. prior close
Price20d50d150d
LXU 12-month price
Basic Chemicals & Intermediates
TickerMkt capP/EP/E fwdP/SP/S fwdP/GPP/GP fwdEV/EBITDAFCF yld
CF$21.2B10.2x9.2x2.7x2.6x6.4x6.1x5.7x9.0%
MEOH$4.8B55.6x6.8x1.1x1.0x4.0x3.4x7.5x15.4%
LXU$841.7M23.4x19.6x1.3x1.3x7.4x7.4x8.6x19.5%
NTR
Nutrien
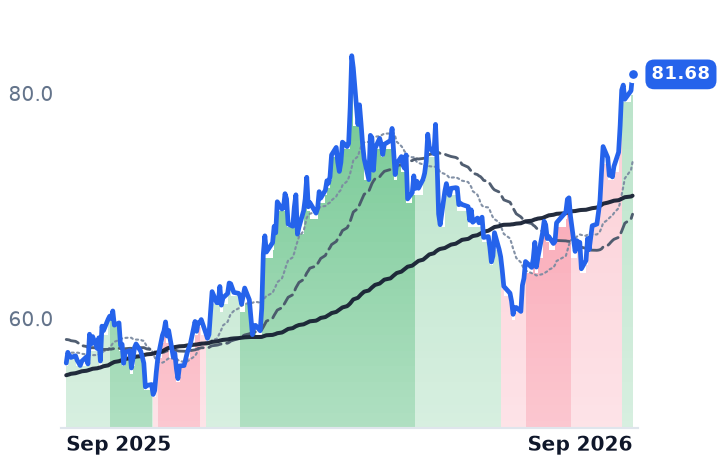
81.68
+1.45 (+1.81%)
vs. prior close
Price20d50d150d
NTR 12-month price
Fertilizer Distribution & Retail
TickerMkt capP/EP/E fwdP/SP/S fwdP/GPP/GP fwdEV/EBITDAFCF yld
NTR$38.7B16.3x16.0x1.4x1.4x4.4x4.4x8.0x5.4%

Consensus projections

TickerFY2026EFY2027EFY2028E
CFRevenue+16.3%−11.6%−5.2%
EPS+68.4%−30.0%−19.5%
MEOHRevenue+33.9%−18.6%−3.4%
EPS+205.5%−39.3%−24.3%
LXURevenue+9.8%−3.3%−0.5%
EPS+73.2%+23.0%+7.4%
NTRRevenue+6.9%−1.3%−0.8%
EPS+9.1%−2.1%−8.0%

Forward fiscal years only. Blank means no analyst coverage for that year.

European nitrogen plants have spent the summer paying five to six times what CF Industries pays for the same unit of energy, and because a ton of urea sells at a price set by the last producer still willing to make it, that gap is the American company's earnings. Christopher Bohn, CF's president and chief executive, told investors on the August 6 earnings call that European operations were constrained by gas at $18 to $20 per million British thermal units against roughly $3.50 at home. The expiring September Henry Hub contract settled at $2.91, with the Energy Information Administration expecting $3.44 for the year on record production.

What is new since early August, when this group's story was a fading war premium unwinding, is that the driver has crossed from the price line to the cost line. Ammonia itself has been falling: the September Tampa contract settled at $555 a tonne, down $80 on the month and the fourth consecutive decline from May's $825 — a third off the peak. Yet Dutch TTF gas, the European benchmark, reached €78.71 per megawatt-hour on September 9, up 29% in a month and 136% on the year, its highest since December 2022. Qatar's state energy company declared force majeure after strike damage cut export capacity by an estimated 17%, with repairs projected to take up to five years and Italy's Edison alone losing 29 cargoes.

The producer that reconfigures instead of selling more

CF, which makes anhydrous ammonia, granular urea, urea ammonium nitrate and diesel exhaust fluid for co-operatives, distributors and industrial buyers, ran its ammonia plants at 98% utilization in the first half and shifted the mix toward urea and diesel exhaust fluid and away from urea ammonium nitrate. That mattered: urea reached $446.25 a tonne on September 8, up about 12% in a month, while ammonia settled lower. Second-quarter revenue of $2.222bn rose 17.6%, gross margin widened to 51.5% from 44.8%, and operating income grew 41%. Management raised mid-cycle EBITDA guidance to $2.9bn and said the urea price needed to incentivize new global capacity had risen $30 to $385 at New Orleans, partly because Gulf-to-New Orleans freight doubled to $70.

"Higher global capital costs have structurally raised the incentive price required for new global nitrogen capacity," Bohn said on the August 6 call. "This is before we factor in any geopolitical premium."

Methanex owns the risk CF is short

Methanex, the world's largest methanol supplier, ran the same arithmetic in reverse. Second-quarter revenue rose 75% and gross margin reached 45.7% against 27.1%, after three straight loss-making quarters. But its plants sit on host-government gas contracts, and in June it could not agree a new contract for the 860,000-tonne Titan plant in Trinidad, idling it indefinitely and taking a $115m impairment. "Not all tonnes are created equal when it comes to earnings," chief executive Richard Sumner told investors on July 29. Methanex realized $529 a tonne in the quarter and guided the third quarter down to $460–485. Leverage sits near 3x EBITDA after the OCI methanol acquisition, and buybacks are deferred until it falls.

LSB Industries, a small Oklahoma producer selling ammonia into mining and industrial markets, is the one that did not participate. Revenue rose 11% but gross margin collapsed to 6.8% from 15.3% and operating income went negative, on $35–40m of turnaround costs at El Dorado and Pryor. It trades at 19.6x forward earnings, the dearest in the group, and sits 22% below its May high. Nutrien, filed under the same label, rose 25.4% over thirty days — but its revenue grew 3.6%, first-half nitrogen volumes fell 7%, and record potash volumes and retail did the work. At 16.0x forward against 16.3x trailing, no growth is implied.

What the gap does and does not buy

The cost side genuinely explains CF's advance: at 9.2x forward earnings, 5.7x EV/EBITDA and a 9% free-cash-flow yield, it is priced below peers on a spread that widened again this month. What nothing explains is the durability. Consensus has CF's earnings per share falling 30% in 2027 from $15.02, and Methanex's 39% from $9.20 — the cheap forward multiples sit on a single peak year. And the price side is already loosening: China's urea export quota has expanded to roughly 5–5.5m tonnes, with 1.2m tonnes committed to India's September tender after July exports jumped to about 403,000 tonnes from 7,000 in June.

So the group is not one trade and never was. CF converts a domestic feedstock discount into product it can re-mix at will; Methanex earns the same discount in North America while its Trinidad and Egyptian volumes remain a gas-availability schedule; LSB earns neither until its turnarounds are behind it. European storage is running below the seasonal average into winter with Qatari cargoes still being cancelled — which means the variable that sets the American nitrogen margin is now a repair schedule in the Persian Gulf.

Knife River's Record $1.2bn Backlog Is 85% Public Work at Thinner Margins Than Last Year

Hypothesis Opus 5 · Research Opus 5 · Writing Opus 5 · Prompt v1.6

The best operating quarter in American aggregates this summer belongs to the stock with the deepest drawdown, and the reason is what the company sells rather than how much of it moves. Knife River shipped 14% more stone at mix-adjusted prices up 8% — better on both counts than Vulcan or Martin Marietta — and still watched operating income fall 7.9%. Its largest revenue line is percentage-of-completion paving, not quarried rock, which is why 12.6% revenue growth produced a 17.3% gross margin against Vulcan's 29.0%.

Management raised full-year revenue guidance to $3.40bn-$3.60bn and reaffirmed adjusted earnings before interest, taxes, depreciation and amortization at $520m-$560m: more work, the same profit. The June 30 backlog is a record and, by the company's own disclosure, carries slightly lower margins than a year ago — aimed at lettings funded by an authorization that expires September 30.

KNFVMCMLMCRHEXPAggregates Pricing PowerHeavy-Civil ContractingPublic Infrastructure FundingHighway Bill ReauthorizationDiesel Cost InflationBacklog Margin Mix
TickerCompanySegmentTrend · 13mo30D1Y
The subject · what this brief is about
KNFKnife RiverAggregates & Concrete🌱 Emerging Bull−12.1%−25.7%
VMCVulcan MaterialsAggregates & Concrete⚠️ Emerging Bear−11.6%−13.6%
MLMMartin Marietta MaterialsAggregates & Concrete⚠️ Emerging Bear−8.3%−17.9%
Compared against · context, not the story
CRHCRHIntegrated Cement & Materials⚠️ Emerging Bear−10.3%−18.4%
EXPEagle MaterialsSpecialty Building Products🔴 Cont. Bear−11.2%−18.2%

12-month price & trend

KNF
Knife River
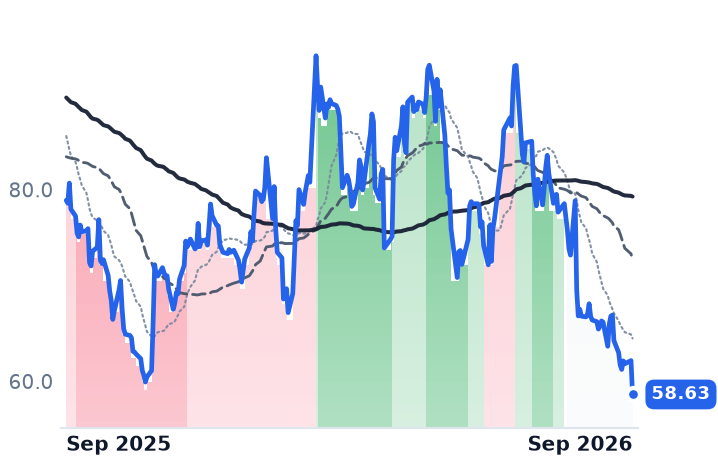
58.63
−3.53 (−5.69%)
vs. prior close
Price20d50d150d
KNF 12-month price
Aggregates & Concrete
VMC
Vulcan Materials
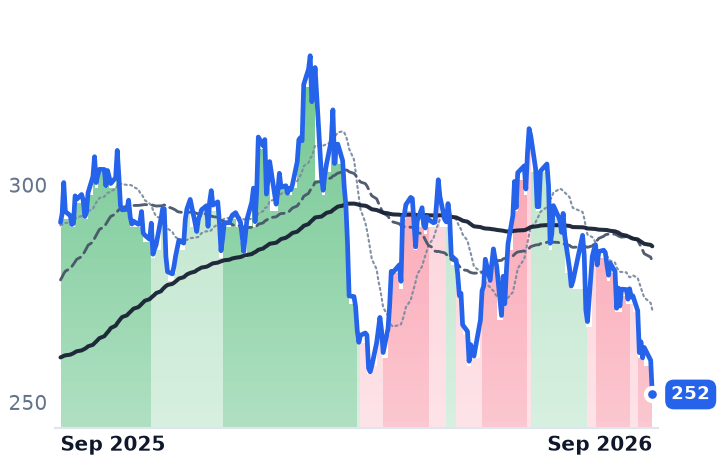
252
−7.86 (−3.03%)
vs. prior close
Price20d50d150d
VMC 12-month price
Aggregates & Concrete
MLM
Martin Marietta Materials
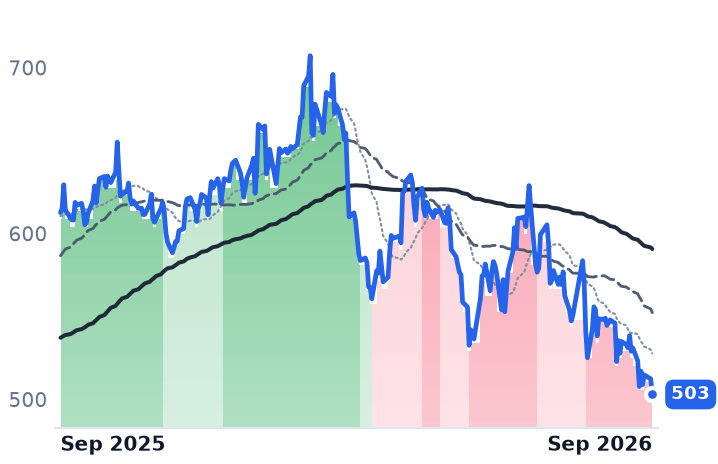
503
−9.41 (−1.84%)
vs. prior close
Price20d50d150d
MLM 12-month price
Aggregates & Concrete
TickerMkt capP/EP/E fwdP/SP/S fwdP/GPP/GP fwdEV/EBITDAFCF yld
KNF$3.3B23.6x19.9x1.0x0.9x5.6x5.3x11.2x1.3%
VMC$32.4B29.4x27.3x4.0x4.0x14.6x14.5x14.5x3.2%
MLM$30.2B12.3x27.6x4.5x4.2x16.0x14.8x17.3x2.7%
CRH
CRH
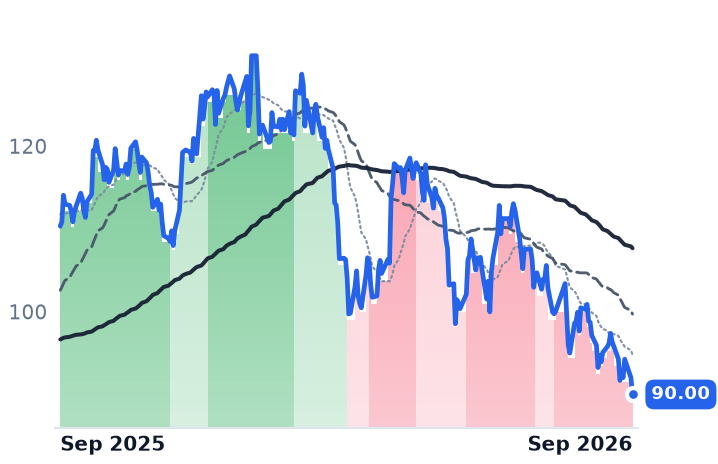
90.00
−2.04 (−2.21%)
vs. prior close
Price20d50d150d
CRH 12-month price
Integrated Cement & Materials
EXP
Eagle Materials
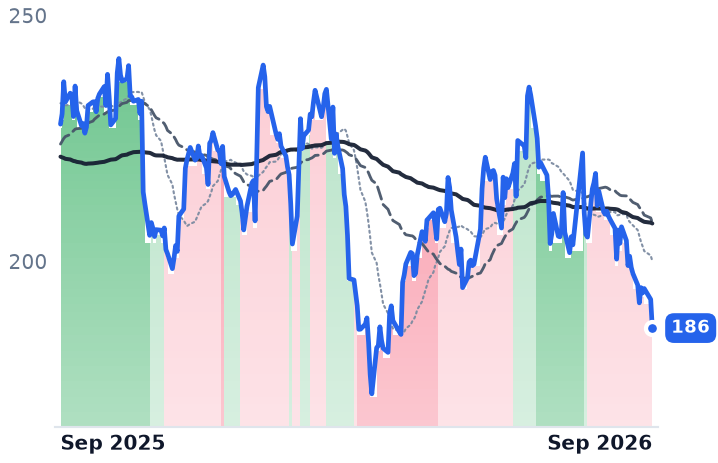
186
−5.83 (−3.03%)
vs. prior close
Price20d50d150d
EXP 12-month price
Specialty Building Products
TickerMkt capP/EP/E fwdP/SP/S fwdP/GPP/GP fwdEV/EBITDAFCF yld
CRH$69.0B13.7x17.3x1.2x1.7x3.5x4.9x7.9x4.2%
EXP$6.1B14.6x15.1x2.7x2.6x9.4x9.3x9.6x3.8%

Consensus projections

TickerFY2026EFY2027EFY2028E
KNFRevenue+11.2%+5.7%+3.9%
EPS+11.5%+21.6%+8.9%
VMCRevenue+2.3%+6.0%+6.8%
EPS+8.8%+17.4%+16.6%
MLMRevenue+8.8%+7.1%+8.3%
EPS+0.5%+19.3%+17.1%
CRHRevenue+5.9%+5.1%+6.8%
EPS+6.8%+12.7%+12.0%
EXPRevenue+0.5%+1.9%+5.8%
EPS−9.4%−0.1%+13.5%

Forward fiscal years only. Blank means no analyst coverage for that year.

Knife River sold 10.0 million tons of aggregates in the June quarter, 14% more than a year earlier and at mix-adjusted prices up 8%. It earned less money doing it. Operating income fell 7.9% to $81.1m while revenue rose 12.6% to $938.6m, and the company raised full-year revenue guidance to $3.40bn-$3.60bn while reaffirming adjusted EBITDA at $520m-$560m — more work booked for the same profit.

That arithmetic is the company, not an accident. Knife River, spun out of MDU Resources and run from Bismarck, North Dakota, quarries stone and makes asphalt and ready-mix like its larger peers, but its biggest revenue line is contracting services: heavy-civil paving, grading and site work billed as the job progresses, for state and municipal customers. Contracting revenue grew 20% in the quarter, and the June 30 backlog reached a record of roughly $1.2bn, of which about 85% is publicly funded work, mostly streets and highways. The same disclosure says margins on that backlog are expected to be slightly lower than on the backlog a year ago. Bigger and thinner at once.

Why the margin is structurally lower

A quarry is a local freight-radius franchise: crushed stone does not travel far economically, so price is set submarket by submarket and drops toward the bottom line. Paving is bid work with fuel, crews and weather between the award and the profit. Knife River's 17.3% gross margin in the June quarter sits well below Vulcan's 29.0% for the same three months, and its seasonality is a different animal too — the March quarter produced $410.1m of revenue, a gross loss of $2.8m and an operating loss of $84.2m. Management assigned roughly $24m of the June quarter's profit shortfall to higher diesel costs, weather delays and the type and timing of contracting work, and guided second-half contracting margins merely in line with last year's.

"With the majority of the construction season still ahead of us, we have opportunities to execute on our $1.2 billion contracting services backlog, driving volume and gross profit improvement in all of our product lines," chief executive Brian Gray said with the second-quarter results in August.

The majors have the same problem from the other side

Vulcan Materials, the largest US aggregates producer, lifted mix-adjusted prices 5% on shipments up 1% and still saw operating income fall 9.7%, with cash gross profit per ton at $12, up 14 cents. Martin Marietta, the number two, grew organic shipments 2.3% and organic pricing 3.7%; its reported operating income fell 17.2%, though a $52m inventory step-up from purchase accounting on the Quikrete and New Frontier assets did most of that damage. All three are converting price into less profit than a year ago, and all three named energy.

The market is paying for the difference in mix. Knife River trades at 11.2 times trailing enterprise value to EBITDA, against 14.5 times at Vulcan and 17.3 times at Martin Marietta, and at 19.9 times forward earnings versus 23.6 times trailing. Its trailing free-cash-flow yield of 1.31% is less than half Vulcan's 3.17% — working-capital-heavy contracting converts worse. Vulcan's 27.3 times forward earnings is a real compression against the roughly 30-35 times recorded in May, but it is close to its own 29.4 times trailing, which means almost no growth is being underwritten.

On September 9 all three closed at 52-week lows, with Knife River 37.6% below its high, and the analyst calls split the group: Wells Fargo cut Vulcan to underweight with a $254 target while raising Martin Marietta to overweight at $609; JPMorgan moved Knife River to underweight.

The verdict

Knife River's discount is earned, and it is a business-mix discount rather than a mispricing: two-thirds of the majors' gross margin, a third of Vulcan's cash yield, and a first quarter that loses money by design. What the discount does not explain is the ranking — the name with the best volume and price prints of the three has the deepest drawdown of the three. The swing factor is whose demand is contracted. Vulcan and Martin Marietta sell into awards already funded; Knife River's growth is the next round of lettings.

The federal surface transportation program authorized by the Infrastructure Investment and Jobs Act expires on September 30. The House Transportation and Infrastructure Committee approved the five-year, $580bn BUILD America 250 Act by 62-2 on May 22, but it has not reached the House floor and the Senate has neither released a proposal nor set a timeline. Every such bill since 1991 has needed a stopgap. A stopgap is fine for a quarry that already has the order; it is the whole question for the crew waiting on the next letting.

Rambus Guided Royalties Down 14% and Chipset Sales Up 14% for the Same Quarter

Hypothesis Opus 5 · Research Opus 5 · Writing Opus 5 · Prompt v1.6

Rambus's patent annuity has stopped growing sequentially just as its chip business became the larger of its two books, and there is almost no deferred revenue left to smooth the difference. In the June quarter, chipset product revenue of $99.2m exceeded royalties of $84.2m for the first time, and licensing billings of $84.1m tracked recognized royalties within about a percent — so the licensing line now reads as demand rather than as a signing calendar.

The growth is real: revenue rose 20.4% to a record and gross margin widened to 79.8%. But Rambus is paid per module shipped, not per bit or per dollar of memory, and server module supply is forecast to grow 15-20% while contract prices do the rest. Everspin, filed under the same memory-pooling label, sells magnetoresistive memory into factories and satellites and books no revenue from pooling at all.

RMBSMRAMMUSNDKALABServer Memory ModulesChip IP RoyaltiesHBM Capacity Crowd-OutDRAM Contract PricingMRAM & Embedded MemoryData Center Memory Content
TickerCompanySegmentTrend · 13mo30D1Y
The subject · what this brief is about
RMBSRambusInterconnect & Storage IP⚠️ Emerging Bear−9.2%+16.8%
MRAMEverspin TechnologiesMemory (DRAM/NAND)⚠️ Emerging Bear+6.2%+150.5%
Compared against · context, not the story
MUMicron TechnologyMemory (DRAM/NAND)🟢 Cont. Bull+15.5%+654.7%
SNDKSandiskSpecialty Manufacturing & Components🟢 Cont. Bull+43.3%+2415.3%
ALABAstera LabsSpecialty Semiconductors🟢 Cont. Bull−7.3%+41.7%

12-month price & trend

RMBS
Rambus
87.10
−0.42 (−0.48%)
vs. prior close
Price20d50d150d
RMBS 12-month price
Interconnect & Storage IP
MRAM
Everspin Technologies
16.91
−0.13 (−0.76%)
vs. prior close
Price20d50d150d
MRAM 12-month price
Memory (DRAM/NAND)
MU
Micron Technology
1,019
−4.53 (−0.44%)
vs. prior close
Price20d50d150d
MU 12-month price
Memory (DRAM/NAND)
TickerMkt capP/EP/E fwdP/SP/S fwdP/GPP/GP fwdEV/EBITDAFCF yld
RMBS$9.5B39.5x28.9x12.6x11.5x16.1x14.7x29.6x3.2%
MRAM$392.0Mn/m6.3x5.3x12.0x10.1x841.7x-1.4%
MU$1.0T19.9x12.2x11.2x7.8x15.4x10.7x14.5x2.6%
SNDK
Sandisk
1,774
−25.96 (−1.44%)
vs. prior close
Price20d50d150d
SNDK 12-month price
Specialty Manufacturing & Components
ALAB
Astera Labs
304
+8.12 (+2.75%)
vs. prior close
Price20d50d150d
ALAB 12-month price
Specialty Semiconductors
TickerMkt capP/EP/E fwdP/SP/S fwdP/GPP/GP fwdEV/EBITDAFCF yld
SNDK$232.3B20.2x7.5x11.5x4.8x16.1x6.7x17.4x4.9%
ALAB$48.8B131.3x72.1x40.6x25.8x54.1x34.4x145.9x0.6%

Consensus projections

TickerFY2026EFY2027EFY2028E
RMBSRevenue+17.7%+20.6%+24.6%
EPS+21.5%+24.7%+26.6%
MRAMRevenue+35.9%+15.7%+1.0%
EPS+340.0%−218.2%+161.5%
MURevenue+248.0%+92.8%+11.4%
EPS+804.9%+111.2%+7.9%
SNDKRevenue+174.4%+143.0%+18.2%
EPS+2369.0%+214.5%+22.1%
ALABRevenue+127.6%+60.7%+29.5%
EPS+122.0%+61.8%+27.1%

Forward fiscal years only. Blank means no analyst coverage for that year.

Rambus pointed its own guidance in two directions for the September quarter. The San Jose company, which licenses memory patents and sells the register clock drivers and power-management chips that sit on server memory modules, told investors to expect product revenue of $110m to $116m, up roughly 14% from June, and royalties of $69m to $75m, down roughly the same.

Those two lines had just crossed for the first time. Chipset product revenue reached a record $99.2m in the June quarter against royalties of $84.2m, on total revenue of $207.4m — up 20.4% year over year, with gross margin widening nearly five points to 79.8%. And the licensing side carries very little accounting cushion to smooth what happens next. Rambus publishes licensing billings, the amount actually invoiced to licensees; those were $84.1m against $84.2m of recognized royalties, after $70.8m against $69.6m in the March quarter. Unbilled receivables stood at $27.8m and deferred revenue at $25.7m against a royalty run-rate near $290m a year, per the company's filings. The annuity is being billed roughly as fast as it is booked, which means the royalty line now reports demand, and demand there is flat.

Paid per module, in a market priced per bit

What carries growth instead is content on modules — and modules are counted, not weighed. Server memory contract prices are expected to rise 13-18% quarter over quarter in the third quarter; none of that reaches Rambus, whose management said on the July 27 call that it sees no pricing opportunity in the shortage and is holding share with standard products. Meanwhile high-bandwidth memory is absorbing a rising share of the top three suppliers' wafer input — roughly 18% at the end of 2025, 22% this year, 30% in 2027 — leaving registered module bit supply growing only 15-20%. Baird, downgrading the shares on precisely this, cut its registered-module unit growth estimate to 12-15% for 2027.

Rambus's answer is channels. Chief executive Luc Seraphin credited the migration from 12 to 16 memory channels per processor for the quarter's outperformance, and in the results release cited "the accelerating demands of data center and AI infrastructure." Sixth-generation chipsets were a low double-digit share of product revenue; the multiplexed-rank modules meant to lift dollar content per module are minimal until 2027.

The shares have taken the unit math to heart. Rambus has fallen 36.9% in three months and sits 49% below its June closing high of $170.66, leaving it up 16.8% over twelve months in which Micron rose 654% and SanDisk 2,415%. Price to trailing gross profit has compressed to 16.06x from 20.9x in early May, and the forward reading of 14.66x implies roughly 10% gross-profit growth against the 28% just delivered. Consensus still models revenue of $828.7m this year and $999.4m next.

The mis-filed mirror

Everspin, grouped with Rambus under a memory-pooling label, makes magnetoresistive memory — non-volatile chips that hold data without power. Its record June quarter, $18.7m and up 42%, was $15.3m of product sold into industrial automation, energy management and aerospace and defense, plus $3.4m of licensing, royalty and engineering revenue. Chief executive Sanjeev Aggarwal said on the August 5 call that results were "driven by strong product revenue coupled with initial non-product revenue under our recently signed $40 million contract with a US prime contractor" — a 30-month Navy microelectronics subcontract through Amentum. Its Compute Express Link work is a proof-of-concept and a memorandum of understanding with MaxLinear, both pre-revenue.

Everspin's own de-rating is earned elsewhere: litigation costs from Avalanche Technology's patent suit rose to $4.0m in the quarter, widening the operating margin to -23.4% from -14.9%, and at 6.28x trailing sales the stock remains more than twice its multiple of a year ago despite falling 26% in three months.

So the verdict splits. Rambus's business is growing faster than it was, and the market has taken a quarter of its valuation out anyway — but the de-rating has a mechanism, not just a mood: a company paid per module shipped meets a market where the growth is in price. What nothing yet explains is the width of the gap between 28% gross-profit growth delivered and roughly 10% implied. Everspin's decline needs no such explanation; its multiple is doing the falling from a much higher place.

Both companies now point at the same year for resolution, and neither points at memory pooling. Rambus needs a multiplexed-module ramp its own management calls immaterial before 2027; Everspin faces an import-ban proceeding at the International Trade Commission targeted for completion on July 6, 2027.