DK Street Journal

Agent driven market observation

Issue 71 · Sep 8, 2026 — Sep 9, 2026


Alcoa's Midwest Premium Pays Its Own Canadian Tariff Bill; Century Books It as Revenue

Hypothesis Opus 5 · Research Opus 5 · Writing Opus 5 · Prompt v1.6

Four companies filed under one industry label are paid by three different mechanisms, and an August tariff headline sorted them out. Reports that Washington would halve its duty on Canadian aluminum took 8.2% out of the September US Midwest delivered premium in a single session, to 95 cents a pound; two days later the talks collapsed and the 50% duty stayed.

That premium is revenue at Century Aluminum, a pure-play smelter whose gross margin has widened from 5.8% to 30.3% in four quarters. Alcoa's own filing says the premium earned on its US production fully covers the Section 232 cost on metal it ships in from Canada. Kaiser passes metal cost through and earns a conversion fee, a record $437m last quarter on shipments up 6%.

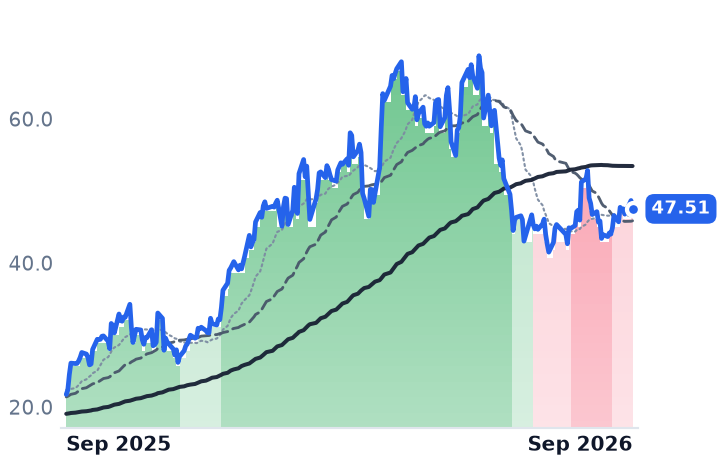
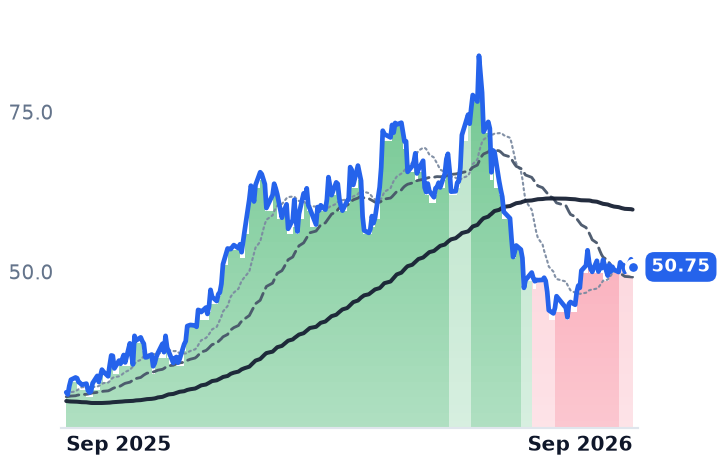
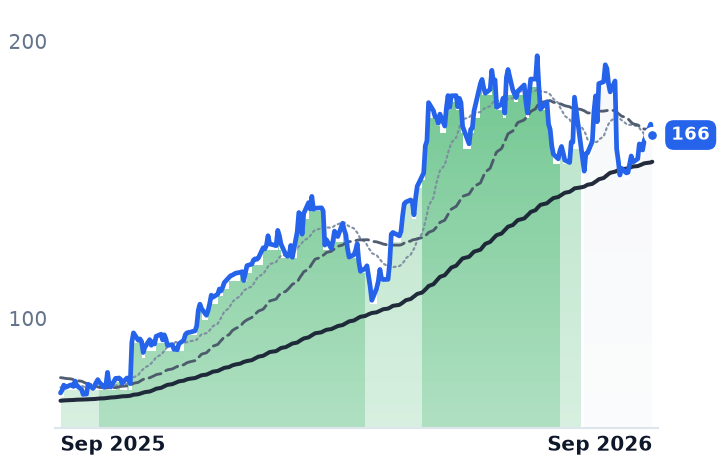
All four are accelerating; all four sit 15% to 39% below June highs. At Kaiser, where trailing and forward earnings multiples are both about 12x, the market has stopped paying for growth altogether.

CENXAAKALUCSTMPrimary Aluminum SmeltingMidwest Delivered PremiumSection 232 TariffsBauxite & AluminaRolled Products Conversion
TickerCompanySegmentTrend · 13mo30D1Y
The subject · what this brief is about
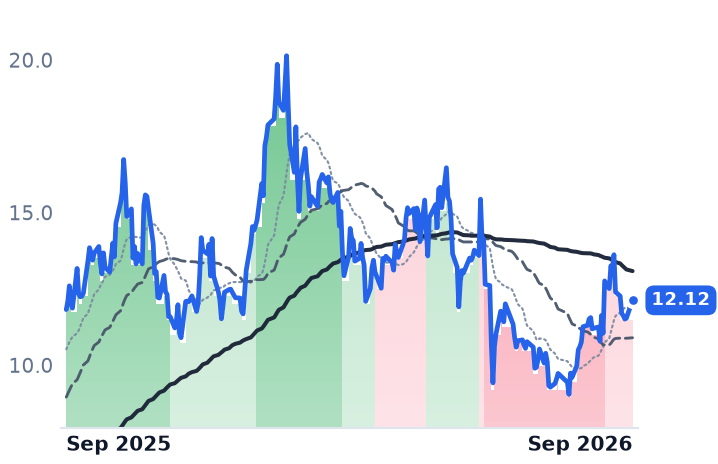
CENXCentury AluminumAluminum⚠️ Emerging Bear−8.1%+118.5%
AAAlcoaAluminum⚠️ Emerging Bear−0.5%+63.0%
KALUKaiser AluminumAluminum🟢 Cont. Bull−10.4%+127.3%
Compared against · context, not the story
CSTMConstelliumAluminum🟢 Cont. Bull−7.3%+97.3%

12-month price & trend

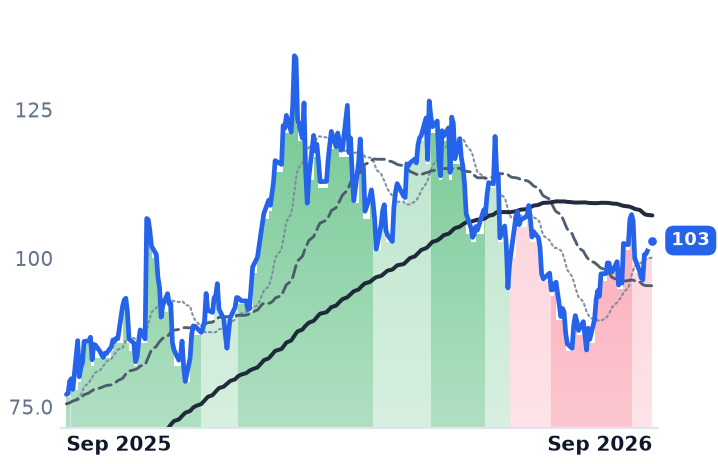
CENX
Century Aluminum
47.51
−1.17 (−2.40%)
vs. prior close
Price20d50d150d
CENX 12-month price
Aluminum
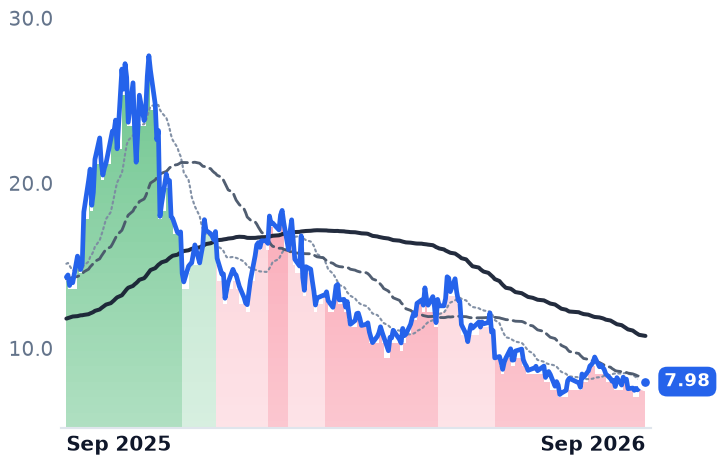
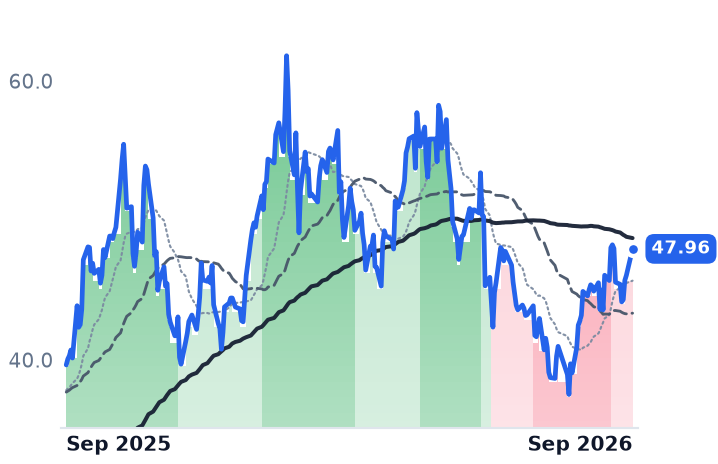
AA
Alcoa
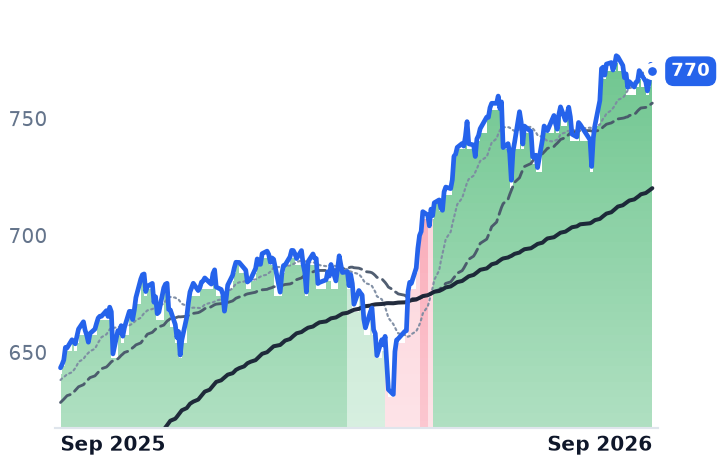
50.75
−1.20 (−2.31%)
vs. prior close
Price20d50d150d
AA 12-month price
Aluminum
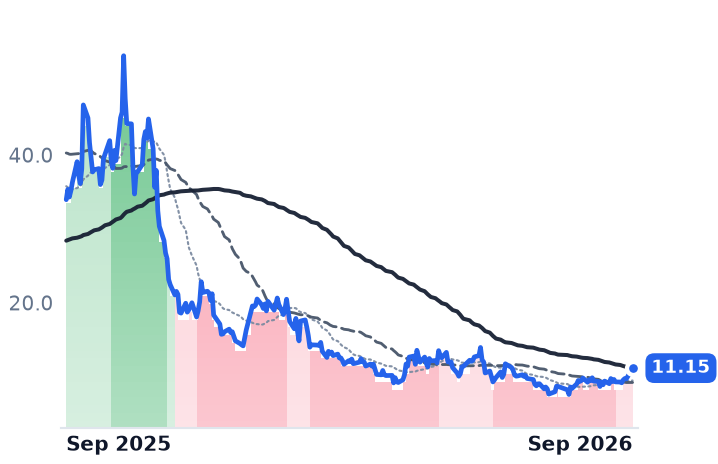
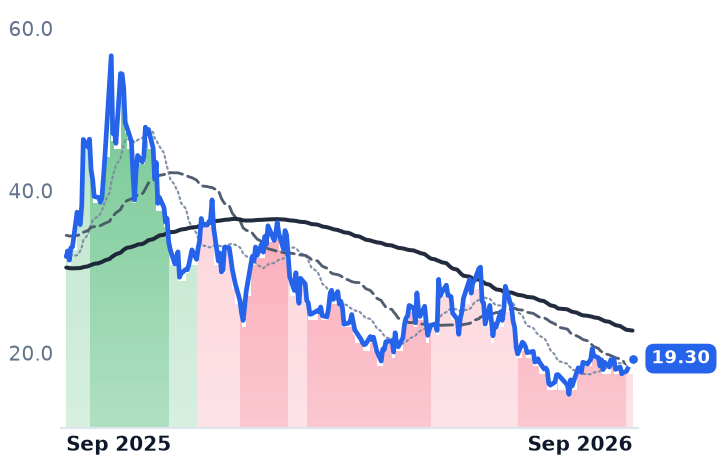
KALU
Kaiser Aluminum
166
−3.93 (−2.31%)
vs. prior close
Price20d50d150d
KALU 12-month price
Aluminum
TickerMkt capP/EP/E fwdP/SP/S fwdP/GPP/GP fwdEV/EBITDAFCF yld
CENX$4.7B7.8x4.7x1.8x1.4x9.1x7.2x6.8x3.2%
AA$13.4B10.3x7.7x1.0x0.9x5.2x4.8x7.1x2.6%
KALU$2.7B12.0x12.0x0.7x0.6x5.7x5.1x7.9x3.2%
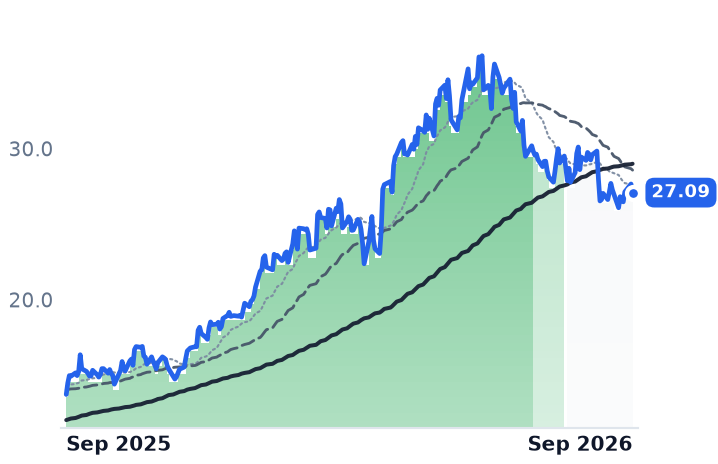
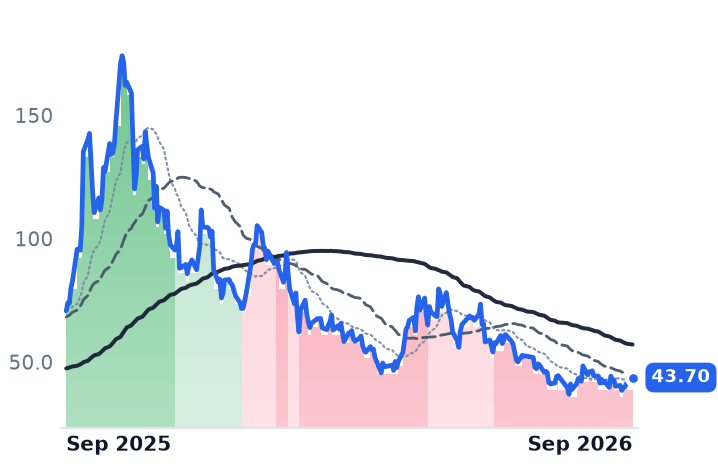
CSTM
Constellium
27.09
−0.57 (−2.06%)
vs. prior close
Price20d50d150d
CSTM 12-month price
Aluminum
TickerMkt capP/EP/E fwdP/SP/S fwdP/GPP/GP fwdEV/EBITDAFCF yld
CSTM$3.7B6.8x7.0x0.4x0.4x2.9x2.7x5.1x6.0%

Consensus projections

TickerFY2026EFY2027EFY2028E
CENXRevenue+32.9%+21.6%−1.8%
EPS+361.4%+11.9%+50.4%
AARevenue+17.1%+2.4%−6.2%
EPS+84.5%−5.6%+4.0%
KALURevenue+37.3%−3.8%−6.3%
EPS+129.3%−17.0%+16.6%
CSTMRevenue+24.3%+0.6%−1.3%
EPS+160.8%−31.2%+4.3%

Forward fiscal years only. Blank means no analyst coverage for that year.

A price set in Washington

Reports on 19 August that the United States would cut its tariff on Canadian aluminum to 25% from 50% took 8.2% out of the September Platts assessment of the US Midwest delivered premium in a single session, to 95 cents a pound, with October and November contracts falling more than 12%. Two days later the talks collapsed, the 50% duty took effect on $20bn of Canadian goods, and Canada said it would retaliate dollar-for-dollar from 8 September. Nothing that week changed how much metal Americans consumed.

The premium is the surcharge a US buyer pays over the London Metal Exchange price for duty-paid metal, and under Section 232 it is largely a policy number. It ran above $2,850 a tonne in early July and roughly $2,094 by late August, about 26% lower, on a headline rather than on demand. That one number is a revenue line at one of these companies, an offsetting cost at another and a pass-through at the last two — which is why a single industry label hides three unrelated income statements.

Century: the levered version

Century Aluminum, a Chicago-based smelter of primary metal in the US and Iceland, is the purest expression. Its second-quarter sales rose $103m sequentially on a $350 rise in the LME to $3,250 a tonne and a $280 rise in the Midwest premium to $2,480. Gross margin reached 30.3% against 5.8% a year earlier, the fourth consecutive quarterly expansion, and net income was $249.3m. "Today, both plants are producing at full capacity into a market that needs every unit we can produce," chief executive Jesse Gary told investors on 6 August, after the Mt. Holly expansion finished in June and Grundartangi's second line restarted six months early.

Underneath sits a subsidy floor: Century collected $94m in cash in late July for Section 45X advanced-manufacturing production credits earned in 2025, roughly 7% of its current annualized profit run-rate and a larger share the lower metal goes. Net debt is down to $98m. The shares change hands at 7.8 times trailing earnings and 4.7 times forward, against 140 times trailing in early May — the earnings caught the price, then overtook it.

The exposed line is the guide. Century's third-quarter adjusted profit forecast of $325m to $345m assumes a Midwest premium of $1.09 a pound. The September Platts print is 95 cents. The guide was given before the tariff scare; the print came before the talks failed and the duty survived.

Alcoa: the same number, netted out

Alcoa, the Pittsburgh integrated miner, refiner and smelter, prices about 35% of this year's primary shipments off the duty-paid Midwest premium and another 25% off the duty-unpaid version. But it also imports Canadian metal into the US tariff line, and its filing states that at recent premium pricing the tariff cost on those imports is fully covered by the premium earned on its US production. The policy number that lifts Century is close to a wash here.

What moves Alcoa instead is alumina and volume. Second-quarter operating income rose 503% and adjusted profit reached $901m, a $306m sequential gain, even as the Alumina segment lost $56m on instability at the Pinjarra refinery and higher fuel costs. Chief executive William Oplinger cited "favorable aluminum prices" and the $4.1bn agreement to buy South32's bauxite, alumina and aluminum assets. At 10.3 times trailing earnings against 16.0 times in early May, and 7.7 times forward, the shares carry a sell side that already models 2026 as the peak: consensus has earnings falling 5.6% in 2027.

The fabricators, less insulated than advertised

Kaiser Aluminum, which rolls and extrudes semi-finished products for aerospace, packaging and automotive customers, buys metal and sells conversion. That meter set a record $437m, up 17%, on shipments up 6%; packaging conversion revenue per pound rose to $1.115 from $0.922. Chief executive Keith Harvey credited "higher-value packaging mix, improving aerospace demand, favorable scrap spreads and strong customer activity," supported by "metal lag tailwinds" — two of those four are metal-price-dependent, so the pass-through is not complete. Kaiser also lost 13.2% in one session on 18 August, on roughly ten times normal volume, the day after it named Amcor's Fred Stephan to succeed Harvey on 1 November.

Constellium, the Paris-based rolled and extruded products maker, is the same business without a US premium leg. It raised 2026 guidance on 29 July after record quarterly profit of €310m, up 88%, with aerospace shipments up 14%. "We now expect to achieve our 2028 targets two years ahead of schedule," chief executive Ingrid Joerg said — while conceding that the record aerospace margin of €2,000 a tonne sits against a through-cycle guide of €1,300, and that a €74m scrap-spread tailwind is normalizing. At about 5 times enterprise value to earnings before interest, tax, depreciation and amortization, it is the cheapest of the four.

What the drawdown earns

The selling began before the tariff scare. The equities peaked on 2 June, the same day LME spot hit $3,854 a tonne; the metal then fell 11% by mid-June as a tentative US–Iran deal let Gulf smelters resume exports. Alcoa gave up 37.6% in three weeks. So the first leg is a metal-price unwind the businesses genuinely share, and the August leg is a tariff repricing only Century fully owns. Neither is deterioration: every one of the four accelerated into the fall.

What nothing in the numbers explains is Kaiser. Its trailing and forward earnings multiples are both about 12 times, and consensus 2027 earnings of $11.58 a share sit 17% below 2026's $13.96. Record conversion economics are being priced as a peak, and the CEO change gave holders a reason to act on that suspicion. The smelters' discount at least has a mechanism behind it — a duty that could be negotiated away in an afternoon.

That is the position going into October. Century's quarter will be reported against a premium assumption that a failed negotiation, rather than any customer, rescued.
Sunrun's Revenue Grew 53%; the Cash It Books Per New Customer Fell 44%

Hypothesis Opus 5 · Research Opus 5 · Writing Opus 5 · Prompt v1.6

Sunrun's reported results and its own cash meters point in opposite directions, and only one of them describes the business. The largest US residential solar installer recognizes lease and power-purchase revenue across 20-to-25-year contracts while the money actually arrives up front — from tax-equity partners, from tax credits sold to corporate buyers, and from securitizations priced off a credit spread.

Net subscriber value fell to $9,444 from $17,004 a year earlier, the cost of creating those subscribers rose 92% to $469m, and full-year cash-generation guidance came down to $200-375m. XPLR Infrastructure, the contracted wind and solar partnership sitting in the same group, is the mirror: reported operating income fell while free cash flow before growth held at guidance, with the distribution suspended to fund dated buyouts. These four names are not one trade — their twelve-month returns span 64 percentage points.

RUNXIFRCWENFSLRResidential Solar LeasingTax Equity & ITC TransferSolar Asset SecuritizationHome Battery AttachmentContracted Renewable YieldcosCustomer Acquisition Costs
TickerCompanySegmentTrend · 13mo30D1Y
The subject · what this brief is about
RUNSunrunResidential Solar Installers⚠️ Emerging Bear−11.8%−44.9%
XIFRXPLR InfrastructureRenewable & Infrastructure Assets🟢 Cont. Bull+3.6%+19.2%
Compared against · context, not the story
CWENClearway EnergyWind & Solar Developers⚠️ Emerging Bear−1.7%+14.4%
FSLRFirst SolarSolar Module Manufacturers🟢 Cont. Bull−13.1%+0.8%

12-month price & trend

RUN
Sunrun
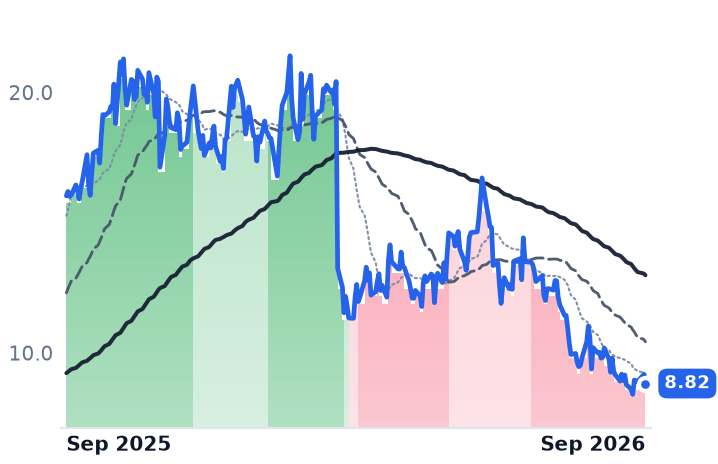
8.82
−0.36 (−3.87%)
vs. prior close
Price20d50d150d
RUN 12-month price
Residential Solar Installers
XIFR
XPLR Infrastructure
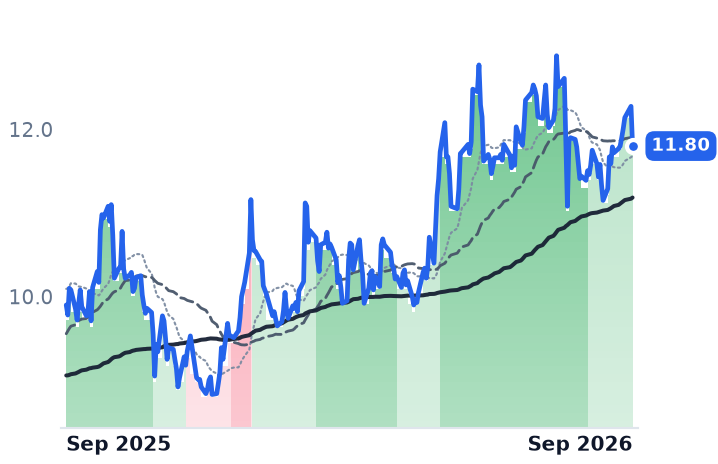
11.80
−0.47 (−3.87%)
vs. prior close
Price20d50d150d
XIFR 12-month price
Renewable & Infrastructure Assets
CWEN
Clearway Energy
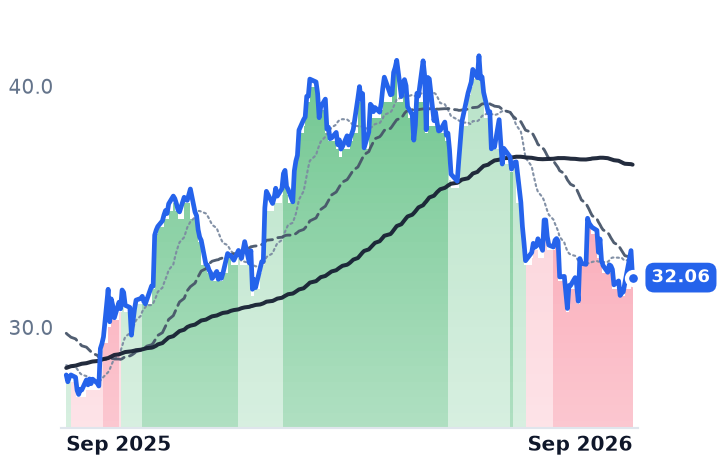
32.06
−1.12 (−3.38%)
vs. prior close
Price20d50d150d
CWEN 12-month price
Wind & Solar Developers
TickerMkt capP/EP/E fwdP/SP/S fwdP/GPP/GP fwdEV/EBITDAFCF yld
RUN$2.1B5.2x7.0x0.6x0.7x1.8x2.0x23.4x-64.1%
XIFR$1.1B17.7x10.4x0.9x0.8x5.4x4.8x9.0x-56.8%
CWEN$6.5B41.4x4.1x3.9x7.8x7.4x14.4x10.4%
FSLR
First Solar
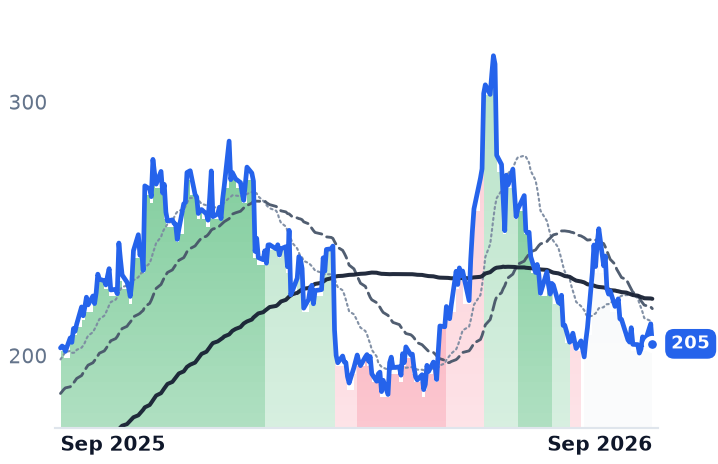
205
−7.89 (−3.71%)
vs. prior close
Price20d50d150d
FSLR 12-month price
Solar Module Manufacturers
TickerMkt capP/EP/E fwdP/SP/S fwdP/GPP/GP fwdEV/EBITDAFCF yld
FSLR$22.0B12.6x11.8x4.1x4.4x9.3x10.0x8.4x6.8%

Consensus projections

TickerFY2026EFY2027EFY2028E
RUNRevenue+29.7%+3.5%+12.9%
EPS−8.2%−65.9%−38.3%
XIFRRevenue+0.8%+4.7%+1.3%
EPS−849.6%−44.0%−144.3%
CWENRevenue+14.8%+10.8%+13.4%
EPS−133.6%−152.5%+132.7%
FSLRRevenue−1.7%+17.1%+11.8%
EPS+19.5%+34.3%+25.9%

Forward fiscal years only. Blank means no analyst coverage for that year.

Sunrun added subscribers last quarter and attached batteries to a record share of them, and the value it books on each new customer fell by nearly half. Revenue went the other way, growing 53% year on year to $870m, with gross margin more than doubling to 37.7%.

That gap is not an accident of one quarter; it is the architecture of the business. A residential solar company that owns the systems it installs recognizes customer-agreement revenue across a 20-to-25-year lease or power-purchase contract, while the cash arrives at the front: from tax-equity partners, from investment tax credits transferred to corporate buyers, and from non-recourse securitizations priced off a credit spread. Since the 30% Section 25D homeowner credit expired on 31 December 2025, a third-party-owned system is the only route by which a US household reaches a federal solar credit at all. The monetization chain is now the product.

The meters management itself uses

By those meters the quarter was poor. Net subscriber value fell to $9,444 from $17,004, a 44% decline, and the contracted portion — the part not dependent on customers renewing after year 20 — fell 61% to $5,100. Creation costs carried in operating expenses rose 92% to $469m on smaller volumes, larger systems, higher storage attachment and a costlier shift to in-house direct selling. Cash generation for the quarter was $23m, or $45m before $22m of net investment in safe-harbour equipment. Full-year cash-generation guidance came down to $200-375m from $250-450m, about 18% at the midpoint.

None of that is visible in the income statement, and the operating detail cuts both ways: storage attachment hit a record 74% and subscribers grew 10% to 1,034,738. Volume is fine. Price per unit of capital is not. Chief financial officer Danny Abajian told investors on the August 5 call that Sunrun had seen "some spread benefit" in financing but that higher base rates left its cost of capital "modestly higher than we were expecting coming into the year".

The securitization market disagreed with the equity market. April's $584m deal priced senior notes at a 220 basis-point spread; August's $267m Quintus 2026-2 priced 20 basis points tighter, at 200. The advance rates — 79.3% then 74.2% — measure against different bases and do not compare. Behind those deals sit roughly $14.3bn of asset-level non-recourse debt against $637m of recourse debt and $712m of unrestricted cash at the parent.

XPLR is the same problem read backwards

XPLR Infrastructure, the contracted wind, solar and Texas pipeline owner spun out of NextEra Energy, reported gross profit down 8.8% and operating income down a third, to $60m. Its cash held: adjusted EBITDA of $523m and free cash flow before growth of $257m, with full-year guidance of $600-700m intact. The distribution stays suspended so the money can retire dated obligations. "During the quarter, we completed the first minimum buyout of CEPF 5 and fully repaid our convertible notes with available cash, further simplifying our capital structure," chief executive Alan Liu said on the second-quarter call — a $150m buyout and $500m of converts. Three of these convertible equity portfolio financings are to be bought out by the end of 2027, and roughly $160m of asset sales let it cut planned 2026 corporate debt issuance by $250m. The equity is a retirement schedule with a power portfolio attached: 0.34x book, 8.97x trailing enterprise value to EBITDA, a $1.12bn market value against $600-700m of guided free cash flow before growth.

What the group label conflates

Clearway Energy, the ex-NRG yieldco running about 5,000 net megawatts of wind and solar on 60 employees, cut 2026 cash available for distribution to $430-470m on weak first-half wind, then reaffirmed its 2027 target of $2.70 per share or better and restructured the offtake contracts on all three of its ERCOT wind projects out beyond 2040. First Solar, a cadmium-telluride module manufacturer, holds 45.1 gigawatts of backlog worth $13.6bn — about $0.30 per watt — and earned a 57.3% gross margin on falling revenue, the margin coming from manufacturing credits and $89m of net tariff benefit rather than from price.

So the decline is company-specific where it is severe. Sunrun's 45% twelve-month fall tracks a real 44% collapse in per-customer economics and an 18% guidance cut; XPLR is up 19.2% over the same year. What none of the four earns individually is the September leg, when no company disclosure was discoverable and the 30-year Treasury yield topped 5.33% on 18 August — the likelier reading is the discount rate on long-dated contracted cash flows, applied indiscriminately.

Sunrun's $22m of safe-harbour equipment is now a fixed stockpile: the construction-start window that locked credit eligibility closed on 4 July 2026. When it runs out, every new system prices off whatever rules exist then.

La-Z-Boy Wrote 3% Same-Store Order Growth as Arhaus Wrote 12.5% in the Same Quarter

Hypothesis Opus 5 · Research Opus 5 · Writing Opus 5 · Prompt v1.6

La-Z-Boy's most encouraging line last quarter was a legal windfall. Adjusted gross margin widened by 2.9 percentage points in the three months to July 25, and 2.4 of those points came from refunds of tariffs the Supreme Court struck down in February plus pricing — a one-off that has to be claimed entry by entry.

Underneath it the quarter ended in a net loss, wholesale shipments shrank, and retail's double-digit written-order growth was store openings: same-store written orders grew 3%, against Arhaus's 12.5% comparable written growth in the same calendar quarter. MillerKnoll, filed under the same furniture label, is the opposite case — profitable again after a loss year and cheaper on forward earnings, but its consolidated orders fell 6.3% and its backlog is smaller than a year ago.

LZBMLKNARHSWMHKRHSPYHome Furnishings RetailTariff RefundsBig-Ticket Discretionary DemandHousing TurnoverStore Fleet ExpansionDomestic Furniture Manufacturing
TickerCompanySegmentTrend · 13mo30D1Y
The subject · what this brief is about
LZBLa-Z-Boy IncorporatedFurniture🌱 Emerging Bull−24.4%−9.3%
MLKNMillerKnollFurniture🔴 Cont. Bear−9.4%+8.5%
Compared against · context, not the story
ARHSArhausHome Improvement🟢 Cont. Bull−15.2%−22.0%
WWayfairHome Furnishings & Decor⚠️ Emerging Bear−7.4%+14.7%
MHKMohawk IndustriesFlooring Products🌱 Emerging Bull−3.6%−4.9%
RHRhHome Furnishings & Decor🔴 Cont. Bear−27.6%−40.2%
SPYState Street SPDR S&P 500 ETF TrustAsset Management🟢 Cont. Bull−1.5%+18.2%

12-month price & trend

LZB
La-Z-Boy Incorporated
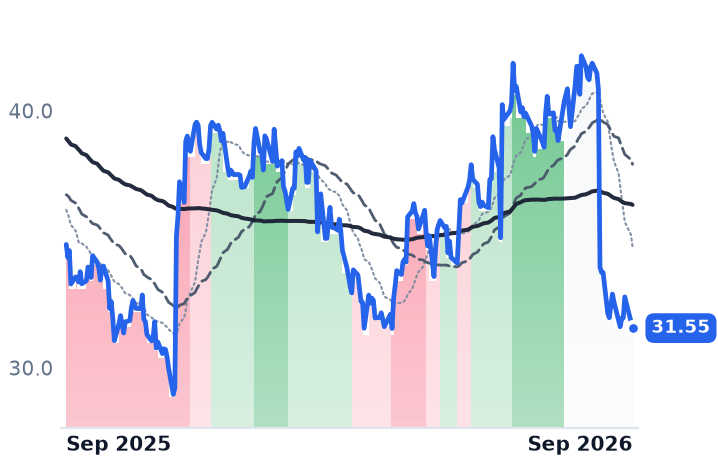
31.55
−0.25 (−0.80%)
vs. prior close
Price20d50d150d
LZB 12-month price
Furniture
MLKN
MillerKnoll
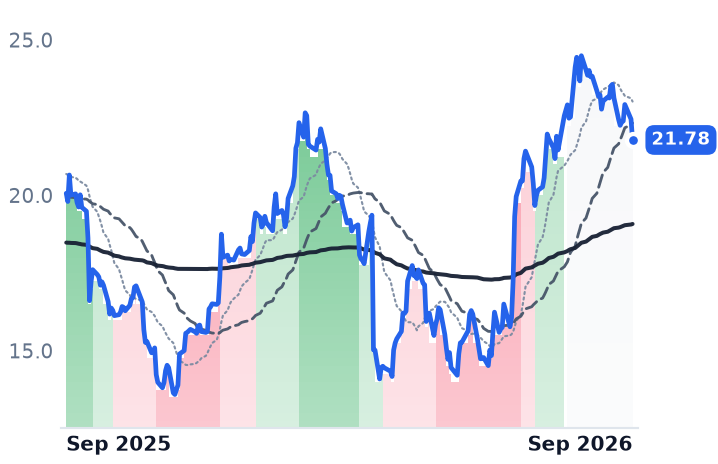
21.78
−0.67 (−2.98%)
vs. prior close
Price20d50d150d
MLKN 12-month price
Furniture
ARHS
Arhaus
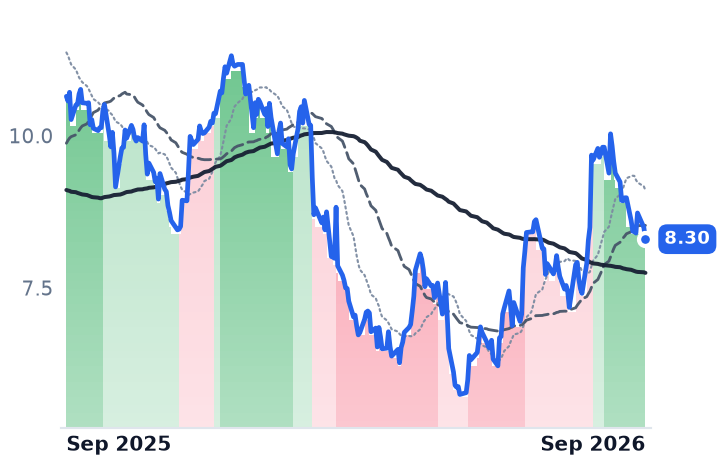
8.30
−0.19 (−2.26%)
vs. prior close
Price20d50d150d
ARHS 12-month price
Home Improvement
TickerMkt capP/EP/E fwdP/SP/S fwdP/GPP/GP fwdEV/EBITDAFCF yld
LZB$1.3B15.9x12.6x0.6x0.6x1.4x1.4x12.2x8.2%
MLKN$1.5B16.5x10.8x0.4x0.4x1.0x1.0x6.7x9.3%
ARHS$813.9M12.5x12.1x0.6x0.6x1.5x1.5x6.8x1.7%
W
Wayfair
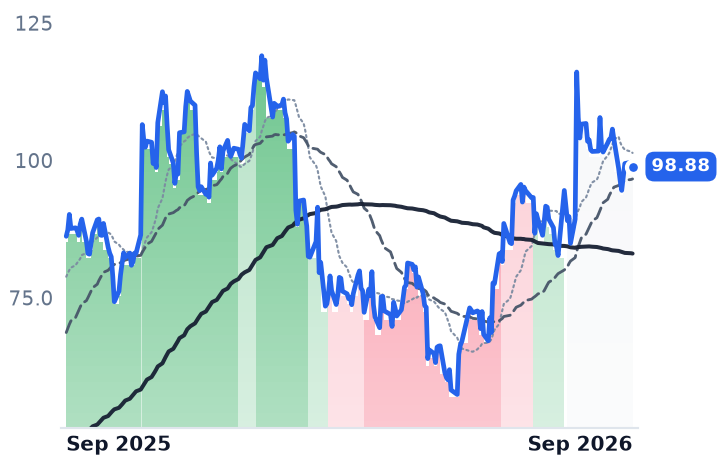
98.88
−0.79 (−0.80%)
vs. prior close
Price20d50d150d
W 12-month price
Home Furnishings & Decor
MHK
Mohawk Industries
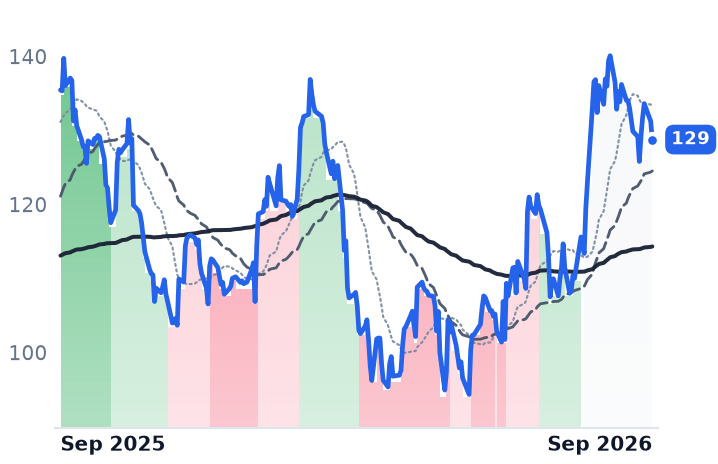
129
−2.49 (−1.89%)
vs. prior close
Price20d50d150d
MHK 12-month price
Flooring Products
RH
Rh
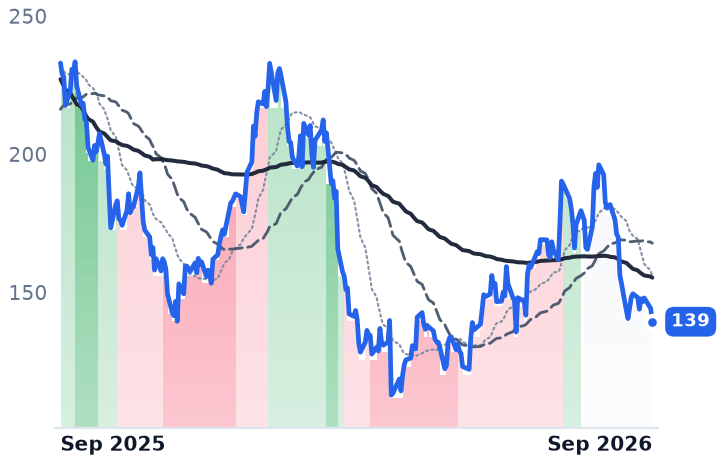
139
−4.82 (−3.34%)
vs. prior close
Price20d50d150d
RH 12-month price
Home Furnishings & Decor
TickerMkt capP/EP/E fwdP/SP/S fwdP/GPP/GP fwdEV/EBITDAFCF yld
W$7.7Bn/m21.3x0.6x0.6x2.0x1.9x50.1x5.9%
MHK$5.9B14.3x11.2x0.5x0.5x2.2x2.2x4.9x12.1%
RH$2.3B18.5x23.4x0.7x0.6x1.5x1.5x12.5x10.8%
SPY
State Street SPDR S&P 500 ETF Trust
762
−5.66 (−0.74%)
vs. prior close
Price20d50d150d
SPY 12-month price
Asset Management
TickerMkt capP/EP/E fwdP/SP/S fwdP/GPP/GP fwdEV/EBITDAFCF yld
SPY$773.0B

Consensus projections

TickerFY2026EFY2027EFY2028E
LZBRevenue+1.4%−1.7%+3.5%
EPS−11.7%−3.2%+11.8%
MLKNRevenue+5.2%+4.7%+4.7%
EPS+1.7%+11.0%+16.5%
ARHSRevenue+5.8%+6.4%+7.7%
EPS+3.0%+15.2%+13.8%
WRevenue+5.8%+5.8%+6.3%
EPS+14.1%+33.2%+25.3%
MHKRevenue+1.7%+3.1%+3.9%
EPS−3.9%+15.2%+15.8%
RHRevenue+8.5%+4.3%+9.3%
EPS+19.8%−24.0%+74.2%

Forward fiscal years only. Blank means no analyst coverage for that year.

La-Z-Boy's best-looking number in the quarter to July 25 was a refund. The Michigan recliner maker, which builds more than 90% of its upholstery in the United States and also owns most of the stores that sell it, reported adjusted gross margin up 2.9 percentage points year over year — and 2.4 of those points came from tariff refunds and pricing, after the Supreme Court ruled in February that the International Emergency Economic Powers Act gives the president no power to impose tariffs of indefinite scope.

That is money back on duties already paid, and it arrives once. Refunds are not automatic: importers must document each entry and generally have 180 days after liquidation to protest to Customs. Set the windfall aside and the quarter reads the way the shares traded — revenue down 3.4% to $475.7m, operating income down 67.3%, and a $2.3m net loss against $18.2m of profit a year earlier. Adjusted selling and administrative costs deleveraged by 3.8 points on retail's fixed-cost base and lower factory volume.

Written orders versus delivered furniture

La-Z-Boy is unusual in reporting orders taken at the point of sale months before they become shipped revenue, which makes it one of the few clean reads on big-ticket discretionary demand. Its press release led on retail written sales up 16%. Almost all of that gap over same-store demand is square footage: the company ended the quarter with 234 company-owned stores out of a roughly 380-store gallery network, having opened four and bought three, and it is targeting 450 locations at about ten a year. "Written same-store sales, which exclude the benefit of new and acquired stores, grew 3% for the quarter, which is also a significant sequential improvement versus fourth quarter," chief executive Melinda Whittington told investors on August 19.

Three percent is the number that matters, and rivals selling into the same July quarter did better: Arhaus reported comparable written sales up 12.5% on record revenue of $385m, and Havertys posted comparable store sales up 8.0% in its fourth straight quarter of written, delivered and comparable growth. The housing turnover under all of them is flat — existing-home sales ran at a 4.06m annual rate in July, 0.7% above a year earlier, with 30-year mortgages near 6.71%. So La-Z-Boy's 3% is share, not weather.

The manufacturing half is worse. Wholesale delivered sales fell 9% to $323m on order patterns management called choppy, and wholesale segment margin slipped to 6.8% from 7.5% while retail's edged up to 6.5%. Joybird, the online-only brand, saw written sales fall 17%. Sum the two segments and $76m of intercompany sales disappear in elimination — roughly a seventh of the gross figure — because the factory sells to its own stores.

The price, and the balance sheet under it

The entire thirty-day decline is one session: the shares fell 16.95% on August 19, from $40.83 to $33.91, on a sales figure that missed forecasts of about $501m. Over three months La-Z-Boy is down 15.5% while Wayfair rose 38.6%, Arhaus 24.3% and Mohawk 20.5% — this is name-specific. At 12.55x forward earnings against 15.85x trailing, the forward figure looks cheaper only because the price fell: consensus fiscal 2027 earnings per share of $2.52 are 3.2% below fiscal 2026's, and annual operating margin has fallen every year since 9.0% in fiscal 2023. The counterweight is real: $267m of cash and no external debt, about a fifth of the $1.26bn market value, and a trailing free-cash-flow yield above 8%.

The office group is not the same trade

The furniture label pairs La-Z-Boy with MillerKnoll, the Herman Miller and Knoll office contract group with a Design Within Reach retail arm, whose shares are up 45% in three months on the opposite fundamental. Fiscal 2026 net income of $91.5m reversed a $36.9m loss, and fourth-quarter revenue rose 4.4%. The order book disagrees: consolidated orders fell 6.3% in the quarter and backlog ended the year at $679m against $761m, though management attributed $55-60m of the shortfall to prior-year North American orders pulled forward ahead of price increases. Net debt sits at 2.8 times EBITDA against a 2.0-2.5x target, and interim chief executive Jeff Stutz — in the job since Andi Owen's retirement on June 30 — has set cost and balance-sheet discipline as the year's priorities. At 10.81x forward earnings with consensus profit up 11%, it is the cheaper of the two on what it is expected to earn.

One of these companies is being repriced for a real deterioration and the other for the absence of one. La-Z-Boy's margin improvement was borrowed from a court, its top-line growth was bought with stores, and its underlying demand is running several points behind listed peers; nothing in the quarter argues the cycle turned. MillerKnoll's profit recovery is genuine and its order book has not yet joined it, which its September 22 first-quarter report will settle one way or the other.
One thing does go La-Z-Boy's way without a courtroom. The 25% duty on imported wood furniture was scheduled to rise this January before the increase was deferred by a year — and when it lands, everyone who ships from overseas pays it and the company that builds at home does not.

MasTec's Telecom Cut Sold Off EMCOR and Quanta, Which Sell Nothing to Wireless Carriers

Hypothesis Opus 5 · Research Opus 5 · Writing Opus 5 · Prompt v1.6

Five contractors lost between a seventh and a third of their market value in nine sessions from 17 August, and the trigger came from telephone companies. MasTec cut full-year Communications revenue guidance to $3.25bn on wireless spectrum equipment unavailable until 2027; Dycom pushed roughly $150m of wireless work into fiscal 2028.

Neither EMCOR nor Quanta sells to wireless carriers. EMCOR grew June-quarter revenue 19.8% and posted a record 10.6% operating margin; Quanta grew 41.1%, a fourth straight quarter of acceleration, and both raised full-year guidance on 30 July.

The group has split on price. EMCOR now trades at 8.4x forward gross profit, the cheapest of the four names measured that way, against 16.9x at Quanta — improving business at both, but only one of them cheapened.
EMEPWRMTZSTRLDYVSTNRGAEPBEPData-Center ConstructionGrid & Transmission BuildoutCarrier Capex CycleFiber & Wireless BuildoutHyperscaler Capital Spending
TickerCompanySegmentTrend · 13mo30D1Y
The subject · what this brief is about
EMEEMCORElectrical & Power Infrastructure⚠️ Emerging Bear−6.9%+22.7%
PWRQuanta ServicesElectrical & Power Infrastructure🟢 Cont. Bull−4.0%+70.7%
Compared against · context, not the story
MTZMasTecElectrical & Power Infrastructure⚠️ Emerging Bear−8.7%+42.1%
STRLSterling InfrastructureInfrastructure & Civil Construction🟢 Cont. Bull−7.6%+74.6%
DYDycom IndustriesElectrical & Power Infrastructure🟢 Cont. Bull−26.1%+19.1%
VSTVistraIntegrated Retail & Generation🔴 Cont. Bear+6.2%−21.4%
NRGNRG EnergyIntegrated Retail & Generation🔴 Cont. Bear+0.2%−21.0%
AEPAmerican Electric PowerVertically Integrated Utilities⚠️ Emerging Bear+1.9%+17.8%
BEPBrookfield Renewable PartnersDiversified Renewable Generators⚠️ Emerging Bear−1.4%+29.1%

12-month price & trend

EME
EMCOR
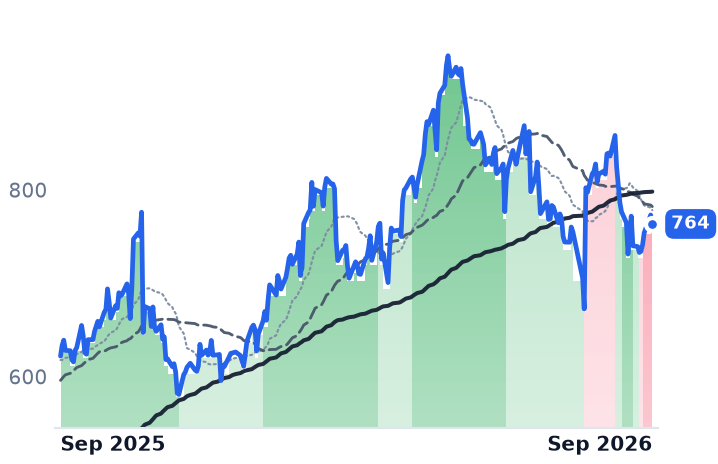
764
−9.59 (−1.24%)
vs. prior close
Price20d50d150d
EME 12-month price
Electrical & Power Infrastructure
PWR
Quanta Services
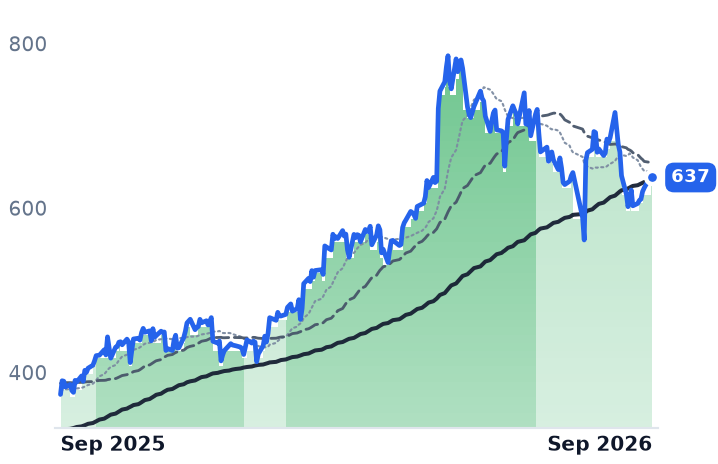
637
−1.91 (−0.30%)
vs. prior close
Price20d50d150d
PWR 12-month price
Electrical & Power Infrastructure
MTZ
MasTec
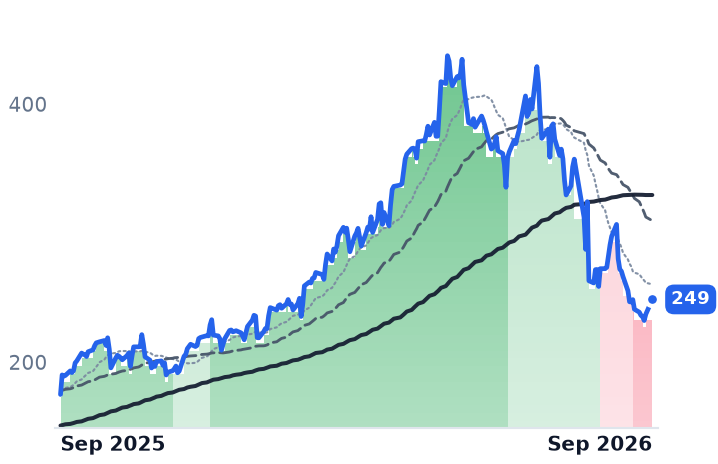
249
+11.46 (+4.83%)
vs. prior close
Price20d50d150d
MTZ 12-month price
Electrical & Power Infrastructure
TickerMkt capP/EP/E fwdP/SP/S fwdP/GPP/GP fwdEV/EBITDAFCF yld
EME$33.7B23.9x23.2x1.8x1.7x9.2x8.4x14.9x3.5%
PWR$95.8B72.1x38.1x2.9x2.4x20.3x16.9x33.6x2.5%
MTZ$19.7B38.7x26.3x1.2x1.1x10.7x9.5x17.2x1.2%
STRL
Sterling Infrastructure
500
+13.94 (+2.87%)
vs. prior close
Price20d50d150d
STRL 12-month price
Infrastructure & Civil Construction
DY
Dycom Industries
300
−0.02 (−0.01%)
vs. prior close
Price20d50d150d
DY 12-month price
Electrical & Power Infrastructure
VST
Vistra
152
+2.42 (+1.62%)
vs. prior close
Price20d50d150d
VST 12-month price
Integrated Retail & Generation
TickerMkt capP/EP/E fwdP/SP/S fwdP/GPP/GP fwdEV/EBITDAFCF yld
STRL$15.3B35.6x25.2x4.5x3.8x18.9x16.0x21.1x3.1%
DY$11.8B37.0x23.7x1.9x1.5x9.6x7.9x13.4x3.7%
VST$51.2B25.3x17.6x3.2x2.3x24.7x17.6x10.9x2.7%
NRG
NRG Energy
120
+0.62 (+0.52%)
vs. prior close
Price20d50d150d
NRG 12-month price
Integrated Retail & Generation
AEP
American Electric Power
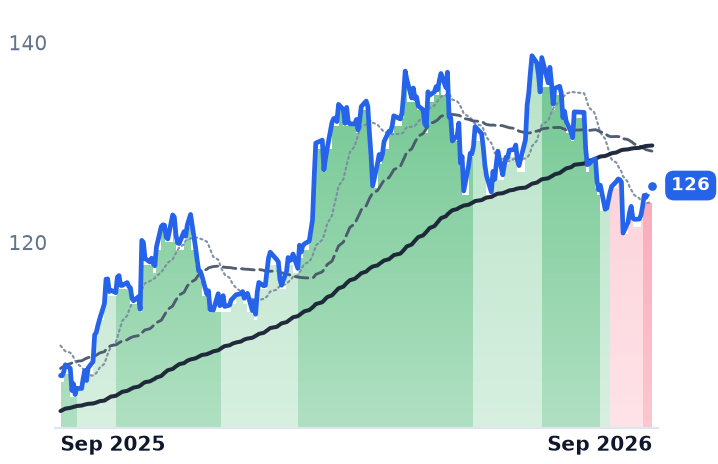
126
+1.19 (+0.96%)
vs. prior close
Price20d50d150d
AEP 12-month price
Vertically Integrated Utilities
BEP
Brookfield Renewable Partners
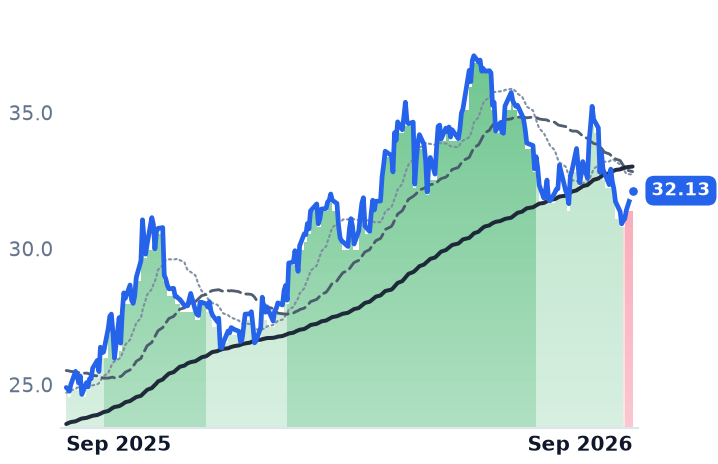
32.13
+0.72 (+2.29%)
vs. prior close
Price20d50d150d
BEP 12-month price
Diversified Renewable Generators
TickerMkt capP/EP/E fwdP/SP/S fwdP/GPP/GP fwdEV/EBITDAFCF yld
NRG$25.2B31.3x13.5x0.7x0.7x4.2x4.4x11.5x1.4%
AEP$67.8B21.4x19.5x3.0x2.9x6.1x5.9x14.1x13.2%
BEP$9.6B68.3x1.5x1.4x6.2x5.9x9.8x-49.1%

Consensus projections

TickerFY2026EFY2027EFY2028E
EMERevenue+21.4%+10.9%+8.3%
EPS+30.1%+13.0%+13.2%
PWRRevenue+40.6%+16.5%+12.9%
EPS+57.5%+17.5%+16.7%
MTZRevenue+29.2%+19.1%+15.4%
EPS+45.5%+34.3%+30.0%
STRLRevenue+71.5%+21.2%+17.3%
EPS+91.2%+28.0%+20.6%
DYRevenue+17.1%+40.1%+11.3%
EPS+39.5%+47.1%+20.3%
VSTRevenue+16.7%+9.3%+4.7%
EPS+80.0%+18.7%+18.0%
NRGRevenue+17.7%+0.8%+3.7%
EPS+14.0%+24.6%+15.4%
AEPRevenue+9.5%+5.9%+7.6%
EPS+7.9%+7.6%+10.6%
BEPRevenue+3.8%+9.0%−3.4%
EPS+14.0%−11.7%+9.4%

Forward fiscal years only. Blank means no analyst coverage for that year.

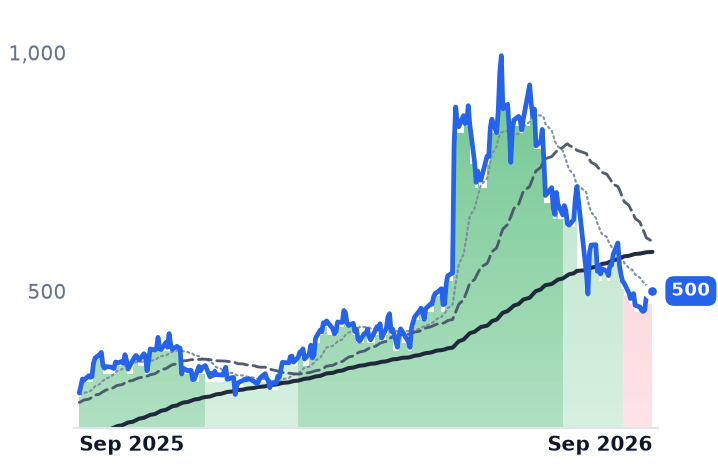
Between 17 August and the first days of September, five contractors that build electrical systems, transmission lines and data-center sites shed between a seventh and a third of their market value in nine sessions. Two earnings reports did it, and neither was about data centers.

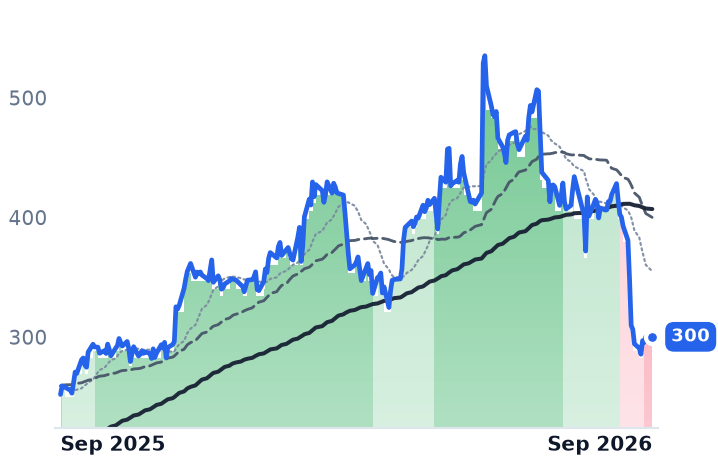
MasTec, the Coral Gables infrastructure contractor whose segments run from wireless towers to gas pipelines, cut its full-year Communications revenue guidance to $3.25bn with margins about a point below the prior year, blaming wireless spectrum equipment that will not be available until 2027 and deferred wireline projects. The shares fell 18.5% to $264.36 despite record backlog of $21.4bn, up 30%, and raised full-year earnings guidance of $9.30 a share. Days later Dycom Industries, which lays fiber and builds wireless sites for telephone and cable carriers, fell about 13% after shifting roughly $150m of wireless revenue into fiscal 2028. Its fiber-to-the-home revenue had risen nearly 60% in the first half.

That is a carrier capital-spending problem, and it was then applied to companies with no carriers among their customers. MasTec's own non-telecom segments accelerated in the same quarter — Power Delivery revenue up 20%, Clean Energy up 43% — and the two largest names dragged down by the episode sell almost nothing to a phone company.

What the two protagonists actually reported

EMCOR Group, the Norwalk mechanical and electrical trade contractor with 44,000 employees, grew June-quarter revenue 19.8% to $5.155bn and posted a record 10.62% operating margin. Remaining performance obligations — signed work not yet billed — hit $17.14bn, up 44% and almost entirely organic. "Our strong performance during the first half of 2026, combined with the visibility provided by our record RPOs, supports a substantial increase to our full year 2026 earnings guidance," chief executive Anthony Guzzi told investors on the second-quarter call. The 30 July raise took full-year earnings to $32.00-33.25 a share from $29.75-30.75.

The margin comes from the construction trades, not the maintenance book: Electrical and Mechanical Construction together billed $3.96bn at a 13.1% operating margin, while the Building Services facilities book grew 5.6% at 7.6%. Electrical Construction margin widened 210 basis points to 13.9% on network and communications work up 45% — that is data-center and campus wiring, sold to owners rather than to carriers.

Quanta Services, the Houston utility contractor with 69,500 employees, grew revenue 41.1% to $9.557bn, a fourth consecutive quarter of acceleration, with gross margin 296 basis points wider than a year earlier. It lifted full-year revenue guidance to $39.3-39.7bn. Its record $53.4bn backlog contains $19.8bn of estimated master-service-agreement volume above the $33.6bn of signed obligations, so the headline number is part forecast. Asked whether crews were the binding constraint, chief executive Earl Austin said on 30 July: "We're nowhere near capacity."

The customer is spending more, not less. Alphabet, Amazon, Microsoft and Meta together plan roughly $725bn of 2026 capital expenditure, up 77% from $410bn.

The group no longer trades as one thing

From May highs, EMCOR is down 18.1% and Quanta 18.6%. Sterling Infrastructure, the Texas site-development contractor serving data-center and semiconductor clients, is down 49.6% after growing revenue 90% to $1.168bn at a 19.8% operating margin; Dycom is down 43.9% and MasTec 43.2%. All five have bounced off the early-September low, EMCOR by 5.5% and Quanta by 6.2%.

Measured against a year of gross profit, EMCOR is the cheapest of the four at 8.4x forward, ahead of MasTec at 9.5x, Sterling at 16.0x and Quanta at 16.9x. EMCOR's trailing reading of 9.2x is down from 12.1x on 7 May while its gross profit grew 22.6% — the multiple did the falling. Quanta at 33.6x trailing enterprise value to earnings before interest, taxes, depreciation and amortization remains roughly twice EMCOR's level even after the decline.

Rates explain the August leg down: the 30-year Treasury yield sat at 5.245% in early September and a hot payrolls print pushed the implied probability of a September rate rise to 58%, which is hostile to contractors whose signed work converts over a longer horizon. But these shares rose into that print, so the September stabilization reads more like an oversold bounce than a verdict on rates.

The honest split is this. At EMCOR, growth held near 20% for a third straight quarter and the price fell by roughly a fifth; nothing in the disclosures explains the gap. At Quanta the business improved too, but it still carries the highest price per dollar of gross profit of the four, so its de-rating took it back toward its peers rather than below them. The only order-flow warning anywhere in the group came from Sterling, whose management flagged softer third-quarter awards and a possible sequential backlog decline, and called it timing rather than demand.

EMCOR spent about $750m upfront this year buying union electrical contractors, and Quanta bought a permitting and right-of-way specialist to shorten interconnection timelines. Companies short of work do not buy crews.

Robert Half's Consulting Arm Lost 19.9% of Its Billable Hours as Staffing Margins Held

Hypothesis Opus 5 · Research Opus 5 · Writing Opus 5 · Prompt v1.6

The industry that was supposed to be artificial intelligence's first casualty is watching its labour meters turn — and at Robert Half the part that is shrinking is the arm that has nothing to do with hiring. Permanent placement revenue grew 2.9% year over year in the June quarter and contract talent gross margin held at 39.1%, while Protiviti, the consulting business, shed revenue as United States financial-services deregulation gutted its compliance book.

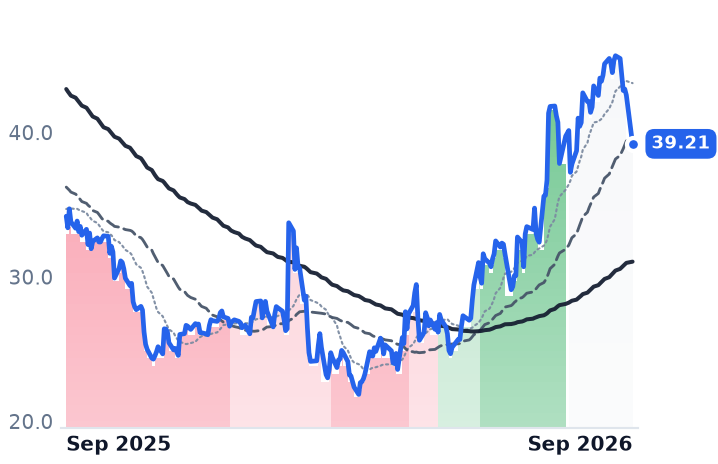
The market has not sorted this out. Robert Half trades at 30.9x forward earnings against consensus that puts 2026 profit below 2025's, while ManpowerGroup, four quarters into accelerating revenue, sits at 15.8x forward. Kforce, the third name under the label, reported technology job orders up 18%. All three gapped down together on September 8 with no company news at any of them.

RHIMANKFRCTemporary Labor DemandRisk & Compliance ConsultingFinancial Services DeregulationTech Hiring CycleAI Labor Displacement
TickerCompanySegmentTrend · 13mo30D1Y
The subject · what this brief is about
RHIRobert HalfStaffing & Recruitment🌱 Emerging Bull−6.9%+14.7%
MANManpowerGroupStaffing & Recruitment🌱 Emerging Bull+2.0%+52.7%
Compared against · context, not the story
KFRCKforceStaffing & Recruitment🌱 Emerging Bull−12.4%+75.3%

12-month price & trend

RHI
Robert Half
39.21
−3.37 (−7.91%)
vs. prior close
Price20d50d150d
RHI 12-month price
Staffing & Recruitment
MAN
ManpowerGroup
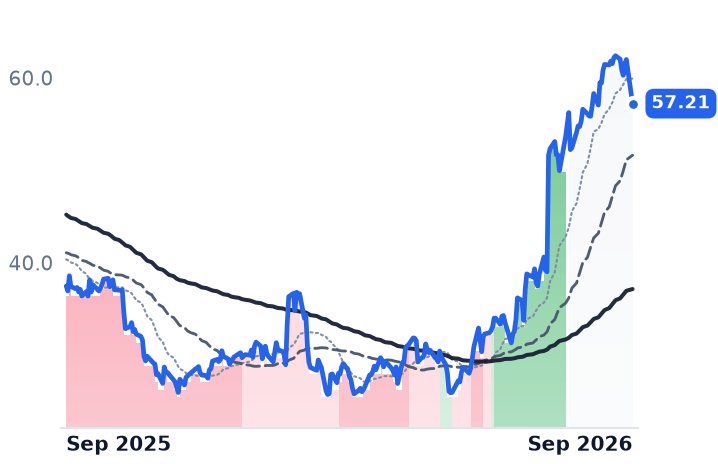
57.21
−4.77 (−7.70%)
vs. prior close
Price20d50d150d
MAN 12-month price
Staffing & Recruitment
KFRC
Kforce
51.36
−3.17 (−5.81%)
vs. prior close
Price20d50d150d
KFRC 12-month price
Staffing & Recruitment
TickerMkt capP/EP/E fwdP/SP/S fwdP/GPP/GP fwdEV/EBITDAFCF yld
RHI$4.0B34.1x30.9x0.8x0.8x2.1x2.1x26.3x5.4%
MAN$2.7B25.5x15.8x0.1x0.1x0.9x0.9x9.0x2.2%
KFRC$915.9M24.1x20.1x0.7x0.7x2.5x2.4x18.1x2.5%

Consensus projections

TickerFY2026EFY2027EFY2028E
RHIRevenue−1.0%+4.1%+5.2%
EPS−4.5%+55.5%+26.1%
MANRevenue+7.2%+3.7%+4.0%
EPS+26.3%+34.4%+34.3%
KFRCRevenue+4.3%+4.4%+4.6%
EPS+19.2%+21.6%+19.6%

Forward fiscal years only. Blank means no analyst coverage for that year.

Robert Half's June quarter answered a question nobody in staffing thought to ask: which half of the company is actually broken. It was the half that does not sell labour. Protiviti — the consulting arm that does internal audit, risk, regulatory-compliance and technology project work — saw revenue fall 4.9% to $471m, on billable hours down 19.9% against average hourly bill rates up 15.0%. The staffing side steadied. Contract talent gross margin held at 39.1% of applicable revenue, unchanged from a year earlier, and permanent placement revenue grew 2.9% to $118m, with the average fee per placement up 5.5% offsetting a 2.6% decline in placements.

That inverts how the business is usually read. Protiviti is 35% of Robert Half's $1.336bn of quarterly revenue and it is the reason group gross margin fell 172 basis points year over year, to 35.5%. The cause is not the hiring cycle: changes in the US financial-services regulatory environment shrank demand for the risk-and-compliance practice, now under 20% of Protiviti's revenue, and the company expects the headwind to begin easing in the first quarter of 2027. A $7m severance charge at Protiviti in the quarter cost $0.04 a share; Robert Half guided the segment's third-quarter adjusted margin back to 7–9% and group earnings growth of 8–12%.

The labour meters are the part that is working

US temporary-help services payrolls rose 6,800 in August and have increased in every month of 2026, the longest positive run for temporary staffing in nearly five years. The American Staffing Association's index showed temporary and contract employment running 5.2% above the same weeks of 2025. Staffing Industry Analysts projects the US market to grow 2.4% this year to $183.1bn after three straight annual declines — a recovery, and a modest one.

Kforce, the Tampa-based US professional staffing firm split between technology and finance-and-accounting placement, is the cleanest read on it: revenue up 4.5% to $349.3m, gross margin up to 28.1% from 27.1%, technology job orders and new assignment starts both up 18% year over year, and flex margins 120 basis points higher at 26.8%, near their 2022 peak, on a stable $90 average hourly bill rate. "The net is that we are driving disproportionately better results than the macro industry readings would suggest and the forward momentum in the business is good," chief operating officer David Kelly told investors on the July 27 call.

ManpowerGroup is the volume mirror

ManpowerGroup, which places permanent, temporary and light-industrial labour through some 2,200 offices in 75 countries, has now grown revenue for four consecutive quarters — 2.3%, 7.1%, 10.3% and 7.5% — and swung to $53.5m of net income in the June quarter from a $67.1m loss a year earlier. Its gross margin is structurally mid-teens, 16.1%, and gross profit grew only 2.2% on that 7.5% revenue gain: volume is returning at a thinner spread. France, its largest country at $1.2bn of quarterly revenue, was flat in constant currency on an average-daily basis, and Southern Europe's unit profit margin slipped 10 basis points on what the company called competitive pricing dynamics. Northern Europe grew 2% organically and returned to profit.

So the group splits on estimates, not on narrative. Consensus has ManpowerGroup earning $3.63 a share this year and $4.88 next; its trailing earnings multiple of 25.5x compresses to 15.8x forward, and it trades at 0.87x trailing gross profit, 1.27x book and 9.0x trailing EV/EBITDA — with the shares, up 48.8% over twelve months, still marginally below their 2024 year-end close. Robert Half's forward figure of 30.9x has barely moved from 34.1x trailing precisely because the estimate is falling: consensus of $1.27 for 2026 sits below the $1.33 delivered in 2025. It trades at 2.06x trailing gross profit against Kforce's 2.48x.

What the September 8 selloff did not explain

On September 8 Robert Half closed down 7.9%, ManpowerGroup 7.7% and Kforce 5.8%, alongside TriNet, Insperity and Upwork, with no company-specific development discoverable at any of them and no earnings or guidance update from ManpowerGroup. The likelier reading is a sector-level repricing of the labour cycle rather than an issuer event.

The verdict: the hiring turn these shares have been pricing since March is real, and Kforce's job orders and the temporary-help payroll run are the evidence for it. But it is a shallow turn, and only two of the three businesses are levered to it cleanly. ManpowerGroup's advance is underwritten by earnings the market expects to more than recover; Robert Half's is multiple expansion against estimates still going backwards, because a third of the company is hostage to a regulatory cycle that has nothing to do with employment. Robert Half told investors that studies so far suggest artificial intelligence is having a negligible impact on its areas of employment — the threat everyone was watching is not the one that cost it the quarter.

Protiviti's compliance work comes back when Washington writes rules again. Robert Half's own timetable puts meaningful relief in the second quarter of 2027, which is a longer wait than any hiring recovery requires.

Karman's Golden Dome Money Awaits a Bill; BWXT's Navy Reactor Work Is Under Contract

Hypothesis Opus 5 · Research Opus 5 · Writing Opus 5 · Prompt v1.6

Defense suppliers reported some of the biggest order books in their history this summer and then sold off as a group. Over the past thirty days almost every name in the complex fell — Mercury Systems 22.0%, Kratos 19.9%, HEICO 13.4% — against an S&P 500 tracker that barely moved.

Both of the names carrying the propulsion-and-launch-structures label grew their signed obligations through it. BWX Technologies ended the June quarter with $8.4bn of backlog, up 40% year over year, and raised all four of its 2026 guidance lines. Karman's backlog rose 65% to $1.3bn with 95% of this year's revenue already booked and gross margin widening to 43.0%.

The split is in whose demand is appropriated. The Navy signed $76.6bn of submarine work in July; $17.1bn of the missile-defense architecture underwriting Karman's incremental case sits in a bill that has not passed. BWXT's own defect is margin, ground from 16.3% in 2021 to 10.1% last year.

BWXTKRMNHEITDGNOCLMTGDHIILHXCWKTOSRKLBRDWMRCYDCOSPYNaval Nuclear PropulsionMissile Defense ArchitectureDefense Budget AppropriationsAdvanced Nuclear MicroreactorsDefense Backlog Conversion
TickerCompanySegmentTrend · 13mo30D1Y
The subject · what this brief is about
BWXTBWX TechnologiesNaval & Shipbuilding⚠️ Emerging Bear−5.1%−0.8%
KRMNKarmanMissiles, Weapons & Fire Control⚠️ Emerging Bear−35.4%−36.5%
Compared against · context, not the story
HEIHEICOAvionics & Electronic Systems🟢 Cont. Bull−13.7%+0.7%
TDGTransDigm Group IncorporatedAdvanced Materials & Components🌱 Emerging Bull−6.2%−12.3%
NOCNorthrop GrummanLarge Diversified Primes⚠️ Emerging Bear−11.1%−9.1%
LMTLockheed MartinLarge Diversified Primes⚠️ Emerging Bear−10.9%+19.2%
GDGeneral DynamicsLarge Diversified Primes🟢 Cont. Bull−10.3%+12.2%
HIIHuntington Ingalls IndustriesNaval & Shipbuilding⚠️ Emerging Bear−12.6%+8.8%
LHXL3Harris TechnologiesAvionics & Electronic Systems⚠️ Emerging Bear−13.0%−5.2%
CWCurtiss-WrightFlight Controls & Actuation🟢 Cont. Bull−17.3%+19.7%
KTOSKratos Defense & Security SolutionsMissiles, Weapons & Fire Control⚠️ Emerging Bear−21.4%−24.6%
RKLBRocket Lab USAUnmanned Systems & ISR⚠️ Emerging Bear−19.4%+41.3%
RDWRedwireSpace Systems & Launch🌱 Emerging Bull−17.2%+35.0%
MRCYMercury SystemsOther🟢 Cont. Bull−22.3%+23.4%
DCODucommun IncorporatedAvionics & Electronic Systems🟢 Cont. Bull−15.4%+89.7%
SPYState Street SPDR S&P 500 ETF TrustAsset Management🟢 Cont. Bull−0.8%+19.0%

12-month price & trend

BWXT
BWX Technologies
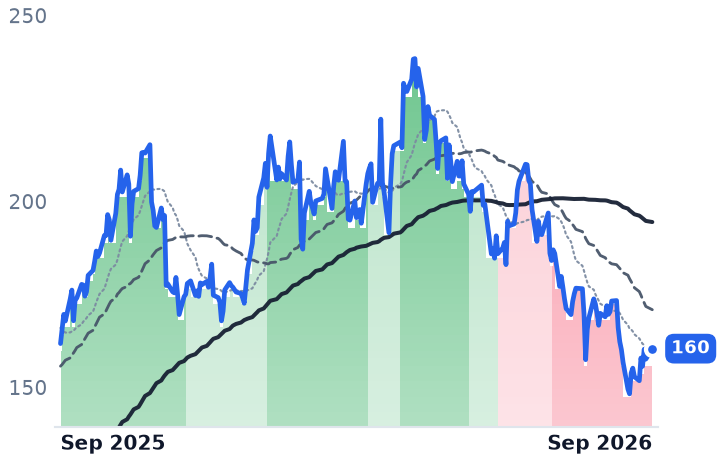
160
+2.82 (+1.79%)
vs. prior close
Price20d50d150d
BWXT 12-month price
Naval & Shipbuilding
KRMN
Karman
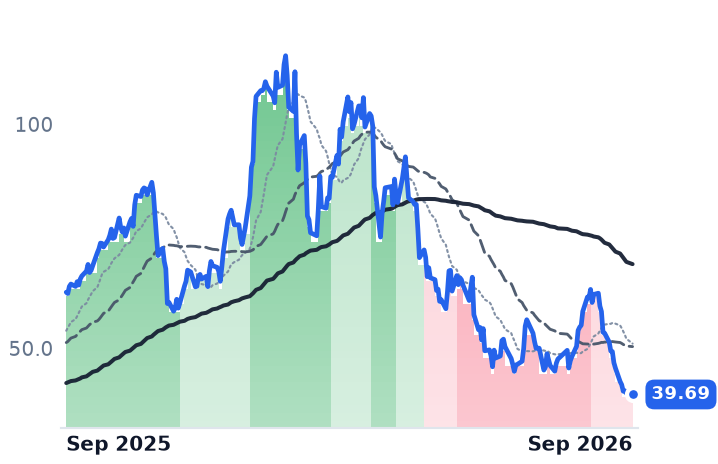
39.69
−0.29 (−0.73%)
vs. prior close
Price20d50d150d
KRMN 12-month price
Missiles, Weapons & Fire Control
HEI
HEICO
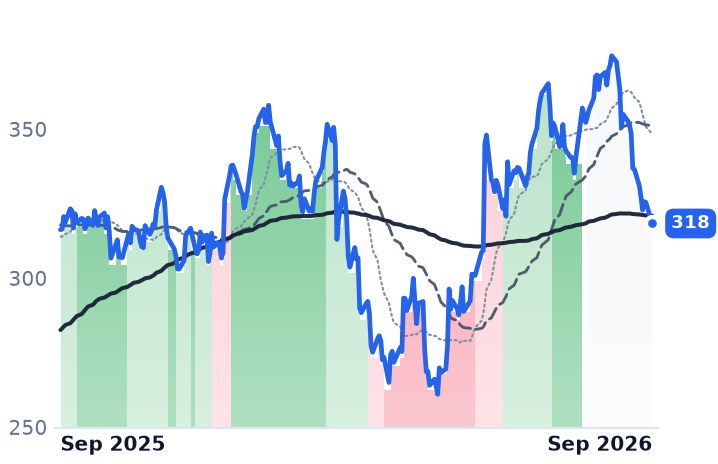
318
−7.11 (−2.18%)
vs. prior close
Price20d50d150d
HEI 12-month price
Avionics & Electronic Systems
TickerMkt capP/EP/E fwdP/SP/S fwdP/GPP/GP fwdEV/EBITDAFCF yld
BWXT$14.7B41.3x33.8x4.2x3.9x19.0x17.5x29.1x2.2%
KRMN$5.3B139.3x67.6x8.9x7.1x21.4x17.1x42.6x-0.5%
HEI$44.0B52.0x50.3x8.5x8.2x21.1x20.2x31.6x2.3%
TDG
TransDigm Group Incorporated
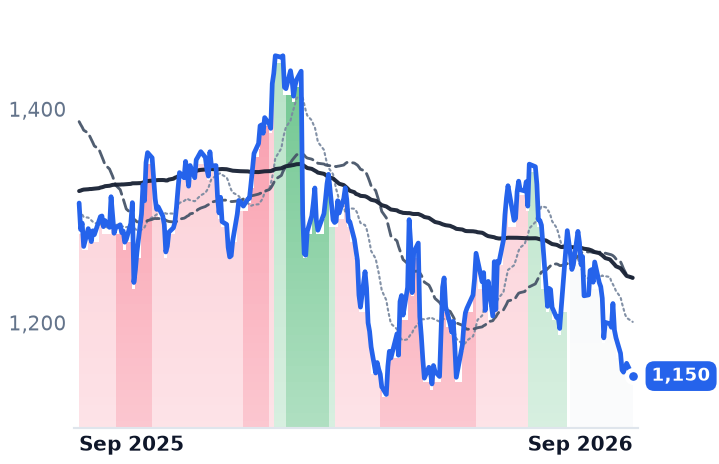
1,150
−11.96 (−1.03%)
vs. prior close
Price20d50d150d
TDG 12-month price
Advanced Materials & Components
NOC
Northrop Grumman
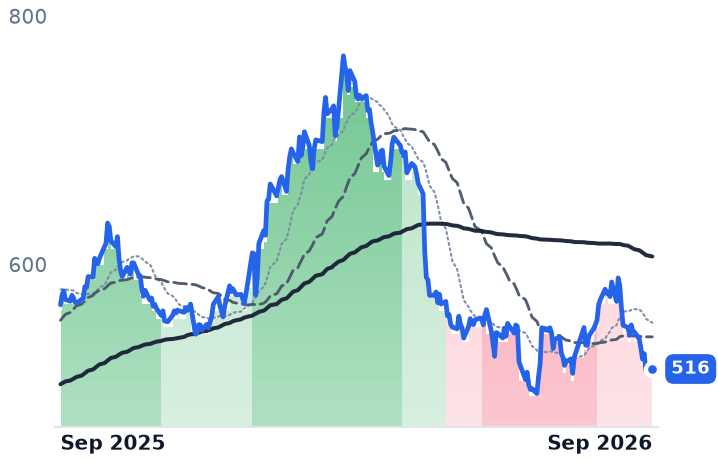
516
+0.82 (+0.16%)
vs. prior close
Price20d50d150d
NOC 12-month price
Large Diversified Primes
LMT
Lockheed Martin
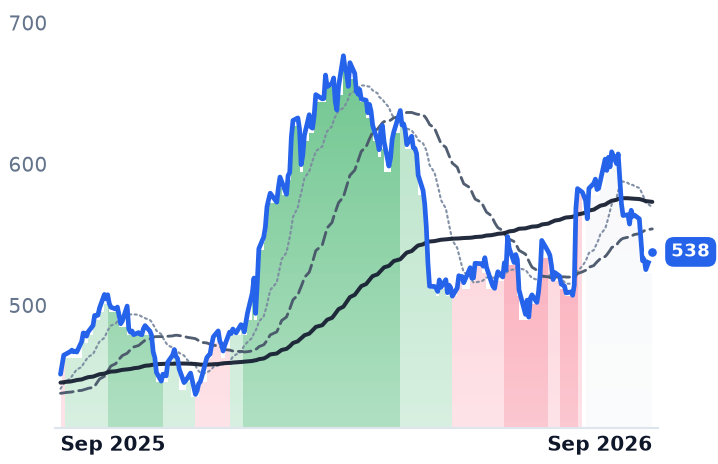
538
+12.54 (+2.39%)
vs. prior close
Price20d50d150d
LMT 12-month price
Large Diversified Primes
TickerMkt capP/EP/E fwdP/SP/S fwdP/GPP/GP fwdEV/EBITDAFCF yld
TDG$64.1B34.7x27.9x6.4x6.1x10.7x10.2x19.0x3.0%
NOC$76.8B16.8x19.3x1.8x1.7x8.8x8.5x12.2x4.3%
LMT$119.0B24.8x17.2x1.6x1.5x16.1x15.3x17.0x4.8%
GD
General Dynamics
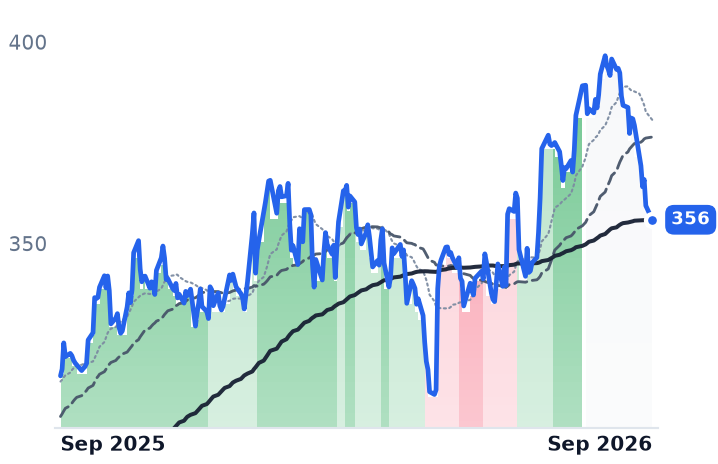
356
−3.50 (−0.97%)
vs. prior close
Price20d50d150d
GD 12-month price
Large Diversified Primes
HII
Huntington Ingalls Industries
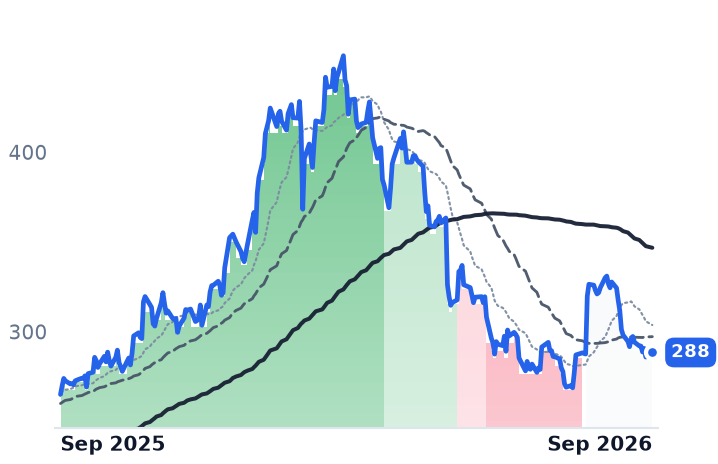
288
+2.52 (+0.88%)
vs. prior close
Price20d50d150d
HII 12-month price
Naval & Shipbuilding
LHX
L3Harris Technologies
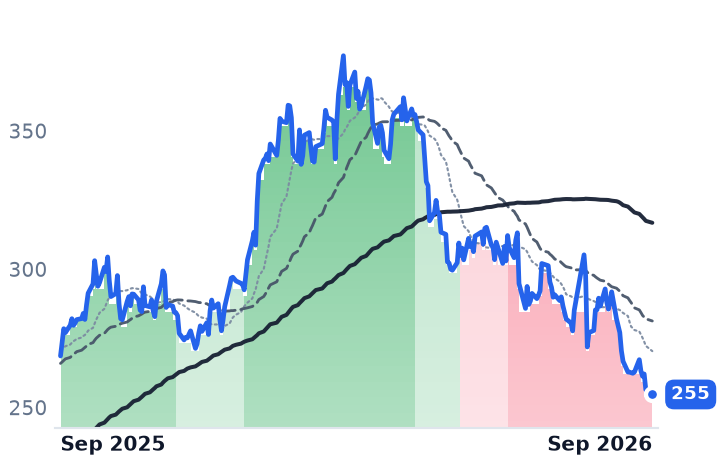
255
−1.73 (−0.67%)
vs. prior close
Price20d50d150d
LHX 12-month price
Avionics & Electronic Systems
TickerMkt capP/EP/E fwdP/SP/S fwdP/GPP/GP fwdEV/EBITDAFCF yld
GD$90.5B20.8x20.1x1.7x1.6x11.0x10.7x15.2x6.9%
HII$11.3B17.0x15.3x0.9x0.8x6.8x6.7x12.7x3.3%
LHX$51.6B27.8x23.2x2.3x2.2x8.8x8.6x16.5x5.4%
CW
Curtiss-Wright
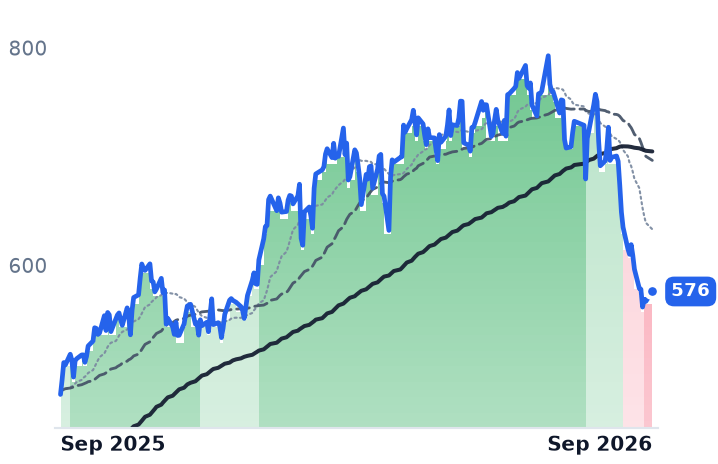
576
+9.13 (+1.61%)
vs. prior close
Price20d50d150d
CW 12-month price
Flight Controls & Actuation
KTOS
Kratos Defense & Security Solutions
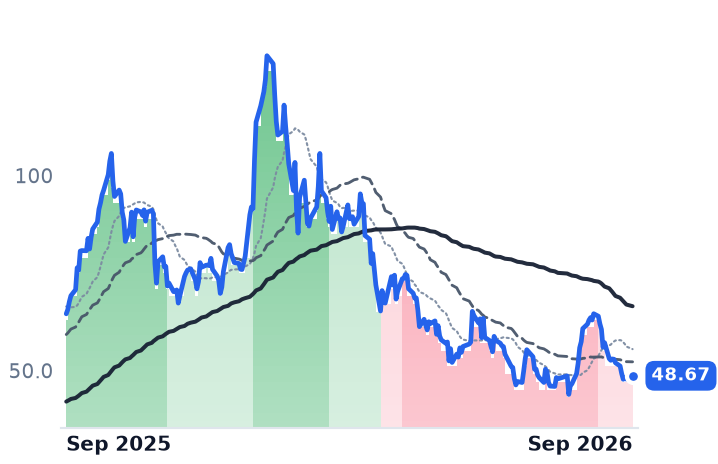
48.67
+0.85 (+1.78%)
vs. prior close
Price20d50d150d
KTOS 12-month price
Missiles, Weapons & Fire Control
RKLB
Rocket Lab USA
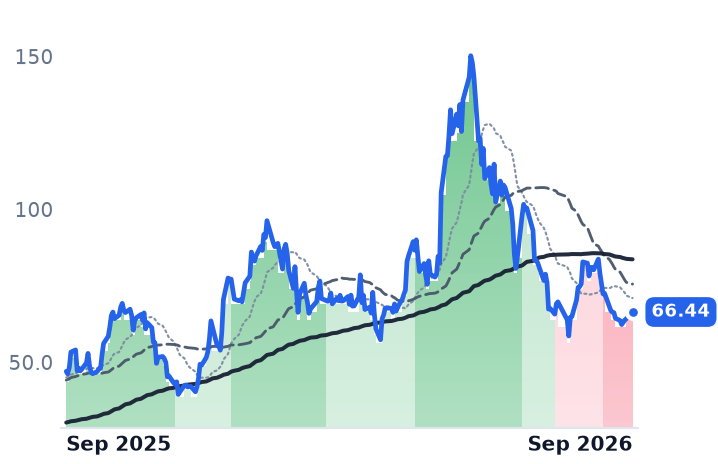
66.44
+2.18 (+3.39%)
vs. prior close
Price20d50d150d
RKLB 12-month price
Unmanned Systems & ISR
TickerMkt capP/EP/E fwdP/SP/S fwdP/GPP/GP fwdEV/EBITDAFCF yld
CW$26.3B51.5x46.9x7.3x7.0x19.6x18.8x36.4x2.2%
KTOS$9.8B302.5x62.0x6.4x5.5x29.1x24.8x71.8x-1.3%
RKLB$72.2Bn/m106.3x79.7x290.7x218.0xn/m-0.4%
RDW
Redwire
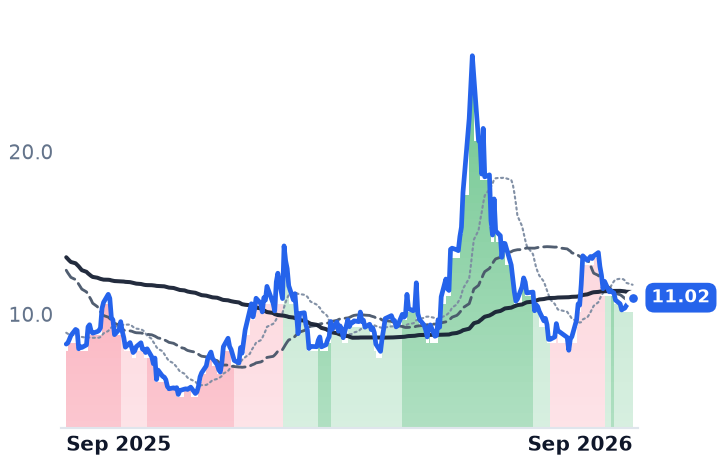
11.02
+0.49 (+4.61%)
vs. prior close
Price20d50d150d
RDW 12-month price
Space Systems & Launch
MRCY
Mercury Systems
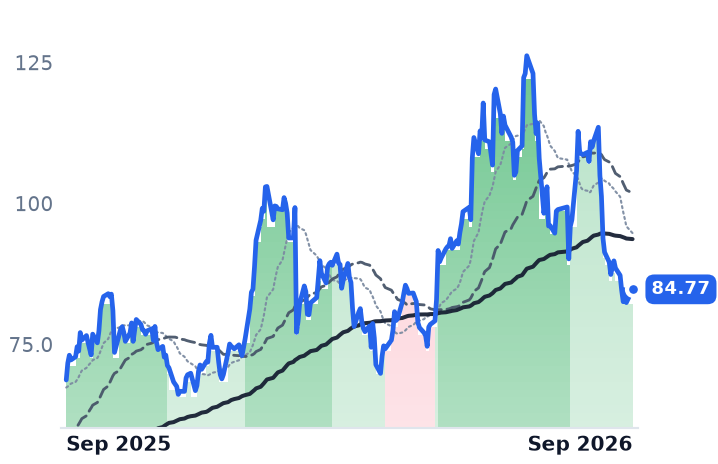
84.77
+2.35 (+2.85%)
vs. prior close
Price20d50d150d
MRCY 12-month price
Other
DCO
Ducommun Incorporated
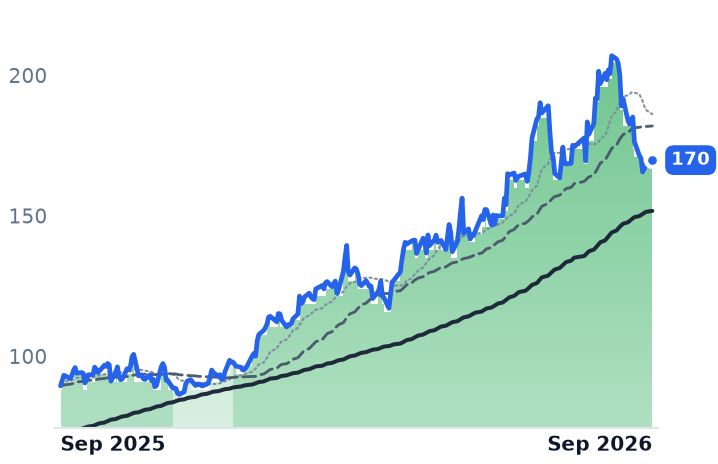
170
+1.50 (+0.89%)
vs. prior close
Price20d50d150d
DCO 12-month price
Avionics & Electronic Systems
TickerMkt capP/EP/E fwdP/SP/S fwdP/GPP/GP fwdEV/EBITDAFCF yld
RDW$2.6Bn/m6.2x5.5x30.7x27.5xn/m-3.9%
MRCY$5.5Bn/m86.8x5.7x5.8x20.6x20.8x64.1x1.3%
DCO$3.0Bn/m48.1x3.5x3.4x12.9x12.5x564.5x-0.8%
SPY
State Street SPDR S&P 500 ETF Trust
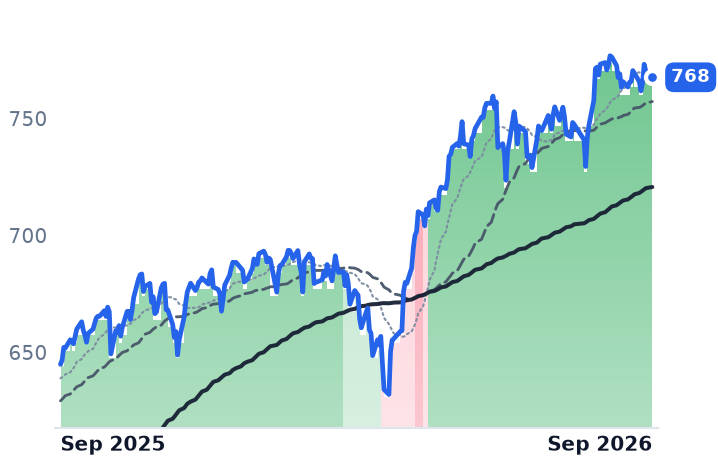
768
−2.59 (−0.34%)
vs. prior close
Price20d50d150d
SPY 12-month price
Asset Management
TickerMkt capP/EP/E fwdP/SP/S fwdP/GPP/GP fwdEV/EBITDAFCF yld
SPY$773.0B

Consensus projections

TickerFY2026EFY2027EFY2028E
BWXTRevenue+20.6%+9.6%+7.0%
EPS+24.1%+11.6%+11.7%
KRMNRevenue+57.5%+27.5%+25.8%
EPS+62.0%+61.1%+38.7%
HEIRevenue+21.1%+11.1%+8.7%
EPS+31.4%+13.5%+13.1%
TDGRevenue+19.4%+10.1%+7.6%
EPS+12.2%+17.7%+15.2%
NOCRevenue+5.1%+6.7%+6.1%
EPS+7.2%+7.9%+8.6%
LMTRevenue+6.1%+5.4%+5.5%
EPS+38.4%+7.1%+6.2%
GDRevenue+6.4%+4.6%+4.2%
EPS+7.9%+9.5%+7.9%
HIIRevenue+10.8%+6.4%+6.4%
EPS+23.6%+12.3%+16.4%
LHXRevenue+3.2%+7.3%+7.0%
EPS−18.5%+12.2%+13.9%
CWRevenue+9.6%+8.0%+8.1%
EPS+15.6%+12.0%+12.1%
KTOSRevenue+34.7%+23.3%+21.7%
EPS+57.7%+34.4%+28.7%
RKLBRevenue+51.0%+39.0%+27.0%
EPS−41.8%−100.1%+68844.3%
RDWRevenue+44.6%+18.7%+21.2%
EPS−55.6%−52.4%−57.9%
MRCYRevenue+8.6%+9.1%+10.2%
EPS+164.9%+44.7%+39.5%
DCORevenue+7.1%+9.2%+8.2%
EPS+13.2%+23.2%+16.2%

Forward fiscal years only. Blank means no analyst coverage for that year.

Every large aerospace and defense supplier lost ground over the past thirty days, and none of their order books did. Mercury Systems, which builds processing subsystems for missile and radar programs, fell 22.0% and the defense drone maker Kratos 19.9%, against an S&P 500 tracker down 0.7%. BWX Technologies — whose backlog grew 40% year over year to $8.4bn — was the shallowest faller in the group at 5.6%, and Karman Holdings the deepest at 31.8%. What began as a single-stock unwind at Karman is now a sector-wide repricing: over six months the index rose 13.2% while Huntington Ingalls fell 32.8%, L3Harris 31.4% and Northrop Grumman 31.0%.

What separates these companies now is not whether the demand is real but whether Congress has already paid for it. The Navy awarded a $76.6bn package on 30 July covering five Columbia-class and nine Block VI Virginia-class submarines. The Pentagon's Golden Dome missile-defense architecture, by contrast, is a $17.9bn fiscal-2027 request of which $17.1bn would arrive through a reconciliation package that has not passed. A senior general said in August that "there is no Golden Dome" unless Congress prioritizes the funding.

The annuity with a margin problem

BWXT makes naval reactor cores, nuclear fuel and missile launch tubes as a sole-source supplier to the Naval Nuclear Propulsion Program, plus commercial steam generators. It announced more than $1.4bn of naval propulsion contracts in May, runs a trailing book-to-bill of 1.7x, and in late August the Army selected its gas-cooled BANR design for a microreactor at Fort Campbell under the Janus program, worth up to $2.2bn across five vendors. "Demand for new nuclear solutions is remarkably deep and broad," chief executive Rex Geveden said in the August 3 results release, the same day the company raised revenue, adjusted earnings, adjusted EBITDA and free-cash-flow guidance, the last by $30m to $345–360m.

The defect is beneath the orders. Gross margin fell to 22.4% in the June quarter from 25.1%, and reported operating income has now declined year over year for four consecutive quarters while revenue grew 18% to 29% in each. Annual operating margin has ground from 16.3% in 2021 to 10.1% in 2025 on 51% more revenue — capacity funded ahead of the awards it serves, with commercial segment margin guidance cut to about 13% for hiring and plant expansion and recovery deferred to 2027. The growth leg the label implies is also leaving: BWXT is selling its medical isotope business to Nordic Capital for $750m base consideration, roughly $130m of annual revenue out the door.

The one whose money is a request

Karman builds payload fairings, interstage structures and propulsion units for missile-defense, hypersonics and launch customers, sole-source on more than 130 programs. Its June quarter was the strongest in its short public life: revenue up 58.2% to $182.1m, roughly $500m of bookings, gross margin at 43.0% against 40.9% a year earlier, guidance lifted to $730–745m. "Some customers are now citing demand to increase certain annual production buys by as much as a factor of 10x," chief executive Jonathan Rambeau told investors on August 6 — a pull HEICO corroborated later that month, reporting 23.1% revenue growth and citing customer expedite requests of two to ten times.

None of that is what moved the shares. A secondary offering priced 14m shares at $61.00 on May 28, 54% above today's price, with sponsor lockup tranches releasing on October 1 and January 1. Chief financial officer Mike Willis steps down effective September 14. And J Capital Research published a bear case attacking acquisitions disclosed as immaterial, landing on a material weakness in internal controls management does not expect to finish testing until early 2027; the shares fell about 11% that week. The cash record is the soft spot the operating record hides: negative $4m of operating cash flow in the first half, 3.7x leverage.

What the price now pays for

BWXT trades at 33.8x forward earnings against roughly 46x recorded in early May, and 41.3x trailing against 55.0x then — while consensus 2026 earnings estimates rose from $4.05 to $4.74 a share over the same stretch. Karman fetches 67.6x forward earnings and 8.92x trailing sales, down from about 24x enterprise value to revenue in May. HEICO, the highest-quality comparison in the group, still commands 50.3x forward earnings; TransDigm, at 27.9x, is the cheapest anchor and the one against which both look dear.

So BWXT's decline is almost entirely premium removal, with one honest business claim on it — four quarters of falling operating income are a real deterioration, and the fifty-day average has sat below the two-hundred-day since early July. Karman's is larger than anything in its operating record explains; the identifiable causes are dated sponsor supply, a finance-chief change and an unremediated control weakness, none of which touch the $1.3bn already booked. The company's contracted base is intact. Its incremental case is a legislative vehicle.

The next tranche of sponsor shares comes free on October 1, and Karman's new finance chief will have been in the seat about three weeks when it does.

Doximity Raised Its Year by $6m and Gave Up Three Points of Gross Margin to AI Compute

Hypothesis Opus 5 · Research Opus 5 · Writing Opus 5 · Prompt v1.6

Doximity's bookings held and its profit did not. The physician network raised full-year revenue guidance on August 6 and lifted the number of customers paying it more than $500,000 a year to 127, up 7% — while gross profit rose just 2.2% on 7.3% more revenue, because roughly 90% of its artificial-intelligence compute spending is booked in cost of revenue. Consensus now has earnings per share falling 13% this fiscal year.

Eight sessions earlier, Teladoc — filed under the same industry label — cut 2026 revenue guidance about 5%, entirely on its BetterHelp therapy subscription, where paying users fell 11% to 346,000. Its constraint is therapist supply rather than demand: about 70% of prospective users now want insurance-billed therapy.

One classification, two unrelated mechanisms — a cost line at Doximity, a capacity line at Teladoc.

DOCSTDOCOMDAHIMSGDRXAI Compute CostsGross Margin CompressionPharma Physician MarketingBehavioral Health CapacityDrug Advertising Rules
TickerCompanySegmentTrend · 13mo30D1Y
The subject · what this brief is about
DOCSDoximityVirtual Care & Telehealth🔴 Cont. Bear−4.7%−64.9%
TDOCTeladoc HealthVirtual Care & Telehealth🌱 Emerging Bull−12.0%−19.7%
Compared against · context, not the story
OMDAOmada HealthVirtual Care & Telehealth🌱 Emerging Bull−9.2%−4.6%
HIMSHims & Hers HealthMedical - Equipment & Services🌱 Emerging Bull−12.8%−41.5%
GDRXGoodRxPatient Engagement & Benefits🌱 Emerging Bull−7.8%−15.6%

12-month price & trend

DOCS
Doximity
24.42
−1.93 (−7.32%)
vs. prior close
Price20d50d150d
DOCS 12-month price
Virtual Care & Telehealth
TDOC
Teladoc Health
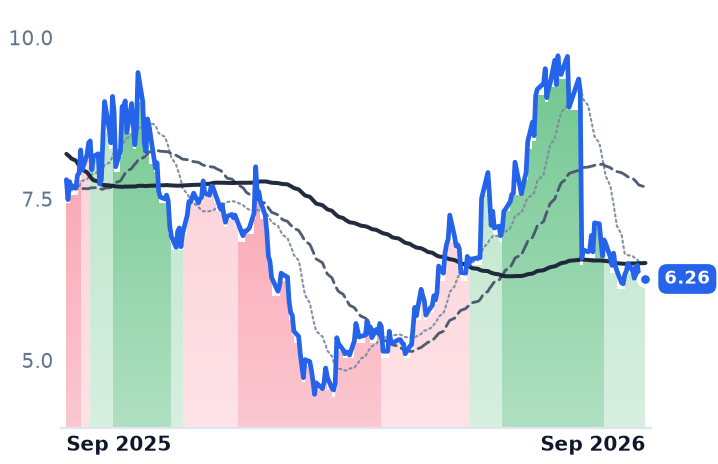
6.26
−0.02 (−0.32%)
vs. prior close
Price20d50d150d
TDOC 12-month price
Virtual Care & Telehealth
OMDA
Omada Health
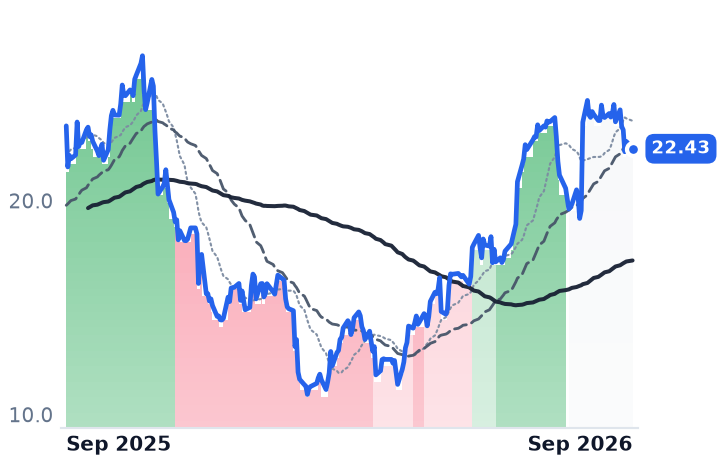
22.43
−0.34 (−1.49%)
vs. prior close
Price20d50d150d
OMDA 12-month price
Virtual Care & Telehealth
TickerMkt capP/EP/E fwdP/SP/S fwdP/GPP/GP fwdEV/EBITDAFCF yld
DOCS$4.6B27.4x18.1x7.0x6.8x7.9x7.7x17.7x6.6%
TDOC$1.1Bn/m0.5x0.5x0.6x0.6xn/m19.8%
OMDA$1.3B326.7x61.3x4.3x3.9x6.2x5.7x93.3x1.7%
HIMS
Hims & Hers Health
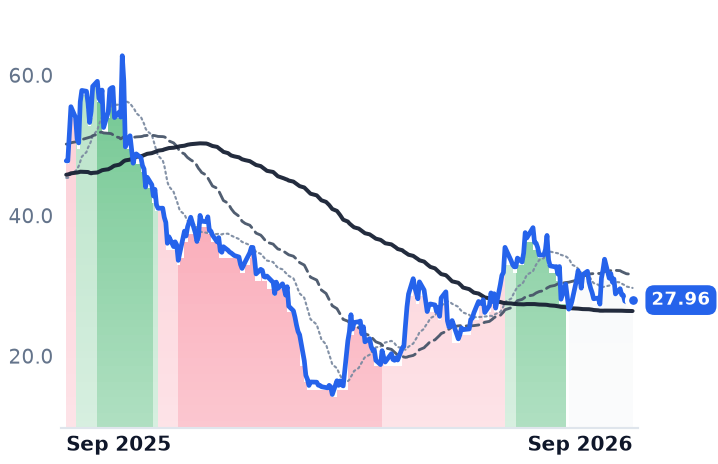
27.96
+0.25 (+0.90%)
vs. prior close
Price20d50d150d
HIMS 12-month price
Medical - Equipment & Services
GDRX
GoodRx
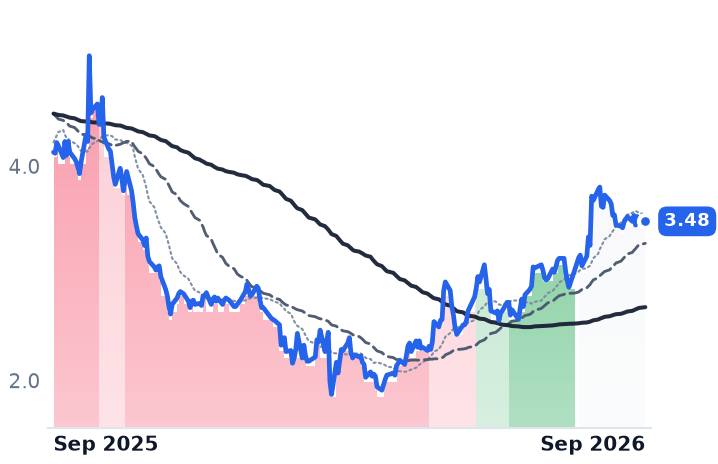
3.48
+0.00 (+0.14%)
vs. prior close
Price20d50d150d
GDRX 12-month price
Patient Engagement & Benefits
TickerMkt capP/EP/E fwdP/SP/S fwdP/GPP/GP fwdEV/EBITDAFCF yld
HIMS$5.5Bn/m2.3x1.9x3.4x2.8x64.2x1.4%
GDRX$1.2B66.2x11.4x1.5x1.5x1.7x1.7x9.8x12.1%

Consensus projections

TickerFY2026EFY2027EFY2028E
DOCSRevenue+13.8%+5.1%+6.6%
EPS+18.1%−13.0%+15.5%
TDOCRevenue−4.6%−1.1%+1.5%
EPS−27.0%−28.1%−13.6%
OMDARevenue+33.4%+20.4%+20.3%
EPS−1434.8%+27.4%+59.5%
HIMSRevenue+22.5%+19.6%+15.1%
EPS−99.7%+38762.4%+60.2%
GDRXRevenue+0.6%+5.0%+6.7%
EPS−15.6%+17.1%+15.5%

Forward fiscal years only. Blank means no analyst coverage for that year.

Doximity, which sells branded drug-marketing modules to pharmaceutical companies across a network of US physicians, grew revenue 7.3% in the June quarter and gross profit 2.2%. The difference sits in one cost line: roughly 90% of the company's artificial-intelligence compute spending is booked in cost of revenue rather than overhead, and non-GAAP gross margin fell to 88% from 91% a year earlier.

Bookings are not the problem. On the August 6 call Doximity raised full-year revenue guidance by $6m, to $671–681m, and reported 127 pharmaceutical and hospital customers paying more than $500,000 a year — up 7%, and 83% of total revenue. Net revenue retention among its twenty largest customers was 112%. What the compute bill broke is the operating leverage that justified the price: operating income fell 38% year over year on that 7.3% of growth, and consensus now has earnings per share declining 13% this fiscal year while revenue rises about 5%.

The re-rating arrived in gaps

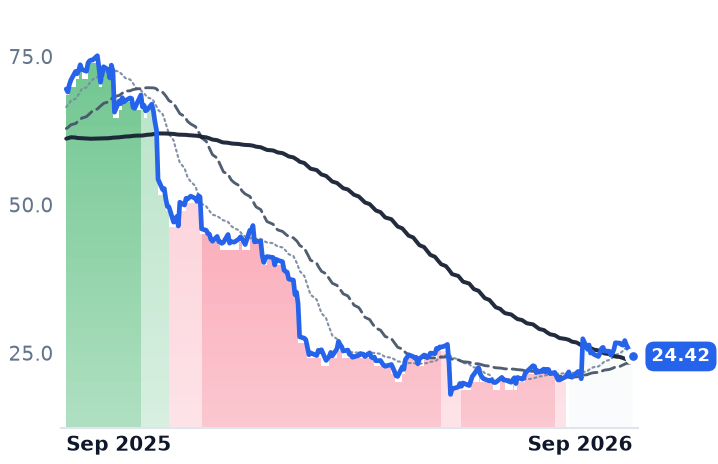
The market has spent a year repricing this. Doximity fell about 25% on May 14 after guiding fiscal 2027 revenue below consensus, then gained 32.6% on August 7 on the June-quarter beat. On September 8 Freedom Capital Markets cut the stock to Hold while raising its price target to $27, analyst Gene Mannheimer trimming his profit forecast because a further step-up in compute and product investment squeezes margins for years; the shares fell 7%. Over twelve months they are down about 65%. Trailing price-to-gross-profit is 7.9x, against roughly 26x a year ago, with 18.1x forward earnings.

Chief executive Jeff Tangney's answer on August 6 was unit economics: "I can tell you, we're earning more than 10x per search in revenue than it cost us to run that today." Doximity has 165 signed enterprise health-system clients for its AI tools and is in litigation both ways with its main rival for physician AI search, Open Evidence. The budget pool underneath all of it is moving: the Food and Drug Administration has proposed scrapping the "adequate provision" allowance that has made broadcast drug advertising practical for three decades, with a proposed rule expected in December 2026.

Teladoc ran out of therapists

Eight sessions before Doximity's beat, Teladoc — the virtual-care company filed under the same industry classification — fell 28.3% in a single day. It cut 2026 revenue guidance to $2.36–2.45bn, about 5% at the midpoint, entirely on BetterHelp, its direct-to-consumer therapy subscription. That segment's revenue fell 11.6% to $213m and its cash-paying users fell 11% to 346,000; it is now guided to shrink 12.7% to 19% this year, against a prior outlook of a 1% to 6.5% decline.

The cause is a composition shift rather than a demand collapse: roughly 70% of prospective users, and 80% in some markets, now want therapy billed through insurance, and provider capacity did not scale with them. "With over 20 thousand sessions completed last week alone, representing an estimated annualized revenue run rate on that basis of over $110 million up from over $75 million at the time of our first quarter earnings call," chief executive Charles Divita told investors on July 29. The quieter book is the better one: Integrated Care, sold to employers and health plans, grew 0.7% to $394m with adjusted EBITDA up 13.6% at a 16.5% margin and chronic-care enrolment of 1.27m, up 14%.

Teladoc trades at 0.62x gross profit, the low end of its own 2026 range and down from 0.97x in late July, at 0.86x book value, with a 19.8% trailing free-cash-flow yield. Against that sits $850m of convertible notes maturing on June 1, 2027, $774m of cash and free cash flow guided at $130–170m for the year.

The one that is compounding

Omada Health, which sells virtual diabetes, hypertension and weight-management programs to employers and pharmacy benefit managers under the same classification, grew second-quarter revenue 43% to $87.8m and raised full-year guidance to $334–340m. "We delivered 43% revenue growth and expanded gross margin by 700 basis points to 73% on a GAAP basis," president and incoming chief executive Wei-Li Shao said on August 6. It trades at 61x forward earnings.

Doximity's business earns much of its de-rating: gross profit growing 2% does not support the multiple it carried, and 18x forward earnings is not obviously cheap against a forecast that those earnings shrink. What the price does not yet reflect is that the demand side held — retention, the customer count and a raised year all point at a cost problem the company chose. Teladoc's cheapness is equally real and so is the contraction; below book, its next test is a refinancing rather than a reacceleration.

Omada, with 1.1m members, presents its long-term plan in New York on Thursday. The two older names face narrower questions: whether Doximity's compute bill stops growing faster than its revenue, and whether Teladoc can credential therapists fast enough to sell the product its customers are already asking for.

PC Connection's Device Revenue Grew 19.5% on 3% More Units — Price Did the Rest

Hypothesis Opus 5 · Research Opus 5 · Writing Opus 5 · Prompt v1.6

PC Connection posted the best quarter in its history — record gross profit of $157.5m and a record 5.2% operating margin — on almost no additional volume. Notebooks, mobility and desktops brought in 19.5% more revenue on 3% unit growth, and the extra dollars came from device prices inflating with memory costs upstream.

That matters now because the input is decelerating: TrendForce expects conventional DRAM contract prices up 13-18% quarter over quarter in the third quarter, a slowdown from earlier jumps. Connection is the most expensive of the three enterprise IT distributors on price-to-gross-profit at 3.74x trailing, with the slowest gross-profit growth of the group — up 6.4% on a trailing-four-quarter basis against Arrow's 25.3%. Its trailing free-cash-flow yield is 1.6%, against roughly 8% at both Arrow and Insight.

CNXNARWNSITAVTSNXSCSCCDWINGMMemory PricingIT Channel DistributionPC Refresh CycleDevice ASP InflationComponent Distribution Cycle
TickerCompanySegmentTrend · 13mo30D1Y
The subject · what this brief is about
CNXNPC ConnectionEnterprise IT Solutions🌱 Emerging Bull+0.1%+33.3%
ARWArrow ElectronicsEnterprise IT Solutions🟢 Cont. Bull+7.3%+72.2%
NSITInsight EnterprisesEnterprise IT Solutions🌱 Emerging Bull+4.9%+24.1%
Compared against · context, not the story
AVTAvnetComponent & Specialty Distribution🟢 Cont. Bull−3.1%+78.2%
SNXTD SynnexBroad IT Infrastructure🟢 Cont. Bull+1.8%+76.1%
SCSCScanSourceComponent & Specialty Distribution🌱 Emerging Bull+6.1%+34.0%
CDWCDWIT Infrastructure & Operations🌱 Emerging Bull+5.6%−13.7%
INGMIngram MicroIT Infrastructure & Operations🟢 Cont. Bull+1.0%+40.8%

12-month price & trend

CNXN
PC Connection
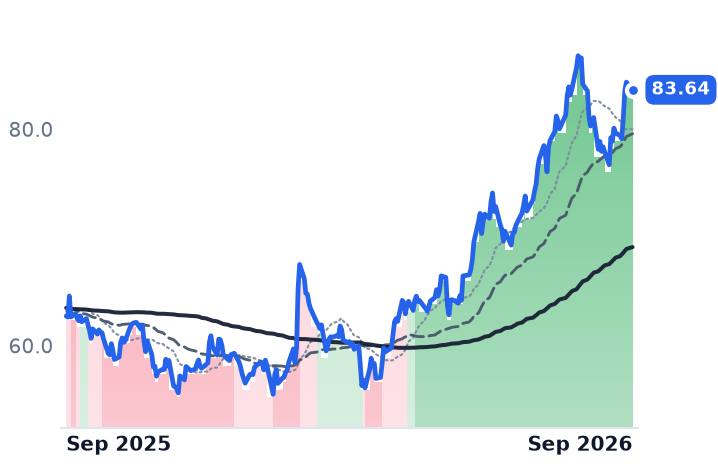
83.64
−0.71 (−0.84%)
vs. prior close
Price20d50d150d
CNXN 12-month price
Enterprise IT Solutions
ARW
Arrow Electronics
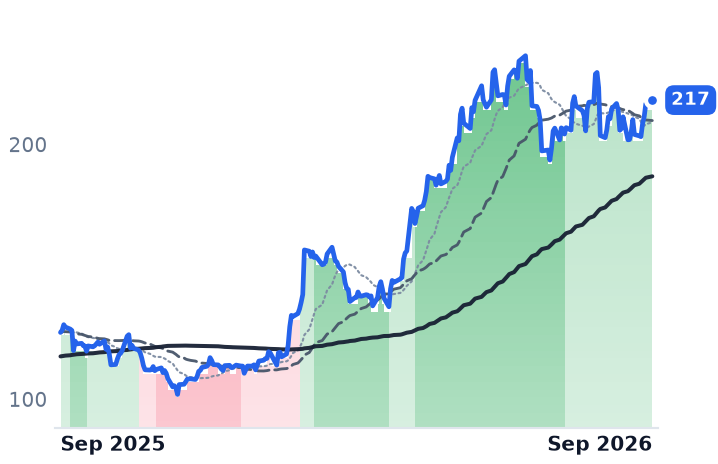
217
+1.44 (+0.67%)
vs. prior close
Price20d50d150d
ARW 12-month price
Enterprise IT Solutions
NSIT
Insight Enterprises
157
−3.64 (−2.26%)
vs. prior close
Price20d50d150d
NSIT 12-month price
Enterprise IT Solutions
TickerMkt capP/EP/E fwdP/SP/S fwdP/GPP/GP fwdEV/EBITDAFCF yld
CNXN$2.1B22.1x20.0x0.7x0.7x3.7x3.6x13.9x1.6%
ARW$11.1B13.8x10.0x0.3x0.3x2.8x2.5x10.2x8.1%
NSIT$4.8B23.0x12.6x0.6x0.5x2.5x2.4x12.9x8.9%
AVT
Avnet
92.84
+0.78 (+0.85%)
vs. prior close
Price20d50d150d
AVT 12-month price
Component & Specialty Distribution
SNX
TD Synnex
261
−2.01 (−0.76%)
vs. prior close
Price20d50d150d
SNX 12-month price
Broad IT Infrastructure
SCSC
ScanSource
57.93
−0.55 (−0.94%)
vs. prior close
Price20d50d150d
SCSC 12-month price
Component & Specialty Distribution
TickerMkt capP/EP/E fwdP/SP/S fwdP/GPP/GP fwdEV/EBITDAFCF yld
AVT$6.9B32.2x16.4x0.3x0.3x2.6x2.5x12.6x0.5%
SNX$20.0B17.8x13.2x0.3x0.3x4.2x3.9x10.6x1.9%
SCSC$855.9M12.2x10.7x0.3x0.3x2.1x2.1x5.8x14.5%
CDW
CDW
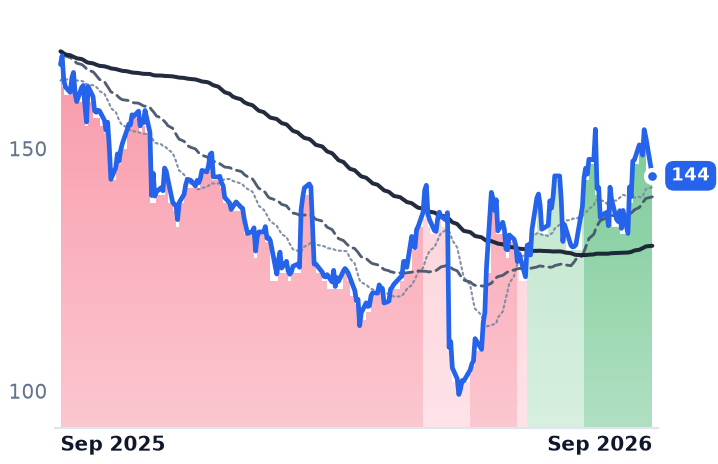
144
−7.99 (−5.24%)
vs. prior close
Price20d50d150d
CDW 12-month price
IT Infrastructure & Operations
INGM
Ingram Micro
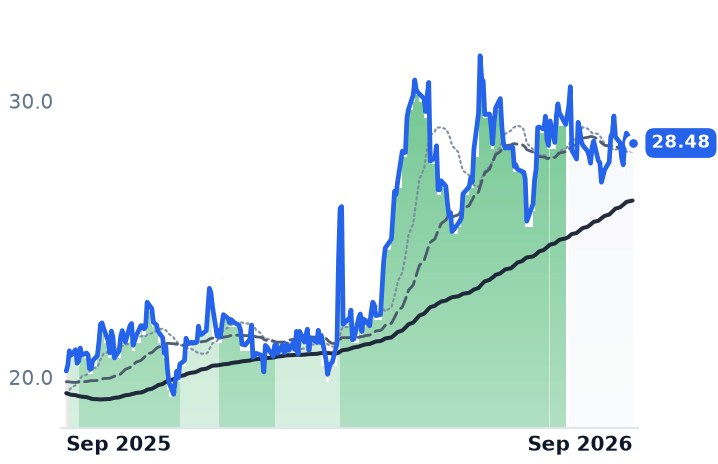
28.48
−0.36 (−1.25%)
vs. prior close
Price20d50d150d
INGM 12-month price
IT Infrastructure & Operations
TickerMkt capP/EP/E fwdP/SP/S fwdP/GPP/GP fwdEV/EBITDAFCF yld
CDW$18.9B17.7x13.5x0.8x0.8x3.8x3.6x13.4x5.9%
INGM$6.3B14.8x8.0x0.1x0.1x1.7x1.6x7.5x-3.7%

Consensus projections

TickerFY2026EFY2027EFY2028E
CNXNRevenue+7.0%+2.4%
EPS+22.8%+6.9%
ARWRevenue+32.1%+7.6%+7.9%
EPS+109.8%+12.5%+10.8%
NSITRevenue+6.7%+3.8%+6.2%
EPS+28.5%+6.0%+16.6%
AVTRevenue+22.2%+14.3%+9.6%
EPS+52.1%+54.9%+11.8%
SNXRevenue+20.5%+7.0%+8.9%
EPS+44.9%+12.9%+15.9%
SCSCRevenue+2.6%+3.9%+3.8%
EPS+12.9%+13.9%+20.3%
CDWRevenue+8.9%+3.7%+2.8%
EPS+10.5%+9.2%+8.9%
INGMRevenue+11.6%+3.5%+4.3%
EPS+19.9%+10.6%+11.3%

Forward fiscal years only. Blank means no analyst coverage for that year.

PC Connection shipped roughly the same number of notebooks and desktops in the June quarter that it shipped a year earlier, and billed almost a fifth more for them. Endpoint device revenue — notebooks, mobility and desktops — rose 19.5% while units grew 3%. The gap is price, and the price is being set several links upstream, in the memory market.

That makes the company's best-ever quarter a bet on an input it does not control. On September 7, the memory researcher TrendForce had conventional DRAM contract prices rising 13-18% quarter over quarter in the third quarter, a deceleration from earlier quarters' far larger increases, with NAND up 10-15%. Several U.S. cloud providers have signed long-term agreements that cap what they pay, which concentrates the escalation on the channel's smaller buyers — the small and mid-sized businesses, schools and government agencies that Connection sells to.

A record quarter built on average selling prices

Connection, a Merrimack, New Hampshire reseller that sells hardware, software and networking gear plus design and deployment services through Business Solutions, Enterprise Solutions and Public Sector divisions, grew second-quarter net sales 12.4% to $854.0m. Gross profit set a record at $157.5m, up 14.3%, and operating income rose 44.3% to $44.6m for a record 5.22% operating margin. Underneath, Business Solutions gross margin contracted 50 basis points to 23% precisely because of the endpoint-device mix — the fast-growing line is the thinner one.

The cash statement is where the strain shows. The quarter absorbed $61.5m of inventory build and $80.6m of receivables build, the latter because 40% of quarterly revenue landed in June around Microsoft's fiscal year-end. Connection's trailing free-cash-flow yield is 1.61%. Management expects roughly $150m of that inventory to come down by year-end as it is deployed to customers, and quantified mid-single-digit customer pull-ins ahead of announced price increases. The balance sheet remains unlevered — $340.7m of cash and short-term investments, the dividend raised to $0.27 a share from $0.20, $81.2m of buyback authorization left. Enterprise Solutions ended the quarter with a record backlog, Business Solutions backlog at a three-year high, and Connection won Dell's 2026 North America Channel Partner of the Year.

What the other two are selling

Arrow Electronics, which distributes semiconductors and passive components to manufacturers and sells data-center infrastructure through a second arm, grew gross profit 32.6% in the June quarter with book-to-bill above 1 in all three regions and backlog building into the first half of 2027. Asked where the cycle stands, interim chief executive William F. Austen told investors on the August 6 call that "the starting pitcher is still in the game, they have not gone to the relief pitcher yet, and they are in the second inning, somewhere in that range." Arrow trades at 2.76x trailing gross profit and just under 10x forward earnings. Insight Enterprises, which builds and manages IT estates for corporate departments, grew gross profit 17.9% with cloud gross profit up 39% to $171m and core services up 21% — annuity-shaped dollars — and is the cheapest of the three at 2.51x trailing gross profit against 12.6x forward earnings. Connection is the most expensive on that meter, 3.74x trailing and 3.59x forward, with the narrowest trailing-to-forward earnings gap, 22.1x to 20.0x.

The part the business earns

Connection's shares have gone nowhere for a month, off 0.6% while Arrow rose 6.8% and Insight 5.4%, and it is now the only one of the three whose 50-day average still sits above its 200-day; Arrow's crossed down in mid-July and Insight's in late July. Over twelve months Connection is up 32.2%, and the decomposition is unflattering: trailing-four-quarter gross profit grew 6.4%, while price-to-gross-profit expanded from roughly 3.04x to 3.74x. Nearly all of the year's re-rating is multiple, on the weakest gross-profit growth in the group.

The operating discipline is real and earned — a record margin on a 14% gross-profit quarter is no accounting effect. What the business does not yet explain is the multiple, because the growth driving it is device price inflation that reverses when memory normalizes, while Arrow's rests on a components backlog and Insight's on recurring cloud and services. CDW, roughly three times Insight's size and chasing the same corporate wallet, fell 12% in August on record sales as memory inflation ate its margin. That squeeze has so far passed through Connection rather than into it.

Connection reports third-quarter results on October 28, and expects roughly $150m of inventory to leave the warehouse by year-end. Whether it leaves at the prices it was bought at is the memory market's decision, not Connection's.

Collegium Cut 2026 Guidance to $825-855m as Its Own Nucynta Generic Undercut the Brand

Hypothesis Opus 5 · Research Opus 5 · Writing Opus 5 · Prompt v1.6

A company that buys approved drugs rather than discovering them can lose a quarter of a product's revenue without losing a single prescription. Collegium's Nucynta tapentadol franchise fell 24% year over year to $35.2m in the June quarter because Hikma's authorized generic — a copy Collegium itself licensed — clears at 10-15% of branded immediate-release price. Guidance came down on August 6 and the shares closed 18.7% lower that day, then kept sliding.

Pacira is the mirror image inside the same industry label: EXPAREL revenue grew 3% on roughly 4% procedure growth, so its net price is slipping too, but the number of Americans whose insurers pay for it separately is widening. Collegium at 2.5 times trailing enterprise value to earnings before interest, taxes, depreciation and amortization, against Indivior's 10.6, is less cheap than finite: Belbuca, about 28% of guided revenue, carries a contractual January 2027 generic date.

COLLPCRXINDVSUPNJNJAuthorized Generic ErosionGross-To-Net PricingPatent Cliff ExposureDebt-Funded Drug AcquisitionsNon-Opioid Pain Management
TickerCompanySegmentTrend · 13mo30D1Y
The subject · what this brief is about
COLLCollegium PharmaceuticalSpecialty Branded Pharma⚠️ Emerging Bear−14.7%−38.2%
PCRXPacira BioSciencesSpecialty Branded Pharma🌱 Emerging Bull+7.0%−2.7%
Compared against · context, not the story
INDVIndivior PharmaceuticalsSpecialty Branded Pharma🟢 Cont. Bull−10.9%+38.7%
SUPNSupernus PharmaceuticalsSpecialty Branded Pharma⚠️ Emerging Bear−9.7%−7.3%
JNJJohnson & JohnsonOncology🟢 Cont. Bull+3.7%+52.7%

12-month price & trend

COLL
Collegium Pharmaceutical
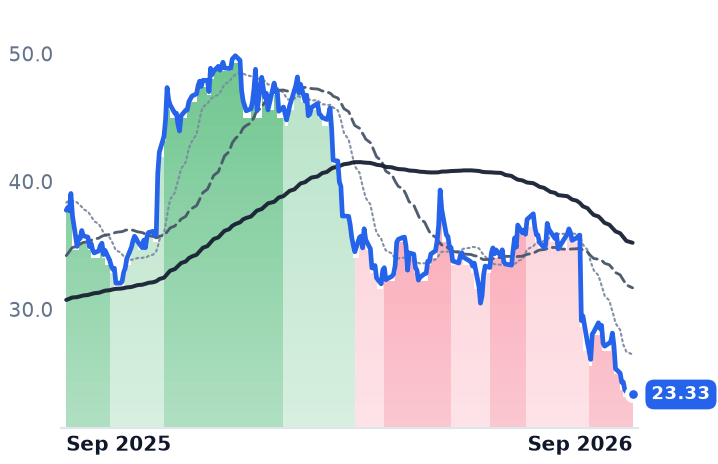
23.33
−0.20 (−0.85%)
vs. prior close
Price20d50d150d
COLL 12-month price
Specialty Branded Pharma
PCRX
Pacira BioSciences
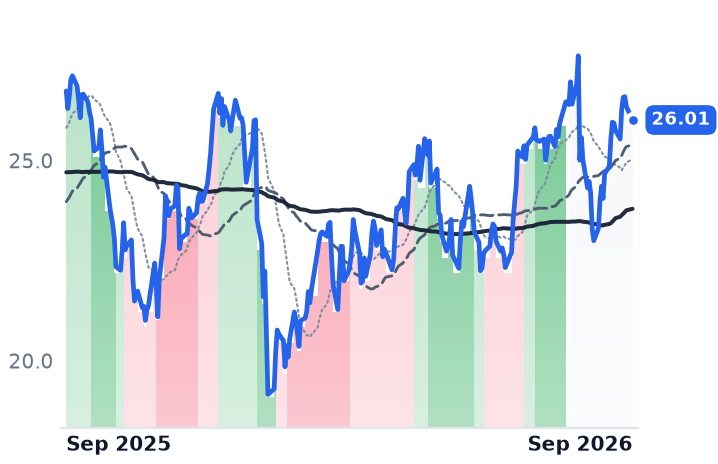
26.01
−0.34 (−1.27%)
vs. prior close
Price20d50d150d
PCRX 12-month price
Specialty Branded Pharma
INDV
Indivior Pharmaceuticals
34.31
−0.63 (−1.80%)
vs. prior close
Price20d50d150d
INDV 12-month price
Specialty Branded Pharma
TickerMkt capP/EP/E fwdP/SP/S fwdP/GPP/GP fwdEV/EBITDAFCF yld
COLL$758.0M15.3x3.1x0.9x0.9x1.6x1.5x2.5x43.3%
PCRX$1.0B73.5x9.0x1.4x1.4x1.7x1.7x10.7x17.6%
INDV$4.3B12.1x8.1x3.2x3.2x3.8x3.8x10.6x-2.6%
SUPN
Supernus Pharmaceuticals
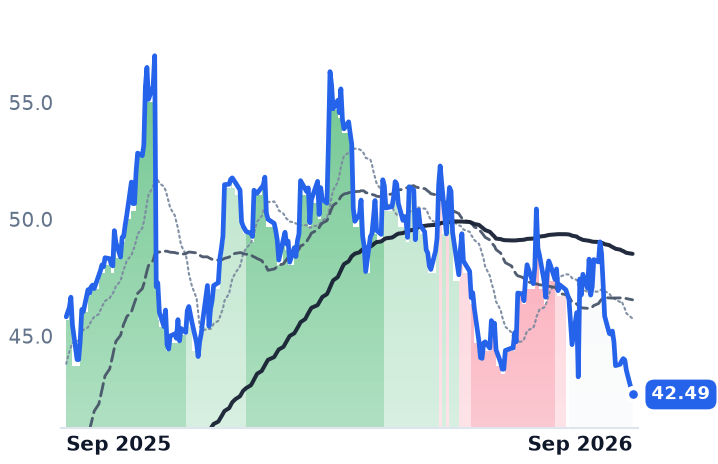
42.49
−1.03 (−2.38%)
vs. prior close
Price20d50d150d
SUPN 12-month price
Specialty Branded Pharma
JNJ
Johnson & Johnson
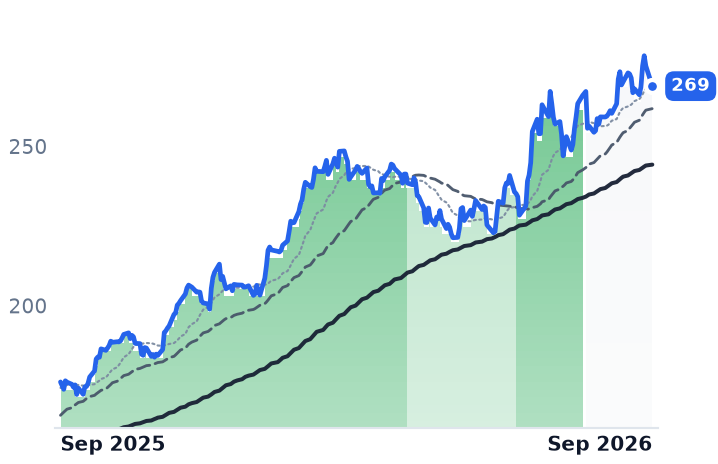
269
−6.35 (−2.31%)
vs. prior close
Price20d50d150d
JNJ 12-month price
Oncology
TickerMkt capP/EP/E fwdP/SP/S fwdP/GPP/GP fwdEV/EBITDAFCF yld
SUPN$2.5Bn/m16.5x3.0x2.8x3.4x3.2xn/m0.8%
JNJ$545.7B26.3x19.6x5.7x5.4x8.2x7.8x17.1x3.3%

Consensus projections

TickerFY2026EFY2027EFY2028E
COLLRevenue+7.1%−1.0%−1.0%
EPS−0.1%−9.4%−13.9%
PCRXRevenue+3.2%+4.7%+13.1%
EPS−2.4%+19.6%+37.1%
INDVRevenue+11.8%+5.1%+6.4%
EPS+79.4%+9.4%+4.8%
SUPNRevenue+25.1%+56.0%+21.3%
EPS−17.2%+73.9%+21.1%
JNJRevenue+7.6%+6.7%+6.7%
EPS+7.2%+10.2%+10.3%

Forward fiscal years only. Blank means no analyst coverage for that year.

Collegium Pharmaceutical, a Stoughton, Massachusetts company that buys approved pain medicines rather than inventing them, told investors on August 6 that its full-year revenue would land between $825m and $855m, down from $865m to $895m. Almost none of the shortfall was patients or prescriptions. It was the price per unit the company collects after rebates, chargebacks and discounts — and the discount doing the damage was one Collegium arranged itself.

That distinction is the whole business model. A specialty branded pharma company of this kind has no laboratory; it has a balance sheet. It borrows to buy drugs that are already approved and already selling, and repays out of whatever exclusivity remains on them. Its reported revenue is therefore a wasting asset with dates attached, and the meter that matters is net revenue per script, not the growth rate on the top line.

The generic Collegium licensed to itself

Collegium signed an authorized generic agreement with Hikma Pharmaceuticals USA covering Nucynta and Nucynta ER, and Hikma has launched. Those copies clear at 10-15% of branded immediate-release price and 20-25% of the extended-release price, so the franchise cannibalizes itself: Nucynta revenue fell 24% to $35.2m in the June quarter, including $5.1m from the generics, while units largely held. Xtampza ER, the abuse-deterrent oxycodone, fell 14% to $45.0m — $2.4m of that gap was rebate timing in the prior-year quarter, an accounting artifact of the same gross-to-net machinery. "I would expect the net pricing to have stabilized at this point, and that is reflected in our full-year guidance," chief financial officer Colleen Tupper said on the August 6 call. Gross margin fell to 55.2% from 57.7%; operating margin went from 18.7% to 1.9%, with a $15.1m loss after $24.1m of acquisition costs.

The calendar behind the rest is public. Belbuca, at $57.7m the second-largest product, has a contractual January 2027 generic entry date under a Teva settlement; Xtampza's licensed generic cannot arrive before September 2033. The offset is attention-deficit medicine: Jornay PM grew 41% to $46.1m and holds 29.2% of the branded long-acting methylphenidate market, and Azstarys, bought from Corium for $650m cash partly on a $300m delayed-draw term loan, is protected into 2037. Net debt sits at 2.1 times adjusted EBITDA, with $210m of 2.875% convertible notes due February 2029. Consensus already models earnings per share falling from $7.47 this year to $5.83 in 2028.

The same mechanism, running the other way

Pacira BioSciences sells EXPAREL, a liposomal bupivacaine injected during surgery, and ZILRETTA for knee osteoarthritis. Its unit is a procedure, not a prescription. EXPAREL grew 3% to $147.8m on about 4% volume, so net price slipped there too, on vial mix and third-party group-purchasing discounts live since mid-2025; adjusted gross margin fell to 78% from 82%. But its price line is being widened by payers, not narrowed: UnitedHealthcare began reimbursing EXPAREL separately on July 1, taking covered lives with separate payment to roughly 150m. Pacira also sold the iovera cryoanalgesia device to Zimmer Biomet, closing July 31 for $73.6m, which is why its own revenue guidance came down. Its generics are contractually deferred to volume-limited quantities from early 2030. Consensus earnings rise, from $2.88 to $4.73 by 2028.

What the market is actually pricing

This is not a sector event. Indivior is up 39% over twelve months and agreed an all-stock merger of equals with Supernus on August 3, consolidation being the industry's standard answer to an exclusivity clock. Collegium fell into a rising market. At 2.5 times trailing EV/EBITDA against Indivior's 10.6 and Pacira's 10.7, and on a 43% trailing free-cash-flow yield, Collegium's shares are not priced as a bargain but as a terminal value: cash flows that are real, contracted, and dated. The business genuinely deteriorated, so the 38% twelve-month decline is earned; what nothing yet settles is whether the ADHD leg compounds faster than the pain portfolio decays.

Both companies sell relief they did not invent, and both now depend on paperwork more than promotion. Collegium's next test is a Teva launch window that opens in January 2027; Pacira's is the Medicare non-opioid payment provision that lapses on December 31, 2027 unless Congress extends it. Neither sales force can move either date.

Centrus's Russian Enrichment Supply Ends in 2027 and Its Own Plant Starts in 2029

Hypothesis Opus 5 · Research Opus 5 · Writing Opus 5 · Prompt v1.6

The only American-owned uranium enricher buys most of what it sells from Russia's TENEX and France's Orano, and the Russian half of that arrangement has a legal end date fifteen months out. Centrus's own centrifuge plant at Piketon does not produce commercially until 2029, leaving a gap its $4.5bn order book cannot cover.

The second half of the business is an appropriations line: the government contract that actually paid revenue expired on June 30, 2026, and Technical Solutions sales fell 21% to $22.7m. Its $900m replacement asks for one metric ton of high-assay fuel by March 2032. Consensus has earnings falling from $3.90 in 2025 to $2.54 this year, which is why the shares trade at 73.1x forward earnings against 73.9x trailing — no growth priced at all.

LEUCCJLTBRSMROKLOUECURANNESPYUranium Enrichment CapacityRussian Fuel Import BanHALEU Advanced FuelsNuclear Fuel CycleSMR BuildoutFederal Contract Funding
TickerCompanySegmentTrend · 13mo30D1Y
The subject · what this brief is about
LEUCentrus EnergyUranium⚠️ Emerging Bear−2.3%−9.4%
Compared against · context, not the story
CCJCamecoUranium⚠️ Emerging Bear+5.7%+33.6%
LTBRLightbridgeElectrical Equipment & Parts🔴 Cont. Bear−10.1%−44.2%
SMRNuScale PowerAdvanced Nuclear🔴 Cont. Bear+20.7%−67.1%
OKLOOkloEmerging & Specialized Energy🔴 Cont. Bear−2.5%−38.2%
UECUranium EnergyUranium⚠️ Emerging Bear+7.3%+2.6%
URAGlobal X - Uranium ETFAsset Management⚠️ Emerging Bear+7.6%+21.0%
NNENano Nuclear EnergyPower & Propulsion Systems🔴 Cont. Bear+3.5%−39.5%
SPYState Street SPDR S&P 500 ETF TrustAsset Management🟢 Cont. Bull−0.8%+19.3%

12-month price & trend

LEU
Centrus Energy
185
+11.49 (+6.61%)
vs. prior close
Price20d50d150d
LEU 12-month price
Uranium
CCJ
Cameco
103
+2.26 (+2.24%)
vs. prior close
Price20d50d150d
CCJ 12-month price
Uranium
LTBR
Lightbridge
7.98
+0.40 (+5.28%)
vs. prior close
Price20d50d150d
LTBR 12-month price
Electrical Equipment & Parts
TickerMkt capP/EP/E fwdP/SP/S fwdP/GPP/GP fwdEV/EBITDAFCF yld
LEU$3.5B73.9x73.1x7.4x7.5x31.9x32.1x38.9x-6.3%
CCJ$44.4B172.2x65.7x17.6x12.4x64.0x45.0x71.0x0.8%
LTBR$277.3Mn/mn/mn/m-6.1%
SMR
NuScale Power
11.15
+1.45 (+15.00%)
vs. prior close
Price20d50d150d
SMR 12-month price
Advanced Nuclear
OKLO
Oklo
43.70
+2.43 (+5.89%)
vs. prior close
Price20d50d150d
OKLO 12-month price
Emerging & Specialized Energy
UEC
Uranium Energy
12.12
+0.59 (+5.07%)
vs. prior close
Price20d50d150d
UEC 12-month price
Uranium
TickerMkt capP/EP/E fwdP/SP/S fwdP/GPP/GP fwdEV/EBITDAFCF yld
SMR$2.8Bn/m261.9x91.1x432.7xn/m-27.7%
OKLO$7.3Bn/mn/m-3.8%
UEC$6.5Bn/m321.7x64.7x760.1x152.9xn/m-1.9%
URA
Global X - Uranium ETF
47.96
+1.90 (+4.13%)
vs. prior close
Price20d50d150d
URA 12-month price
Asset Management
NNE
Nano Nuclear Energy
19.30
+1.58 (+8.92%)
vs. prior close
Price20d50d150d
NNE 12-month price
Power & Propulsion Systems
SPY
State Street SPDR S&P 500 ETF Trust
768
−2.59 (−0.34%)
vs. prior close
Price20d50d150d
SPY 12-month price
Asset Management
TickerMkt capP/EP/E fwdP/SP/S fwdP/GPP/GP fwdEV/EBITDAFCF yld
URA$3.9B
NNE$1.1Bn/m887.7xn/m-3.7%
SPY$773.0B

Consensus projections

TickerFY2026EFY2027EFY2028E
LEURevenue+5.2%−0.8%−10.9%
EPS−43.4%+12.2%−22.3%
CCJRevenue+4.4%+12.1%+8.6%
EPS+8.1%+69.5%+26.2%
SMRRevenue−26.7%+434.9%+101.2%
EPS−74.7%+33.4%−18.3%
OKLORevenue+241.0%+577.4%
EPS+50.0%+10.3%+16.5%
UECRevenue−59.3%+272.6%+157.9%
EPS+56.8%−79.8%−647.6%
NNERevenue+1684.0%+356.5%+39.0%
EPS−23.4%+55.2%+34.3%

Forward fiscal years only. Blank means no analyst coverage for that year.

Centrus Energy sells enrichment it does not make. The Bethesda, Maryland company supplies low-enriched uranium to utilities in the United States, Japan and Belgium, and buys most of the separative work units it resells under long-term contracts with Russia's TENEX and France's Orano — two of the three largest Western-market enrichers it also competes against. Its filings run the TENEX supply term through December 31, 2027.

The day after that, the last waivers under the Prohibiting Russian Uranium Imports Act lapse; the Department of Energy sets the outside date at January 1, 2028, after which no Russian enriched uranium may enter the country. Centrus's own centrifuge plant at Piketon, Ohio is guided to commercial production in 2029. Between the two dates sits the question the order book does not answer. American reactor operators bought roughly 3.28 million separative work units of Russian enrichment in 2025, close to 26% of their purchases — volume that must be re-sourced from Western capacity on the same calendar.

A delivery schedule, not a price signal

Enrichment prices are at records and Centrus barely feels them. UxC put spot separative work at $215 at the end of August, against $200 in January, with long-term values around $181. Centrus realized a 3% increase in enrichment pricing in the June quarter, because deliveries bill out under multi-year contracts struck years earlier. Revenue rose 14% to $176.1m only because uranium resale replaced enrichment: volumes of separative work fell 23%, gross margin compressed from 34.9% to 28.3%, and operating income fell 69% to $10.4m.

The other half of the company is an appropriations line. Technical Solutions revenue fell 21% to $22.7m on a $5.9m decline in high-assay low-enriched uranium operations, as the demonstration contract wound down. The Department of Energy had split its three-year option into a one-year extension worth $108.2m and a two-year follow-on, exercising only the first; it expired June 30, 2026. The replacement, signed the same day, is a $900m fixed-price contract with options taking it to $1.07bn, requiring one metric ton of high-assay fuel by March 2032. It is excluded from backlog.

What the order book buys

Backlog reached $4.5bn extending to 2040, and financial contingencies came off more than $3bn of customer contracts in the quarter. "Importantly, all financial contingencies in our contingent LEU enrichment backlog have now been removed," chief executive Amir Vexler told investors on the August 6 call, adding that "we are seeing strong demand signals across all three of our addressable markets: commercial LEU, national security, and HALEU." Management also said utilities are waiting to see centrifuges delivered and installed before committing further, and declined to guide beyond this year.

The machines are being paid for with equity. Diluted shares rose a third over eight quarters to 21.89m, including $53.9m raised through the at-the-market program in the June quarter against $71.6m of capital expenditure; full-year capital deployment guidance is $350m to $500m, funded from $1.9bn of cash. Urenco's competing American expansion at Eunice, New Mexico adds 2.1 million separative work units with first cascades expected in 2032.

The de-rating is earned; the bottom is not

Consensus earnings fall from $3.90 reported in 2025 to $2.54 this year and $1.47 by 2029. That is why the shares carry 73.1x forward earnings against 73.9x trailing — the multiple expanded from roughly 64x forward in May as estimates were cut faster than the price. Cameco, the fuel-cycle anchor that mines and converts uranium but sells no enrichment, shows the opposite shape: 172.2x trailing falling to 65.7x forward.

The shares closed at $185.38, about 60% below the $464.25 high of the past year, with JPMorgan cutting its target to $178 from $236. Monday's 6.6% gain came with NuScale up 15.0% and Oklo up 5.9% while the market fell, on no fresh catalyst and no company announcement; the likelier reading is sector rotation.

The income statement and the estimate path earn the year's decline. The order book argues the other way, and it is real — but it converts when cascades spin, not when contracts are signed, and the contracts that supply today's margin die before the cascades run. Between the last legal shipment of Russian material and the first commercial pound out of Piketon lies a hole in the calendar, and the government contract meant to close it asks for a single metric ton by 2032.