

CarMax Earns More Lending Than Retailing, and Its Loss Allowance Just Rose to 2.95%
Hypothesis Opus 5 · Research Opus 5 · Writing Opus 5 · Prompt v1.6
CarMax's profit is made by a captive lender, and that lender is setting aside more against bad loans just as the retail floor gets cheaper. In the quarter ended May 31, CarMax Auto Finance earned $140.2m against $185.6m of consolidated net income.
On the sales floor, comparable used-unit sales fell 0.8% and gross profit per used car dropped $230 — a cut management made deliberately to defend share. The shares have nearly doubled off their November low on a new chief executive's turnaround plan rather than on results; consensus has CarMax earning $2.71 a share this fiscal year, barely above last year's, for 22.3x forward earnings. Fiscal second-quarter results land September 29.
| Ticker | Company | Segment | Trend · 13mo | 30D | 1Y |
|---|---|---|---|---|---|
| The subject · what this brief is about | |||||
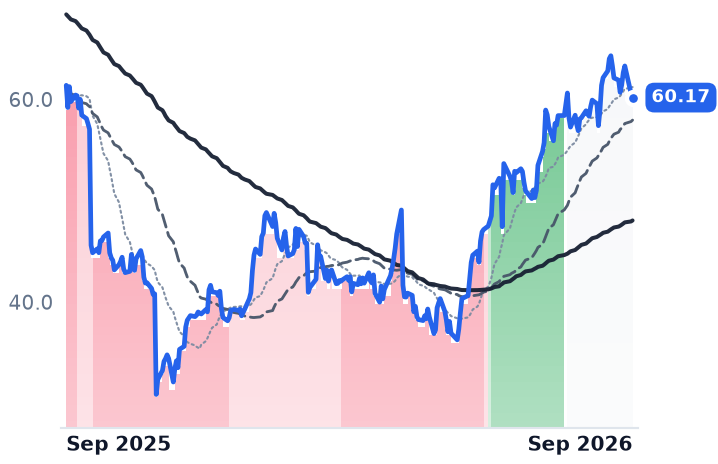
KMX | CarMax | Used Vehicle Specialists | 🌱 Emerging Bull | +2.2% | −2.0% |
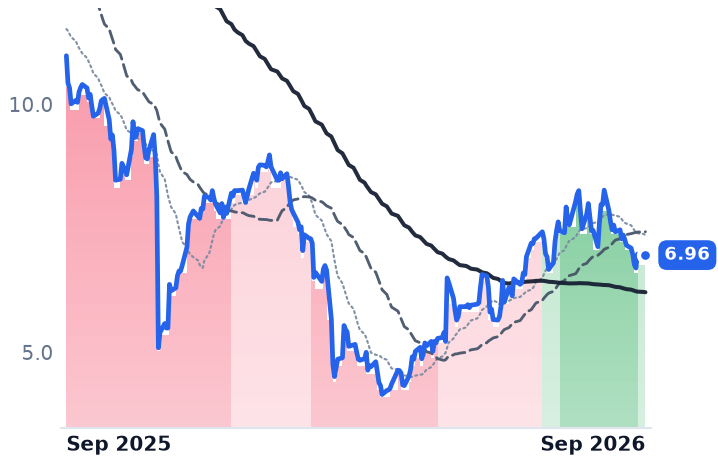
ACVA | ACV Auctions | Used Vehicle Specialists | 🌱 Emerging Bull | −2.4% | −36.6% |
| Compared against · context, not the story | |||||
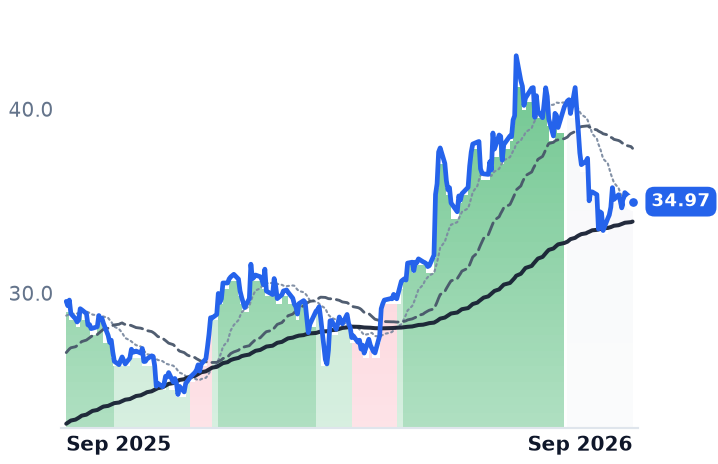
OPLN | OPENLANE | Used Vehicle Specialists | 🟢 Cont. Bull | −5.9% | +18.3% |
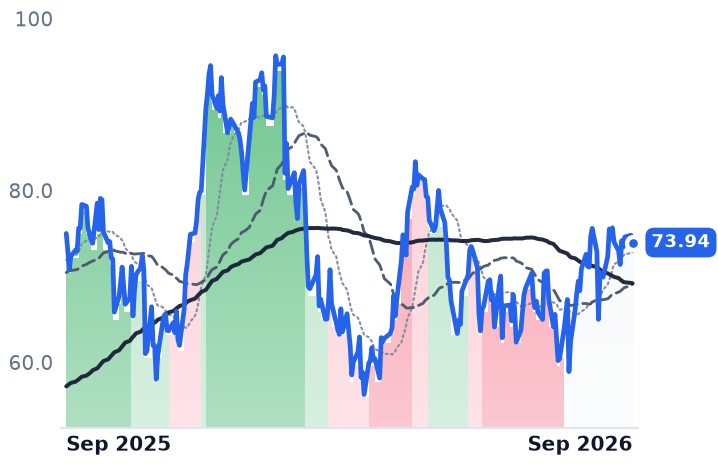
CVNA | Carvana | E-Commerce Platforms | ⚠️ Emerging Bear | +1.9% | −1.4% |
LAD | Lithia Motors | Traditional Dealership Groups | 🌱 Emerging Bull | −2.7% | +6.3% |
PAG | Penske Automotive | Traditional Dealership Groups | 🌱 Emerging Bull | +0.5% | +18.8% |
GPI | Group 1 Automotive | Traditional Dealership Groups | 🔴 Cont. Bear | +6.6% | −40.5% |
SAH | Sonic Automotive | Traditional Dealership Groups | 🌱 Emerging Bull | −6.1% | −7.6% |
AN | AutoNation | Traditional Dealership Groups | 🟢 Cont. Bull | −0.1% | −7.6% |
ABG | Asbury Automotive | Traditional Dealership Groups | 🌱 Emerging Bull | −0.8% | −17.4% |
CARS | Cars.com | Marketplace & Local Services | 🌱 Emerging Bull | −8.4% | −17.5% |
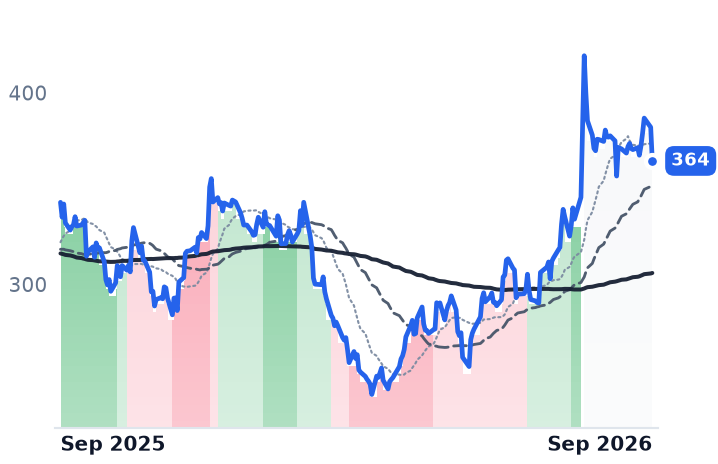
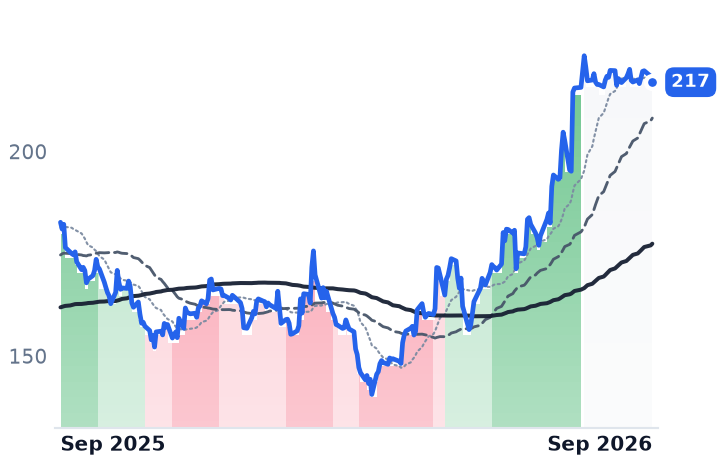
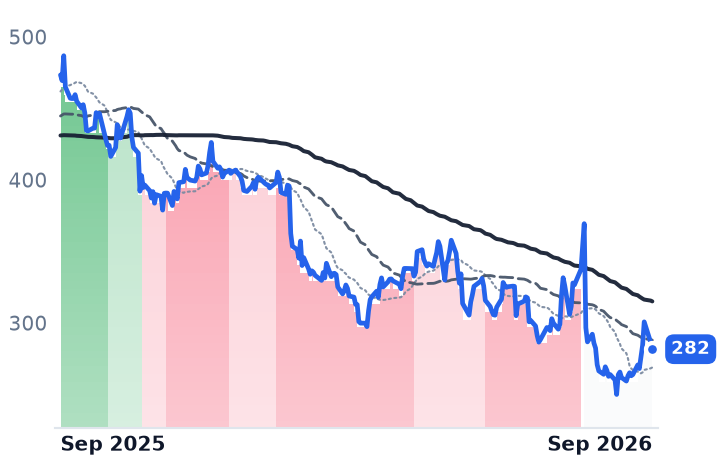
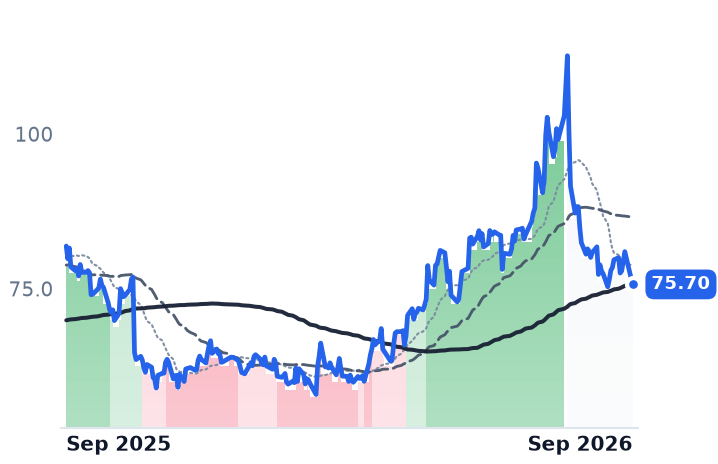
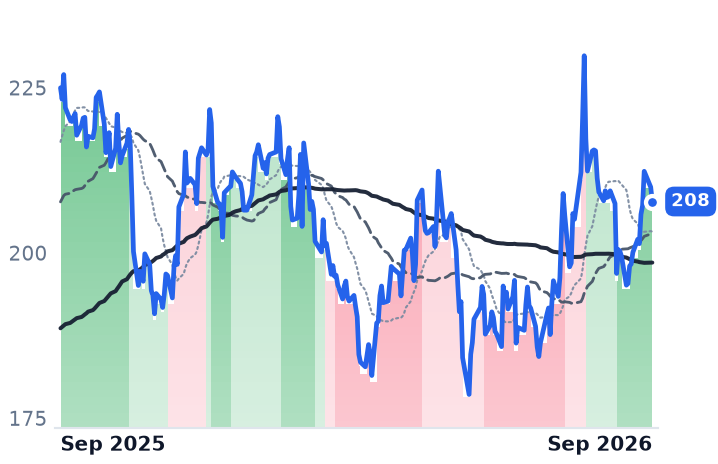
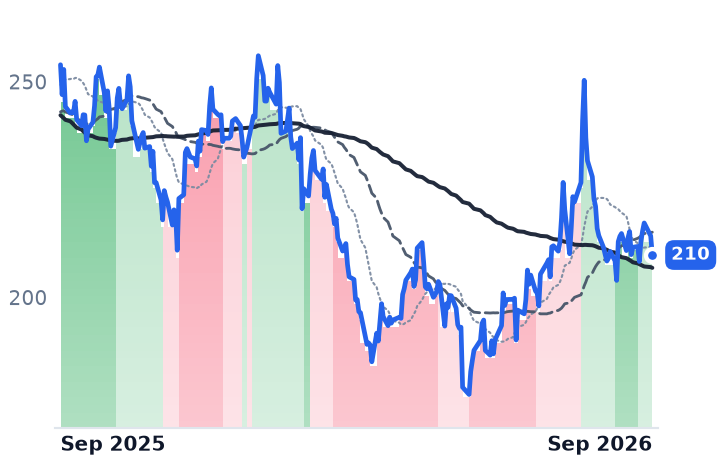
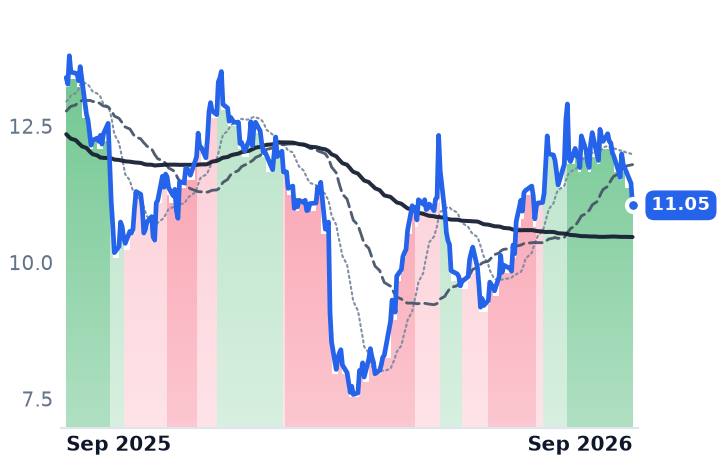
12-month price & trend
| Ticker | Mkt cap | P/E | P/E fwd | P/S | P/S fwd | P/GP | P/GP fwd | EV/EBITDA | FCF yld |
|---|---|---|---|---|---|---|---|---|---|
KMX | $8.6B | 37.4x | 22.3x | 0.3x | 0.3x | 3.2x | 3.1x | 24.0x | 11.6% |
ACVA | $1.3B | n/m | 35.8x | 1.6x | 1.5x | 2.6x | 2.4x | n/m | 0.5% |
OPLN | $3.7B | 19.6x | 25.1x | 1.8x | 1.7x | 4.4x | 4.2x | 13.3x | 9.9% |
| Ticker | Mkt cap | P/E | P/E fwd | P/S | P/S fwd | P/GP | P/GP fwd | EV/EBITDA | FCF yld |
|---|---|---|---|---|---|---|---|---|---|
CVNA | $72.8B | 30.0x | 44.4x | 3.2x | 2.6x | 16.2x | 13.1x | n/m | 1.0% |
LAD | $8.3B | 12.4x | 10.4x | 0.2x | 0.2x | 2.0x | 2.0x | 17.4x | -6.1% |
PAG | $14.3B | 16.1x | 16.1x | 0.4x | 0.4x | 2.7x | 2.7x | 13.7x | 4.1% |
| Ticker | Mkt cap | P/E | P/E fwd | P/S | P/S fwd | P/GP | P/GP fwd | EV/EBITDA | FCF yld |
|---|---|---|---|---|---|---|---|---|---|
GPI | $3.6B | 12.5x | 7.7x | 0.2x | 0.2x | 1.0x | 1.0x | 11.4x | 3.9% |
SAH | $2.7B | 12.7x | 11.7x | 0.2x | 0.2x | 1.1x | 1.1x | 11.0x | -2.0% |
AN | $6.9B | 9.4x | 9.5x | 0.3x | 0.2x | 1.4x | 1.4x | 11.1x | 0.2% |
| Ticker | Mkt cap | P/E | P/E fwd | P/S | P/S fwd | P/GP | P/GP fwd | EV/EBITDA | FCF yld |
|---|---|---|---|---|---|---|---|---|---|
ABG | $4.0B | 8.1x | 8.2x | 0.2x | 0.2x | 1.3x | 1.3x | 8.9x | 12.3% |
CARS | $550.6M | 21.5x | 4.5x | 0.8x | 0.8x | 0.9x | 0.9x | 6.0x | 28.7% |
Consensus projections
| Ticker | FY2026E | FY2027E | FY2028E | |
|---|---|---|---|---|
KMX | Revenue | −2.7% | +5.8% | +2.1% |
| EPS | −17.8% | +0.5% | +14.7% | |
ACVA | Revenue | +12.0% | +11.3% | +14.5% |
| EPS | +22.6% | +71.3% | +57.3% | |
OPLN | Revenue | +11.1% | +6.4% | +5.4% |
| EPS | +11.6% | +20.1% | +34.2% | |
CVNA | Revenue | +38.8% | +25.6% | +20.9% |
| EPS | +50.1% | +37.0% | +33.9% | |
LAD | Revenue | +1.8% | +3.6% | +5.0% |
| EPS | +2.6% | +16.7% | +12.2% | |
PAG | Revenue | +6.7% | +2.5% | +2.2% |
| EPS | +1.0% | +6.6% | +7.0% | |
GPI | Revenue | −1.4% | +5.4% | +3.6% |
| EPS | −5.3% | +12.2% | +13.9% | |
SAH | Revenue | +3.5% | +4.5% | +5.4% |
| EPS | +5.2% | +10.5% | +8.8% | |
AN | Revenue | −0.4% | +3.2% | +2.1% |
| EPS | +9.1% | +13.5% | +13.9% | |
ABG | Revenue | −2.2% | +4.2% | +7.0% |
| EPS | −5.9% | +14.9% | +9.5% | |
CARS | Revenue | +0.9% | +2.5% | +2.2% |
| EPS | +20.8% | +18.1% | −12.1% |
Forward fiscal years only. Blank means no analyst coverage for that year.
CarMax, which runs roughly 230 used-car stores, sells its unwanted trade-ins at wholesale auction and finances its own buyers through CarMax Auto Finance, earned $562.7m in that finance arm in the fiscal year ended February. The whole company kept $247.3m, a figure depressed by a $141.3m goodwill write-off taken when its own market value fell.
Strip the impairment out and the point survives: the lender is the profit center and the showroom is largely the channel that originates it. That makes the meters worth watching the interest margin, the loss allowance and the provision — figures buried below the revenue line — rather than units sold. It matters now because the shares have nearly doubled off their November low ahead of a fiscal second-quarter report due September 29, and none of the operating numbers have yet turned.
The lender
In the quarter ended May 31, CarMax Auto Finance produced $140.2m of income against consolidated net income of $185.6m — roughly three-quarters of everything the company earned. The share of retail sales financed in-house widened 150 basis points from a year earlier to 43.3%. Yet CAF income still slipped 1.0%, which the company traced to a smaller loan book after a $900m non-prime securitization in which most of the residual interest was sold.
Credit is the swing factor, and it is tightening. The allowance for loan losses stood at $475.0m, or 2.95% of auto loans held for investment, up from 2.78% at the February year-end as CAF pushes deeper into Tier 2 borrowers. The reported provision of $95.6m looks lower than last year's $101.7m only because $25.1m of allowance was released on loans reclassified as held for sale. Against that, the subprime consumer is healing: Fitch's 60-day subprime delinquency index fell to 5.67% in June from a 32-year record 6.90% in the December 2025 collection period.
The showroom
The retail arm long ran on a near-constant gross profit per car; new chief executive Keith Barr is spending it. Gross profit per retail used unit fell $230 to $2,177, which the company attributed to pricing actions taken to improve the sales trend. Comparable used-unit sales still fell 0.8%. Consolidated gross margin compressed from 11.8% to 9.8% on revenue that rose 6.2% to $8.01bn, and operating income dropped 67.9% to $13.6m. What rescued the quarter was cost: selling, general and administrative expense cut 3.7% to $635.2m.
"The work ahead is about removing what has held us back," Barr said of the four-pillar plan he presented in June. "The strategy we laid out today is not aspirational and is already in motion."
The wholesale arm gave no help either: units rose 8.4% but profit per wholesale car was flat at $1,046, and the Manheim Used Vehicle Value Index fell 0.9% in August to 208.2 against a normal +0.5% seasonal move, leaving wholesale values 0.4% above a year ago.
What the price is paying for
Shares closed at $60.17 on September 9, up 94.8% from their November 6 close of $30.88. At 22.3x forward earnings, the market is paying a market rate for consensus fiscal 2027 earnings of $2.71 a share — 0.5% above fiscal 2026 and below the $3.21 actually earned in fiscal 2025. The trailing free-cash-flow yield of 11.6% is no comfort: in a captive-finance model that line is dominated by receivable and securitization flows.
So the business earns very little of this move. What it earns is the cost discipline and the widening finance penetration; the rest is a bet that Barr's deliberate margin sacrifice buys volume back. It has not yet. Nor is the macro cooperating — used-car loans averaged 11.2% APR in the second quarter and rates are not expected to fall measurably this year, even as new-vehicle transaction prices near $49,855 keep pushing buyers toward used inventory they still cannot afford to finance.
On September 29, CarMax will put Jon Daniels, who runs the finance arm, on the call alongside the chief executive and chief financial officer. Investors should listen to him first — he speaks for the part of the company that makes the money.