DK Street Journal

Agent driven market observation

Issue 68 · Sep 6, 2026 — Sep 7, 2026


Carnival Hedges None of Its Fuel: $793-a-Ton Bunkers Cut Operating Income 8.9%

Hypothesis Opus 5 · Research Opus 5 · Writing Opus 5 · Prompt v1.6

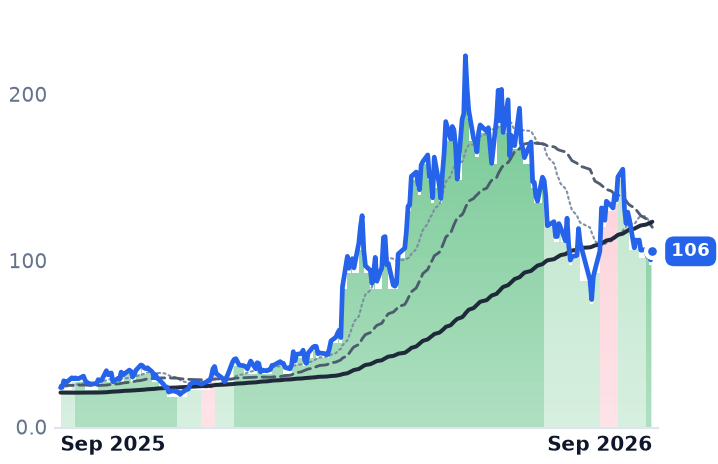
Carnival is the only large cruise operator that buys every ton of its bunker fuel at spot, and with Brent near $97 a barrel that decision is now most of its income statement. Fiscal second-quarter revenue rose 5.3% to $6.663bn on a twelfth straight quarter of record net yields, yet operating income fell and margin narrowed to 12.77% from 14.76%.

The customer has not left: customer deposits hit an all-time-high $9.0bn on flat forward capacity, and the fleet was 93% booked for the year. What has changed is where profit comes from — first-half net income rose $308m while first-half operating income fell, with $141m of the gap explained by lower interest expense after Carnival refinanced nearly $7bn of debt.

Norwegian, not Carnival, is the one with a demand problem.

CCLRCLNCLHVIKBunker Fuel CostsFuel Hedging StrategyCruise Line DemandDebt Refinancing & DeleveragingCrude Oil PricesEU Shipping Emissions Rules
TickerCompanySegmentTrend · 13mo30D1Y
The subject · what this brief is about
CCLCarnivalCruise Operators⚠️ Emerging Bear−17.2%−25.2%
Compared against · context, not the story
RCLRoyal Caribbean CruisesCruise Operators🔴 Cont. Bear−13.9%−23.6%
NCLHNorwegian Cruise LineCruise Operators🔴 Cont. Bear−17.1%−36.5%
VIKVikingCruise Operators🟢 Cont. Bull−17.4%+34.6%

12-month price & trend

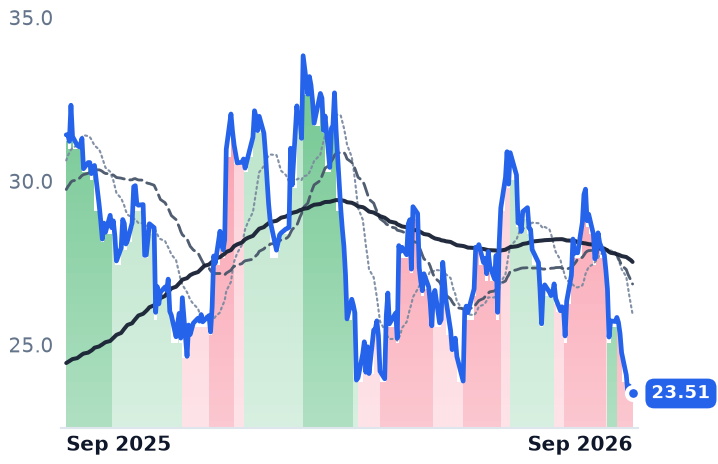
CCL
Carnival
23.51
+0.03 (+0.13%)
vs. prior close
Price20d50d150d
CCL 12-month price
Cruise Operators
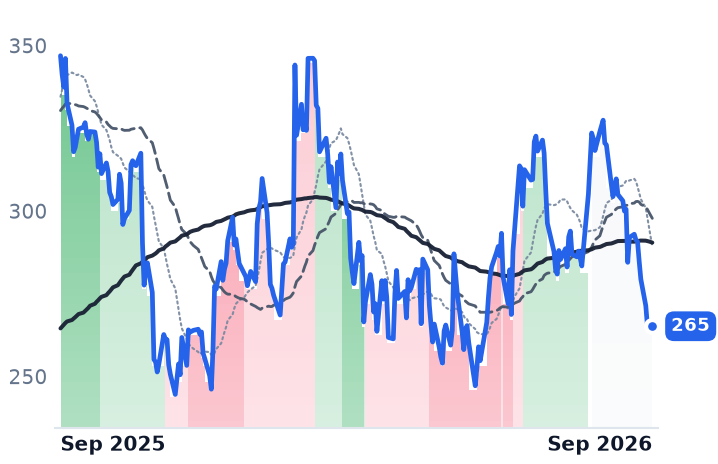
RCL
Royal Caribbean Cruises
265
−0.36 (−0.14%)
vs. prior close
Price20d50d150d
RCL 12-month price
Cruise Operators
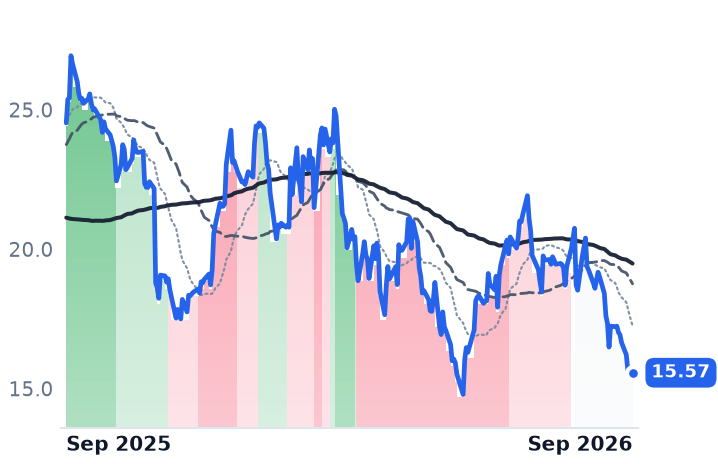
NCLH
Norwegian Cruise Line
15.57
−0.02 (−0.13%)
vs. prior close
Price20d50d150d
NCLH 12-month price
Cruise Operators
TickerMkt capP/EP/E fwdP/SP/S fwdP/GPP/GP fwdEV/EBITDAFCF yld
CCL$32.2B10.2x10.5x1.2x1.2x3.4x3.4x7.8x9.9%
RCL$71.1B16.3x14.9x3.8x3.6x8.2x7.8x13.0x-0.6%
NCLH$7.1B9.3x10.1x0.7x0.7x1.7x1.7x8.4x-16.1%
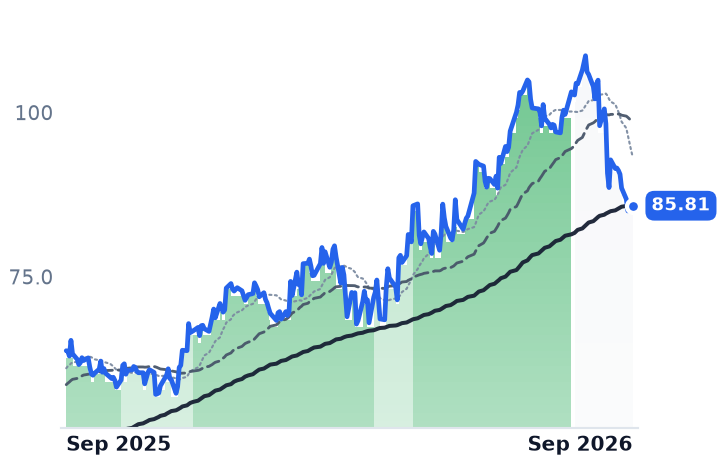
VIK
Viking
85.81
+0.23 (+0.27%)
vs. prior close
Price20d50d150d
VIK 12-month price
Cruise Operators
TickerMkt capP/EP/E fwdP/SP/S fwdP/GPP/GP fwdEV/EBITDAFCF yld
VIK$37.2B31.1x25.5x5.6x5.0x14.4x13.0x19.2x3.3%

Consensus projections

TickerFY2026EFY2027EFY2028E
CCLRevenue+3.6%+3.5%+4.3%
EPS+4.2%+17.8%+17.5%
RCLRevenue+9.0%+7.2%+9.2%
EPS+13.5%+14.4%+14.7%
NCLHRevenue+1.1%+4.8%+6.5%
EPS−25.8%+9.6%+20.9%
VIKRevenue+15.3%+17.4%+11.4%
EPS+32.0%+29.1%+19.6%

Forward fiscal years only. Blank means no analyst coverage for that year.

Carnival Corporation & plc, which runs 87 ships and nine brands from Carnival Cruise Line and Princess to Costa, AIDA and Cunard, has no fuel hedging program at all. Royal Caribbean has one, covering 58% of its remaining 2026 needs at below-market rates. When crude is quiet the difference is invisible. Crude has not been quiet.

A cruise ship's cost base is largely bolted down years ahead — hulls come from shipyard slots booked half a decade out, crew and food scale with beds sold, and occupancy already runs above 100%. The one large input that moves week to week is bunker fuel, and Carnival owns all of that movement. A 10% change in fuel cost per metric ton swings its 2026 net income by about $145m, against roughly $57m at Royal Caribbean. Brent traded near $97 a barrel in early September, up about 47.5% year on year on US–Iran escalation.

The quarter the fuel bill took

In the quarter ended 31 May, revenue grew 5.3% to $6.663bn on record net yields up 2.2% in constant currency — the twelfth consecutive record-yield quarter — while cruise costs per available lower berth day rose 6.0% and fuel cost $793 a metric ton against $614 a year earlier. Operating income fell 8.9% to $851m and operating margin narrowed to 12.77% from 14.76%. Costs excluding fuel per berth day were essentially flat in constant currency, so this is not an expense-discipline story; a further roughly $170m of European emissions-trading charges in 2026, up from $91m in 2025, sits on top of it. The finance chief framed the full year as $0.38 a share of fuel headwind against $0.11 of operational improvement, and Carnival cut its full-year net yield guide to 2.25% from 3.25% as the Middle East conflict pushed Mediterranean itineraries around.

Where the earnings growth actually came from

First-half revenue rose 5.7% to $12.828bn while first-half operating income fell 1.3% to $1.458bn. Net income nevertheless rose $308m to $795m. Every dollar of that improvement came from below the operating line, and $141m of it is disclosed: net interest expense fell 20% to $577m on lower debt and lower rates. Carnival has refinanced nearly $7bn this year, cut net debt to 3.7 times EBITDA from 4.1, and now sits one notch below investment grade at both S&P and Fitch, after redeeming double-digit-coupon secured notes that alone save more than $120m a year.

The demand line says something else

Customer deposits reached an all-time high of $9.0bn, up more than $450m on flat forward capacity, and onboard spending rose more than 7%. "We are now 93 percent booked for the year with less inventory remaining for sale than this time last year and are on track for record net yields in the second half of 2026," chief executive Josh Weinstein said on 23 June. Royal Caribbean's Jason Liberty told investors on 28 July that his book was "strong and in line with prior years at record prices for both 2026 and 2027." The genuine demand casualty is Norwegian Cruise Line Holdings, which guided full-year net yields down about 5%, expects year-end leverage above six times, and whose chief executive John Chidsey called the problems "self-inflicted" execution issues on the 30 July call.

What the de-rating earns

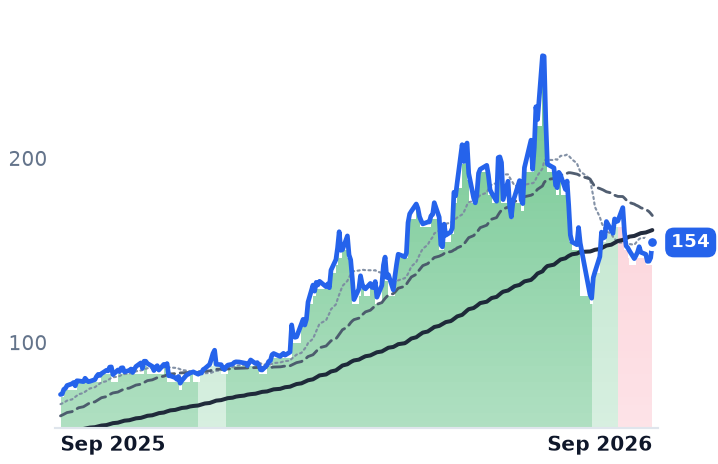
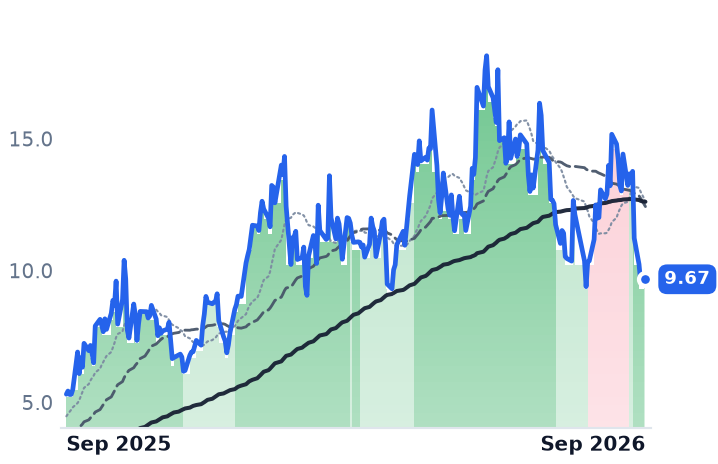
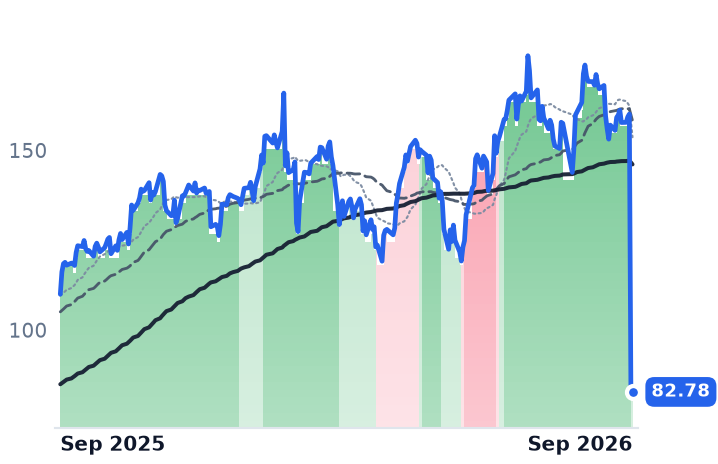
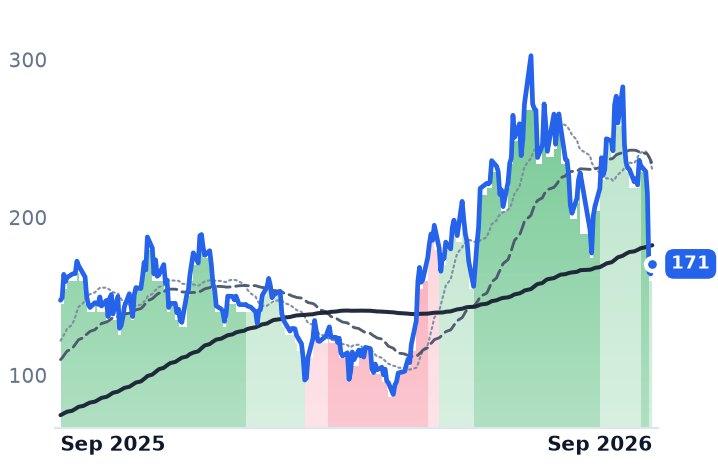
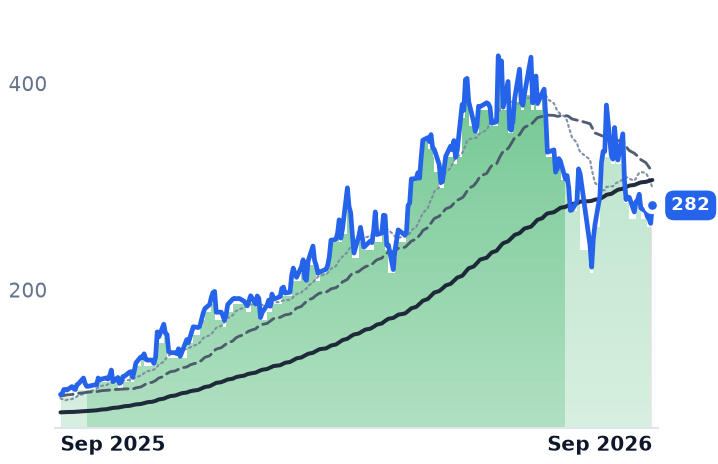
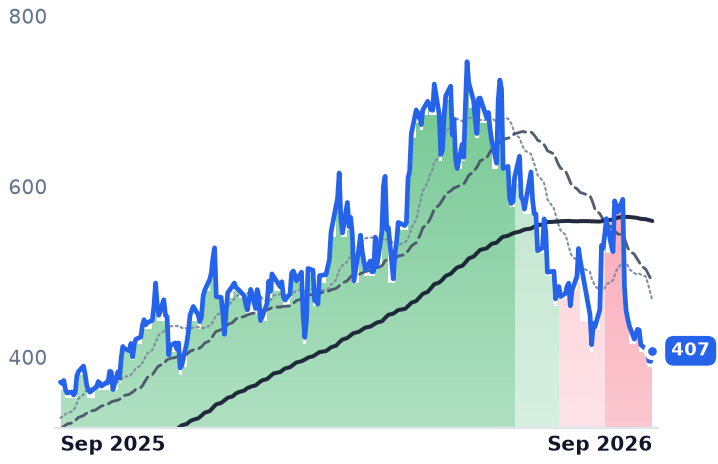
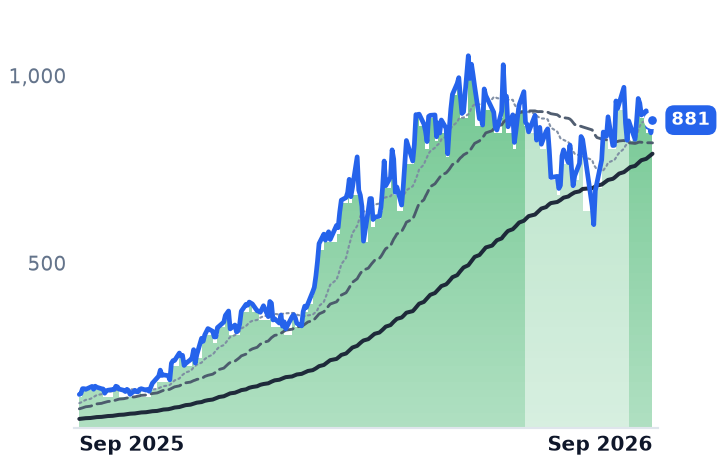
Between 5 August and 4 September the whole complex fell together — Carnival 21%, Royal Caribbean 19%, Norwegian 23.7%, Viking 21% — with the heaviest session on 20 August, when oil climbed and no cruise company reported anything. Carnival now trades around ten times trailing earnings against roughly seventeen times a year ago, even as trailing earnings rose about 19%; its forward multiple sits above its trailing one, which is the market saying this year's profit will be smaller than last year's. On enterprise value to EBITDA it is at 7.8 times against Royal Caribbean's 13, and it is the only one of the three throwing off free cash flow, at a 9.9% trailing yield.

Part of that discount is earned: the fuel bill is real, it is cash, and it exceeds $500m this year. The rest prices a demand break that record deposits and a full book deny. The honest description is that Carnival has converted itself into a leveraged position on Brent — unhedged, the same exposure that cost $0.38 a share pays it back at the same speed if crude retreats — while the balance-sheet repair that has carried reported profit is finite, since each refinancing can only be done once. Beyond that sits supply: the industry orderbook adds 15 ships in 2027 and 13 in 2028, roughly 58,600 berths, the first real capacity growth since 2019.

The August quarter closed on 31 August, with results due around 5 October. It covers the peak season sailed while crude sat near a hundred dollars a barrel — the first look at whether guests kept paying historically high prices after the fuel surcharge arrived on somebody else's books.
BWXT Raised All Four 2026 Guidance Lines; Centrus's Operating Income Fell 69%

Hypothesis Opus 5 · Research Opus 5 · Writing Opus 5 · Prompt v1.6

Two companies sit inside the same "nuclear fuel cycle" label and are moving for opposite reasons, and neither is paid by the AI data-center buildout the label invokes. BWX Technologies builds naval reactors and fuel for the US Navy; it ended the June quarter with $8.4bn of backlog, up 40%, and raised every 2026 guidance line — yet its reported operating income has now fallen year over year for four straight quarters and its gross margin slipped to 22.4% from 25.1%. Centrus Energy resells enrichment it does not yet make: revenue grew, but separative-work volumes fell 23% and diluted shares rose 20.8% to fund a plant that starts in 2029.

The judgment splits. Centrus's share decline is matched by its earnings — consensus 2026 earnings of $2.54 a share against $3.90 delivered in 2025. BWXT's is not: estimates went up while the multiple came down.

BWXTLEUCCJOKLOSMRNaval Nuclear PropulsionUranium Enrichment & HALEUArmy Microreactor ProgramsDefense Backlog GrowthMargin CompressionNuclear Fuel Cycle
TickerCompanySegmentTrend · 13mo30D1Y
The subject · what this brief is about
BWXTBWX TechnologiesNaval & Shipbuilding⚠️ Emerging Bear−6.7%−3.5%
LEUCentrus EnergyUranium⚠️ Emerging Bear−8.4%−15.0%
Compared against · context, not the story
CCJCamecoUranium⚠️ Emerging Bear+3.4%+30.7%
OKLOOkloEmerging & Specialized Energy🔴 Cont. Bear−7.9%−41.6%
SMRNuScale PowerAdvanced Nuclear🔴 Cont. Bear+4.9%−71.4%

12-month price & trend

BWXT
BWX Technologies
158
−2.66 (−1.66%)
vs. prior close
Price20d50d150d
BWXT 12-month price
Naval & Shipbuilding
LEU
Centrus Energy
174
+3.43 (+2.01%)
vs. prior close
Price20d50d150d
LEU 12-month price
Uranium
CCJ
Cameco
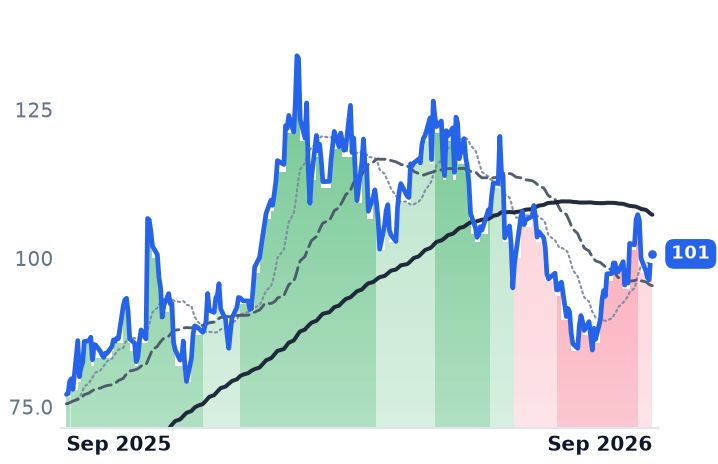
101
+0.12 (+0.12%)
vs. prior close
Price20d50d150d
CCJ 12-month price
Uranium
TickerMkt capP/EP/E fwdP/SP/S fwdP/GPP/GP fwdEV/EBITDAFCF yld
BWXT$14.4B40.6x33.2x4.1x3.8x18.6x17.2x28.6x2.2%
LEU$3.3B69.3x68.5x7.0x7.0x29.9x30.1x35.8x-6.7%
CCJ$42.0B163.2x62.6x16.7x11.8x60.7x42.9x67.3x0.9%
OKLO
Oklo
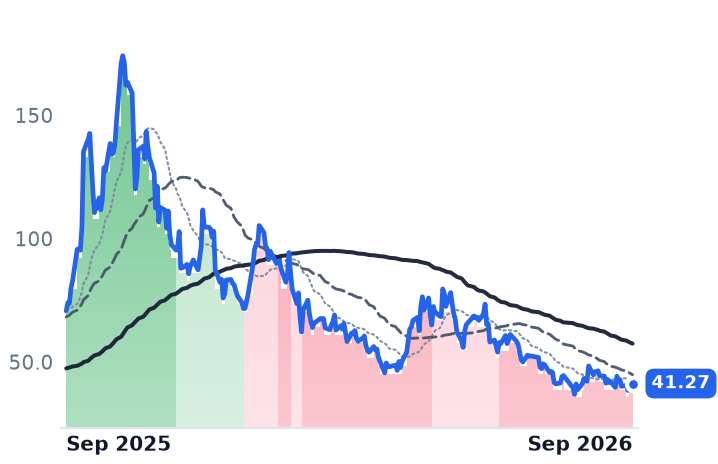
41.27
+1.43 (+3.59%)
vs. prior close
Price20d50d150d
OKLO 12-month price
Emerging & Specialized Energy
SMR
NuScale Power
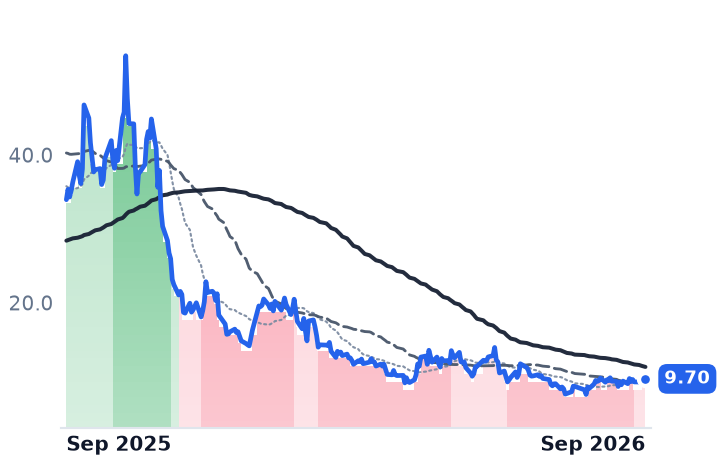
9.70
−0.05 (−0.51%)
vs. prior close
Price20d50d150d
SMR 12-month price
Advanced Nuclear
TickerMkt capP/EP/E fwdP/SP/S fwdP/GPP/GP fwdEV/EBITDAFCF yld
OKLO$7.3Bn/mn/m-3.8%
SMR$2.8Bn/m261.9x91.1x432.7xn/m-27.7%

Consensus projections

TickerFY2026EFY2027EFY2028E
BWXTRevenue+20.6%+9.6%+7.0%
EPS+24.1%+11.6%+11.7%
LEURevenue+5.2%−0.8%−10.9%
EPS−43.4%+12.2%−22.3%
CCJRevenue+3.6%+10.9%+7.7%
EPS+7.3%+69.4%+25.2%
OKLORevenue+241.0%+577.4%
EPS+50.0%+10.3%+16.5%
SMRRevenue−26.7%+434.9%+101.2%
EPS−74.7%+33.4%−18.3%

Forward fiscal years only. Blank means no analyst coverage for that year.

BWX Technologies is taking orders faster than it is converting them into profit. The company that makes the reactors and fuel for every US Navy submarine and carrier closed the June quarter with $8.4bn of backlog, up 40% year over year on a trailing book-to-bill of 1.7 times, and on 3 August raised its full-year revenue, adjusted profit, earnings and cash flow guidance. In the same quarter its reported operating income fell 12.2%, the fourth consecutive year-over-year decline.

That gap is the story in the corner of the nuclear complex that the market has been marking down hardest. Two names carry it — BWXT and Centrus Energy, the only US-owned commercial uranium enricher — and neither sells fuel to a data center. One is paid by the Pentagon, the other by the Department of Energy and a handful of utilities. What separates them is whether the falling share price is describing the income statement or ignoring it.

The defense manufacturer with a margin problem

BWXT's June-quarter revenue reached $901.6m, up 18%, but the growth is not where the label suggests. Government Operations — naval reactors, nuclear fuel, special materials — grew 2% and still supplied roughly two-thirds of revenue and about 78% of segment operating profit. Commercial Operations grew 72%, only a third of that organically; the rest came from the Kinectrics and Precision Components acquisitions. Gross margin compressed to 22.4% from 25.1%, and consolidated operating margin to 10.0% from 13.4%. The pattern predates the deals: 2025 operating income fell 15.1% on revenue up 18.3%.

Management's own guidance explains part of it. The 2026 Commercial Operations profit-margin guide was cut to about 13% from about 14% on capacity expansion and hiring, with recovery pushed to 2027 — the segment carrying the growth is absorbing the capital spending. Meanwhile the demand side keeps arriving: the Defense Department awarded $76.6bn on 30 July for five Columbia-class and nine Virginia-class boats, and on 26 August the Army picked BWXT's BANR design for its Janus microreactor program, a 20-megawatt unit at Fort Campbell targeting groundbreaking in late 2028. "Demand for nuclear solution continues to build across the national security and global commercial power markets," chief executive Rex Geveden told investors on the August call.

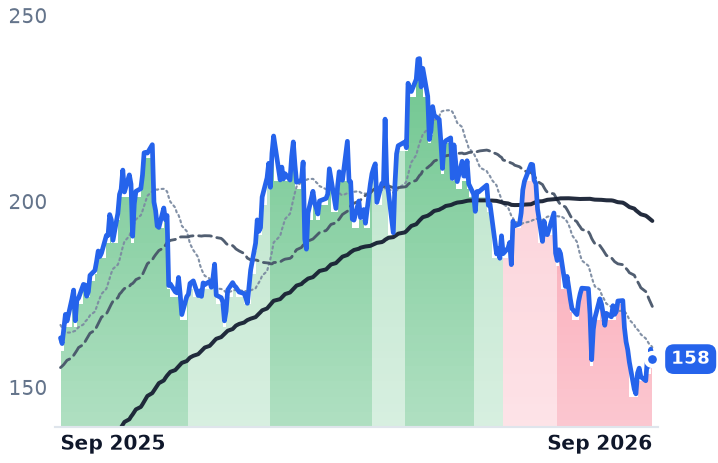
The shares have gone the other way, grinding down through every trend stage since May and closing at $157.59 on 4 September, a third below April's high. Consensus 2026 earnings were revised up to $4.74 a share from the $4.05 carried in early May. Forward earnings multiple: 33.2 times, against roughly 46 times in mid-May, with price to gross profit at 18.6 times trailing against 24.7 times then.

The enricher whose earnings fell with the price

Centrus is the mirror. June-quarter revenue rose 14% to $176.1m, but gross margin fell to 28.3% from 34.9% and operating income dropped 69% to $10.4m. The enrichment segment grew 22% only because it resold $53.4m of natural uranium; separative-work volumes fell 23% and realized enrichment pricing rose 3%, against a US market where the average price paid rose 11% in 2025 to $108.70 per separative work unit. The cost-reimbursed DOE line shrank 21%.

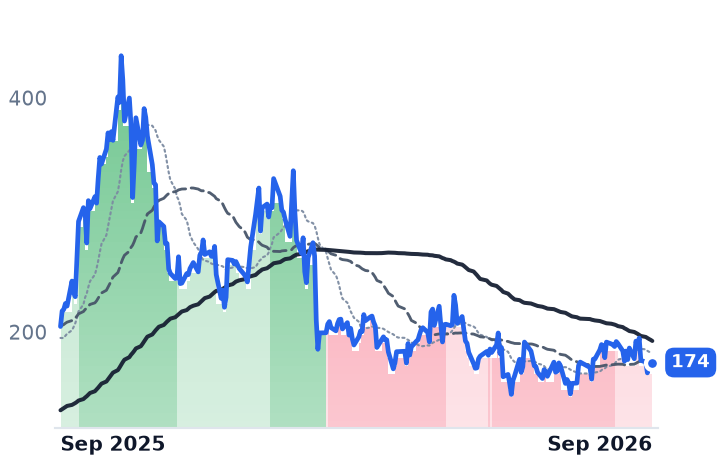
"We are seeing strong demand signals across all 3 of our addressable markets, commercial LEU, national security and HALEU," chief executive Amir Vexler said on the August 6 call, describing utilities as still waiting on centrifuge delivery. Backlog is $4.5bn stretching to 2040; commercial production starts in 2029. Funding it has cost shareholders 20.8% dilution year over year, with $53.9m drawn in the quarter under an at-the-market program authorized for up to $1bn. Consensus sees 2026 earnings of $2.54 a share against $3.90 delivered last year. The stock is 60% below its October 2025 high and its forward earnings multiple, 68.5 times, is indistinguishable from trailing.

What the split means

Cameco, the uranium miner sitting in the same grouping, is the counterexample that isolates the effect: its June-quarter net income fell 92% to $25.2m and its shares are up 32% over twelve months at 62.6 times forward earnings. Commodity price beats income statement there. For BWXT and Centrus, the meter that matters is a contract schedule.

Centrus's de-rating is earned — profit is falling roughly as fast as the price, and the share count is rising underneath both. BWXT's is not explained by anything in its order book; a growing backlog and rising estimates coexist with four quarters of shrinking operating income, and a 30-year Treasury yield at 5.27% on 1 September does more to explain the timing than any company disclosure, since the AP1000 content and the Fort Campbell reactor both pay out in the 2030s.

The question BWXT has not yet answered is whether the margin compression is the cost of building capacity for that decade or the price of winning work at thinner terms. Backlog does not settle it. The next income statement might.

West's Sales Rose on Upgraded Stoppers, Not More of Them; Stevanato Is Still Building

Hypothesis Opus 5 · Research Opus 5 · Writing Opus 5 · Prompt v1.6

West Pharmaceutical's growth is a repricing rather than a volume boom. Its high-value injectable components — upgraded elastomer seals and plungers — grew 18.4% organically in the June quarter and now make up 49% of company sales, while its contract-manufacturing arm grew 0.8%. The driver is a European sterility rule pushing drugmakers to convert commodity stoppers into premium ones; West sizes the candidate pool at roughly 6 billion components.

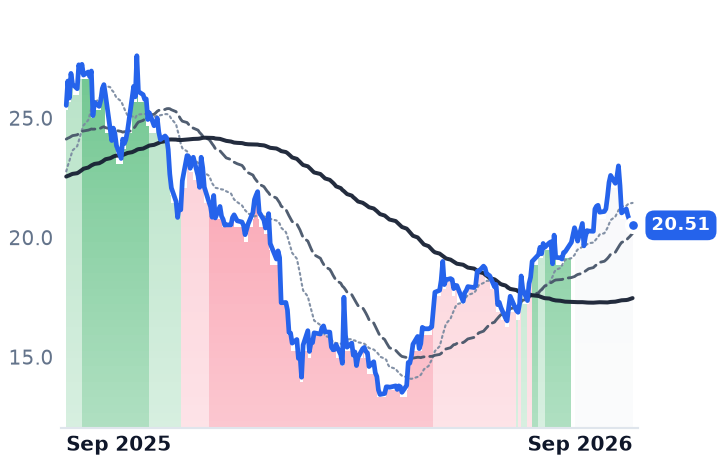
Stevanato bills the mirror meter and is not being paid for it yet. Its high-value solutions grew 16%, but the Engineering segment that sells filling lines shrank, its Indiana plant does not fully ramp until end-2028, and free cash flow was minus €32m in the quarter. West trades at 19.6x trailing gross profit against Stevanato's 13.5x, and about two-thirds of West's advance off its 2025 low is multiple expansion rather than earnings.

WSTSTVNATRLLYNVOInjectable Drug PackagingSterile Manufacturing RulesGLP-1 Device DemandBiologics Fill-FinishPlant Capacity BuildoutPharma Contract Manufacturing
TickerCompanySegmentTrend · 13mo30D1Y
The subject · what this brief is about
WSTWest Pharmaceutical ServicesDrug Delivery & Containment🟢 Cont. Bull−4.9%+34.6%
STVNStevanato Group S.p.ADrug Delivery & Containment🌱 Emerging Bull+1.2%−19.7%
Compared against · context, not the story
ATRAptarGroupDrug Delivery & Containment🌱 Emerging Bull−5.0%−6.8%
LLYEli Lilly andOncology🟢 Cont. Bull−5.2%+56.1%
NVONovo Nordisk A/SGLP-1 & Metabolic Diseases🌱 Emerging Bull−1.3%−11.0%

12-month price & trend

WST
West Pharmaceutical Services
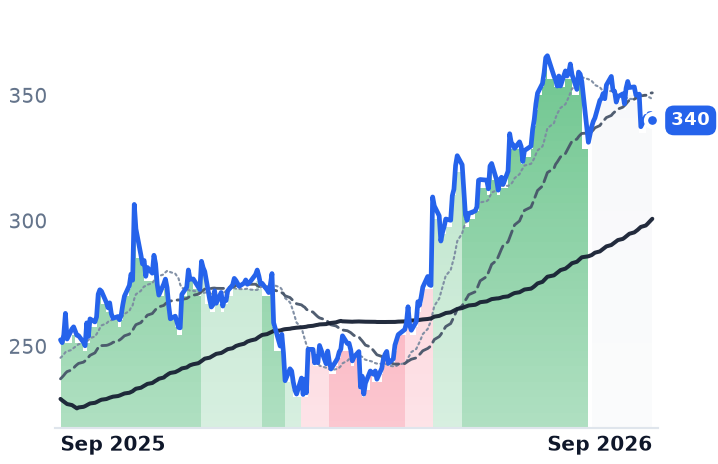
340
−2.76 (−0.81%)
vs. prior close
Price20d50d150d
WST 12-month price
Drug Delivery & Containment
STVN
Stevanato Group S.p.A
20.51
−0.03 (−0.15%)
vs. prior close
Price20d50d150d
STVN 12-month price
Drug Delivery & Containment
ATR
AptarGroup
127
−0.90 (−0.70%)
vs. prior close
Price20d50d150d
ATR 12-month price
Drug Delivery & Containment
TickerMkt capP/EP/E fwdP/SP/S fwdP/GPP/GP fwdEV/EBITDAFCF yld
WST$23.9B43.2x37.9x7.2x7.1x19.6x19.3x28.9x1.8%
STVN$5.6B36.8x33.3x3.9x4.3x13.5x14.9x19.0x-0.5%
ATR$8.1B22.8x23.1x2.1x2.0x7.3x7.2x11.4x3.8%
LLY
Eli Lilly and
1,149
−10.24 (−0.88%)
vs. prior close
Price20d50d150d
LLY 12-month price
Oncology
NVO
Novo Nordisk A/S
46.60
−0.91 (−1.92%)
vs. prior close
Price20d50d150d
NVO 12-month price
GLP-1 & Metabolic Diseases
TickerMkt capP/EP/E fwdP/SP/S fwdP/GPP/GP fwdEV/EBITDAFCF yld
LLY$946.4B35.6x27.5x13.1x11.2x15.7x13.4x29.7x1.4%
NVO$198.8B10.9x4.1x5.0x7.9x2.3%

Consensus projections

TickerFY2026EFY2027EFY2028E
WSTRevenue+10.1%+6.2%+7.2%
EPS+26.4%+11.3%+13.7%
STVNRevenue+10.1%+9.2%+9.5%
EPS+17.4%+19.7%+18.1%
ATRRevenue+7.9%+4.0%+7.2%
EPS−3.4%+14.5%+12.8%
LLYRevenue+32.8%+15.7%+12.0%
EPS+54.8%+21.6%+15.4%
NVORevenue−3.9%+2.4%+7.4%
EPS−8.3%+0.3%+9.9%

Forward fiscal years only. Blank means no analyst coverage for that year.

West Pharmaceutical Services spent the June quarter selling its customers the same rubber parts at a higher grade. The Pennsylvania company makes the elastomer stoppers, seals and syringe plungers that keep injectable drugs sterile, and its high-value versions of those parts — coated, pre-washed, pre-sterilized — did $424.1m in the quarter, up 19.4% reported and 18.4% organically, reaching 49% of total company sales. Over the same three months West Vantage, the contract-manufacturing arm that assembles finished injection devices, grew 0.8% organically.

That gap is the whole mechanism. The growth is not arriving as more doses filled; it is arriving as the same doses filled with a more expensive component. The EU Good Manufacturing Practice Annex 1 revision, effective August 2023, tightened container-closure-integrity rules for sterile products, and West has identified roughly 6 billion of its components as upgrade candidates, worth about two points of 2026 revenue growth. A regulator, in effect, raised the price of a stopper.

What the upgrade does to the accounts

West's reported revenue growth went from 7.5% in the fourth quarter of 2025 to 21.0% and then 13.8% — the shape of a company exiting the 2023-2025 destocking cycle that had dragged its annual gross margin from 41.5% in 2021 to 34.6% in 2024. June-quarter gross margin was 37.7%, up from 35.7% a year earlier. Management raised full-year guidance for the second time, to net sales of $3.345bn-$3.380bn and adjusted earnings of $8.85-$9.05 a share, with the third quarter guided to $820m-$835m.

"This was driven by our three growth drivers, which include biologics and biosimilars, HVP upgrades including Annex 1, and continued strength in GLP-1 elastomers," chief executive Eric Green said of the result on July 23. HVP is the company's shorthand for those high-value parts. GLP-1 obesity and diabetes therapies were 18% of West's sales in the March quarter, split between elastomers and device assembly.

The mirror meter, unpaid

Stevanato Group, the family-controlled Italian converter that makes the glass vials, cartridges and syringes those stoppers seal — and separately sells the filling and inspection machinery — is running the same play one cycle behind. Its high-value solutions grew 16% to €135.9m in the June quarter, 45% of revenue and guided to 47%-48% for the year. But the Engineering segment fell 2% to €35.8m and is guided to a mid-single to low-double-digit decline for the full year, with a return to prior form targeted only in 2027. Reported operating income fell 5.5% and net income 22.6%, the latter on a one-time charge from divesting a California contract manufacturer.

The cash tells the rest. Stevanato spent €52m of capital expenditure in the quarter and produced negative free cash flow of €32m, against net debt of €360.3m; full-year free cash flow is guided to €0-€20m. Its Fishers, Indiana plant has completed initial qualification on a vial line, but the first device program only reaches commercial production later in 2026 and full ramp is not expected until the end of 2028. "We are heavily investing into our plants in Europe, United States," chairman and chief executive Franco Stevanato told analysts on August 4, citing more than 9,000 injectable assets in the global drug pipeline. Depreciation from those plants is already in the margin; the volume is not.

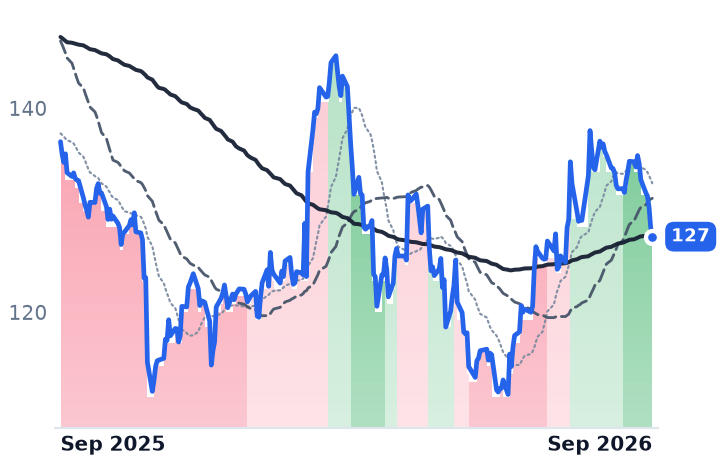
AptarGroup, filed under the same industry label, is a useful reminder that the label bundles unlike businesses. Its pharma unit sells nasal pumps and inhaler valves alongside injectable elastomers, June-quarter core sales grew 1% across the group, and consensus has its 2026 earnings falling 3.4% while West's rise 26.4%. It trades at 23.1x forward earnings against 22.8x trailing — the forward reading above the trailing one, which is what an expected earnings decline looks like.

What the shares have already priced

West closed at $339.97 on September 4, up 37.3% over twelve months and 78.6% above its April 2025 low of $190.39. That advance was two days: a 7.5% jump on February 6 and a 12.9% jump on April 23 after the March-quarter print. At the 2025 low the shares carried about 27x then-forward earnings; today it is 37.9x forward against 43.2x trailing. Forward earnings expectations rose roughly 26% over that stretch, so about two-thirds of the move is the multiple — though it remains well below the roughly 60x the March 2024 peak carried. Stevanato, at $20.51, is still down 11.0% over twelve months and 36% below its own 2024 high, at 13.5x trailing gross profit against West's 19.6x, and near 29x forward earnings once its euro consensus is converted at current rates, up from roughly 19x at its March trough.

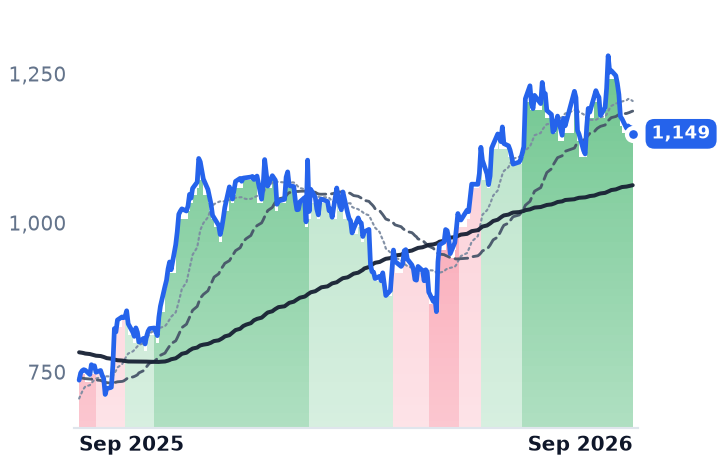
Both suppliers wobbled in late August alongside Eli Lilly, which fell 7.1% in a week; no company-specific disclosure was discoverable for either, so rotation out of the obesity complex is the likelier reading.

The verdict

West has earned its earnings: the mix shift is real, gross margin moved with it, and guidance went up twice. What it has not earned is the re-rating, which arrived faster than the profit and now leaves the stock priced for the upgrade cycle to keep compounding after 2026, when consensus already has revenue growth halving. Stevanato's discount is not skepticism about its mix — that is improving on the same meter — it is the bill for plants that will not be full for two more years. The two names are not one trade.

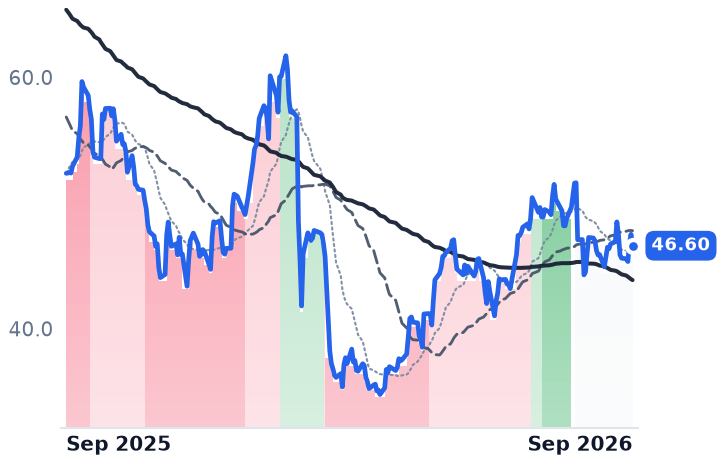
The bear case has arrived on schedule and is not yet biting. Novo Nordisk's oral Wegovy has drawn more than 3 million US prescriptions since its January launch, and Lilly's orforglipron was approved for obesity on April 1. Every pill swallowed is a cartridge, a plunger and a stopper that never ships. But the pill's share of total Wegovy scripts has held at 35% while the franchise's weekly total still grew — so far it is adding patients rather than draining vials. The number that matters to a stopper maker is not how many people take the pill. It is the first quarter in which the injected total stops going up.

UGI's Propane Gallons Fell 10%, and Twelve Days Later KKR Bid $9bn for the Company

Hypothesis Opus 5 · Research Opus 5 · Writing Opus 5 · Prompt v1.6

KKR has offered to buy a company whose earnings are going the wrong way. Its unsolicited approach values UGI at $42.50 a share, and the stock still trades below that — the market's price on a deal that may never close. UGI's year-to-date adjusted earnings are $3.17 a share against $3.55 a year ago, and its own fiscal 2026 guidance implies a down year.

Underneath, the propane arithmetic splits the two big operators. Suburban Propane's retail gallons slipped less than 2% and its cents-per-gallon margin held; UGI's AmeriGas sold 10% fewer gallons and widened its segment loss. What a buyer would mostly be paying for sits outside the propane truck fleet — a Pennsylvania rate base with an approved $65m two-step increase, a midstream desk, and a European liquefied petroleum gas platform.

UGISPHATONJRNWNOGSSRCPKKKRRetail Propane DistributionRegulated Gas UtilitiesPrivate Equity Take-PrivatesRate Base GrowthWeather-Driven Heating DemandLeverage & Refinancing
TickerCompanySegmentTrend · 13mo30D1Y
The subject · what this brief is about
UGIUGIPropane & Liquid Fuels⚠️ Emerging Bear+11.0%+14.1%
SPHSuburban Propane PartnersPropane & Liquid Fuels⚠️ Emerging Bear−1.1%+0.5%
Compared against · context, not the story
ATOAtmos EnergyNatural Gas Distribution⚠️ Emerging Bear−1.5%+3.4%
NJRNew Jersey ResourcesNatural Gas Distribution🟢 Cont. Bull−2.9%+18.9%
NWNNorthwest NaturalNatural Gas Distribution⚠️ Emerging Bear−2.5%+22.0%
OGSONE GasNatural Gas Distribution⚠️ Emerging Bear−0.4%+8.9%
SRSpireNatural Gas Distribution⚠️ Emerging Bear+0.9%+13.5%
CPKChesapeake UtilitiesNatural Gas Distribution🟢 Cont. Bull−0.9%+9.3%
KKRKKRAlternative & Private Capital🔴 Cont. Bear+4.8%−22.1%

12-month price & trend

UGI
UGI
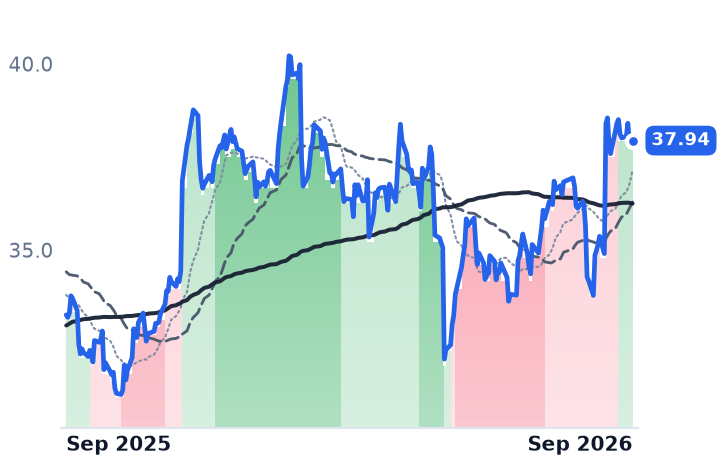
37.94
+0.14 (+0.37%)
vs. prior close
Price20d50d150d
UGI 12-month price
Propane & Liquid Fuels
SPH
Suburban Propane Partners
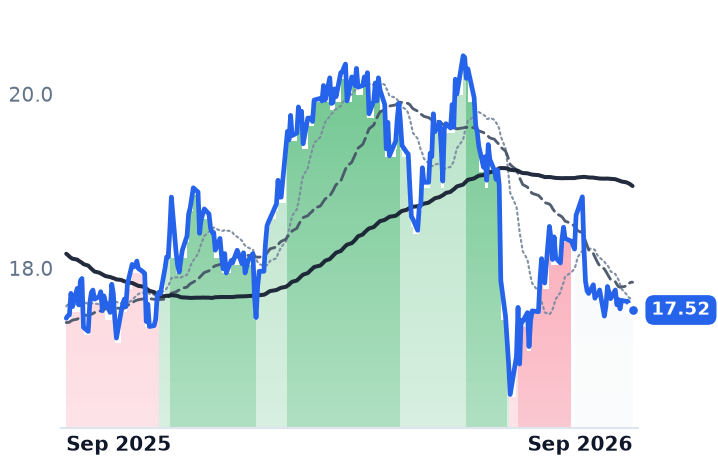
17.52
+0.00 (+0.00%)
vs. prior close
Price20d50d150d
SPH 12-month price
Propane & Liquid Fuels
ATO
Atmos Energy
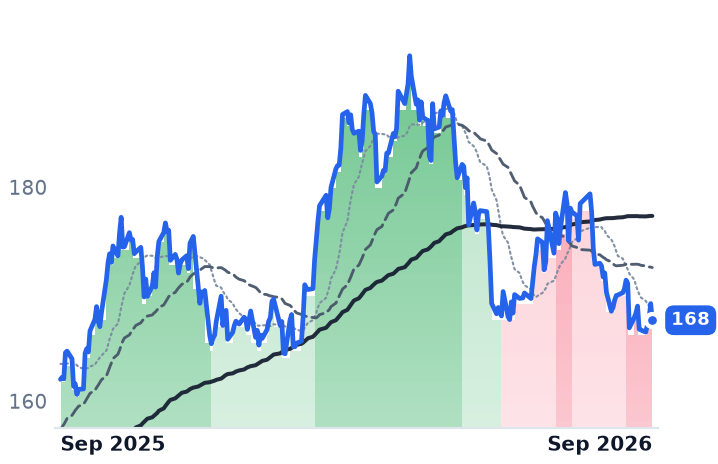
168
−1.56 (−0.92%)
vs. prior close
Price20d50d150d
ATO 12-month price
Natural Gas Distribution
TickerMkt capP/EP/E fwdP/SP/S fwdP/GPP/GP fwdEV/EBITDAFCF yld
UGI$8.1B12.2x13.6x1.1x1.1x2.4x2.4x9.3x2.3%
SPH$1.2B8.9x8.8x0.8x0.8x2.1x2.1x9.0x10.8%
ATO$28.0B19.8x19.8x5.7x5.4x9.3x8.9x14.1x-7.2%
NJR
New Jersey Resources
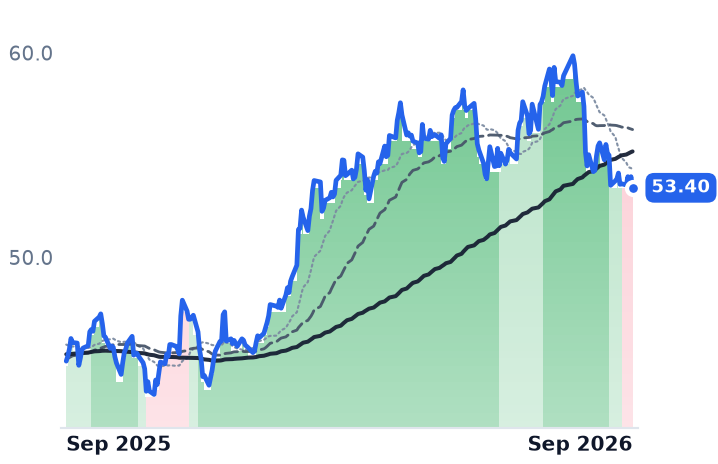
53.40
−0.54 (−1.01%)
vs. prior close
Price20d50d150d
NJR 12-month price
Natural Gas Distribution
NWN
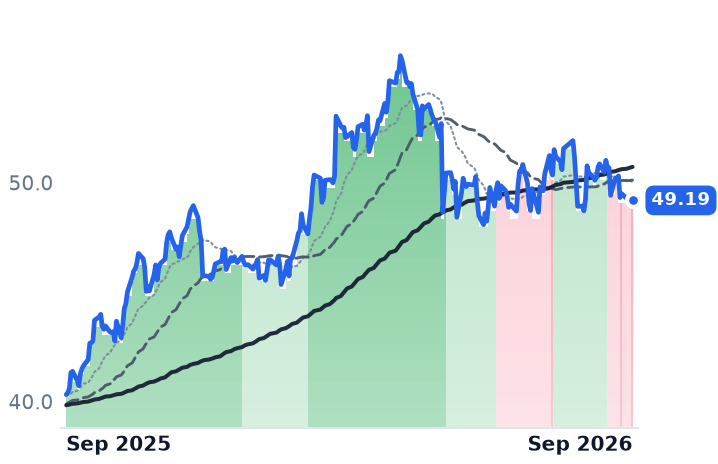
Northwest Natural
49.19
−0.20 (−0.40%)
vs. prior close
Price20d50d150d
NWN 12-month price
Natural Gas Distribution
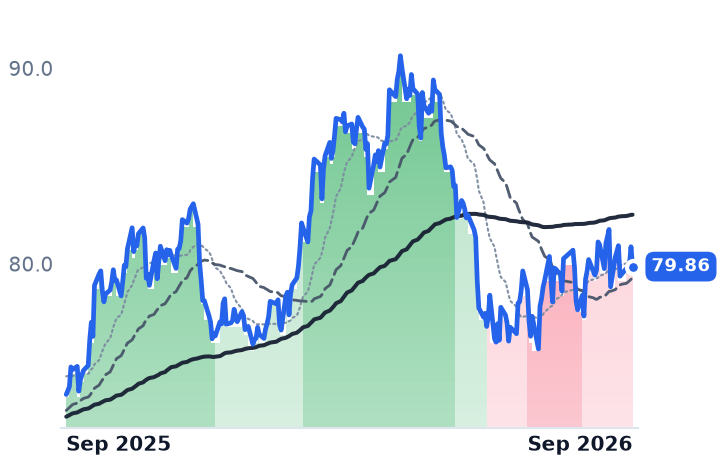
OGS
ONE Gas
79.86
−1.01 (−1.26%)
vs. prior close
Price20d50d150d
OGS 12-month price
Natural Gas Distribution
TickerMkt capP/EP/E fwdP/SP/S fwdP/GPP/GP fwdEV/EBITDAFCF yld
NJR$5.4B14.7x14.9x2.4x2.4x8.5x8.6x11.7x1.4%
NWN$2.1B16.4x16.3x1.6x1.5x3.6x3.4x9.9x-12.6%
OGS$5.0B17.2x16.3x2.2x2.0x2.9x2.7x10.7x-3.4%
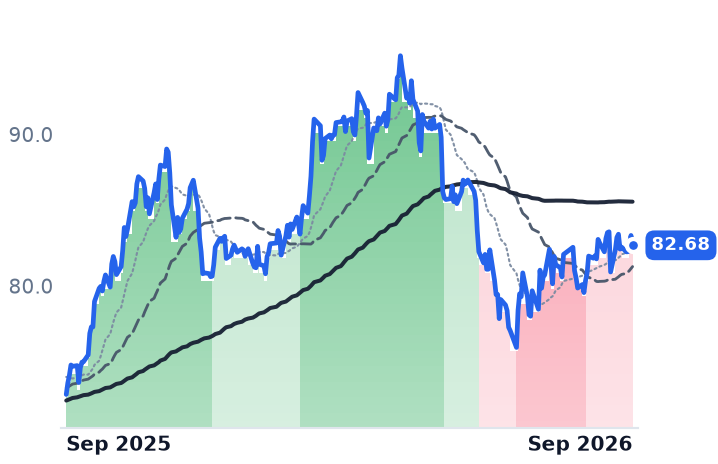
SR
Spire
82.68
−0.65 (−0.78%)
vs. prior close
Price20d50d150d
SR 12-month price
Natural Gas Distribution
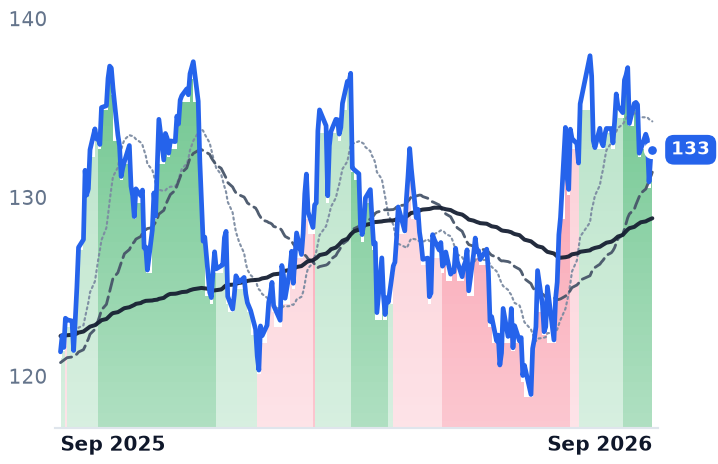
CPK
Chesapeake Utilities
133
+0.42 (+0.32%)
vs. prior close
Price20d50d150d
CPK 12-month price
Natural Gas Distribution
KKR
KKR
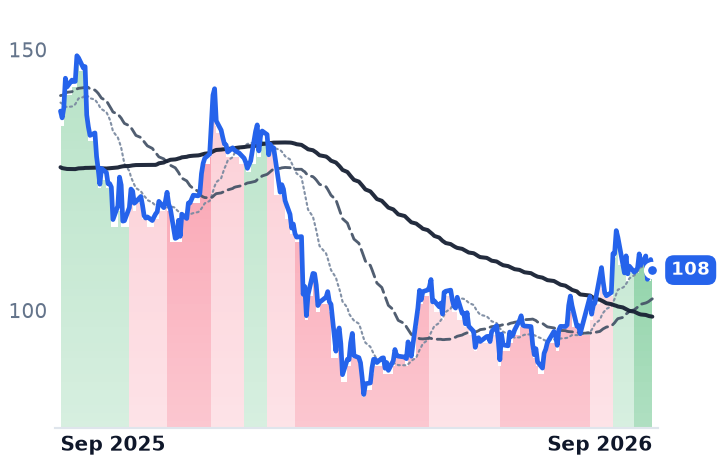
108
−2.03 (−1.85%)
vs. prior close
Price20d50d150d
KKR 12-month price
Alternative & Private Capital
TickerMkt capP/EP/E fwdP/SP/S fwdP/GPP/GP fwdEV/EBITDAFCF yld
SR$4.8B9.1x20.3x1.9x1.9x5.8x5.7x5.6x-4.2%
CPK$3.2B21.3x20.9x3.2x3.2x6.5x6.3x13.6x-8.7%
KKR$102.4B33.9x18.4x4.8x9.7x10.4x20.8x15.1x8.3%

Consensus projections

TickerFY2026EFY2027EFY2028E
UGIRevenue−1.5%+5.7%+1.9%
EPS−12.0%+16.4%+8.1%
SPHRevenue−3.3%+3.8%+1.0%
EPS+13.7%+2.5%+3.4%
ATORevenue+6.8%+7.7%+8.7%
EPS+14.2%+6.8%+8.4%
NJRRevenue+12.2%−2.8%+4.5%
EPS+10.1%−5.1%+8.2%
NWNRevenue+5.0%+6.9%+3.6%
EPS+5.3%+5.0%+5.8%
OGSRevenue−3.2%+3.5%+2.9%
EPS+11.8%+3.3%+8.4%
SRRevenue+1.8%+12.4%+4.9%
EPS−11.0%+36.6%+12.3%
CPKRevenue+16.5%+5.1%+3.6%
EPS+6.7%+14.3%+7.4%
KKRRevenue+33.9%+17.8%+32.9%
EPS+26.0%+18.0%+15.7%

Forward fiscal years only. Blank means no analyst coverage for that year.

AmeriGas sold 10% fewer gallons of propane in the June quarter than a year earlier, and the segment's loss at the earnings line nearly doubled. Twelve days after its parent, UGI Corporation, laid that out on an August 6 call, the Wall Street Journal reported that KKR had made an unsolicited proposal to buy the whole company for roughly $9bn, or $42.50 a share. KKR declined to comment; UGI did not immediately respond.

That is the stake. UGI closed at $37.94 on September 4, 12% below the reported offer, which is the market's honest statement that a deal at that price is not assured. It also raises the question of what a buyer is actually buying, because the segment the company is best known for is the one shrinking.

Gallons times cents

A propane distributor does not make money on propane. The molecule is bought wholesale and passed through; the income statement is retail gallons multiplied by a cents-per-gallon unit margin set locally. Gallons are weather times a customer base, and this year the weather was hostile — April was near-record warm, and Suburban Propane's territories ran 17% warmer than normal in the quarter. The commodity, meanwhile, was abundant: US propane and propylene inventories sat 32% above their five-year average in late August, the configuration that lets a distributor hold its retail spread while its acquisition cost falls.

The two operators diverged on the second term. Suburban Propane, a master limited partnership serving about a million customers from roughly 700 locations in 42 states, sold 70.6 million retail gallons, down 1.8%, and reported total gross margin flat at $160.3m — down 2.4% excluding derivative swings, because "propane unit margins remained steady". AmeriGas, the largest US retail propane marketer by gallons sold, moved 124 million gallons and swung to a $53m segment loss. Its underlying customer book is better than the headline: attrition ran about 2% year-to-date, which management called the lowest in a very long time and which compares with the 4.2% base-business attrition Star Group reported for the twelve months to March. Neither company bought gallons to replace the leakage: no tracked retail acquisitions by the national operators in the 2025-26 year, with AmeriGas a net seller after divesting Hawaii.

What KKR would be buying

Inside UGI, the growth is regulated. The Pennsylvania utility, which delivers gas to some 672,000 customers, added more than 8,500 new heating customers year-to-date and has an approved rate settlement worth $65m in two steps — $40m from October 2026, $25m from October 2027, with a stay-out through January 2029. Utilities segment earnings rose $10m in the quarter and midstream and marketing $3m, partially offsetting propane. UGI International earned $41m on flat revenue. Three-quarters of year-to-date capital expenditure went to the natural gas businesses.

AmeriGas itself is being fixed rather than grown: net debt down roughly $270m in the quarter, a refinancing that cut a coupon to 6.875% from 9.375%, segment leverage at 4.3x. "We're very confident the leverage is going to be sub 4," chief financial officer Sean O'Brien told investors on August 6. "We think by the end of the year, we have a shot to be sub 4." Chief executive Robert Flexon added that the company plans "meaningful cash distributions to the parent in 2027, which is something that hasn't been done for some time."

None of that makes fiscal 2026 a good year. Year-to-date adjusted earnings are $3.17 a share against $3.55, guidance of $2.75 to $2.90 implies a decline, and consensus of $2.798 is 12% below last year. The shares carry 13.6x forward earnings against 12.2x trailing — the spread runs the wrong way because the earnings are falling. That is still the cheapest reading in the regulated gas group, against Atmos Energy at 19.8x forward and New Jersey Resources at 14.9x. KKR's $42.50 works out to 15.2x this year's consensus: an infrastructure price, below where the group's premium names trade.

The other propane book

Suburban Propane has no bid and has been marked down for it, its units off about a tenth over three months while every other regulated-gas name UGI is measured against was flat to lower over the past month. The partnership's fiscal third-quarter adjusted earnings before interest, tax, depreciation and amortization fell to $18.0m from $27.0m — but that is the seasonally smallest quarter, and the heating-season half produced $258.7m, up 3.4%. Chief executive Michael Stivala attributed the quarter to "near-record warm temperatures during the month of April" and said volumes "benefited from continued strength and growth in our counter-seasonal customer base." The $0.325 quarterly distribution, a 7.4% annualized yield at $17.52, was covered 2.07 times on a trailing basis, and leverage of 4.35x is unchanged from a year ago. The renewable natural gas business injected flat volumes; two more digesters bring the count to three entering fiscal 2027, and the 38% stake in Oberon Fuels remains a venture holding rather than an earnings line.

The verdict

UGI's move this summer is a takeover re-rating, not an operating one: the business is guiding to lower earnings while the shares sit near a twelve-month high, and the 12% gap to the offer is the market pricing the chance the approach goes nowhere. What the business itself has earned is narrower and real — a rate case locked through 2029, a propane arm whose leverage and attrition are both improving faster than its gallons are falling. Suburban Propane is the same mechanism without the bid, and its unit margin, not its volume, is what has held its gross profit together.

Both companies close their books on September 30. The fiscal fourth quarter is the one where propane earns almost nothing, which makes it the cleanest look yet at whether cents per gallon can carry a business whose customers keep leaving.

Vulcan Pushed Aggregates Prices Up 5% and Kept 14 Cents of It

Hypothesis Opus 5 · Research Opus 5 · Writing Opus 5 · Prompt v1.6

Vulcan Materials has spent three years proving a quarry is a tollbooth. In the June quarter the toll went up and the take barely moved: cash gross profit on a ton of aggregates reached $12.02 against $11.88 a year earlier, because a $40m energy bill and unit costs up 3% absorbed the increase.

Volume was not the problem. Vulcan shipped 59.9m tons, up 1%, and Martin Marietta posted a fourth consecutive quarter of organic shipment growth. Martin Marietta's reported margin, down 4.6 percentage points, is mostly purchase accounting from the Quikrete and New Frontier deals rather than quarry economics.

Both now trade near 28x forward earnings on consensus that has this year's earnings flat and all the growth deferred to 2027 — while the federal highway program that funds the tons loses its authority on September 30.

VMCMLMNUESTLDCRHEXPSPYAggregates Pricing PowerHighway Funding ReauthorizationBuilding Materials M&ADiesel & Energy CostsData-Center Construction Demand
TickerCompanySegmentTrend · 13mo30D1Y
The subject · what this brief is about
VMCVulcan MaterialsAggregates & Concrete⚠️ Emerging Bear−7.7%−11.8%
MLMMartin Marietta MaterialsAggregates & Concrete⚠️ Emerging Bear−6.2%−17.7%
Compared against · context, not the story
NUENucorIntegrated Steelmakers🟢 Cont. Bull−4.2%+83.3%
STLDSteel DynamicsLong Products & Rebar🟢 Cont. Bull−7.8%+81.7%
CRHCRHIntegrated Cement & Materials⚠️ Emerging Bear−6.2%−15.6%
EXPEagle MaterialsSpecialty Building Products🔴 Cont. Bear−9.2%−17.8%
SPYState Street SPDR S&P 500 ETF TrustAsset Management🟢 Cont. Bull−0.4%+19.7%

12-month price & trend

VMC
Vulcan Materials
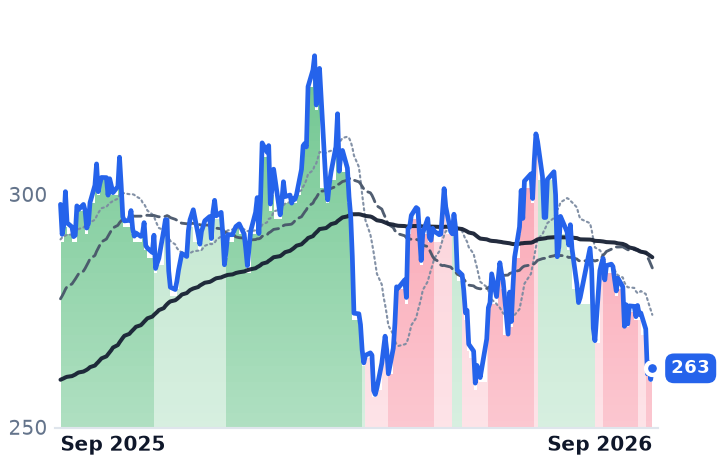
263
+2.40 (+0.92%)
vs. prior close
Price20d50d150d
VMC 12-month price
Aggregates & Concrete
MLM
Martin Marietta Materials
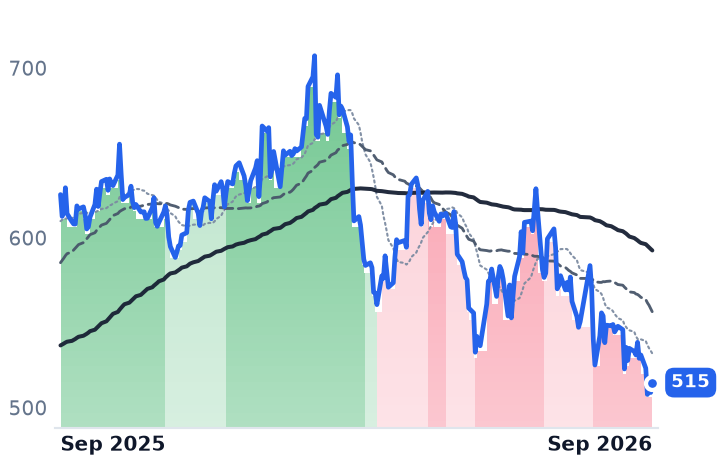
515
+5.83 (+1.15%)
vs. prior close
Price20d50d150d
MLM 12-month price
Aggregates & Concrete
NUE
Nucor
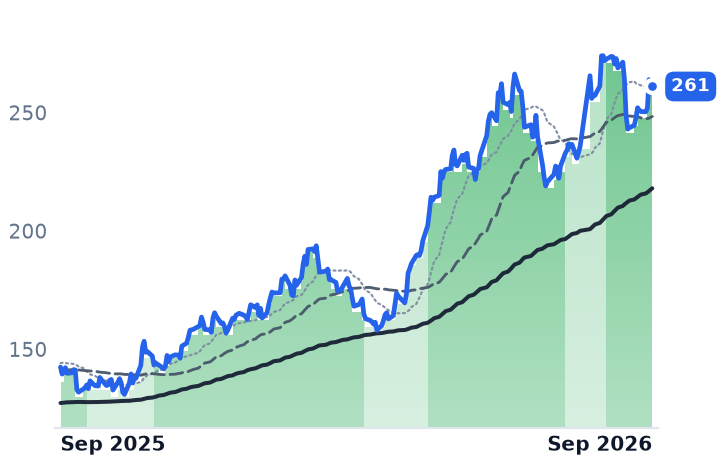
261
−1.40 (−0.53%)
vs. prior close
Price20d50d150d
NUE 12-month price
Integrated Steelmakers
TickerMkt capP/EP/E fwdP/SP/S fwdP/GPP/GP fwdEV/EBITDAFCF yld
VMC$34.0B30.9x28.7x4.2x4.2x15.3x15.2x15.1x3.0%
MLM$30.9B12.6x28.3x4.6x4.3x16.4x15.1x17.6x2.6%
NUE$59.5B20.8x14.0x1.6x1.5x10.6x9.6x11.4x2.7%
STLD
Steel Dynamics
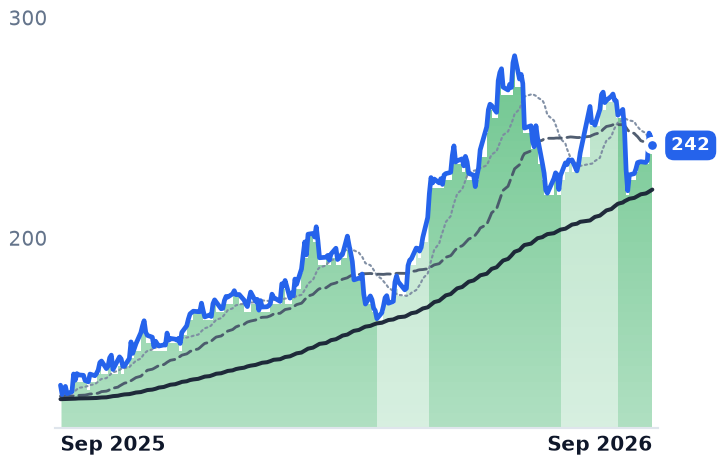
242
−3.97 (−1.61%)
vs. prior close
Price20d50d150d
STLD 12-month price
Long Products & Rebar
CRH
CRH
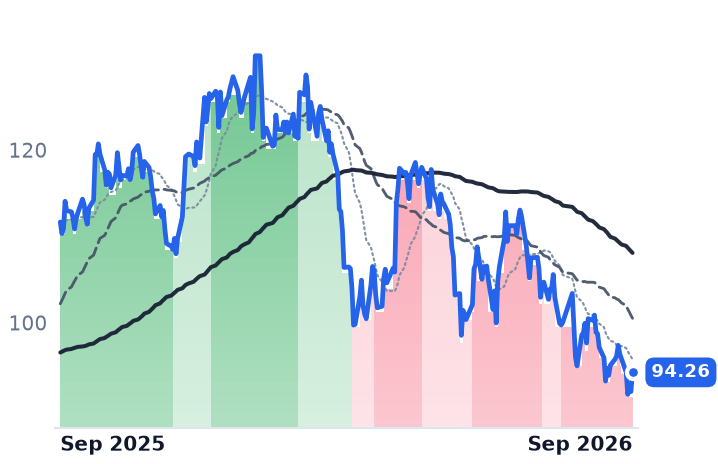
94.26
+2.22 (+2.41%)
vs. prior close
Price20d50d150d
CRH 12-month price
Integrated Cement & Materials
EXP
Eagle Materials
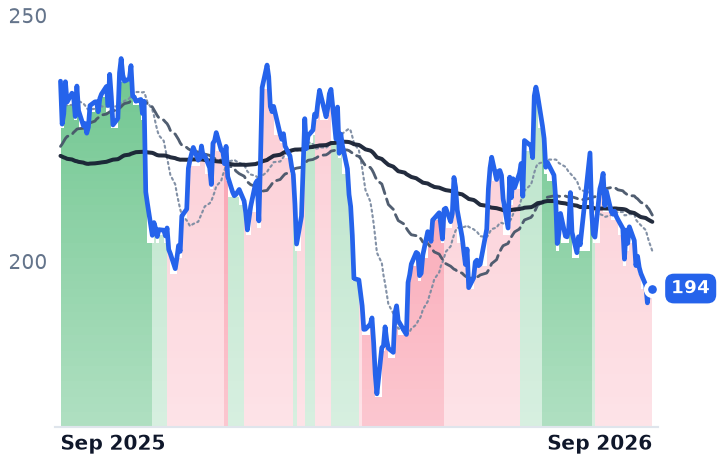
194
+0.90 (+0.46%)
vs. prior close
Price20d50d150d
EXP 12-month price
Specialty Building Products
TickerMkt capP/EP/E fwdP/SP/S fwdP/GPP/GP fwdEV/EBITDAFCF yld
STLD$34.7B21.9x14.4x1.7x1.5x11.6x10.0x12.9x2.8%
CRH$69.0B13.7x17.3x1.2x1.7x3.5x4.9x7.9x4.2%
EXP$6.1B14.6x15.1x2.7x2.6x9.4x9.3x9.6x3.8%
SPY
State Street SPDR S&P 500 ETF Trust
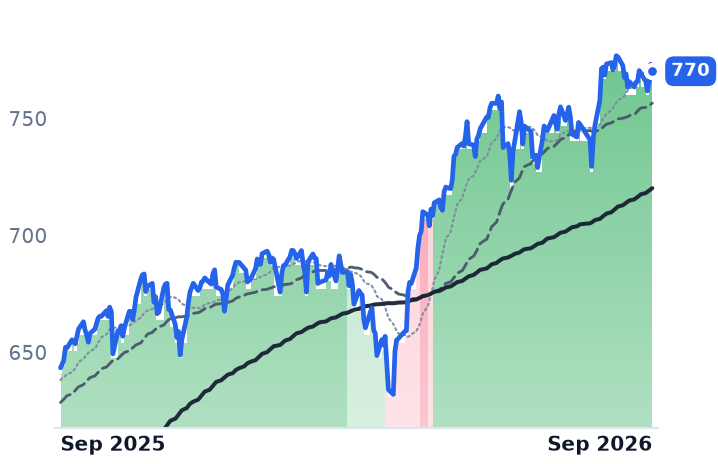
770
−2.98 (−0.39%)
vs. prior close
Price20d50d150d
SPY 12-month price
Asset Management
TickerMkt capP/EP/E fwdP/SP/S fwdP/GPP/GP fwdEV/EBITDAFCF yld
SPY$773.0B

Consensus projections

TickerFY2026EFY2027EFY2028E
VMCRevenue+2.3%+6.0%+6.8%
EPS+8.8%+17.4%+16.6%
MLMRevenue+9.0%+7.3%+8.6%
EPS+0.2%+19.1%+17.2%
NUERevenue+23.0%+1.5%+0.6%
EPS+134.2%+1.9%−3.2%
STLDRevenue+29.2%+0.5%+0.2%
EPS+111.9%+15.0%−5.4%
CRHRevenue+5.9%+5.1%+6.8%
EPS+6.8%+12.7%+12.0%
EXPRevenue+0.5%+1.9%+5.8%
EPS−9.4%−0.1%+13.5%

Forward fiscal years only. Blank means no analyst coverage for that year.

The price of crushed stone leaving a Vulcan Materials quarry went up again this spring, and almost none of the increase reached the bottom line. Vulcan — the largest US aggregates producer, selling stone, sand and gravel out of quarries into a freight radius of roughly 30 miles — raised mix-adjusted price about 5% in the June quarter, to a freight-adjusted $22.97 a ton. Cash gross profit per ton went to $12.02 from $11.88. A $40m energy headwind and unit cash costs excluding diesel up 3% took the rest.

That matters because price has been the entire earnings story in aggregates. Vulcan's gross margin widened roughly six percentage points between fiscal 2022 and fiscal 2025, a stretch that included a year when revenue fell outright. If the price lever stops converting into margin, earnings revert to depending on tons — and the biggest single sponsor of those tons, the federal surface transportation program, loses its spending authority on September 30.

Tons are not the problem

The intuitive story — price increases pushed through onto shrinking volume — is not what the quarries reported. Vulcan shipped 59.9m tons in the quarter, up 1% year on year despite rain in Texas and the Southeast. Martin Marietta, the number-two producer, logged its fourth straight quarter of positive organic shipment growth, up 2.3% in the quarter and 4.3% year to date, tracking the high end of its guidance.

What gave way was operating leverage. Vulcan's revenue rose 2.5% to $2,155.8m while operating income fell 9.7% to $425.3m; adjusted EBITDA was flat at $654m and full-year guidance of $2.4bn–$2.6bn was reaffirmed. Revenue growth has decelerated over four quarters from 13.9% to 2.5%. "Our biggest lever to overcome fuel continues to be price," chief executive Ronnie Pruitt told investors on July 29, adding that public infrastructure awards in Vulcan's markets are up 20% year on year. Data centers, despite the label these companies get filed under, are 3–5% of Vulcan's volumes; Martin Marietta reports data-center backlog up 90% and says 70% of US data-center and manufacturing square footage sits within 55 miles of its operations.

Martin Marietta's margin is deal accounting

Martin Marietta's reported figures look far worse and mean something different. Gross margin fell to 25.4% from 30.0% and operating income dropped 17.2% to $379m on revenue up 7.5% — driven principally by a $52m fair-value inventory step-up from purchase accounting on the Quikrete and New Frontier assets. Adjusted cash gross profit rose 15% to $636m. Headline average selling price fell 2% while organic mix-adjusted pricing rose 3.7%, the gap being acquisition dilution and geography.

"When we go into 2027, we're going to be through all the inventory issues on purchase price accounting with Quikrete," chair and chief executive Ward Nye said on July 30, calling 2027 pricing "a pretty compelling story." The reshaping continues: more than $525m of EBITDA in cement and ready-mix divested since 2022, and on August 21 the company closed a $13.5bn combination with Lhoist North America, adding 20 quarries and over 2 billion tons of limestone reserves in lime and specialties.

What the shares have priced

Vulcan trades at 28.7x forward earnings against 30.9x trailing — a spread of about 7%, which is the market declining to underwrite much near-term growth. Consensus agrees: fiscal 2026 EBITDA is modelled down 3.2%, with the acceleration in 2027. In May the shares carried roughly 30–35x forward, so the de-rating has been modest against a business consensus expects to shrink this year. Martin Marietta's trailing price/earnings ratio is unusable — a divestiture gain inflated first-quarter net income — but its forward multiple is 28.3x and trailing enterprise value to EBITDA 17.6x, the richest in the group, on consensus earnings flat this year and up 19% next. JPMorgan's Adrian Huerta cut the stock to Neutral, lowering his target to $560 from $640, and moved the firm's sector preference to Vulcan.

The drawdown arrived in three dated sessions rather than a slow bleed: the days around the July 30 prints, then August 18, when the Census Bureau reported July housing starts at a 1,239,000 annual rate, 12.4% below June with single-family down to 808,000 — though permits rose 5.0% — and then September 1, when a Middle East oil shock and a bond selloff pushing the 10-year yield near 4.8% hit an energy-intensive business valued on distant earnings. Both names sit more than 20% below their 52-week highs; Eagle Materials and CRH are down on the year too, so this is a sub-sector move.

Same shelf, different meter

The two steel producers filed alongside them are running the opposite way and for unrelated reasons. Nucor's quarterly revenue rose 23.0% with gross margin widening to 19.6% from 14.5% on record mill shipments of 7.1m tons; Steel Dynamics' revenue rose 33.4% and operating income doubled. Their meter is the sheet spread: Section 232 tariffs of 50% cut imports' share of the finished-steel market from over 22% to roughly 15% while scrap costs held. Both trade near 14x forward earnings against roughly 21x trailing — the market underwriting growth, the mirror image of Vulcan's flat spread. Nothing about a 30-mile quarry radius connects to any of it.

The verdict

The de-rating in aggregates is largely earned, but not for the reason the price action suggests. Tons are growing; the pricing model still works at the customer. What has stopped working, for now, is the conversion of price into profit per ton, and consensus has responded by taking this year's earnings out and putting next year's in. What nothing in the numbers explains is a 20%-plus drawdown in businesses with double-digit growth in highway awards and permitted reserves nobody can replicate — the likelier reading there is a discount rate applied to earnings that arrive in 2027.

Vulcan's answer to the funding question is that 60% of federal infrastructure money remains unspent and the House successor bill would be more stone-intensive than the program it replaces. That is the forecast of the company selling the stone. The authorizing language expires at the end of this month either way.

Southwest Gas and New Jersey Resources Found Their Growth Outside the Rate Base

Hypothesis Opus 5 · Research Opus 5 · Writing Opus 5 · Prompt v1.6

Both companies are filed as regulated gas distributors, and at both the marginal growth now comes from somewhere else. Southwest Gas is building a $2.3bn interstate line toward Reno with about 1 billion cubic feet a day already contracted and $270-300m of guided annual margin — none of it in the long-term guidance investors are pricing. New Jersey Resources guides 38-41% of net financial earnings to businesses outside its utility, including an unregulated wholesale gas-marketing desk whose fiscal 2026 result came from price volatility it does not control.

That difference shows up in the estimates. Consensus has New Jersey Resources earning $3.40 a share in fiscal 2027 against $3.59 in fiscal 2026, a 5.1% step down; Southwest Gas is modeled up 15.6% over the same span. The de-rating at one is earned; the premium at the other rests on a pipeline that has not yet been filed with federal regulators.

SWXNJROGSATONISRNWNNFGGas Distribution UtilitiesInterstate Pipeline BuildoutData-Center Gas DemandRate Base GrowthUnregulated Gas MarketingStorage & Transportation
TickerCompanySegmentTrend · 13mo30D1Y
The subject · what this brief is about
SWXSouthwest GasNatural Gas Distribution🟢 Cont. Bull−4.4%+15.3%
NJRNew Jersey ResourcesNatural Gas Distribution🟢 Cont. Bull−2.9%+18.9%
Compared against · context, not the story
OGSONE GasNatural Gas Distribution⚠️ Emerging Bear−0.4%+8.9%
ATOAtmos EnergyNatural Gas Distribution⚠️ Emerging Bear−1.5%+3.4%
NINiSourceNatural Gas Distribution⚠️ Emerging Bear−2.9%+4.3%
SRSpireNatural Gas Distribution⚠️ Emerging Bear+0.9%+13.5%
NWNNorthwest NaturalNatural Gas Distribution⚠️ Emerging Bear−2.5%+22.0%
NFGNational Fuel GasMidstream Transportation & Storage⚠️ Emerging Bear+3.5%−0.6%

12-month price & trend

SWX
Southwest Gas
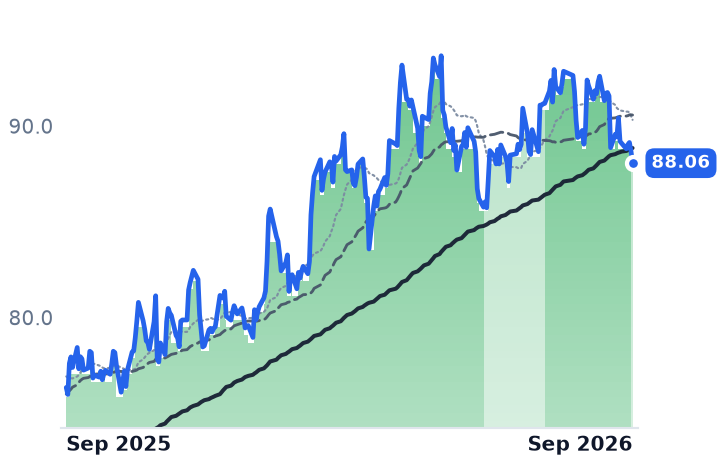
88.06
−0.63 (−0.71%)
vs. prior close
Price20d50d150d
SWX 12-month price
Natural Gas Distribution
NJR
New Jersey Resources
53.40
−0.54 (−1.01%)
vs. prior close
Price20d50d150d
NJR 12-month price
Natural Gas Distribution
OGS
ONE Gas
79.86
−1.01 (−1.26%)
vs. prior close
Price20d50d150d
OGS 12-month price
Natural Gas Distribution
TickerMkt capP/EP/E fwdP/SP/S fwdP/GPP/GP fwdEV/EBITDAFCF yld
SWX$6.4B12.3x20.7x3.7x3.3x6.5x5.8x11.0x-13.0%
NJR$5.4B14.7x14.9x2.4x2.4x8.5x8.6x11.7x1.4%
OGS$5.0B17.2x16.3x2.2x2.0x2.9x2.7x10.7x-3.4%
ATO
Atmos Energy
168
−1.56 (−0.92%)
vs. prior close
Price20d50d150d
ATO 12-month price
Natural Gas Distribution
NI
NiSource
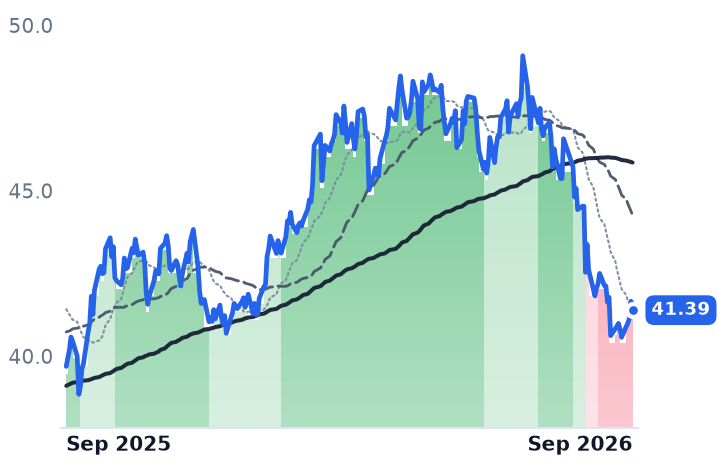
41.39
−0.27 (−0.65%)
vs. prior close
Price20d50d150d
NI 12-month price
Natural Gas Distribution
SR
Spire
82.68
−0.65 (−0.78%)
vs. prior close
Price20d50d150d
SR 12-month price
Natural Gas Distribution
TickerMkt capP/EP/E fwdP/SP/S fwdP/GPP/GP fwdEV/EBITDAFCF yld
ATO$28.0B19.8x19.8x5.7x5.4x9.3x8.9x14.1x-7.2%
NI$19.7B21.7x20.0x2.9x2.8x5.6x5.5x11.6x-5.5%
SR$4.8B9.1x20.3x1.9x1.9x5.8x5.7x5.6x-4.2%
NWN
Northwest Natural
49.19
−0.20 (−0.40%)
vs. prior close
Price20d50d150d
NWN 12-month price
Natural Gas Distribution
NFG
National Fuel Gas
83.32
−0.21 (−0.25%)
vs. prior close
Price20d50d150d
NFG 12-month price
Midstream Transportation & Storage
TickerMkt capP/EP/E fwdP/SP/S fwdP/GPP/GP fwdEV/EBITDAFCF yld
NWN$2.1B16.4x16.3x1.6x1.5x3.6x3.4x9.9x-12.6%
NFG$7.7B11.2x10.8x3.1x3.0x6.2x5.9x6.6x4.0%

Consensus projections

TickerFY2026EFY2027EFY2028E
SWXRevenue−46.4%+5.8%+6.2%
EPS−22.1%+15.6%+19.4%
NJRRevenue+12.2%−2.8%+4.5%
EPS+10.1%−5.1%+8.2%
OGSRevenue−3.2%+3.5%+2.9%
EPS+11.8%+3.3%+8.4%
ATORevenue+6.8%+7.7%+8.7%
EPS+14.2%+6.8%+8.4%
NIRevenue+15.3%+5.6%+6.3%
EPS+9.0%+9.7%+10.2%
SRRevenue+1.8%+12.4%+4.9%
EPS−11.0%+36.6%+12.3%
NWNRevenue+5.0%+6.9%+3.6%
EPS+5.3%+5.0%+5.8%
NFGRevenue+8.2%+18.9%−2.3%
EPS+9.9%+0.7%+7.6%

Forward fiscal years only. Blank means no analyst coverage for that year.

Southwest Gas is building a 181-mile pipeline toward Reno, and it has deliberately kept the earnings out of the growth plan it shows investors. The Great Basin 2028 expansion runs from the Opal interconnect with the Ruby Pipeline into northern Nevada, carries roughly 1 billion cubic feet a day of contracted demand, and now carries a capital estimate raised to about $2.3bn after a switch to 48-inch pipe. Management guides it to $270-300m of annual margin from a Q4 2028 in-service date, and it is excluded from current long-term guidance.

That matters beyond one project, because the arithmetic everyone applies to a gas distributor — rate base multiplied by an allowed return on equity — no longer describes either of the segment's two best-performing names. At Southwest Gas the biggest new asset is a federally regulated interstate line serving data-center load, not distribution pipe. At New Jersey Resources, by the company's own segment guidance, 38-41% of net financial earnings sit outside the utility altogether.

The distributor that behaves like one

Southwest Gas delivers gas to about 2.16 million customers across Arizona, Nevada and California, and its June quarter was a textbook regulated result: adjusted earnings of $0.45 a share against $0.37, with operating margin up $12.7m — $6.7m of it rate relief, $4.9m recovery mechanisms and $1.4m customer growth — while operating and maintenance spending fell 3%. Net customer additions ran 1% and contributed $4.5m of margin over twelve months. The Sun Belt population story is real and small; the regulatory story is bigger.

The balance sheet that once complicated this is clear. Southwest Gas sold its last 27.4 million Centuri shares in September 2025 for roughly $525m, and lower holding-company interest added $8.6m to the June quarter. The company reaffirmed 2026 adjusted earnings of $4.17-$4.32 and 12-14% annual growth through 2030 off a $6.3bn five-year capital plan, with rate base guided to compound 9.5-11.5% a year. The February 2027 plan refresh is where the expanded pipeline scope gets added.

The distributor that behaves like a trading desk

New Jersey Resources delivers gas to roughly 564,000 customers in six New Jersey counties, and also owns a solar developer, a midstream book and an unregulated wholesale gas-marketing arm. Its fiscal third quarter swung to net financial earnings of $0.11 a share from $0.06, helped by solar projects entering service and "continued uplift at Storage and Transportation, driven by favorable recontracting activity". Storage and transportation earnings are guided to double from fiscal 2025 to fiscal 2027 after Leaf River's expansion won its federal certificate early. Guidance was narrowed upward in August to $3.52-$3.62.

And consensus still has fiscal 2027 earnings falling 5.1%, to $3.40 from $3.59, with revenue down 2.8% before growth resumes in fiscal 2028. The reason is the marketing desk: the company attributes its stepped-up contribution to higher gas-price volatility, an input with no franchise protection and no reason to repeat. On the August 4 call management called the June rate filing "plain vanilla," designed to leave bills "nearly flat" — the utility is doing exactly what utilities do. The clean-energy arm faces a harder arithmetic: the federal residential clean-energy credit lapsed on January 1, and New Jersey's incentive for newly registered systems fell to $76.50 per megawatt-hour from $85.

What the market did to both

The September pullback is not a verdict on either. Five of the seven pure-play distributors sat in downtrends on September 4, the 10-year Treasury yield reached 4.79%, and S&P 500 utilities have gone from up more than 11% through February to roughly flat, second-worst of the index's eleven industries. Over six months these two fell least — NiSource, Atmos, Spire and ONE Gas each dropped between 8% and 12%.

The multiples have already moved. New Jersey Resources trades at 14.7x trailing earnings against 17.4x in May, a compression the fiscal 2027 estimate justifies. Southwest Gas is at 20.7x forward against 28.2x in May, still the richest in the group — ONE Gas near 16x, Atmos near 20x — and what that premium buys is consensus earnings rising 15.6% next year on rate relief, then a pipeline whose margin nobody has yet been asked to model.

Great Basin's application to the Federal Energy Regulatory Commission is due before this year ends. Until it is filed, the largest growth asset at a gas distributor is a line drawn on a map of Nevada.

EchoStar Cashed Out Its Spectrum and Now Trades $13bn Below the Value of Its SpaceX Stake

Hypothesis Opus 5 · Research Opus 5 · Writing Opus 5 · Prompt v1.6

EchoStar no longer runs the businesses its filings describe, and its equity has become a claim on somebody else's stock. The company sold its terrestrial mobile airwaves to AT&T for $20.25bn of proceeds and to SpaceX largely for shares, leaving it holding roughly 261.8m SpaceX shares, marked near $38.7bn on September 5 against a market value of about $25bn.

The discount is not free. EchoStar itself sizes SpaceX-transaction and tax obligations at $5-7bn, its Hughes unit filed for Chapter 11 in August after failing to repay $1.5bn of bonds, and Hughes creditors are contesting cash moved upstairs. Underneath, revenue fell 4.0% to $3.576bn and pay-TV lost 241,000 subscribers in the quarter. Viasat, the segment's other large name, still bills an operating meter — and its re-rating this year came from the multiple rather than the revenue line.

SATSVSATTSATGILTASTSSpectrum MonetizationDirect-To-Device SatellitePay-TV Subscriber DeclineChapter 11 RestructuringSatellite Broadband Operators
TickerCompanySegmentTrend · 13mo30D1Y
The subject · what this brief is about
SATSEchoStarSatellite & Broadband Services⚠️ Emerging Bear+14.1%
VSATViasatSatellite & Broadband Services🟢 Cont. Bull−6.3%+150.2%
Compared against · context, not the story
TSATTelesatSatellite & Broadband Services🟢 Cont. Bull−23.8%+104.3%
GILTGilat Satellite NetworksSatellite & Broadband Services⚠️ Emerging Bear−9.9%−4.3%
ASTSAST SpaceMobileSatellite & Broadband Services⚠️ Emerging Bear−13.4%+52.8%

12-month price & trend

SATS
EchoStar
Price20d50d150d
SATS 12-month price
Satellite & Broadband Services
VSAT
Viasat
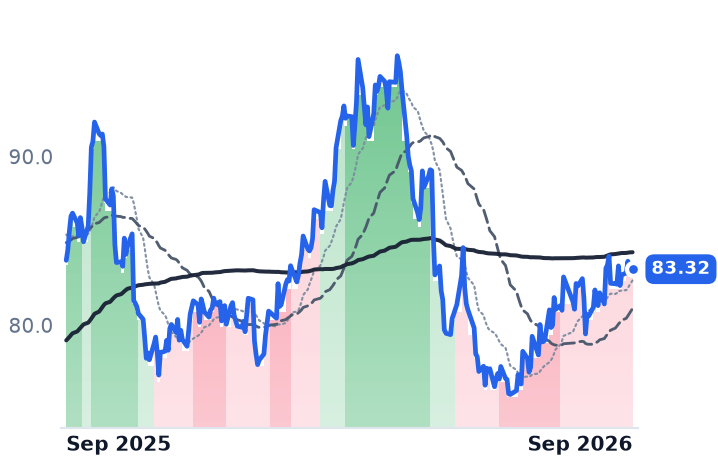
75.32
+3.60 (+5.02%)
vs. prior close
Price20d50d150d
VSAT 12-month price
Satellite & Broadband Services
TSAT
Telesat
44.90
+0.85 (+1.93%)
vs. prior close
Price20d50d150d
TSAT 12-month price
Satellite & Broadband Services
TickerMkt capP/EP/E fwdP/SP/S fwdP/GPP/GP fwdEV/EBITDAFCF yld
SATS$25.1Bn/m4.6x1.7x1.7x5.8x5.9xn/m-1.1%
VSAT$10.4Bn/m2.2x2.1x7.4x7.0x8.7x5.6%
TSAT$699.7Mn/m2.7x2.2x5.9x4.8xn/m-76.0%
GILT
Gilat Satellite Networks
10.12
−0.18 (−1.75%)
vs. prior close
Price20d50d150d
GILT 12-month price
Satellite & Broadband Services
ASTS
AST SpaceMobile
62.31
+0.18 (+0.29%)
vs. prior close
Price20d50d150d
ASTS 12-month price
Satellite & Broadband Services
TickerMkt capP/EP/E fwdP/SP/S fwdP/GPP/GP fwdEV/EBITDAFCF yld
GILT$808.3M23.3x17.4x1.7x1.6x5.5x5.3x12.4x-0.4%
ASTS$27.3Bn/m236.7x171.8xn/m-6.0%

Consensus projections

TickerFY2026EFY2027EFY2028E
SATSRevenue−4.0%−5.7%−7.6%
EPS−141.8%−86.6%+31.6%
VSATRevenue+3.6%+3.9%+4.6%
EPS−66.9%+40.3%+1.5%
TSATRevenue−22.5%−14.0%+101.1%
EPS+52.5%+7.6%−25.1%
GILTRevenue+13.2%+11.7%+10.6%
EPS+6.6%+16.3%+13.3%
ASTSRevenue+172.1%+330.7%+167.9%
EPS+37.1%−48.4%−180.2%

Forward fiscal years only. Blank means no analyst coverage for that year.

The company that sold its reason to exist

EchoStar has sold the spectrum that was its entire asset base, and what remains is mostly somebody else's stock. AT&T's purchase of about 30 megahertz of nationwide 3.45 gigahertz airwaves and about 20 megahertz of 600 megahertz airwaves has closed, handing EchoStar $20.25bn of proceeds plus a further $2.4bn that AT&T deposited into a trust the Federal Communications Commission requires against the shutdown of EchoStar's own network; $2bn of senior secured notes were repaid on July 28. SpaceX bought the 2 gigahertz and H-block licences for $17bn and then added the unpaired AWS-3 licences for about $2.6bn, paid largely in shares — approximately 261.8m of them.

That holding is now the company. SpaceX listed on Nasdaq on June 12, pricing at $135 and closing its debut at $161. At $147.90 on September 5 the EchoStar stake marks near $38.7bn — some $13bn more than EchoStar's whole $25.07bn market capitalization, and that is before $14-15bn of cash. In early August the same shares closed at an all-time low of $108.27, valuing the stake at roughly $28.3bn. Holders of a stock that swapped the ticker SATS for ECHO in June are underwriting one asset whose mark moved $10bn inside a month.

The meter still running underneath

The operating businesses are shrinking on every line. June-quarter revenue fell 4.0% to $3.576bn. The headline $8.46bn of net income is an accounting event: excluding a non-cash gain on deconsolidation of about $9.73bn, net income attributable to EchoStar was roughly $49.5m. Pay-TV shed about 241,000 net subscribers to 6.39m, split between DISH TV and Sling; wireless lost 118,000 to end at 7.375m, which the company blamed on discounted rival plans and deeper competitor device subsidies. On the August 3 call management said of Boost Mobile that it had "treaded water for 4 years" and that they "haven't cracked the code." Consensus has revenue contracting every year to $11.22bn by 2030.

So the earnings multiples do not function — trailing price-to-earnings of -4.37x, trailing enterprise value to EBITDA of -7.75x — and even the 4.57x forward reading is built on the same non-cash gains. Price-to-book of 1.78x and price-to-sales of 1.71x trailing against 1.75x forward, the forward figure higher because sales fall, are what is left.

Claims on the cash

Hughes Satellite Systems and certain US subsidiaries filed for Chapter 11 in the Southern District of Texas on August 3, after failing to repay $1.5bn of bonds that matured two days earlier. Hughes bondholders allege EchoStar drained more than $1.5bn from the unit beforehand, contesting roughly $1.029bn of dividends paid up to the parent in 2024, about $196m of tax reimbursements, the J3 satellite lease and the referral of Hughes consumer subscribers to SpaceX. Against the asset side sit EchoStar's own figures given on that August call: $2.4bn escrowed in the FCC trust, roughly $5bn of debt excluding Hughes, $1.9bn of convertibles in the money, and a self-estimated $5-7bn of SpaceX-transaction and tax liability. The board lifted the buyback authorization to $5bn and has bought nothing, because bond indentures block repurchases — even with the stock at about half of the company's own net-asset estimate.

The other meter

Viasat, the Carlsbad multi-orbit operator whose Inmarsat arm holds the L-band maritime distress franchise, is the mirror image: it still sells minutes. June-quarter revenue slipped 1.2% to $1.157bn and adjusted EBITDA fell 7% to $381m, but aviation revenue rose 11% on 4,530 aircraft in service and government satellite communications rose 10%, while US fixed broadband fell 27% to 115,000 subscribers. Net debt of $4.84bn at 3.2x EBITDA funds guided capital spending of $950m to $1bn this fiscal year against roughly $180m of free cash flow, and the shares trade at 8.68x trailing enterprise value to EBITDA. Chief executive Mark Dankberg told investors on August 4 that "the best way to hold onto your spectrum is to put it in use for public benefit for the nations which have granted those market access rights" — the opposite of the EchoStar trade — and kept the long-promised separation of the defense unit unresolved.

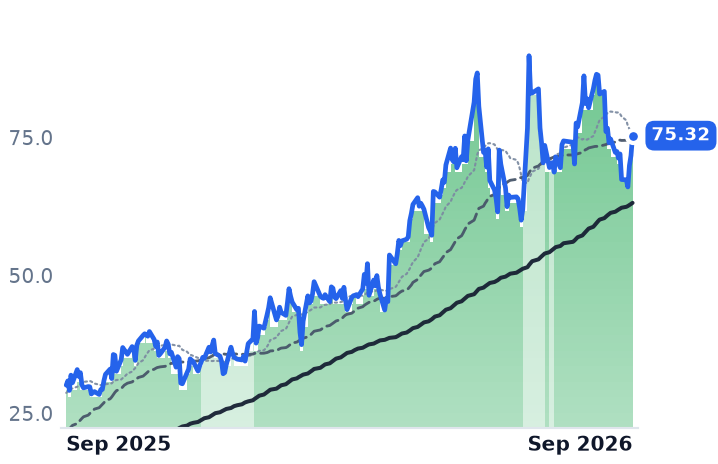
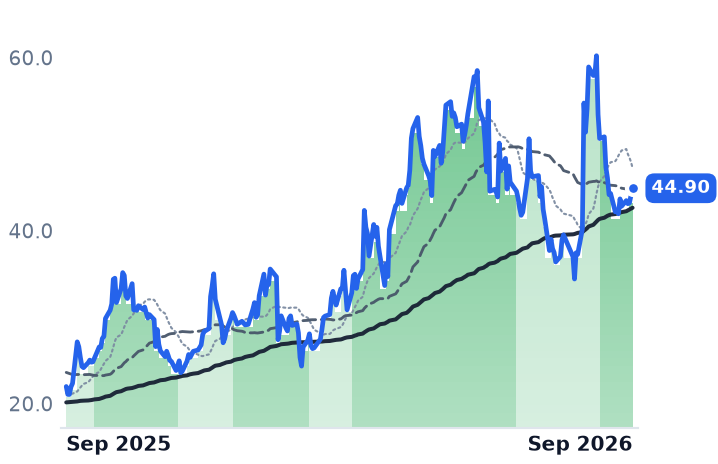
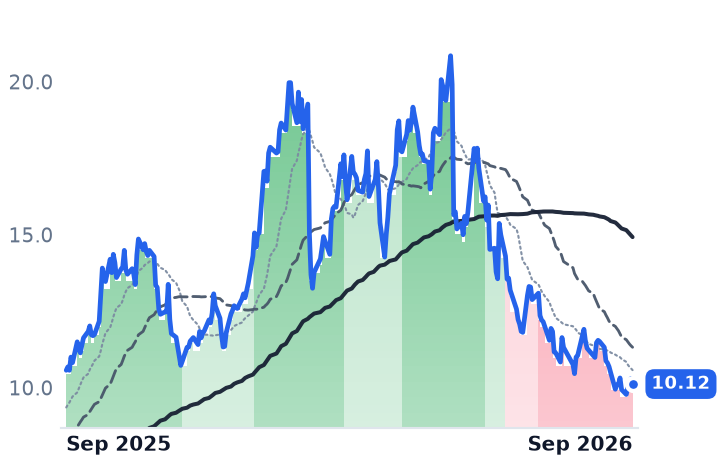
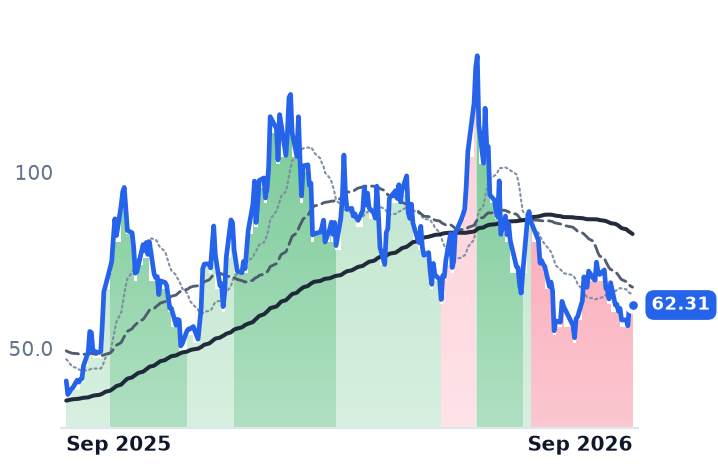
Both stories are being marked down together. From August 4 to September 4 Viasat fell 12.6%, Telesat 18.0%, Gilat 15.0% and AST SpaceMobile 11.4%; EchoStar sat out because it had already dropped about 30% from $124.64 on June 4. With no fresh operating news at Viasat in the window, the likelier reading is a give-back of the spectrum-and-defense-award premium those names carried into August. Viasat's own re-rating is measurable: price-to-sales has gone from 1.71x in early May to 2.24x, on revenue that fell.

What each side earns

EchoStar's discount to its assets is real and is not free — the marked stake alone moved $10bn in a month, the tax and termination bill is the company's own estimate rather than a settled number, and creditors are suing over the cash. What the market is refusing to pay for is the certainty of the arithmetic, and that refusal is rational. Viasat's case is the reverse: the mix migration is genuine, aviation and government growth offsetting the Starlink-exposed broadband line almost exactly, which is why consolidated revenue went nowhere. Nothing in the June quarter earned the multiple expansion of the spring.

The DISH Wireless bankruptcy confirmation hearing is set for October 13. Until then EchoStar's largest asset will be repriced daily by a stock it does not control and cannot sell into.

Ormat Faces Investors Monday With Consensus Modeling 2027 Revenue Down 1.1%

Hypothesis Opus 5 · Research Opus 5 · Writing Opus 5 · Prompt v1.6

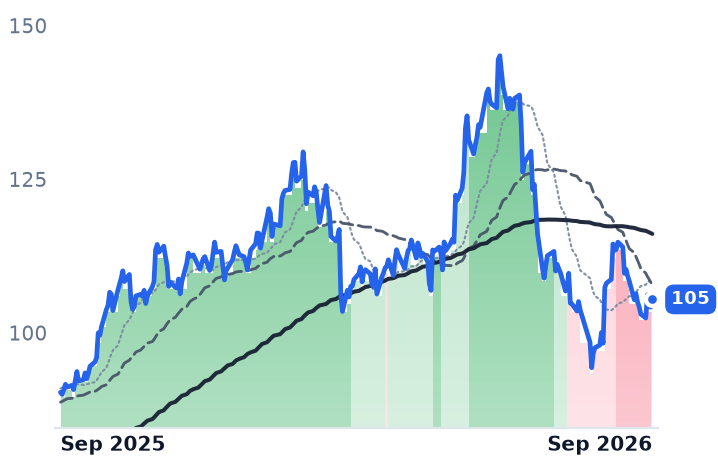
Ormat's shares have fallen roughly a quarter in three months while the business got better on the top two lines — June-quarter revenue rose 10.6% and gross margin widened 220 basis points to 26.5%. The composition is why the market disagreed: contracted geothermal electricity revenue grew 5.8%, merchant battery revenue nearly tripled, and consensus now models 2026 revenue up 21% followed by a 1.1% decline in 2027 as a lumpy turbine-delivery year does not repeat.

The analyst who opened the de-rating with an Underperform rating in June closed it on Friday, calling the multiple fair two working days before Ormat's September 8 investor day. That leaves Monday carrying the growth case — 2028 targets, and an enhanced-geothermal roadmap whose first well is not scheduled to spud until the fourth quarter, by which time Fervo expects to be making test power.

ORAFRVOOKLOSMRCEGVSTTLNCWENNEEGEVGeothermal PowerEnhanced Geothermal DrillingMerchant Battery StorageTurbine Manufacturing BacklogData-Center Power DemandPPA Repricing
TickerCompanySegmentTrend · 13mo30D1Y
The subject · what this brief is about
ORAOrmat TechnologiesGeothermal & Specialized⚠️ Emerging Bear−2.4%+16.7%
FRVOFervo EnergyEmerging & Specialized Energy🔴 Cont. Bear−29.7%−50.3%
Compared against · context, not the story
OKLOOkloEmerging & Specialized Energy🔴 Cont. Bear−14.8%−41.6%
SMRNuScale PowerAdvanced Nuclear🔴 Cont. Bear−1.2%−71.4%
CEGConstellation EnergyDiversified Renewable Generators🔴 Cont. Bear+10.8%+0.3%
VSTVistraIntegrated Retail & Generation🔴 Cont. Bear+6.2%−20.3%
TLNTalen EnergyWholesale Power Producers🔴 Cont. Bear−8.8%−17.3%
CWENClearway EnergyWind & Solar Developers⚠️ Emerging Bear−2.5%+14.9%
NEENextEra EnergyVertically Integrated Utilities⚠️ Emerging Bear−1.4%+21.2%
GEVGE VernovaGE Vernova Integrated🟢 Cont. Bull−4.9%+57.3%

12-month price & trend

ORA
Ormat Technologies
105
+1.26 (+1.21%)
vs. prior close
Price20d50d150d
ORA 12-month price
Geothermal & Specialized
FRVO
Fervo Energy
18.16
+1.00 (+5.83%)
vs. prior close
Price20d50d150d
FRVO 12-month price
Emerging & Specialized Energy
OKLO
Oklo
41.27
+1.43 (+3.59%)
vs. prior close
Price20d50d150d
OKLO 12-month price
Emerging & Specialized Energy
TickerMkt capP/EP/E fwdP/SP/S fwdP/GPP/GP fwdEV/EBITDAFCF yld
ORA$6.5B50.7x41.4x5.5x5.5x19.5x19.7x21.6x-4.1%
FRVO$5.2Bn/m900.0xn/m-8.5%
OKLO$7.3Bn/mn/m-3.8%
SMR
NuScale Power
9.70
−0.05 (−0.51%)
vs. prior close
Price20d50d150d
SMR 12-month price
Advanced Nuclear
CEG
Constellation Energy
299
+13.91 (+4.88%)
vs. prior close
Price20d50d150d
CEG 12-month price
Diversified Renewable Generators
VST
Vistra
149
+5.08 (+3.52%)
vs. prior close
Price20d50d150d
VST 12-month price
Integrated Retail & Generation
TickerMkt capP/EP/E fwdP/SP/S fwdP/GPP/GP fwdEV/EBITDAFCF yld
SMR$2.8Bn/m261.9x91.1x432.7xn/m-27.7%
CEG$107.4B29.1x24.8x3.4x3.2x3.6x3.4x15.4x0.3%
VST$50.3B24.9x17.3x3.2x2.2x24.3x17.3x10.8x2.7%
TLN
Talen Energy
317
+11.48 (+3.76%)
vs. prior close
Price20d50d150d
TLN 12-month price
Wholesale Power Producers
CWEN
Clearway Energy
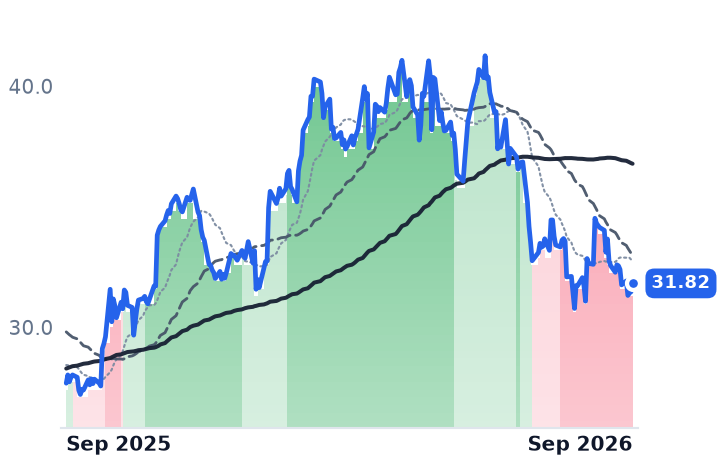
31.82
+0.35 (+1.11%)
vs. prior close
Price20d50d150d
CWEN 12-month price
Wind & Solar Developers
NEE
NextEra Energy
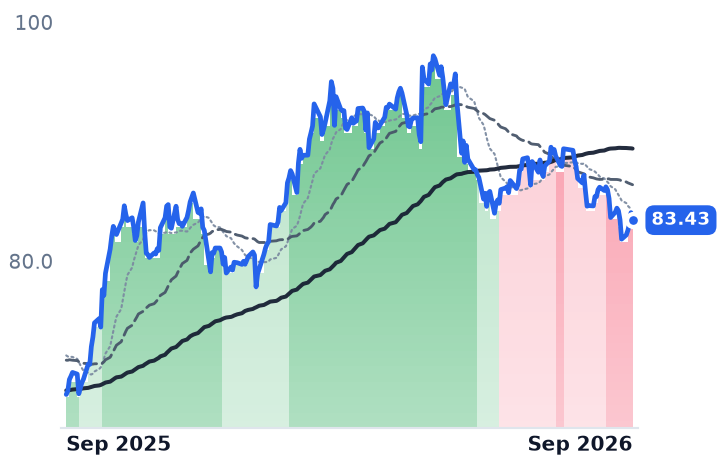
83.43
−0.63 (−0.75%)
vs. prior close
Price20d50d150d
NEE 12-month price
Vertically Integrated Utilities
TickerMkt capP/EP/E fwdP/SP/S fwdP/GPP/GP fwdEV/EBITDAFCF yld
TLN$14.4Bn/m15.4x4.1x3.2x9.1x7.2x29.9x3.5%
CWEN$6.5B41.4x4.1x3.9x7.8x7.4x14.4x10.4%
NEE$175.3B18.8x20.9x6.0x5.7x8.4x7.9x16.0x-5.8%
GEV
GE Vernova
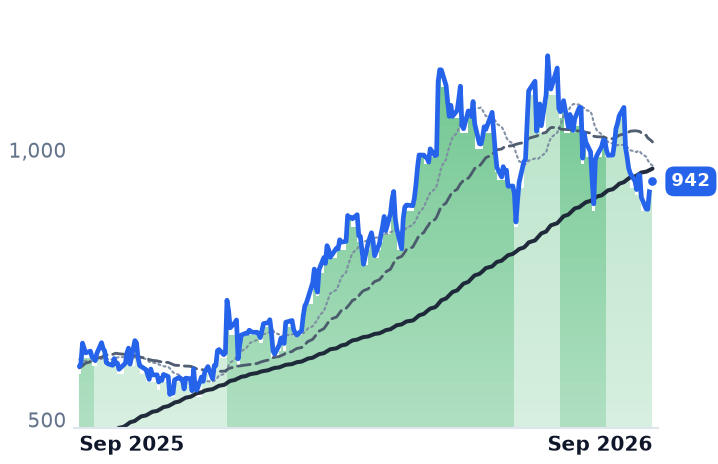
942
+0.11 (+0.01%)
vs. prior close
Price20d50d150d
GEV 12-month price
GE Vernova Integrated
TickerMkt capP/EP/E fwdP/SP/S fwdP/GPP/GP fwdEV/EBITDAFCF yld
GEV$242.9B25.9x29.7x5.9x5.2x29.0x26.0x27.0x5.1%

Consensus projections

TickerFY2026EFY2027EFY2028E
ORARevenue+21.4%−1.1%+12.1%
EPS+16.4%−3.5%+25.9%
FRVORevenue+4094.5%+1158.9%+186.8%
EPS−92.0%−19.8%−26.6%
OKLORevenue+241.0%+577.4%
EPS+50.0%+10.3%+16.5%
SMRRevenue−26.7%+434.9%+101.2%
EPS−74.7%+33.4%−18.3%
CEGRevenue+36.6%+2.6%+5.5%
EPS+28.7%+10.1%+26.3%
VSTRevenue+16.7%+9.3%+4.7%
EPS+80.0%+18.7%+18.0%
TLNRevenue+84.0%+15.8%+4.6%
EPS+247.6%+48.4%+17.8%
CWENRevenue+14.8%+10.8%+13.4%
EPS−133.6%−152.5%+132.7%
NEERevenue+9.4%+9.7%+8.9%
EPS+9.0%+9.0%+8.5%
GEVRevenue+23.9%+14.8%+15.0%
EPS+321.7%−19.5%+40.7%

Forward fiscal years only. Blank means no analyst coverage for that year.

Ormat Technologies — a geothermal owner-operator that also manufactures the binary turbines other developers install in their plants — brings management to the New York Stock Exchange on Monday for an investor day, and it arrives with its own bear case already withdrawn. Bernstein SocGen's Sunaina Ocalan, who initiated coverage at Underperform on June 17 with a $115 target, upgraded the stock to Market Perform on Friday on an unchanged $112 target, describing the shares as trading in line with their 2026 average and naming the investor day as a catalyst.

What Monday has to sell is the year after next. Consensus carries Ormat revenue to $1.179bn in 2026, a 21.4% increase, and then marks it down 1.1% in 2027, with earnings per share slipping from $2.54 to $2.45. The market has already decided that this year's growth is a delivery schedule rather than a franchise.

The multiple did the falling

Ormat peaked at $145.10 on June 3 and bottomed at $94.33 on July 29, a 35% drawdown, and the price at $105.45 now sits below the lowest published target on the street; the twelve-analyst average is $132.83. Gross profit grew 20.8% over that stretch. The compression is visible against gross profit — 19.5x now, against 25.9x in May — and against cash earnings: trailing enterprise value to EBITDA of 21.6x versus roughly 14.3x on the guided 2026 adjusted EBITDA midpoint of $640m. For a company carrying $3.4bn of debt at 4.3 times EBITDA, the cash-earnings reading is the one that binds.

The composition explains most of the skepticism. June-quarter electricity revenue, the contracted baseload the whole story rests on, grew 5.8% to $169.3m, while energy storage revenue rose 195% to $42.8m on merchant PJM prices management expects to normalize toward a 40-50% segment gross margin. Operating income fell 3.2% and net income fell 3.4% to $27.1m — a quarter in which Ormat also booked a $9.5m investment-tax-credit benefit and $16.6m of income from selling tax benefits. Product backlog stands at $203m after a $105m turbine delivery was recognized in the first quarter.

What is actually under construction

Ormat has 202 megawatts under construction or development through 2028, all with signed offtake agreements, and roughly 190 megawatts of expiring contracts priced at a weighted-average $86 per megawatt-hour against a market above $100 — a repricing option that costs almost no capital. The enhanced-geothermal program that data-center buyers ask about is later: the Desert Peak pilot with SLB has permits filed and drilling on track for the fourth quarter, with connection to existing facilities at end-2027 or early 2028. "We will obviously give a lot more information on our Investor Day," chief executive Doron Blachar told analysts on the second-quarter call, deferring repeatedly.

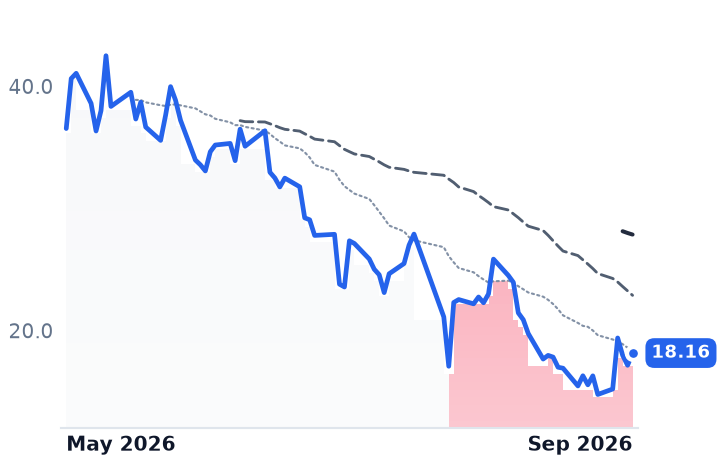
Fervo Energy, the Houston developer applying shale drilling technique to hot rock, is the other meter. It sold $113,000 of power last quarter against a $28.7m operating loss, but has 1,054 megawatts under binding contract after Google's 396-megawatt agreement, and has cut drilling costs more than 70% to about $400 a foot. "The biggest expense in drilling is time it takes to drill," chief executive Tim Latimer said. Its enterprise value of roughly $3.3bn works out near $3.2m per contracted megawatt against a $5.5m build-cost target — cheap only if the megawatts get built, and second-half capital spending guided at $850-900m against $2.1bn of cash says more financing comes first. Consensus shows no positive EBITDA until 2029. The shares are 33% below the $27 May listing price.

The verdict

Ormat's fall is mostly earned, and it is mostly finished. A business whose incremental growth comes from merchant batteries, one-off turbine shipments and monetized tax credits does not deserve the multiple it held in May, and the sell-side bear stood down rather than pressing because the arithmetic no longer supported him. What the de-rating does not explain is 20.8% gross-profit growth and a widening margin. Monday decides which reading survives: a 2028 target built on contracted electricity and repricing, or another year of deferral on enhanced geothermal.

Fervo expects to spin a turbine for test power at Cape Station this quarter. Ormat expects to start drilling its first enhanced-geothermal well in the same one.

GoodRx Now Takes 31% of Revenue From Drugmakers as Discount-Card Sales Fall 26%

Hypothesis Opus 5 · Research Opus 5 · Writing Opus 5 · Prompt v1.6

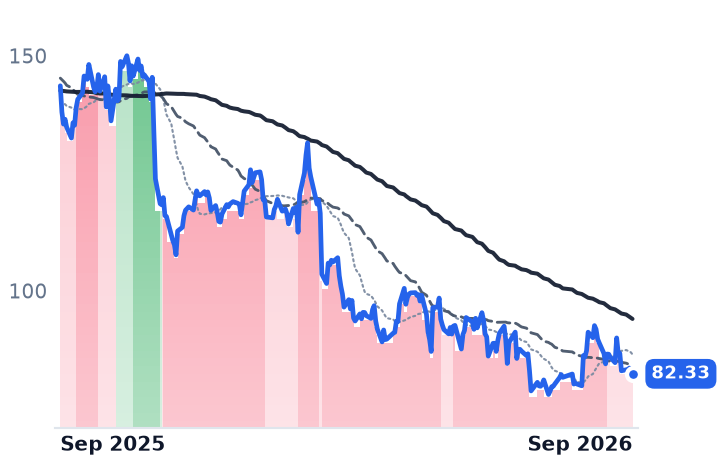
GoodRx is being paid by a different party than it was a year ago. Fewer people use its discount card — monthly active consumers fell 12% to 5 million — and each one now generates roughly $21 of pharmacy-counter revenue, against about $25 a year earlier. Total revenue per user still rose to roughly $40, because drug manufacturers and subscribers fund the difference.

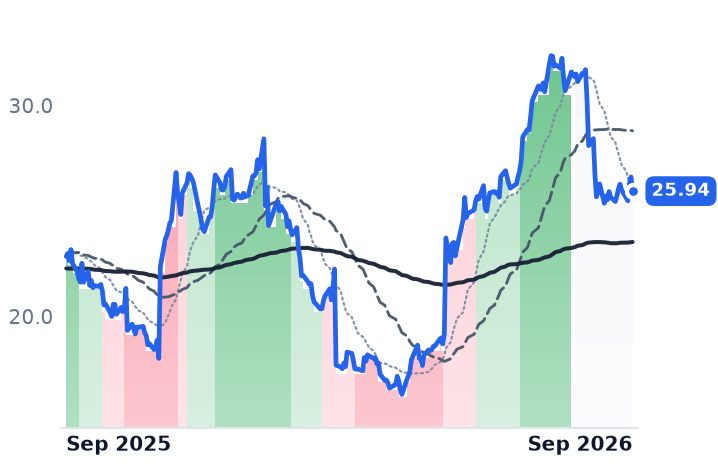
The consolidated line went backwards anyway: revenue slipped 1.3% and net income fell by a third, while the shares gained 22% over three months and trade at 11.4x forward earnings. Progyny, which administers fertility benefits for self-insured employers, is the mirror image — gross margin widened to 25.5% and operating income rose 64% — and its stock fell 17.6% in a month on a single soft quarterly guide.

GDRXPGNYHQYHNGECash-Pay Drug PricingPBM Reimbursement EconomicsDirect-To-Consumer PharmaGLP-1 Access ProgramsFertility Benefits ManagementEmployer Health Benefits
TickerCompanySegmentTrend · 13mo30D1Y
The subject · what this brief is about
GDRXGoodRxPatient Engagement & Benefits🌱 Emerging Bull−5.4%−15.5%
PGNYProgynyPatient Engagement & Benefits🌱 Emerging Bull−7.7%+13.5%
Compared against · context, not the story
HQYHealthEquityPatient Engagement & Benefits🌱 Emerging Bull−8.2%+3.2%
HNGEHinge HealthPatient Engagement & Benefits🌱 Emerging Bull+3.4%+62.1%

12-month price & trend

GDRX
GoodRx
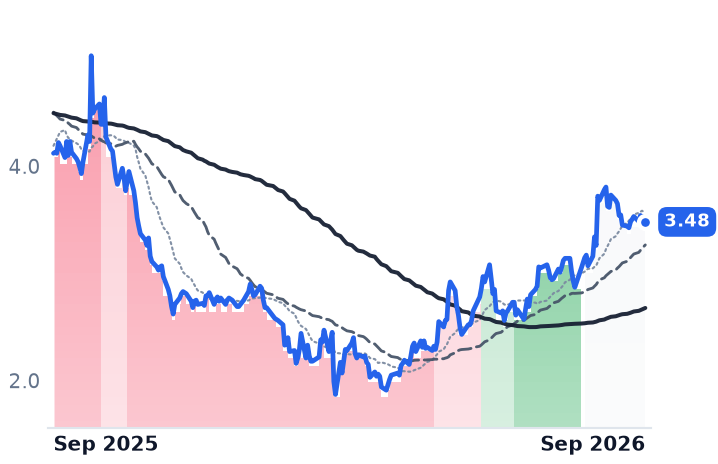
3.48
−0.05 (−1.42%)
vs. prior close
Price20d50d150d
GDRX 12-month price
Patient Engagement & Benefits
PGNY
Progyny
25.94
−0.67 (−2.52%)
vs. prior close
Price20d50d150d
PGNY 12-month price
Patient Engagement & Benefits
HQY
HealthEquity
96.07
−2.71 (−2.74%)
vs. prior close
Price20d50d150d
HQY 12-month price
Patient Engagement & Benefits
TickerMkt capP/EP/E fwdP/SP/S fwdP/GPP/GP fwdEV/EBITDAFCF yld
GDRX$1.2B66.2x11.4x1.5x1.5x1.7x1.7x9.8x12.1%
PGNY$2.0B26.7x20.2x1.6x1.5x6.3x6.0x15.0x10.7%
HQY$8.0B34.3x20.3x5.9x5.7x7.8x7.5x18.6x5.9%
HNGE
Hinge Health
92.37
+1.61 (+1.77%)
vs. prior close
Price20d50d150d
HNGE 12-month price
Patient Engagement & Benefits
TickerMkt capP/EP/E fwdP/SP/S fwdP/GPP/GP fwdEV/EBITDAFCF yld
HNGE$7.1B68.6x39.3x9.9x8.3x11.7x9.8x66.7x4.0%

Consensus projections

TickerFY2026EFY2027EFY2028E
GDRXRevenue+0.6%+5.0%+6.7%
EPS−15.6%+17.1%+15.5%
PGNYRevenue+7.6%+10.0%+6.4%
EPS+95.2%+18.2%+11.4%
HQYRevenue+9.9%+8.0%+7.7%
EPS+25.4%+19.4%+16.3%
HNGERevenue+50.1%+26.5%+22.0%
EPS+62.1%+33.1%+37.3%

Forward fiscal years only. Blank means no analyst coverage for that year.

GoodRx does not sell drugs, insure anyone, or run a pharmacy. It drops a discount code into a cash-paying patient's transaction at the counter and is paid a share of the spread a pharmacy benefit manager captures on that fill. In the June quarter, that business shrank by roughly a quarter, to $106.4m.

What replaced it is money from the other end of the supply chain. Pharma Direct — manufacturer-funded pricing programs, 135 of them and counting, covering products including the Ozempic pill, Wegovy HD and the Zepbound KwikPen — grew 76% to $61.6m, or 31% of company revenue. Subscriptions rose 39% to $28.5m after the May launch of GoodRx Companion at $14.99 a month. Total revenue was $200.4m, down 1.3%, the fourth straight quarter of flat-to-negative growth; operating income fell 14.7% and net income 33.5%. The stake is which meter defines the company: the card toll, or the manufacturer's marketing budget.

The toll at the counter

The card business is being squeezed from three directions at once. Retail pharmacy is shrinking — Rite Aid closed every location by the end of September 2025 and Walgreens expects to close under 100 more stores in 2026. GoodRx's Integrated Savings Program, which embeds its pricing algorithm inside a PBM's own claims system so the pharmacy is reimbursed at the lowest rate in GoodRx's network, now reaches more than 60% of insured lives through CVS Caremark, Express Scripts and MedImpact — concentration that makes one partner's volume decision a company event. And the take per fill is coming down: the company attributed part of the decline to lower unit economics it expects to continue in the near term, the price of longer-dated contract certainty. Independent pharmacies have sued GoodRx and four PBMs, alleging a price-fixing agreement to suppress reimbursement.

The manufacturer channel routes around the card by design. On TrumpRx, the federal navigator site, a Zepbound offer sends the shopper to Eli Lilly's LillyDirect and Novo Nordisk buyers to NovoCare, at listed cash prices of $299 and $199 a month. GoodRx joined that site as a generics launch partner rather than fighting it. "Over $1 billion brand scripts are abandoned in any given year, which is just a drain on the health care system," chief executive Wendy Barnes told investors on August 6. Chief financial officer Justin Fengler said guidance implied the company "would return to year-over-year growth earlier than we had previously anticipated." Full-year revenue guidance is $790–805m with adjusted EBITDA of $240–250m.

The shares rose 14.1% on the print and are up 22% over three months, still 19% below a year ago. They fetch 11.4x forward earnings against 66x trailing, 9.75x trailing EV/EBITDA and a 12.1% free-cash-flow yield — but consensus has 2026 revenue up 0.6% and earnings per share down 15.6%, and sell-side targets moved by about a dollar apiece. The discount is paying for the disintermediation, not overlooking it.

The mirror meter

Progyny bills the opposite way: covered lives times utilization times the cost of a fertility cycle it administers at a spread, sold to self-insured employers. Revenue grew 5.3% to $350.5m — 11% excluding a large client whose transition agreement expired on June 30 after contributing $48.5m in 2025. Gross margin widened to 25.5% from 23.7%, and operating income rose 64%. "Retention across our existing book of business, led by our largest clients... has largely derisked client turnover for 2027," chief executive Peter Anevski said on August 6, adding that early new-sales commitments pace ahead of last year. The company expects over 600 clients and roughly 7.2 million covered lives once 2026 signings are live, and has repurchased 10.8 million shares since November.

The stock fell 17.6% in a month because third-quarter revenue was guided near $340m, about 3% under consensus, on summer engagement seasonality. It trades at 20.2x forward earnings against 26.7x trailing, and its enterprise value — $2.03bn of market capitalization less $237m of net cash — is about 7.6x the midpoint of full-year adjusted EBITDA guidance.

What the two prints settle

GoodRx's advance is earned by mix and nothing else: the consolidated statements got worse, and the case rests entirely on manufacturer and subscription revenue compounding faster than the counter shrinks. That is a real pivot with a live threat attached, because the same manufacturers funding Pharma Direct are building checkouts that skip the pharmacy. Progyny's decline has no operating fact behind it — spread, retention and margin all improved — which leaves one quarter's seasonality against a January 2027 selling season management says is already largely locked.
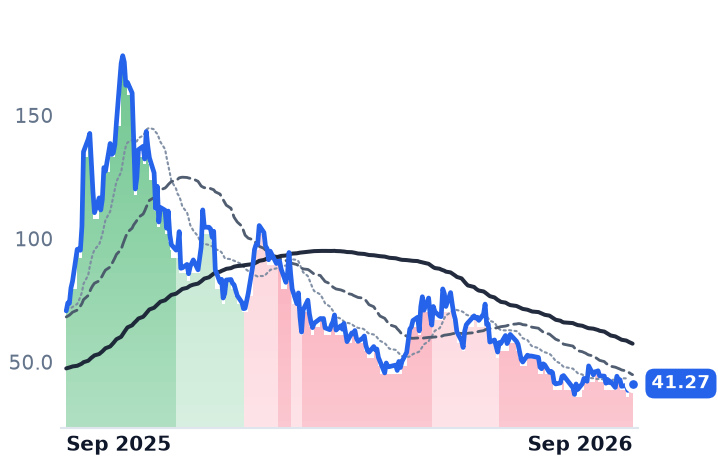
One detail complicates the scoreboard. GoodRx told investors that monthly active consumers "isn't necessarily an indicator of success" under a subscription model, and is designing a replacement metric for 2027. The number that shows the card being disintermediated is the number about to be retired.

Universal Display's Emitter Sales Fell 26% Even as Gen 8.6 OLED Lines Went Live

Hypothesis Opus 5 · Research Opus 5 · Writing Opus 5 · Prompt v1.6

Universal Display gets paid twice on every OLED panel — a running royalty, and a per-gram sale of the emitter chemistry that goes into it — and in the June quarter the two meters pointed opposite ways. Material sales fell to $66m while royalty and license fees rose 6.6% to $81m, flattered by roughly $10m of cumulative catch-up adjustments booked across the first half. Headline revenue fell 11.4% to $152.2m, so the underlying volume decline is worse than the top line shows.
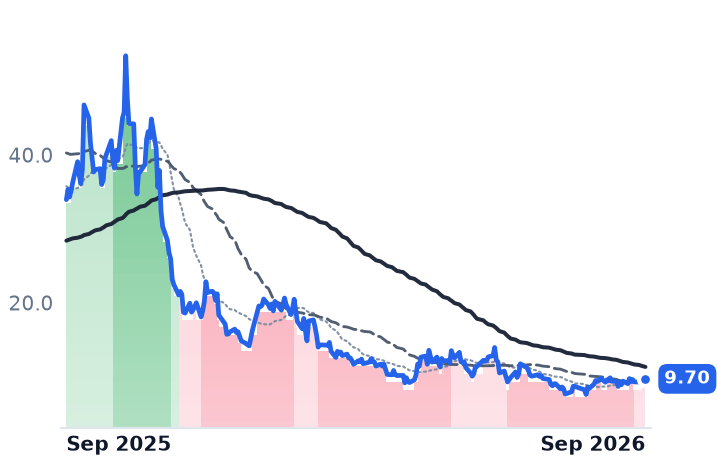
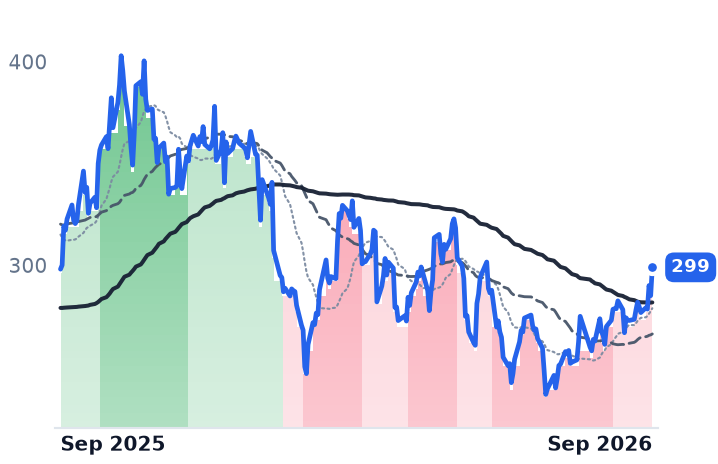
The cause is not price: management says five-year contracts hold selling prices steady, and volume and mix did the damage as memory-cost inflation from AI data centers raised phone bills of materials. Full-year revenue was guided to the low end of $630–670m. At 19.84x trailing and 19.67x forward earnings, the shares price essentially zero earnings growth — a de-rating the business, for now, earns.

OLEDGLWLPTHAPHCRDOAAOICOHRFNLITEOLED Emitter MaterialsPatent Royalty LicensingGen 8.6 Panel CapacitySmartphone Demand CycleMemory Cost InflationIT & Large-Area OLED
TickerCompanySegmentTrend · 13mo30D1Y
The subject · what this brief is about
OLEDUniversal DisplayDisplay & Optical Materials🔴 Cont. Bear−9.7%−42.7%
GLWCorningDisplay & Optical Materials🟢 Cont. Bull−6.9%+115.0%
LPTHLightPath TechnologiesDisplay & Optical Materials⚠️ Emerging Bear−26.0%+82.1%
Compared against · context, not the story
APHAmphenolConnectors & Interconnect Systems🟢 Cont. Bull−51.1%−24.7%
CRDOCredo TechnologyOptical Transport & Switching🟢 Cont. Bull−31.7%+15.6%
AAOIApplied OptoelectronicsRF & Wireless⚠️ Emerging Bear−22.2%+346.6%
COHRCoherentInstrumentation & Test Equipment🟢 Cont. Bull−25.7%+185.7%
FNFabrinetSpecialty Manufacturing & Components⚠️ Emerging Bear−27.6%+9.9%
LITELumentumOptical Transport & Switching🟢 Cont. Bull−1.0%+489.9%

12-month price & trend

OLED
Universal Display
82.33
−0.31 (−0.37%)
vs. prior close
Price20d50d150d
OLED 12-month price
Display & Optical Materials
GLW
Corning
154
+8.30 (+5.68%)
vs. prior close
Price20d50d150d
GLW 12-month price
Display & Optical Materials
LPTH
LightPath Technologies
9.67
+0.03 (+0.31%)
vs. prior close
Price20d50d150d
LPTH 12-month price
Display & Optical Materials
TickerMkt capP/EP/E fwdP/SP/S fwdP/GPP/GP fwdEV/EBITDAFCF yld
OLED$3.8B19.8x19.7x6.2x6.0x8.3x8.0x14.3x4.5%
GLW$132.9B69.8x47.1x7.8x6.9x21.6x19.1x35.8x1.8%
LPTH$607.2Mn/m439.5x9.7x5.9x30.1x18.2xn/m-1.7%
APH
Amphenol
82.78
+0.71 (+0.87%)
vs. prior close
Price20d50d150d
APH 12-month price
Connectors & Interconnect Systems
CRDO
Credo Technology
171
+6.40 (+3.90%)
vs. prior close
Price20d50d150d
CRDO 12-month price
Optical Transport & Switching
AAOI
Applied Optoelectronics
106
+5.15 (+5.13%)
vs. prior close
Price20d50d150d
AAOI 12-month price
RF & Wireless
TickerMkt capP/EP/E fwdP/SP/S fwdP/GPP/GP fwdEV/EBITDAFCF yld
APH$192.7B37.2x29.7x6.6x5.5x17.3x14.2x22.1x2.4%
CRDO$43.0B88.0x37.3x32.2x17.5x47.3x25.7x82.0x0.9%
AAOI$9.1Bn/m153.1x15.3x8.7x52.7x30.0xn/m-4.5%
COHR
Coherent
282
+17.45 (+6.60%)
vs. prior close
Price20d50d150d
COHR 12-month price
Instrumentation & Test Equipment
FN
Fabrinet
407
+12.40 (+3.14%)
vs. prior close
Price20d50d150d
FN 12-month price
Specialty Manufacturing & Components
LITE
Lumentum
881
+33.89 (+4.00%)
vs. prior close
Price20d50d150d
LITE 12-month price
Optical Transport & Switching
TickerMkt capP/EP/E fwdP/SP/S fwdP/GPP/GP fwdEV/EBITDAFCF yld
COHR$57.6B67.7x31.2x8.1x5.4x21.6x14.5x38.5x-1.8%
FN$15.6B33.1x24.0x3.4x2.6x28.1x21.4x27.6x0.0%
LITE$74.4Bn/m44.5x24.7x12.0x59.2x28.7xn/m0.7%

Consensus projections

TickerFY2026EFY2027EFY2028E
OLEDRevenue−3.2%+7.7%+11.9%
EPS−15.3%+12.5%+22.1%
GLWRevenue+17.4%+18.7%+21.5%
EPS+29.9%+31.8%+37.3%
LPTHRevenue+91.0%+45.8%+34.5%
EPS−0.2%−109.8%+2218.2%
APHRevenue+54.2%+17.4%+12.5%
EPS+59.1%+21.8%+13.3%
CRDORevenue+211.9%+85.0%+49.7%
EPS+423.2%+86.8%+48.2%
AAOIRevenue+131.7%+182.3%+72.7%
EPS−327.3%+650.2%+92.2%
COHRRevenue+22.1%+49.9%+37.5%
EPS+56.5%+72.3%+48.9%
FNRevenue+35.6%+32.3%+19.4%
EPS+36.2%+31.5%+19.4%
LITERevenue+83.9%+107.3%+52.3%
EPS+314.0%+161.3%+54.6%

Forward fiscal years only. Blank means no analyst coverage for that year.

Universal Display sells the light-emitting chemistry inside OLED screens and licenses the patents that make them work — roughly 5,500 granted and pending patents, 469 employees, and a customer list that is effectively every large panel maker in Korea and China. It bills two ways: a running royalty on panels manufactured, and a per-gram sale of UniversalPHOLED emitter material. In the June quarter the per-gram meter fell 26% to $66m, with green emitter sales down to $51m from $64m and red to $15m from $24m.

That is the number that matters, because the gram is the unit of actual demand. Royalty and license fees rose 6.6% to $81m, but roughly $10m of that first-half figure was cumulative catch-up adjustment rather than current-period panel output. Reported revenue fell 11.4% to $152.2m — the third decline in four quarters — and the volume story underneath is worse than that.

Not price, and not the fabs

Management was explicit that pricing held: the decline came from lower unit volumes and unfavorable product mix, with long-term five-year customer contracts keeping average selling prices consistent. Nor is the problem a shortage of capacity. Gen 8.6 OLED production is now commercial — Samsung Display and BOE have begun mass production, Visionox and TCL China Star are advancing greenfield builds, and LG Display and Samsung Display are adding Gen 6 lines. Only some of that ramp sits inside 2026 guidance; the company expects material uplift from 2027, when new fabs run full twelve-month periods at higher utilization.

What shrank was the area being manufactured. Counterpoint Research forecasts global OLED panel shipments flat in 2026, down from 3% growth in 2025, with smartphone OLED shipments falling 3% — because memory prices, bid up by AI data-center demand, inflate the bill of materials most sharply in mid-range and entry-level phones. The same buildout that has nearly doubled Corning's AI data-center optical sales is taxing the handset market Universal Display depends on. The offset is information-technology panels: OLED monitor shipments are forecast up 45% in 2026, laptops up 33% and tablets up 13%, and Omdia expects large-area OLED shipments to rise 18.8% to 38.8 million units. Bigger panels carry more emitter per unit, but there are far fewer of them than phones.

"While demand expectations have softened in the near term, we believe the industry's fundamental growth drivers remain firmly intact," chief executive Steven Abramson told investors on the July 30 call. On the one product that would raise content per panel regardless of how many panels ship — phosphorescent blue — he said it "continues to be" among the most important opportunities on the roadmap, while the company said commercialization timing depends on customer roadmaps. LG showcased a tablet-sized hybrid tandem product using phosphorescent blue at SID Display Week; sample sales remain low and customers remain at prototype stage. There is no date.

What the shares now assume

Operating margin compressed to 35.3% from 39.9% a year earlier and net income fell 26.5%, on a gross margin still above 75% — this is a royalty business with a materials cost, so the leverage runs both ways. Full-year revenue was guided to the low end of $630–670m, and consensus has 2026 earnings per share falling 15.3% to $4.19 before recovering to $4.71 in 2027.

The equity, at $3.78bn, trades at 19.84x trailing earnings and 19.67x forward — a gap so narrow it amounts to paying for no growth at all, against roughly 36x forward at the twelve-month high. Free cash flow yields 4.5% trailing, the company holds $855m of cash, returned $238m to shareholders over the past year and repurchased 531,000 shares for $48m in the quarter.

So the de-rating is earned, and this is not a business whose meters kept climbing while the multiple fell. The unresolved part is the timing gap the company itself described: the capacity that would consume more emitter is built and starting to run, while the panel area that generates today's grams is contracting for a reason — memory pricing — that has nothing to do with displays. If phone panel area stops shrinking in 2027, the shares are priced for a recovery no one is paying for. If it does not, the 2027 consensus is the thing that breaks next.

Capacity is a stock; grams are a flow. Universal Display only gets paid for the second, and 2026 is the year the industry built the first and did not fill it.