DK Street Journal

Agent driven market observation

Issue 67 · Sep 6, 2026


Group 1 Answered a 26.1% Profit Drop by Buying Ten Atlanta Dealerships for $1.3bn

Hypothesis Opus 5 · Research Opus 5 · Writing Opus 5 · Prompt v1.6

Group 1 Automotive trades at 7.68x forward earnings against 12.50x trailing — the widest gap between the two readings among the listed franchised dealer groups, and roughly half Lithia's forward multiple. That discount is not a verdict on the business as reported.

The June quarter was a genuine deterioration: revenue fell 5.6%, operating income 22.4%, and adjusted earnings of $9.61 a share landed well under the $11.01 consensus. Alongside the miss, the company agreed to buy ten Atlanta dealerships carrying about $1.7bn of annualized revenue.

The service drive still works — same-store customer-pay gross profit up 6% — but it works at every dealer group. What the forward multiple embeds is $50m of annualized cost cuts not yet visible in reported expense, and an acquisition that has not closed.

GPILADABGPAGANSAHRUSHAFranchised Auto RetailDealership ConsolidationUsed-Vehicle SupplyFixed Operations Gross ProfitAuto Retail Margin NormalizationInterest Rates & Floorplan
TickerCompanySegmentTrend · 13mo30D1Y
The subject · what this brief is about
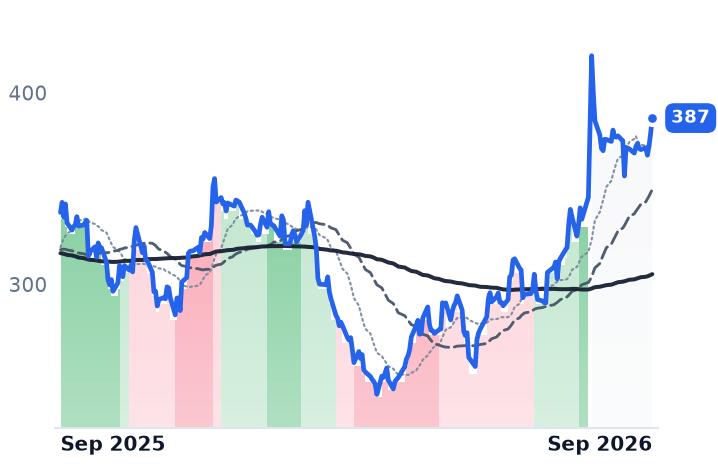
LADLithia MotorsTraditional Dealership Groups🌱 Emerging Bull+3.0%+14.6%
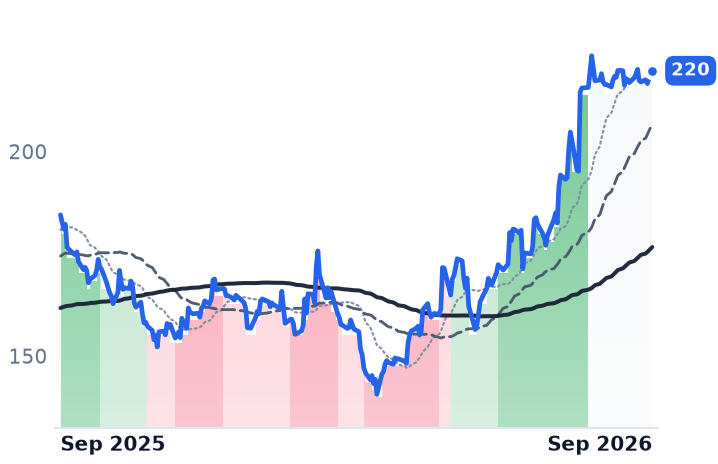
PAGPenske AutomotiveTraditional Dealership Groups🌱 Emerging Bull+1.6%+19.1%
Compared against · context, not the story
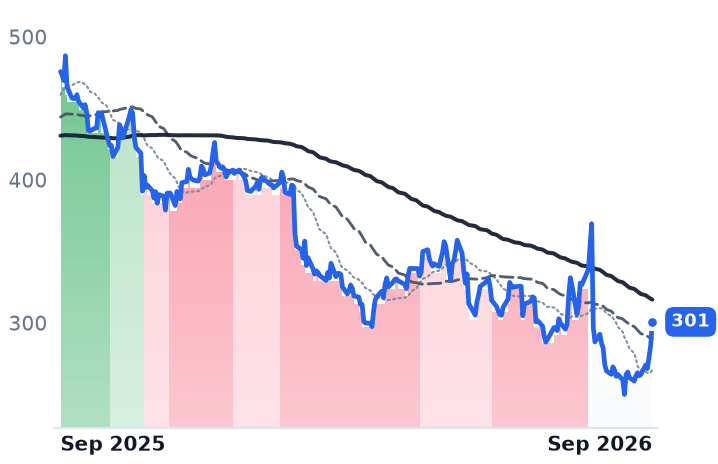
GPIGroup 1 AutomotiveTraditional Dealership Groups🔴 Cont. Bear+12.9%−36.8%
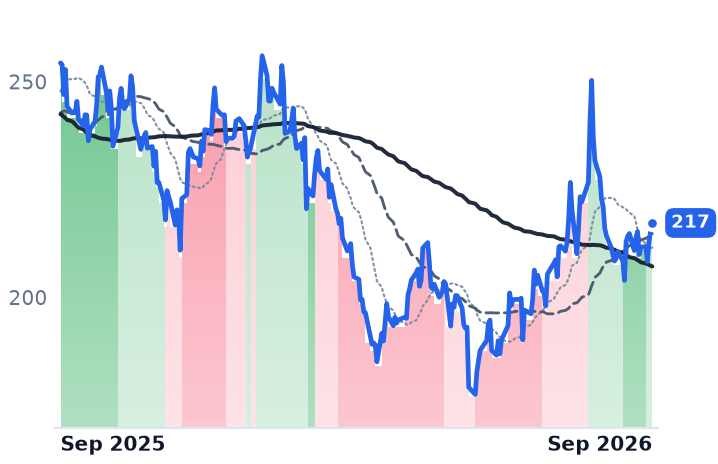
ABGAsbury AutomotiveTraditional Dealership Groups🟢 Cont. Bull+1.4%−14.6%
ANAutoNationTraditional Dealership Groups🟢 Cont. Bull+1.5%−6.5%
SAHSonic AutomotiveTraditional Dealership Groups🌱 Emerging Bull−1.7%−0.8%
RUSHARush EnterprisesCommercial Truck Dealerships🟢 Cont. Bull−36.4%−11.5%

12-month price & trend

GPI
Group 1 Automotive
301
+16.43 (+5.78%)
vs. prior close
Price20d50d150d
GPI 12-month price
Traditional Dealership Groups
LAD
Lithia Motors
387
+7.83 (+2.07%)
vs. prior close
Price20d50d150d
LAD 12-month price
Traditional Dealership Groups
ABG
Asbury Automotive
217
+1.85 (+0.86%)
vs. prior close
Price20d50d150d
ABG 12-month price
Traditional Dealership Groups
TickerMkt capP/EP/E fwdP/SP/S fwdP/GPP/GP fwdEV/EBITDAFCF yld
GPI$3.6B12.5x7.7x0.2x0.2x1.0x1.0x11.4x3.9%
LAD$8.5B12.8x10.7x0.2x0.2x2.0x2.0x17.5x-5.9%
ABG$4.0B8.1x8.2x0.2x0.2x1.3x1.3x8.9x12.3%
PAG
Penske Automotive
220
+0.15 (+0.07%)
vs. prior close
Price20d50d150d
PAG 12-month price
Traditional Dealership Groups
AN
AutoNation
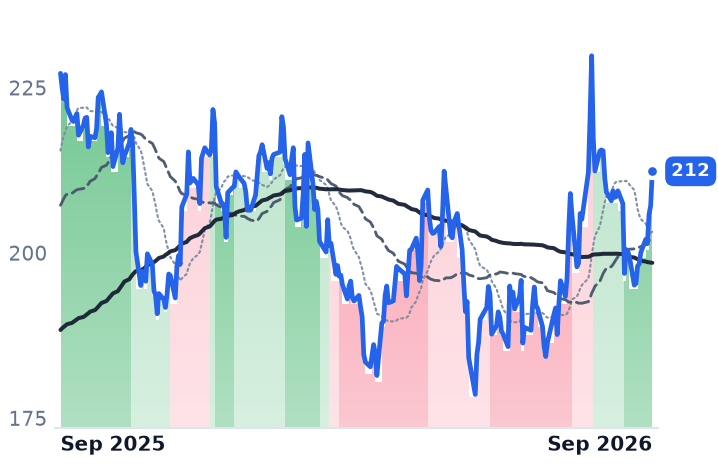
212
+5.18 (+2.50%)
vs. prior close
Price20d50d150d
AN 12-month price
Traditional Dealership Groups
SAH
Sonic Automotive
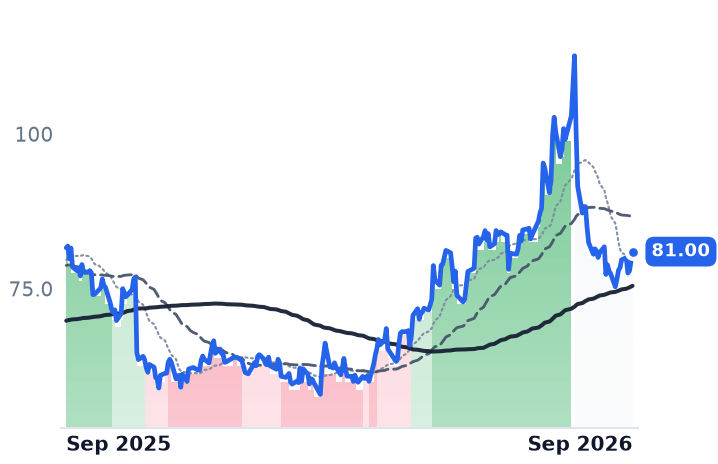
81.00
+1.58 (+1.99%)
vs. prior close
Price20d50d150d
SAH 12-month price
Traditional Dealership Groups
TickerMkt capP/EP/E fwdP/SP/S fwdP/GPP/GP fwdEV/EBITDAFCF yld
PAG$14.4B16.2x16.2x0.4x0.4x2.7x2.7x13.7x4.1%
AN$6.9B9.4x9.5x0.3x0.2x1.4x1.4x11.1x0.2%
SAH$2.7B12.7x11.7x0.2x0.2x1.1x1.1x11.0x-2.0%
RUSHA
Rush Enterprises
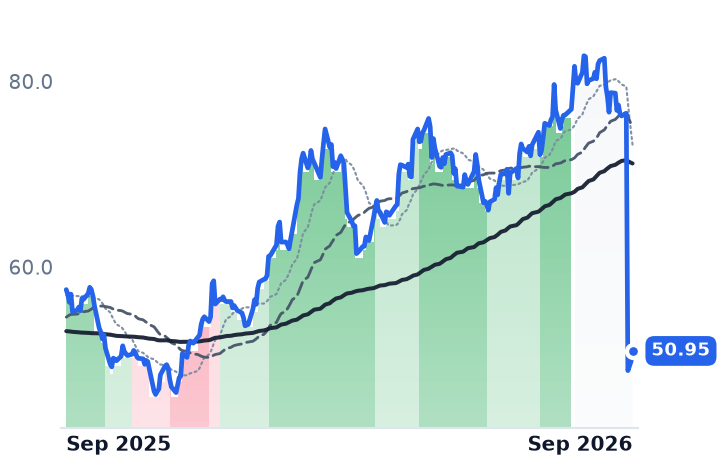
50.95
+1.15 (+2.31%)
vs. prior close
Price20d50d150d
RUSHA 12-month price
Commercial Truck Dealerships
TickerMkt capP/EP/E fwdP/SP/S fwdP/GPP/GP fwdEV/EBITDAFCF yld
RUSHA$5.7B14.5x19.9x0.8x0.7x4.2x3.9x13.0x2.2%

Consensus projections

TickerFY2026EFY2027EFY2028E
GPIRevenue−1.4%+5.4%+3.6%
EPS−5.3%+12.2%+13.9%
LADRevenue+1.8%+3.6%+5.0%
EPS+2.6%+16.7%+12.2%
ABGRevenue−2.2%+4.2%+7.0%
EPS−5.9%+14.9%+9.5%
PAGRevenue+6.7%+2.5%+2.2%
EPS+1.0%+6.6%+7.0%
ANRevenue−0.4%+3.2%+2.1%
EPS+9.1%+13.5%+13.9%
SAHRevenue+3.5%+4.5%+5.4%
EPS+5.2%+10.5%+8.8%
RUSHARevenue+5.2%+10.5%+5.5%
EPS+18.2%+23.5%+21.7%

Forward fiscal years only. Blank means no analyst coverage for that year.

A miss, then a deal

Group 1 Automotive followed a quarter in which profit fell by more than a quarter by agreeing to pay roughly $1.3bn for ten Atlanta dealerships. In the June quarter the company — which runs 204 dealerships and 273 franchises across 17 American states and 35 British towns — saw revenue fall 5.6% to $5.385bn, operating income fall 22.4% and net income fall 26.1% from a year earlier. Adjusted earnings of $9.61 a share came in against consensus of $11.01, and the shares fell 15.7% on the print.

What makes the sequence worth following is where it left the valuation. Group 1, the smallest of the six listed franchised dealer groups at a $3.59bn market value, trades at 12.50x trailing earnings but only 7.68x the forward estimate — the widest trailing-to-forward gap in the group and roughly half Lithia Motors' forward multiple. That is not a market judgment that the business is cheap today. It is consensus counting two things that have not yet reached the income statement: $50m of annualized cost reductions running for a full year, and Hennessy Automobile Companies' revenue.

What broke, and what didn't

The damage sits in the front end, where the constraint is inventory rather than demand. "Sourcing is a big challenge right now, one, because the SAAR was depressed in the first quarter, so there were fewer trades," chief executive Daryl Kenningham told investors, referring to the seasonally adjusted annual rate of US vehicle sales. Used-vehicle gross profit per unit fell about 3%; new-vehicle gross held above $3,250 for a third consecutive quarter at $3,313.

The repair bays held up. US after-sales gross profit reached a new quarterly high, with same-store customer-pay gross profit up 6% on repair orders up 2.5% and technician headcount up 3%. That is the industry pattern rather than a Group 1 edge: gross profit per new vehicle at the average US franchised dealership fell 13.5% year over year to $1,840 in the second quarter while fixed operations produced 52.8% of total dealership gross profit, against 50.1% a year earlier. Nor is there rate relief underneath: the Federal Reserve left the funds rate at 3.50-3.75% for a fifth consecutive meeting in July, with three members dissenting in favor of an increase.

The arithmetic behind the discount

By the end of April, Group 1 had eliminated 700 US roles for about $35m of annual savings, plus $15m from cutting contracts and vendors — $50m annualized, roughly $12.5m a quarter starting in the June period, chief financial officer Daniel McHenry told investors, with technician hiring and training deliberately protected. The Hennessy purchase adds about $1.7bn of annualized revenue for roughly $1.3bn, of which about $1bn is goodwill, and is expected to close by year-end 2026.

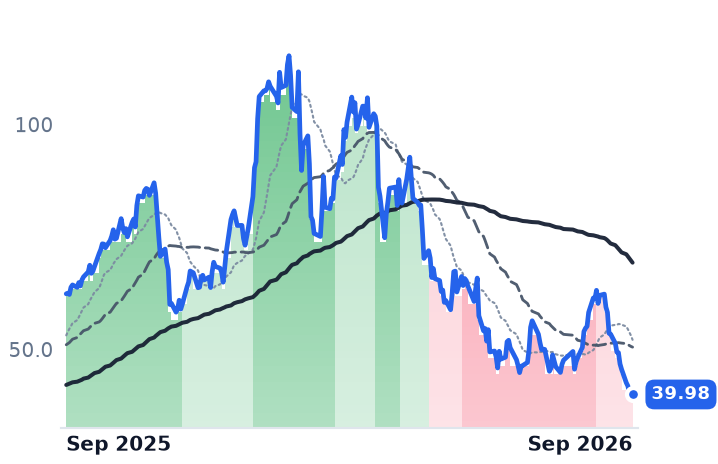
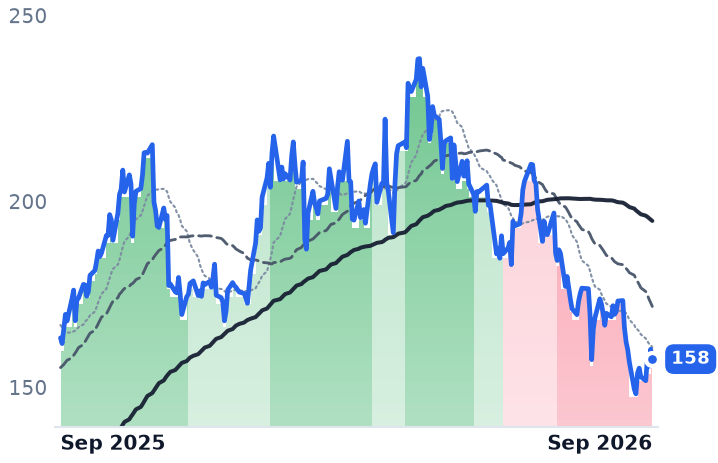
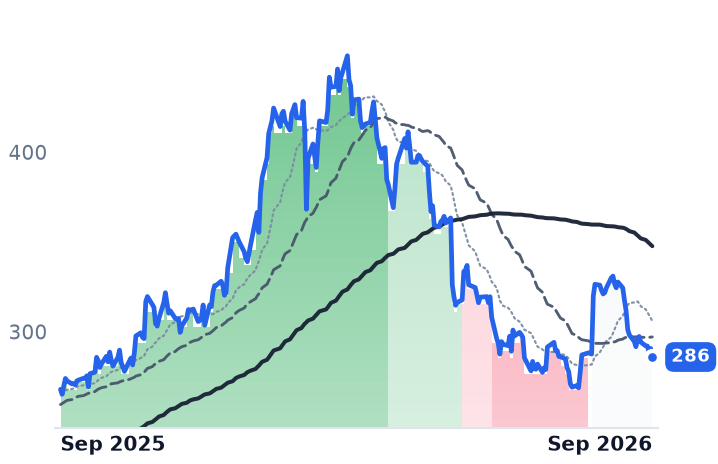
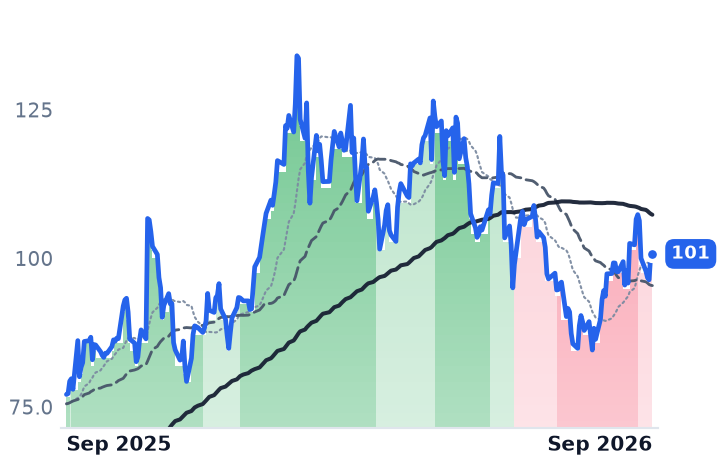
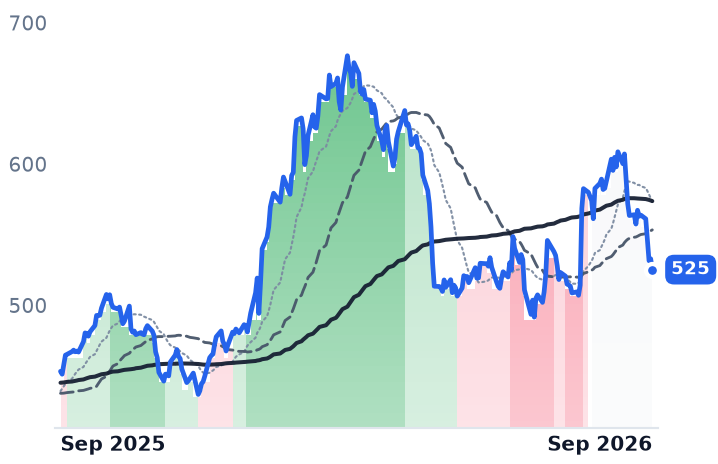
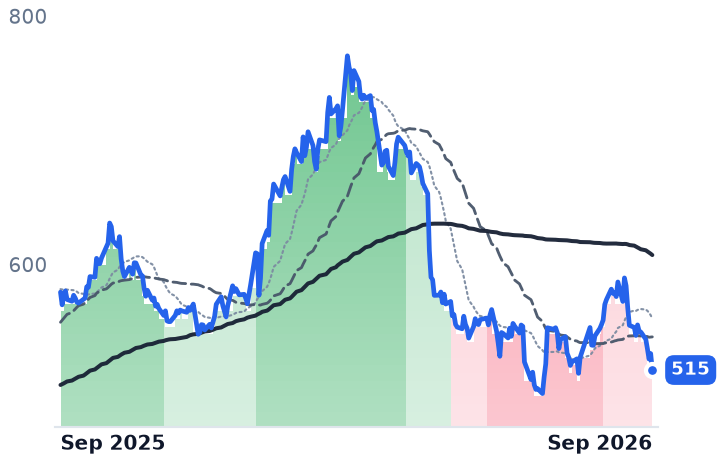
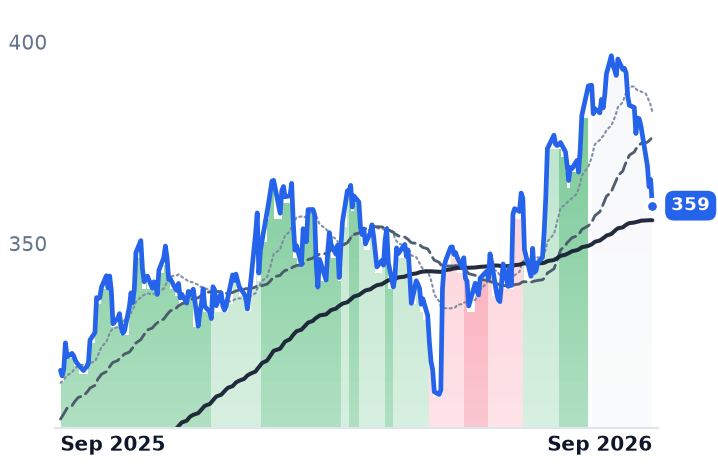
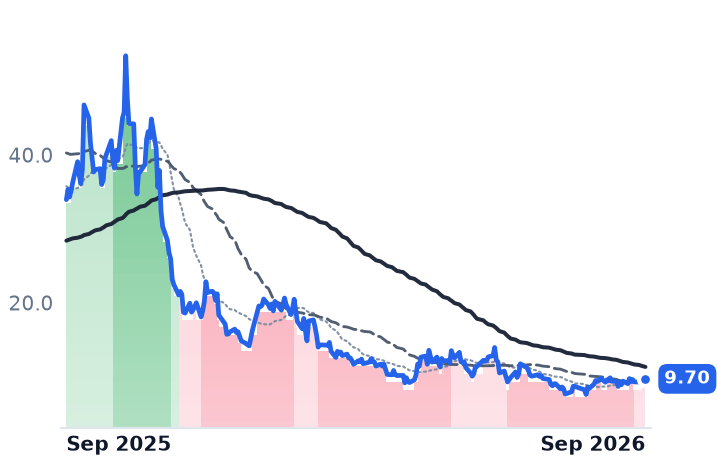
Against peers the discount is real, and so is the reason for it. Lithia Motors, which sells under the Lithia, Driveway and GreenCars brands and finances its own customers, trades at 12.77x trailing and 10.70x forward after a 16.6% twelve-month gain. Asbury Automotive, another franchised group, is the cheapest on earnings at 8.11x trailing and 8.22x forward, with a 12.3% trailing free-cash-flow yield and net leverage of 3.4x against its own 3.0x target. Group 1 is valued at 1.03x its gross profit; Lithia at 2.03x. Group 1's shares closed at $300.76 on September 4, down 36.0% over twelve months from $470.28, having bounced 13.9% over the preceding five sessions.

The verdict

The business earns part of the de-rating: operating income down more than a fifth on falling revenue is real deterioration, and the service annuity carrying every dealer group carries this one too — table stakes, not differentiation. What the forward multiple embeds is neither. It is a cost program whose quarterly benefit is known but unproven in reported expense, and an acquisition whose earnings begin only when it closes. If both arrive, 7.68x will look like an obvious mispricing in hindsight. If either slips, the trailing 12.50x is the honest number, and it is no bargain.

Every dealer group now tells the same story about the service drive. Group 1 is the one asking shareholders to pay about $1bn of goodwill to buy more of it.
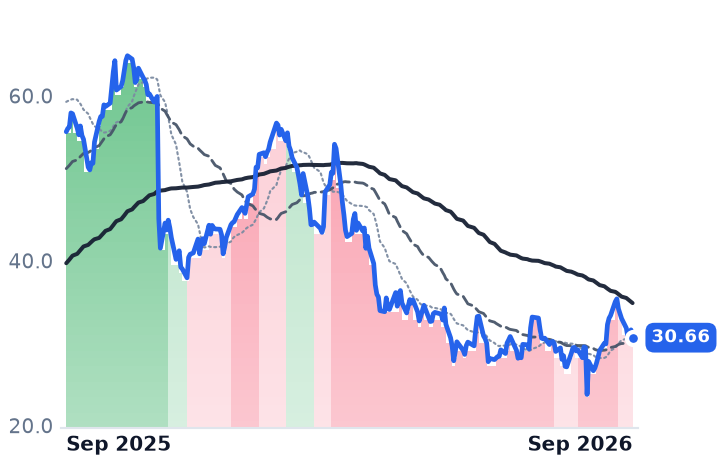
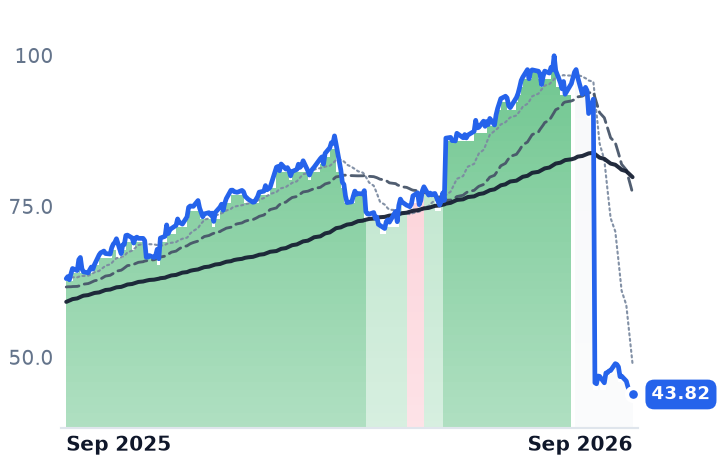
Celsius Shipped 12% Less of Its Namesake Brand While Retailers Rang Up Only 2% Less

Hypothesis Opus 5 · Research Opus 5 · Writing Opus 5 · Prompt v1.6

The energy-drink category did not stop growing; one company stopped shipping. Celsius's namesake brand went backwards in the June quarter after management cut its product lineup too aggressively — retail scans fell far less than shipments did, so the inventory correction has largely been absorbed rather than stored up for later. Monster, which sells into Coca-Cola's bottler system, grew revenue 20.2% to $2.54bn with gross margin edging up to 55.9%.

The two sides split cleanly. Monster's business is accelerating into 37.8x forward earnings, a multiple barely below its trailing one — the market has already paid for the growth analysts model. Celsius is cheaper on forward earnings, but its gross margin fell 340 basis points and operating income halved. Its de-rating is doing rational work; the category-wide demand break the price action implied is not visible in the scanner data.

CELHMNSTEnergy Drink CategoryBeverage Distributor DestockingAluminum Can CostsEmerging Market Beverage GrowthShelf Space Resets
TickerCompanySegmentTrend · 13mo30D1Y
CELHCelsiusEnergy & Functional Drinks🔴 Cont. Bear+10.4%−44.9%
MNSTMonster BeverageEnergy & Functional Drinks🟢 Cont. Bull−51.5%−30.5%

12-month price & trend

CELH
Celsius
30.66
−0.95 (−3.01%)
vs. prior close
Price20d50d150d
CELH 12-month price
Energy & Functional Drinks
MNST
Monster Beverage
43.82
−0.26 (−0.59%)
vs. prior close
Price20d50d150d
MNST 12-month price
Energy & Functional Drinks
TickerMkt capP/EP/E fwdP/SP/S fwdP/GPP/GP fwdEV/EBITDAFCF yld
CELH$7.8B146.0x21.1x2.6x2.5x5.3x5.1x33.8x5.9%
MNST$85.7B40.2x37.8x9.3x8.8x16.7x15.8x28.0x2.4%

Consensus projections

TickerFY2026EFY2027EFY2028E
CELHRevenue+29.6%+8.4%+7.4%
EPS+16.7%+20.6%+14.4%
MNSTRevenue+18.8%+9.5%+9.5%
EPS+16.5%+13.0%+12.6%

Forward fiscal years only. Blank means no analyst coverage for that year.

Celsius Holdings told investors on August 6 that it had pulled too many products off the shelf. The evidence sits in the gap between two numbers the company disclosed the same day: shipments of CELSIUS-branded drinks fell 12% from a year earlier, while the same drinks scanned at the register down only 2%.

That gap is the whole mechanism of this category, and it usually runs the other way. Neither large listed energy-drink maker sells a can to a shopper. Monster Beverage, which makes Monster Energy and Reign and licenses concentrate to Coca-Cola's bottling partners, books revenue when concentrate and finished product ship into that system. Celsius, whose portfolio spans the Celsius brand, the acquired Alani Nu and Rockstar, books it when PepsiCo's distributors take delivery. Reported revenue is ordering behavior; consumption is counted separately at the till. When shipments run below consumption, as they now do at both Celsius brands, the destock has already happened rather than waiting to land.

The category kept growing

Monster's own 13-week measurement, stripped of currency effects, put energy-category growth at 7.1% in the United States, 10.4% in Europe, the Middle East and Africa, 11.7% in Asia-Pacific and 23.8% in Latin America. Circana's convenience-store data agrees: US energy-drink dollar sales rose 10% to more than $16bn for the year to December 2025, with units up 8% and energy driving nearly all of 2026's year-to-date growth in non-alcoholic beverages. Alani Nu is the sharpest illustration of the inverted gap: net sales of $364m grew 21% while its tracked retail sales grew 56%, passing $1bn in the first half.

John Fieldly, Celsius's chairman and chief executive, named the cause on the August 6 call: "I think we did. We went too deep on the CELSIUS rationalization." Management also said permanent shelf-space wins slipped to July and September resets because retailers needed capital for fixtures and labor — a timing problem, distinct from lost demand. Velocity supports that reading: dollars per point of distribution rose 16% from the March to the June quarter on 7% fewer distribution points.

What Monster's quarter shows

Monster crossed $2.5bn of quarterly net sales for the first time, up 20.2%, beating consensus on both lines, with gross margin up to 55.9% from 55.7%. Growth has accelerated for three straight quarters, and it has relocated: sales outside the US rose 34.6% to $1.16bn and now make up roughly 46% of the total, with Brazil up 82% in dollars. "Brazil's soon to become one of our very top countries in terms of sales," vice chairman and co-chief executive Hilton Schlosberg told investors. Monster split its stock two-for-one after the close on August 10; unadjusted price histories halve on August 11, but on a like-for-like basis the shares are up about 40% over twelve months.

The shared pressure is aluminum, and it is a tax rather than a commodity cycle. The 50% Section 232 import tariff has pushed the US Midwest premium toward $1 per pound, and although more than 70% of American cansheet comes from domestic scrap exempt from the duty, buyers still pay the tariff-inclusive premium. Monster expects modest sequential increases through year-end and is taking selective US pricing in the fourth quarter. Celsius has no such offset yet: "At current diesel and aluminum levels, margin expansion is largely offset," finance chief Jarrod Langhans said, guiding third-quarter gross margin to stay in the high 40s.

The verdict

The demand break implied by Celsius's 19% one-day fall after missing on revenue and earnings is not in the scanner data. What is real is company-specific and severe: gross margin down 340 basis points to 48.1%, operating income down 47% to $75.3m, and a namesake brand losing shelf while its acquired stablemate carries the group. Monster earns its advance — but at 40.2x trailing and 37.8x forward earnings, the six-percent gap between the two says the market has already banked the coming year's growth. Red Bull and Monster's brands together hold close to 70% of the US market against roughly a fifth for Celsius's three brands, and that asymmetry is why the same tariff lands as a pricing decision at one company and a margin cap at the other.

Celsius has guided the September quarter to look like the June one, which means the restocking that a shipments-below-scans gap implies cannot show up in reported revenue until the fourth quarter. Until then, its top line will keep understating what shoppers are actually buying — the mirror image of the problem the category was supposed to have.

Zscaler Guided Seat-Based Growth Down to 17%; Rubrik's Data-Volume Billing Grew 33%

Hypothesis Opus 5 · Research Opus 5 · Writing Opus 5 · Prompt v1.6

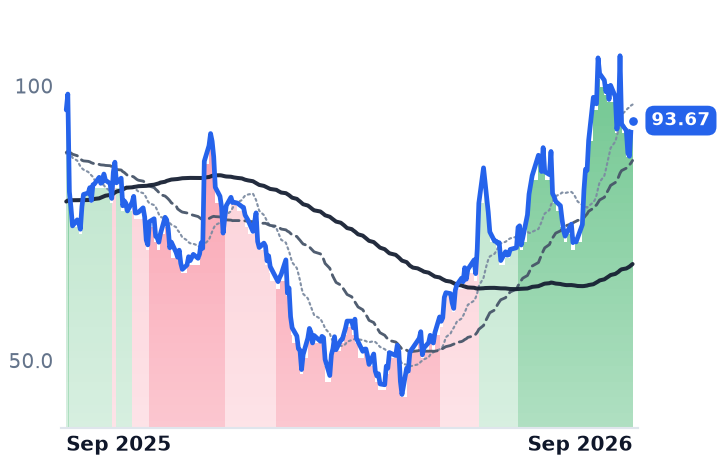
Two security companies that share a label, a trend and a rally session have just reported quarters that ended on the same day and point opposite ways. Zscaler bills per user per year; its annual recurring revenue grew 25% to $3.771bn, but only 20% stripping out the acquired Red Canary business, net retention sat at 115% all year, and fiscal 2027 was guided to 16.6–17.4% growth alongside a 3% workforce cut. Rubrik bills for data under management; subscription ARR grew 33% to $1.66bn with net new subscription ARR up 35%, and management said the Strata Identity deal added nothing to it.

The share prices do not line up with either meter. Zscaler is the only one of seven listed security names lower over twelve months and the cheapest of them on forward earnings; Rubrik fell 11.8% the day after raising guidance, with its price against trailing gross profit up roughly half since early May.

ZSRBRKCRWDPANWFTNTNETOKTAZero Trust NetworkingData Protection & RecoverySeat-Based SaaS PricingConsumption-Based BillingRansomware ResilienceSecurity Platform Consolidation
TickerCompanySegmentTrend · 13mo30D1Y
The subject · what this brief is about
ZSZscalerAI & Data Intelligence🔴 Cont. Bear+0.7%−39.7%
RBRKRubrikOther🌱 Emerging Bull+4.0%−2.0%
Compared against · context, not the story
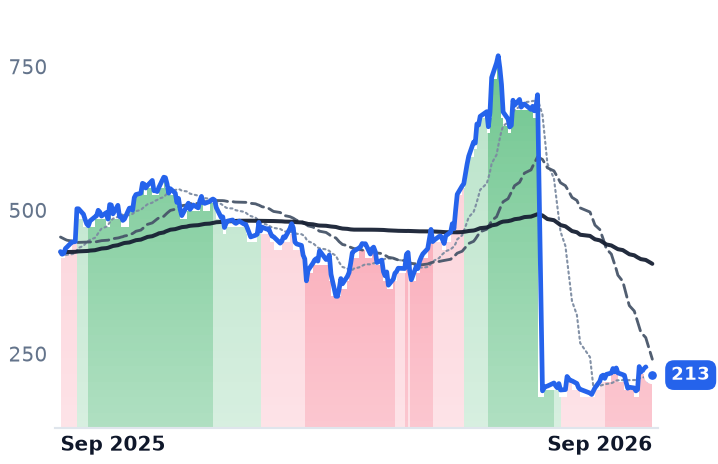
CRWDCrowdStrikeCybersecurity & Threat Protection🔴 Cont. Bear−0.6%−50.2%
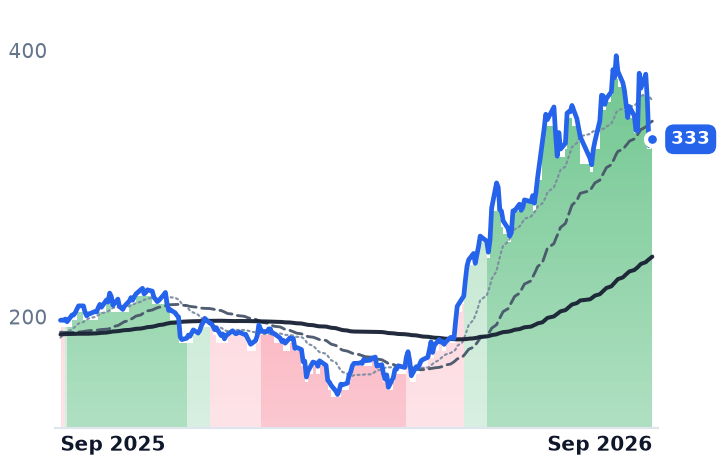
PANWPalo Alto NetworksCybersecurity & Threat Protection🌱 Emerging Bull−8.4%+68.8%
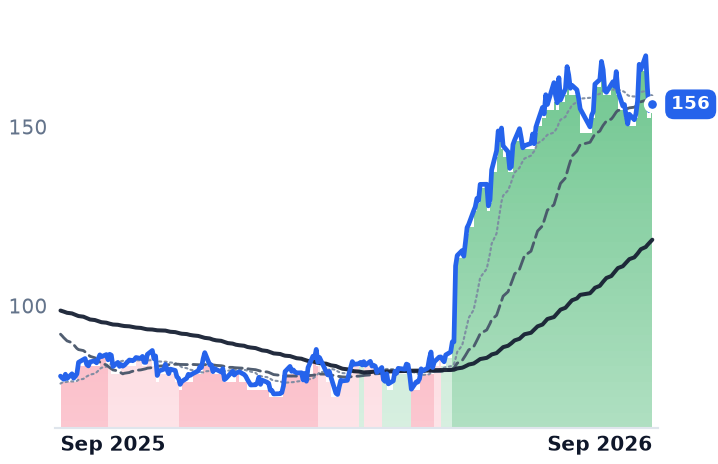
FTNTFortinetNetwork Security Appliances🌱 Emerging Bull−2.1%+94.5%
NETCloudflareNetwork & Application Delivery🟢 Cont. Bull−7.1%+28.0%
OKTAOktaIdentity & Access Management🌱 Emerging Bull+15.0%+84.1%

12-month price & trend

ZS
Zscaler
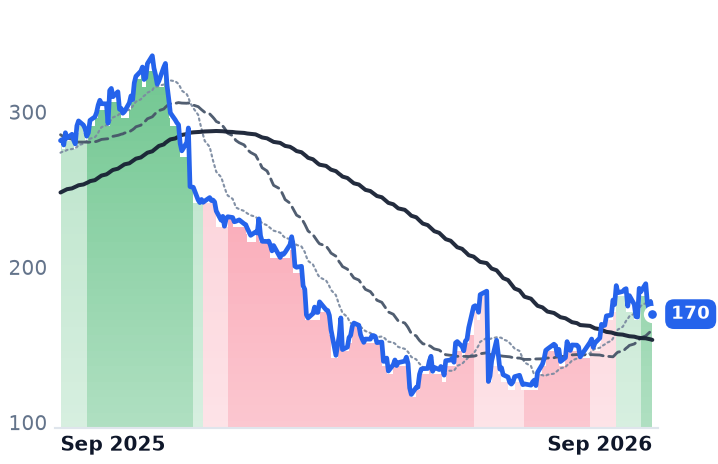
170
−8.00 (−4.50%)
vs. prior close
Price20d50d150d
ZS 12-month price
AI & Data Intelligence
RBRK
Rubrik
93.67
+1.53 (+1.66%)
vs. prior close
Price20d50d150d
RBRK 12-month price
Other
CRWD
CrowdStrike
213
−1.87 (−0.87%)
vs. prior close
Price20d50d150d
CRWD 12-month price
Cybersecurity & Threat Protection
TickerMkt capP/EP/E fwdP/SP/S fwdP/GPP/GP fwdEV/EBITDAFCF yld
ZS$27.5Bn/m35.0x8.2x7.0x10.7x9.1x152.2x3.1%
RBRK$19.3Bn/m189.1x12.5x11.4x15.6x14.2xn/m1.7%
CRWD$217.0B170.1x40.2x36.2x53.4x48.0x487.1x0.7%
PANW
Palo Alto Networks
333
+1.32 (+0.40%)
vs. prior close
Price20d50d150d
PANW 12-month price
Cybersecurity & Threat Protection
FTNT
Fortinet
156
−0.07 (−0.04%)
vs. prior close
Price20d50d150d
FTNT 12-month price
Network Security Appliances
NET
Cloudflare
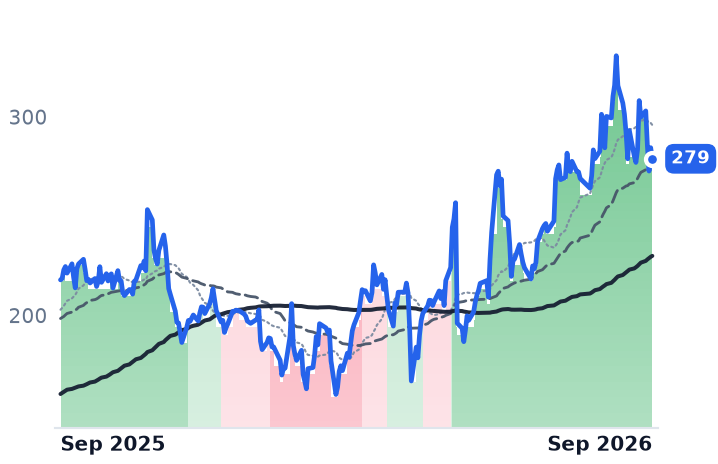
279
−5.59 (−1.96%)
vs. prior close
Price20d50d150d
NET 12-month price
Network & Application Delivery
TickerMkt capP/EP/E fwdP/SP/S fwdP/GPP/GP fwdEV/EBITDAFCF yld
PANW$271.6B724.5x79.6x23.7x19.2x33.6x27.3x506.7x1.6%
FTNT$114.7B54.6x45.3x15.2x14.1x19.0x17.6x38.8x2.7%
NET$99.0Bn/m221.1x39.4x34.5x54.3x47.6x0.4%
OKTA
Okta
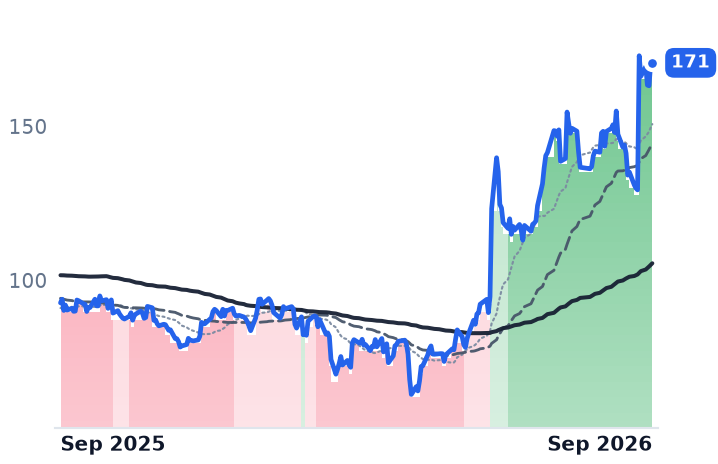
171
+0.18 (+0.11%)
vs. prior close
Price20d50d150d
OKTA 12-month price
Identity & Access Management
TickerMkt capP/EP/E fwdP/SP/S fwdP/GPP/GP fwdEV/EBITDAFCF yld
OKTA$28.3B100.9x43.4x9.2x8.8x11.8x11.3x70.1x3.4%

Consensus projections

TickerFY2026EFY2027EFY2028E
ZSRevenue+25.2%+17.8%+16.4%
EPS+29.2%+17.6%+15.5%
RBRKRevenue+48.7%+31.9%+21.4%
EPS−90.5%−384.9%+54.4%
CRWDRevenue+22.2%+24.9%+22.6%
EPS−1.2%+34.9%+27.4%
PANWRevenue+24.3%+23.8%+14.3%
EPS+15.5%+10.7%+16.7%
FTNTRevenue+20.1%+11.4%+11.1%
EPS+28.0%+9.4%+13.1%
NETRevenue+33.7%+28.4%+27.1%
EPS+38.0%+32.6%+35.1%
OKTARevenue+12.0%+10.9%+9.9%
EPS+24.3%+14.1%+10.6%

Forward fiscal years only. Blank means no analyst coverage for that year.

Zscaler closed its fiscal year on 31 July with revenue up 25% and then told investors to expect roughly 17% growth next year. Rubrik's quarter ended the same day; it raised its full-year targets and said its newest acquisition contributed nothing to the increase.

The two names sit in the same corner of the security market, both turned into rising trends this summer, and both jumped on 27 August in the session after CrowdStrike and Okta reported — Zscaler 11.0%, Rubrik 11.9%. What the reports now show is that they are not selling the same thing. Zscaler sells no appliance: its core products, Zscaler Internet Access and Zscaler Private Access, are a cloud proxy sold per user per year, so its earnings base is licensed seats multiplied by modules per seat. Rubrik sells data security and cyber recovery, charging for the volume of data under management and the ability to restore it. One meter is tied to white-collar headcount; the other is tied to data growth and ransomware mandates.

The seat meter slowed once the acquisition is removed

Zscaler's fiscal fourth quarter put annual recurring revenue at $3.771bn, up 25%. Excluding Red Canary, the managed-detection business it bought, ARR grew 20% and net new ARR grew 17%; Red Canary carried $141m of the total. Dollar-based net retention held at 115% through every quarter of fiscal 2026 — the modules-per-seat expansion did not widen. Customers spending more than $1m a year reached 785, up 18%, and the contracted book, remaining performance obligation of about $7.4bn, grew about 27%, only modestly ahead of reported revenue. Guidance for fiscal 2027 ARR of $4.396bn–$4.426bn is 16.6% to 17.4% growth.

The fear that buying a services business would dilute the model did not materialize: non-GAAP gross margin rose 90 basis points to 80.2% and non-GAAP operating margin hit a record 24.3%. Zscaler has still never reported a GAAP operating profit, losing $133.3m at that line in fiscal 2026. Alongside the guide it announced a restructuring of about 3% of staff at a charge of $30m–$33m, moving the money to specialist sellers and smaller-enterprise coverage. "It's essentially rebalancing, reallocation of some of our resources with better leverage and also better investments in the AI era we are looking at," chairman and chief executive Jay Chaudhry said on the 3 September call. The non-seat surfaces are real but small: bookings for Security for AI rose more than 50% sequentially, and the Z-Flex consumption contract produced more than $1.7bn of total contract value in fiscal 2026.

The data meter accelerated, and the stock fell anyway

Rubrik's July-quarter report showed revenue of $427.3m, up 37.9%, subscription ARR of $1.66bn, up 33%, net new subscription ARR up 35% and net revenue retention above 119%. Guidance went up across the board, to $1.88bn–$1.885bn of subscription ARR and $323m–$333m of free cash flow. "This is our 10th consecutive quarter of outperformance as a public company. And this quarter, we accelerated—yes, let me repeat, accelerated net new subscription ARR growth," chief executive Bipul Sinha told investors on 27 August. The suspicion that the growth is old perpetual-license customers being converted does not hold: cloud ARR is 89% of the mix and grew 39%, and the legacy pool is growing again on sovereign-cloud and regulated-industry demand.

The cautions are elsewhere. Gross margin slipped to 78.4% from 79.5% on falling material-rights revenue, which dropped from $8.5m to $4.7m sequentially. GAAP operating margin is -16.8% and the quarter carried a $61.8m net loss, so positive free cash flow rests on stock-compensation add-backs and deferred-revenue build; consensus sees no positive GAAP net income year before fiscal 2028. Shares fell 11.8% the day after the raise.

Where the budget is actually going

The rest of the group argues that consolidation, not seat count, is the buying unit. CrowdStrike posted record net new ARR of $333m, up 51%, with its FalconFlex bundle at $2.29bn of ARR, up 101%. Okta grew revenue 10.6% while operating income rose 161% — a seat business converting to profit rather than growth. Palo Alto's next-generation security ARR reached $9.10bn, up 63%, but its own fiscal 2027 guide implies 22–23% once CyberArk and Chronosphere sit on both sides. Fortinet, the profitable outlier at 33.7% GAAP operating margin, told investors on 29 July it displaced a cloud-only rival in a seven-figure pharmaceutical deal covering more than 45,000 users; Cloudflare, growing fastest at 35.9%, pitches an agent-first approach against what it calls legacy human-seat models. Both are aiming at the socket Zscaler bills per user.

The verdict

Zscaler's de-rating is earned: adjusted for CrowdStrike's four-for-one July split, Zscaler is the only one of the seven down over twelve months, by 36.7%, and the 17% guide explains why. It is also now the cheapest of the group at 35.0x forward earnings and 9.11x forward gross profit, and its trailing price against gross profit, 10.66x, is only about a tenth above the 9.42x of early May. The market has priced deceleration; what it has not priced is any evidence the non-seat surfaces break the headcount link. Rubrik is the mirror: the meter accelerated, but the same measure has gone from 10.48x in early May to 15.59x now, faster than its 36% gross-profit growth, and a beat-and-raise met with an 11.8% fall is what a multiple running ahead of a business looks like. Yields jumping after the 4 September jobs surprise explains the group-wide giveback since 31 August; it explains nothing about the gap between the two disclosure sets.

Both companies now have a number they must beat in public. Zscaler's is 115% net retention, unchanged for four quarters and the single figure that would show seats and modules expanding again.

Valvoline's 8% Same-Store Gain Is Mostly Price It Did Not Choose to Take

Hypothesis Opus 5 · Research Opus 5 · Writing Opus 5 · Prompt v1.6

Valvoline raised its full-year same-store sales guidance in August and the shares fell anyway. The composition explains why: three-quarters of the June-quarter's 8.0% comp was average ticket, and most of that ticket is a base oil cost pass-through forced by the closure of the Strait of Hormuz, which cut Gulf Group III exports by more than 70% between March and May.

Revenue grew 24.1%, but only about two of those twenty-four points came from more cars through the bay. The rest is bays added — 47 net new stores to 2,456, plus the $593m Breeze Autocare deal — and price per car. Gross profit grew 21.0% and operating income 18.5%, both slower than sales.

The forward earnings multiple has compressed to 18.2x from roughly 22.9x at the June high. Some of that cheapening is earned: the comp is running on a cost the company will lose when lubricant prices normalize.

VVVDRVNQuick-Lube RetailBase Oil SupplyStrait Of HormuzCost Pass-Through PricingFranchise Unit GrowthDebt-Funded Acquisitions
TickerCompanySegmentTrend · 13mo30D1Y
The subject · what this brief is about
VVVValvolineAutomotive Lubricants & Services🌱 Emerging Bull−9.4%−19.9%
Compared against · context, not the story
DRVNDriven BrandsAutomotive Services🔴 Cont. Bear+1.7%−28.3%

12-month price & trend

VVV
Valvoline
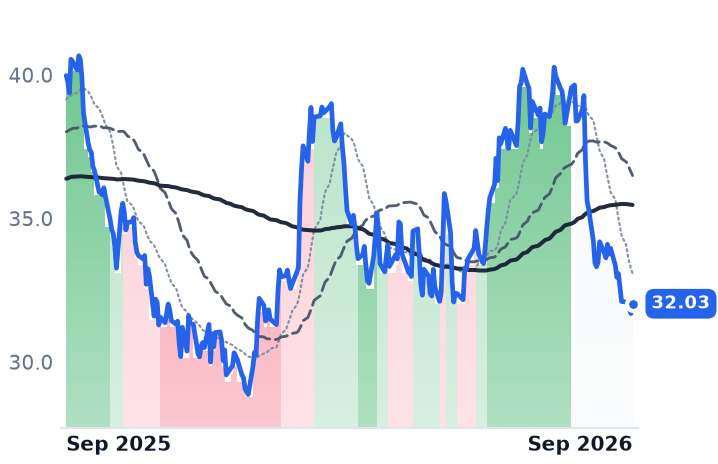
32.03
+0.34 (+1.07%)
vs. prior close
Price20d50d150d
VVV 12-month price
Automotive Lubricants & Services
DRVN
Driven Brands
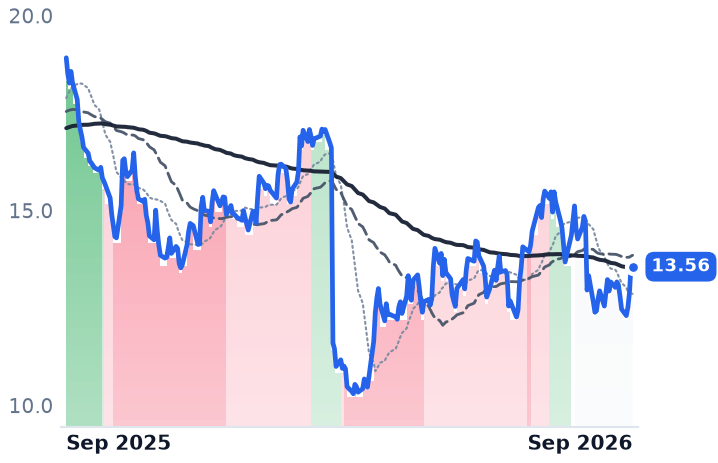
13.56
−0.02 (−0.15%)
vs. prior close
Price20d50d150d
DRVN 12-month price
Automotive Services
TickerMkt capP/EP/E fwdP/SP/S fwdP/GPP/GP fwdEV/EBITDAFCF yld
VVV$4.1B43.3x18.2x2.1x2.0x5.4x5.1x11.2x3.3%
DRVN$2.2B12.8x11.3x1.3x1.1x2.5x2.2x11.0x5.9%

Consensus projections

TickerFY2026EFY2027EFY2028E
VVVRevenue+21.6%+11.5%+9.8%
EPS+8.9%+13.1%+24.1%
DRVNRevenue+5.8%+8.9%+8.8%
EPS+1.1%+20.9%+11.5%

Forward fiscal years only. Blank means no analyst coverage for that year.

Valvoline, which runs and franchises 2,456 Valvoline Instant Oil Change quick-lube bays across North America, raised its full-year same-store sales guidance on August 5 and watched its shares fall 5.4% that session and 18.5% over the month that followed. The problem was never the size of the comparable-store number. It was what the number is made of.

Of the 8.0% system-wide same-store sales growth in the quarter ended June 30, management attributed three-quarters to average ticket and one quarter to transactions — roughly six points of price and mix against two points of additional cars through the bay. A quarter earlier the transaction share was about a third. The direction of that split matters more than the headline comp, because the ticket half is now largely a cost the company is passing on rather than demand it is winning.

A blocked strait, priced per oil change

Group III base oil is the key ingredient in full-synthetic motor oil, and the Gulf is the marginal supplier. With the Strait of Hormuz effectively shut since the outbreak of the Iran war in late February, Middle Eastern Group III exports fell more than 70% between March and May, with Shell's Pearl gas-to-liquids plant in Qatar, ADNOC and Bahrain's BAPCO — together 44% of US Group III imports — declaring force majeure or unable to ship.

"Based on the current forecast, we expect finished lubricant costs could be approximately 60% above where they were in March," chief executive Lori Flees told investors on the August 5 call. "That means we expect a total increase of approximately $5 to $7 per oil change depending on the lubricant type relative to the March period." On duration, she was blunt: "Our understanding in working with the supplier is 4 to 6 months at a minimum once the Strait is fully reopened."

Valvoline chose pass-through over absorption, which inflates the comp and compresses the margin at the same time. It guided the September quarter to same-store sales of 8–10% with 300 to 400 basis points of adjusted EBITDA margin compression, driven primarily by product cost. That guidance, not the beat, is what the market traded.

Growth bought with capital

Strip the comp back and the top line looks different again. Revenue rose 24.1% to $544.6m, but only about two of those twenty-four points came from transactions. The remainder is store count: 47 net new units in the quarter, and Breeze Autocare, the Oil Changers chain bought for $593m at a 10.7x EBITDA multiple, closing December 1 with 45 stores divested under an FTC order. It was financed with a $740m term loan. Leverage sits at 2.8x net debt to adjusted EBITDA, buybacks are paused, and roughly $48m separated quarterly operating income of $112.2m from $64.5m of net income. Gross profit grew 21.0% and operating income 18.5% against that 24.1% sales gain — the buildout adds revenue faster than profit.

The control in the next bay

Driven Brands, whose Take 5 Oil Change chain competes for the same trade areas, comped 3.6% in its June quarter and added 50 net units toward a stated 2,500-store runway from about 1,400 today. "There is a select few operators in North America that are taking share in the quick lube space, and Take 5 is certainly one of them," chief executive Danny Rivera said on August 4. Take 5 is taking price on the same base oil shock. Driven Brands' own 29% twelve-month decline is not a read-across: the stock lost 30.2% in a single session on February 25 when its audit committee found material errors in previously issued fiscal 2023 and 2024 statements.

What the business earns and what it doesn't

On reported momentum, the sell-off overshoots. Adjusted EBITDA rose 25% to $162.4m, system-wide store sales crossed $1bn for the first time, earnings beat consensus by 14%, and full-year comp guidance went up, not down. Valvoline's forward earnings multiple has compressed to 18.2x from roughly 22.9x at its June 26 high, and its trailing enterprise value to EBITDA of 11.24x is essentially level with Driven Brands' 11.04x — the same price for a chain comping more than twice as fast.

But part of the de-rating is earned, and it is the part the comp conceals. Six points of price that a shipping blockade handed to Valvoline will leave when the blockade does, and the underlying engine — cars per bay — is contributing two. Manufacturers of 2026 model-year vehicles typically specify oil changes every 7,500 to 10,000 miles, with oil-life monitors stretching some to 15,000, against the 3,000-mile sticker the industry still puts on windshields. Every extension takes a visit out of the base.

The strait will reopen, and lubricant costs will normalize four to six months after it does on the company's own supplier's estimate. When they do, Valvoline's comp will be worth whatever transactions and attach are worth without a war in it.

Enphase Booked $84.3m of June-Quarter Revenue for Systems Not Installed Until 2028

Hypothesis Opus 5 · Research Opus 5 · Writing Opus 5 · Prompt v1.6

Enphase's demand meter broke by statute, and the company's own disclosures now show how much of its revenue is not current demand at all. US sell-through — installations actually completed — fell 34% year on year in the June quarter, while reported revenue fell 19.6% to $291.9m, the third consecutive decline of roughly that size.

Roughly 29% of that revenue was equipment stockpiled by lease financiers for projects that will not be built for years. Reported profits went the other way, lifted by manufacturing credits and a tariff refund. The share price has followed the business down rather than ahead of it: at 7.71x trailing gross profit against 14.55x in May, with the forward multiple above the trailing one, gross profit is priced to shrink from here.

ENPHSEDGRUNBWATKRMLISTEMResidential Solar DemandMicroinverters & Power ElectronicsThird-Party Ownership LeasingClean Energy Tax CreditsSafe-Harbor Equipment StockpilingHome Battery Storage
TickerCompanySegmentTrend · 13mo30D1Y
The subject · what this brief is about
ENPHEnphase EnergyInverters & Power Electronics🔴 Cont. Bear−13.1%−6.3%
Compared against · context, not the story
SEDGSolarEdge TechnologiesInverters & Power Electronics⚠️ Emerging Bear+7.7%+2.3%
RUNSunrunResidential Solar Installers⚠️ Emerging Bear−12.8%−47.5%
BWBabcock & Wilcox EnterprisesOther⚠️ Emerging Bear−24.2%+228.7%
ATKRAtkoreElectrical Infrastructure Products🌱 Emerging Bull+0.1%+61.8%
MLIMueller IndustriesCopper & Brass Products⚠️ Emerging Bear−7.4%−34.1%
STEMStemRenewable Utilities⚠️ Emerging Bear−5.3%−58.7%

12-month price & trend

ENPH
Enphase Energy
36.37
+0.06 (+0.17%)
vs. prior close
Price20d50d150d
ENPH 12-month price
Inverters & Power Electronics
SEDG
SolarEdge Technologies
34.20
+0.86 (+2.58%)
vs. prior close
Price20d50d150d
SEDG 12-month price
Inverters & Power Electronics
RUN
Sunrun
8.89
−0.04 (−0.45%)
vs. prior close
Price20d50d150d
RUN 12-month price
Residential Solar Installers
TickerMkt capP/EP/E fwdP/SP/S fwdP/GPP/GP fwdEV/EBITDAFCF yld
ENPH$4.8B35.7x18.2x3.6x4.0x7.7x8.6x27.5x3.2%
SEDG$2.0Bn/m1.5x1.5x6.8x6.8xn/m4.5%
RUN$2.1B5.2x7.0x0.6x0.7x1.8x2.0x23.4x-64.2%
BW
Babcock & Wilcox Enterprises
7.10
−0.03 (−0.42%)
vs. prior close
Price20d50d150d
BW 12-month price
Other
ATKR
Atkore
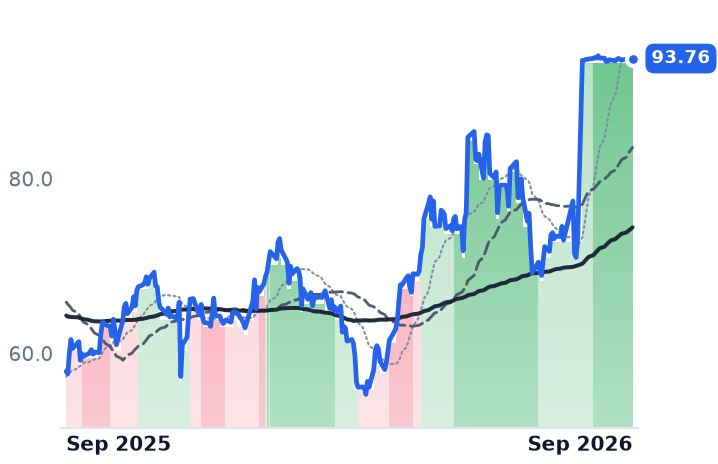
93.76
+0.11 (+0.12%)
vs. prior close
Price20d50d150d
ATKR 12-month price
Electrical Infrastructure Products
MLI
Mueller Industries
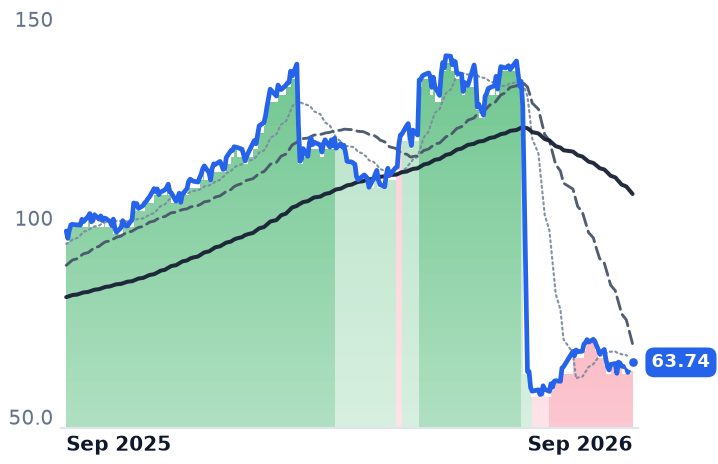
63.74
+0.78 (+1.24%)
vs. prior close
Price20d50d150d
MLI 12-month price
Copper & Brass Products
TickerMkt capP/EP/E fwdP/SP/S fwdP/GPP/GP fwdEV/EBITDAFCF yld
BW$1.1Bn/m49.2x1.3x1.0x6.3x5.1xn/m-5.5%
ATKR$3.2Bn/m16.5x1.1x1.1x5.5x5.4xn/m1.8%
MLI$14.1B16.3x15.3x3.0x2.8x11.1x10.2x10.6x2.7%
STEM
Stem
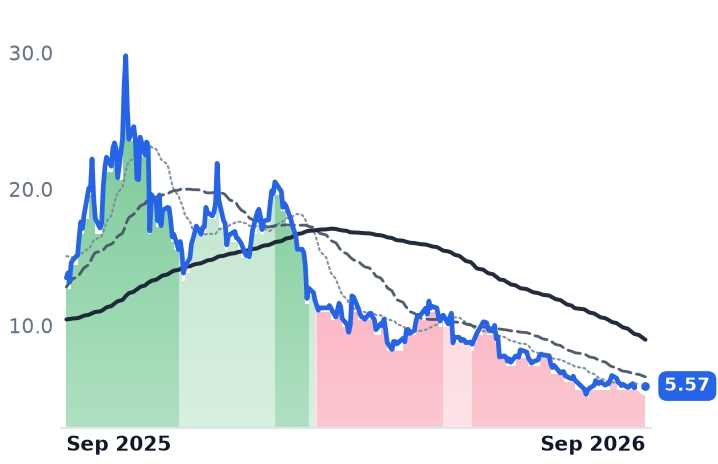
5.57
+0.06 (+1.09%)
vs. prior close
Price20d50d150d
STEM 12-month price
Renewable Utilities
TickerMkt capP/EP/E fwdP/SP/S fwdP/GPP/GP fwdEV/EBITDAFCF yld
STEM$49.4Mn/m0.3x0.3x0.9x0.9xn/m11.8%

Consensus projections

TickerFY2026EFY2027EFY2028E
ENPHRevenue−19.1%+6.2%+10.8%
EPS−28.8%+11.5%+16.5%
SEDGRevenue+12.0%+11.1%+11.4%
EPS−86.2%−370.0%+91.7%
RUNRevenue+29.7%+3.5%+12.9%
EPS−8.2%−65.9%−38.3%
BWRevenue+68.2%+22.2%+25.9%
EPS−139.6%+194.3%+53.9%
ATKRRevenue+5.0%+4.7%+6.6%
EPS−13.4%+11.5%+13.6%
MLIRevenue+21.1%+7.7%+8.8%
EPS+16.5%+6.0%+11.4%
STEMRevenue+0.1%+17.5%+22.8%
EPS+31.7%−13.6%−43.0%

Forward fiscal years only. Blank means no analyst coverage for that year.

Enphase's American customer disappeared by statute at the end of last year, and the June quarter is the first clean look at what replaced him. US sell-through fell 34% year on year, while $84.3m of the $291.9m the company reported — roughly 29% — was equipment stockpiled by third-party owners for systems that will not go on roofs until 2028 or later.

The buyer is no longer a homeowner choosing a premium inverter; it is an installer or a lease financier running a procurement desk. Wood Mackenzie has Tesla at 33.4% of the US residential inverter market in the fourth quarter of 2025, ahead of both Enphase and SolarEdge, after gaining 16.5 points in a year. Who picks the hardware has changed, and so has how much that pick is worth.

Enphase Energy makes semiconductor-based microinverters that convert sunlight to household current one solar module at a time, plus batteries and monitoring software, and it sells none of it to homeowners. It sells to distributors and installers. For a decade that distinction barely mattered, because the person choosing the equipment and the person paying for it were the same household — one claiming the Section 25D federal credit against a system it owned. That credit died on 31 December 2025 under the One Big Beautiful Bill Act, while the commercial 48E credit survived for leases and power-purchase agreements. Federal value now flows only to systems somebody else owns.

Reported revenue of $291.9m was down 19.6%, the third consecutive decline of that order after drops of 10.3% and 20.6% in the two quarters before. Consensus has full-year 2026 revenue at $1.187bn, a 19.1% fall, with earnings per share down 28.8% to $2.00.

What is actually in the revenue line

A large share of what Enphase did book is not this year's demand. The $84.3m of safe-harbor revenue is equipment bought now by third-party owners to lock in tax treatment for projects installed years later. Enphase has executed roughly $1.1bn of such agreements, $878.6m of it under the physical work test, with revenue recognition beginning in 2028. Third-quarter guidance of $290–320m again includes $75m of it. Strip safe harbor out and the core business shrank sequentially.
The manufacturing subsidy, already visible in the margin line, is not the near-term problem. Under current law the 45X advanced manufacturing credit pays in full on inverters sold before 2030, stepping down only across 2030 to 2032. Enphase generated $85.2m of it in the first half, on $574.8m of revenue, which is why gross margin reached 60.0% and operating income rose 39.2% in a quarter when the top line fell by a fifth. The credit is real cash — the company sold $235m of its 2025 credits for 93 cents on the dollar — but it is not demand.

The procurement desk picks the inverter

When the lessor owns the system, the lessor specifies the hardware, and per-module architecture has to survive a bid comparison. Wood Mackenzie's 2025 review found the US residential inverter market converged to a three-way split — Enphase 31.7%, SolarEdge 31.3%, Tesla Energy 29.6% — ending a duopoly that had held more than 80% since 2019. Enphase's answer is Propel, a lease platform bundling its equipment with third-party financing and distribution, running about 200 originations a week at a 75% battery attach rate across six states and some 290 installers — promising, and small against a market Wood Mackenzie and the Solar Energy Industries Association expect to contract 21% this year.

Europe is carrying the offset. Enphase's European revenue rose 35% sequentially, with Dutch battery activations roughly doubling ahead of the end of net metering on 1 January 2027. But SolarEdge, the Israeli maker of DC-optimized inverter systems, posted European revenue up 36% sequentially on the same mechanism and grew group revenue 19.6% to $346.2m — more than Enphase sold. Both named the same US bottleneck: tax-equity funding stalled pending Treasury guidance on foreign-entity rules, expected in the first half of 2027.

The verdict

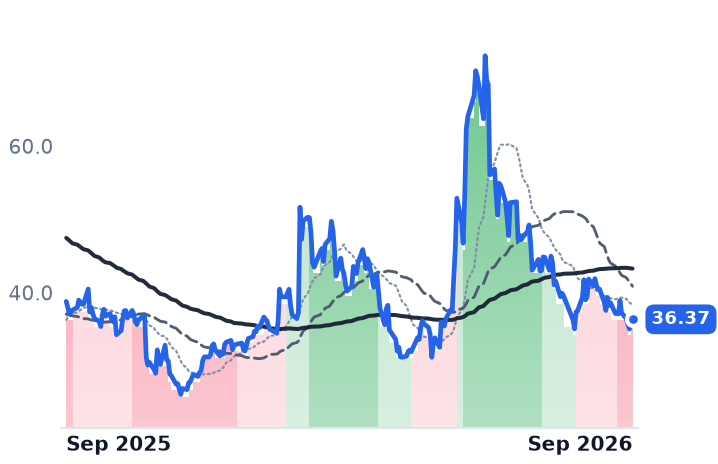
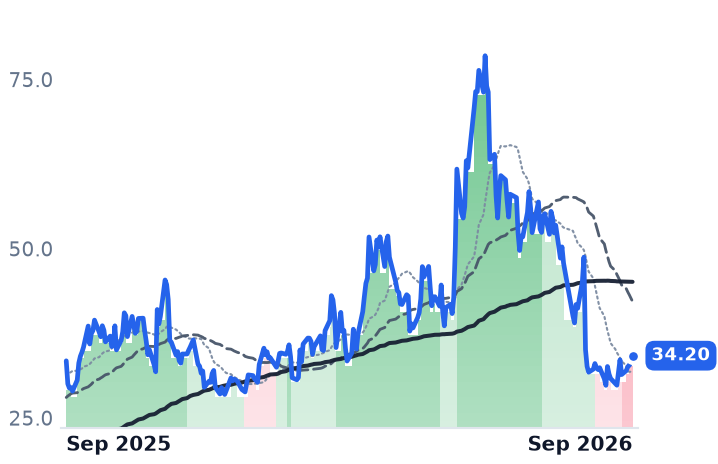
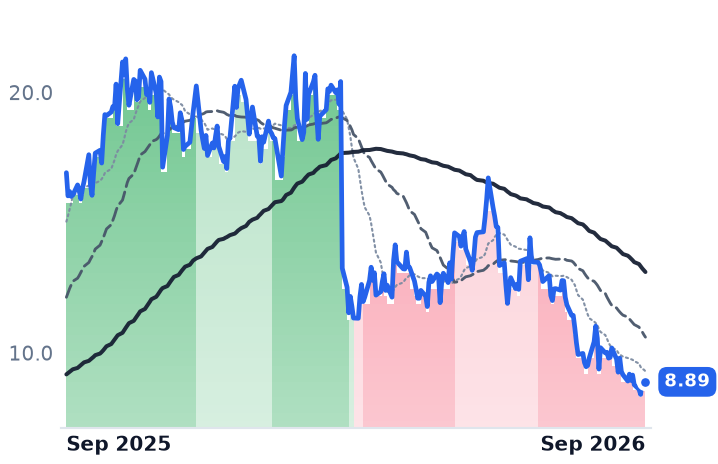
The decline in the shares — 35% over three months, to $36.37 — is earned by the business rather than running ahead of it. Enphase trades at 7.71x trailing gross profit against 14.55x in May, and its 8.63x forward multiple sits above the trailing figure, meaning gross profit is priced to shrink. SolarEdge fetches 6.82x forward gross profit while growing revenue, and Sunrun, the installer-lessor that now decides what goes on the roof, fetches 1.97x; Enphase's multiple is the highest of the three on either measure. It is also the one still holding shipments below sell-through, with microinverter channel inventory slightly elevated.
What the quarter does not settle is whether Enphase keeps a third of a shrinking market or a quarter of it. Its two named growth engines — the $878.6m safe-harbor book and a solid-state transformer aimed at data centers, with pilots in 2027 — both begin recognizing revenue in 2028. Between now and then it sells inverters to buyers who compare prices for a living.
Pharma Kept Paying for Trials and Cut Simulation Software: IQVIA Booked a Record $3.15bn

Hypothesis Opus 5 · Research Opus 5 · Writing Opus 5 · Prompt v1.6

Life-sciences software rallied hard over the past month, but the drug industry's spending is not recovering as a whole — it is being reallocated, and the four listed vendors sit on opposite sides of the line.

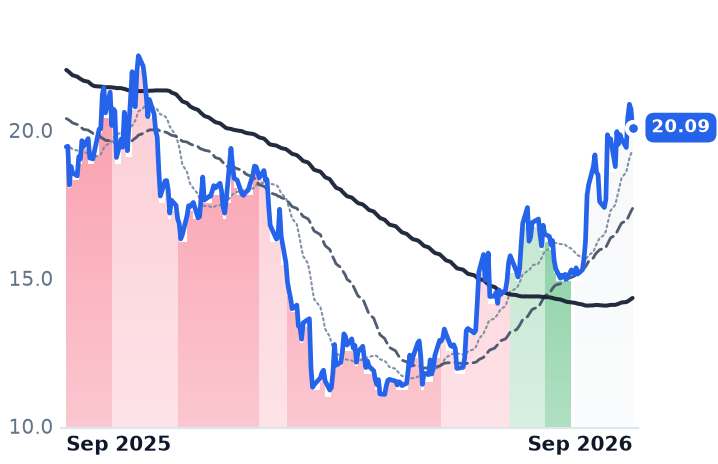
IQVIA, which runs clinical trials for drug makers, booked a record $3.15bn of net new business in the June quarter at a 1.22x book-to-bill and raised its full-year guidance. Certara, which sells biosimulation software into the same customers, saw revenue fall 10.8% and now guides consensus to a 9.1% revenue decline for 2026. Schrödinger's recurring software line shrank 10% to $32.5m; a single $10m milestone carried its quarter.

Only Veeva grew, at 17.6%, its fourth straight acceleration. But its trailing earnings multiple went from roughly 31x in May to 44x, and its own raised guide implies second-half growth near 14%. The re-rating has outrun the reallocation.

VEEVSDGRCERTIQVClinical Trial OutsourcingBiosimulation SoftwareLife-Sciences Vertical SaaSPharma R&D BudgetsPatent Cliff PressureRegulatory Submission Systems
TickerCompanySegmentTrend · 13mo30D1Y
The subject · what this brief is about
VEEVVeeva SystemsLife Sciences Software & Data🌱 Emerging Bull+19.4%−2.7%
SDGRSchrödingerLife Sciences Software & Data🌱 Emerging Bull+10.6%+3.3%
Compared against · context, not the story
CERTCertaraLife Sciences Software & Data🌱 Emerging Bull−3.2%−25.8%
IQVIQVIAContract Research & Development⚠️ Emerging Bear+12.2%+42.7%

12-month price & trend

VEEV
Veeva Systems
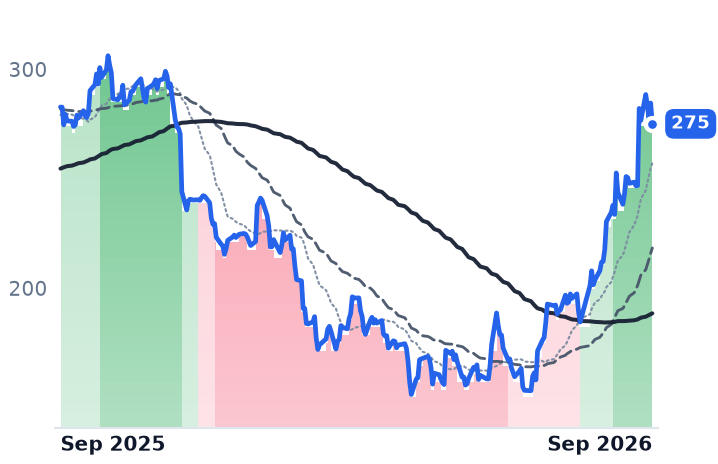
275
−9.49 (−3.34%)
vs. prior close
Price20d50d150d
VEEV 12-month price
Life Sciences Software & Data
SDGR
Schrödinger
20.09
−0.62 (−2.99%)
vs. prior close
Price20d50d150d
SDGR 12-month price
Life Sciences Software & Data
CERT
Certara
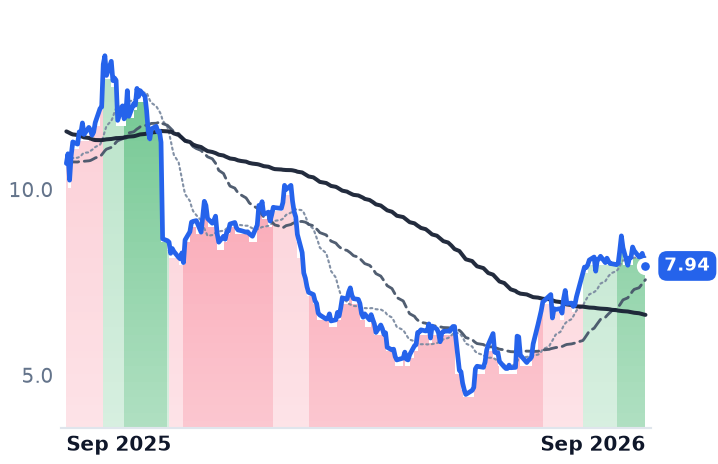
7.94
−0.19 (−2.34%)
vs. prior close
Price20d50d150d
CERT 12-month price
Life Sciences Software & Data
TickerMkt capP/EP/E fwdP/SP/S fwdP/GPP/GP fwdEV/EBITDAFCF yld
VEEV$44.7B44.3x29.8x12.9x12.1x17.3x16.2x31.3x3.7%
SDGR$1.5Bn/m5.8x6.2x10.2x10.9xn/m-2.2%
CERT$1.2Bn/m23.2x3.0x3.2x5.2x5.6x16.1x5.0%
IQV
IQVIA
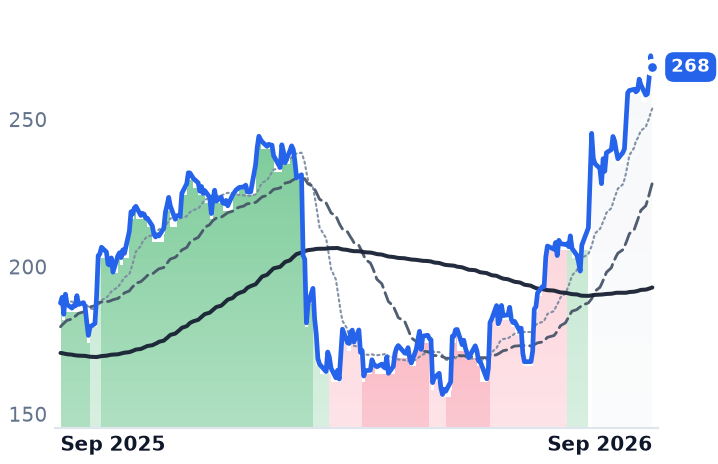
268
−3.85 (−1.42%)
vs. prior close
Price20d50d150d
IQV 12-month price
Contract Research & Development
TickerMkt capP/EP/E fwdP/SP/S fwdP/GPP/GP fwdEV/EBITDAFCF yld
IQV$43.0B32.2x20.2x2.5x2.5x9.7x9.4x16.3x6.1%

Consensus projections

TickerFY2026EFY2027EFY2028E
VEEVRevenue+16.3%+16.4%+12.2%
EPS+23.1%+16.2%+11.0%
SDGRRevenue−3.8%+3.1%+11.9%
EPS−18.2%−11.6%−36.1%
CERTRevenue−9.1%+2.5%+6.0%
EPS−25.4%+14.3%+12.0%
IQVRevenue+7.6%+5.8%+5.9%
EPS+9.0%+11.2%+12.0%

Forward fiscal years only. Blank means no analyst coverage for that year.

Certara's June-quarter revenue fell to $93.3m. In the same three months, IQVIA signed a record $3.15bn of net new business. They sell to the same customers — the world's drug developers — and they are pointing in opposite directions.

That split is the story underneath a sharp month in life-sciences software, and it matters beyond the quarter because it identifies where the pharmaceutical research dollar is actually going. The industry is staring at a patent cliff that, on one industry tally, puts more than $230bn of US drug revenue at risk between 2025 and 2030. Pfizer, Bristol Myers Squibb and Merck all cut research expense in 2025; Eli Lilly and Novo Nordisk, carried by obesity drugs, raised theirs. Budgets are not moving in one direction. They are moving toward late-stage trials and regulated record-keeping, and away from the software that simulates molecules before anyone doses a patient.

The side that is getting paid

IQVIA, a contract research organization that runs trials and sells prescription data, grew second-quarter revenue 8.7% to $4.368bn, with research-solutions revenue up 8.8% and full-year guidance raised to a range of $17.275bn to $17.475bn, according to its earnings call. Bookings grew 19%, and at 1.22x book-to-bill the forward book is filling faster than revenue is recognized.

Certara, which sells biosimulation software and regulatory-submission services across the development lifecycle, is the mirror image. Revenue fell 10.8% year on year and operating margin swung to -0.2% from a positive 9.1%. The company missed consensus and lost about 16% in premarket trading on August 4, with software revenue up 4% to $48.8m and services down 3%. What improvement exists is cost-side: a May reduction of roughly 5% of headcount targeting $13m of run-rate savings, a completed $100m buyback and a fresh $50m authorization. Consensus now has 2026 revenue falling 9.1% to $380.1m. The shares trade at 23.2x forward earnings on that shrinking base, against 1.27x book value and a 5.0% trailing free-cash-flow yield.

Schrödinger, whose physics-based chemistry software is sold to discovery teams, sits on Certara's side of the line despite a rising share price. Its recurring software revenue fell 10% to $32.5m; total revenue rose 7.5% only because drug-discovery revenue jumped to $23.0m from $13.9m on a $10m milestone triggered when Eli Lilly bought Ajax Therapeutics, a company Schrödinger helped found. The operating loss was $41.5m, and the $6.0m of net income arrived entirely below that line. Hosted licensing reached 47% of software revenue from 31%, pushing software gross margin to 71% from 76%. Cash and securities stand at $419m. "We're very pleased with our momentum across the business in the second quarter," chief executive Ramy Farid told investors on the second-quarter call, citing annual contract value growth of 27% — though full-year contract-value guidance of $218m to $228m implies only 10-15%.

The one that grew

Veeva Systems sells Vault clinical-trial, regulatory-submission, quality and safety systems, plus sales-representative software, exclusively to drug and device makers. Second-quarter revenue rose 17.6% to $928.0m, a fourth consecutive quarterly acceleration, with operating income up 40.4%. Some of that acceleration is bought: subscription revenue grew 16% while professional services grew 24%, and gross margin eased to 75.0%. Commercial subscriptions, the sales-representative franchise, grew about 13% — the slower half. Management raised full-year guidance to $3.682bn-3.687bn on August 26, which implies roughly 13.7% growth in the second half.

Biogen and Regeneron committed in the quarter, taking Veeva to 12 of the top 20 biopharmas signed for Vault CRM. On rivals who chose Salesforce instead, chief executive Peter Gassner told the August 26 call: "Yes, there's a handful of customers, large customers that did select Salesforce, many of them even 2 years ago. Those projects are -- they're having troubles, right?"

What the re-rating earned

The month's gain in this corner is two dated events, not a trend: Veeva added 14.3% in the session after its August 26 release, Schrödinger 9.6% on August 6 after its print and a Bristol Myers Squibb agreement to deploy its Bunsen AI co-scientist across its research organization. Certara, the obvious third beneficiary of any discovery-budget recovery, sat it out and fell 2.1%.

Veeva earns part of its move on growth and operating leverage. It does not obviously earn the multiple: trailing earnings have gone from roughly 31x in May to 44x, while consensus for the January 2028 year has revenue growth of 12.2% and earnings growth of 11.0%. Sixteen analysts carry a median six-month target of $232.50, 16% below the September 4 close. Schrödinger's arithmetic is starker: forward price-to-sales of 6.18x sits above trailing 5.80x, because 2026 revenue is expected to decline 3.8%. A multiple expanding into a shrinking base is not a demand recovery.

One frame worth retiring is Veeva as insurgent against IQVIA's data franchise. The two settled an eight-year antitrust fight in August 2025 with no damages either way, and IQVIA data now flows into Veeva Network and Veeva AI. Veeva's own executives called the partnership "the best thing that happened 12 months ago." IQVIA's shares are up 45.5% over twelve months; Veeva's, 1.9%.

Bristol Myers Squibb signed for Bunsen in August. It also cut its research spending last year. Whether that signature is new money or reallocated money is the question the next two prints have to answer.

Upstart's August Loan Volume Rose 57% With Its Default Index Stuck at 1.50

Hypothesis Opus 5 · Research Opus 5 · Writing Opus 5 · Prompt v1.6

Upstart placed $1.34bn of loans in August, its fastest year-over-year growth of 2026, and the shares still sit 58% below where they traded a year ago. The company keeps almost none of that paper — loans on its own balance sheet were $1.06bn at the end of June, 5.9% of outstandings — so the monthly volume figure is a direct readout on what banks and institutional buyers are willing to fund.

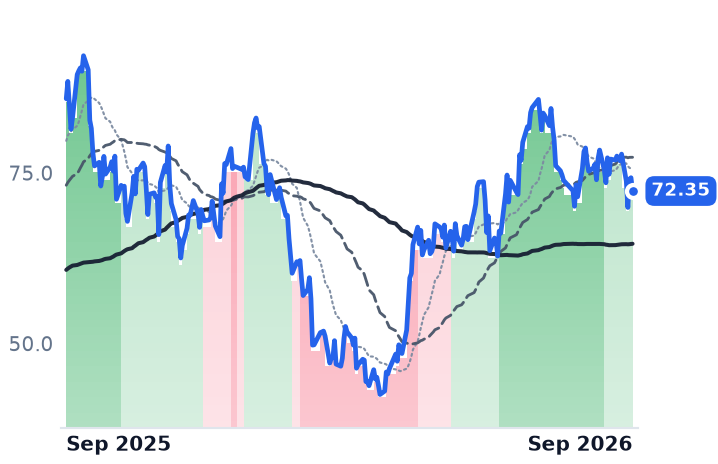
The credit line beneath it did not improve. Upstart's Macro Index held at 1.50 for a second reading, meaning defaults are running roughly half again above a normal-economy baseline. Affirm shows the mirror image: funding costs down 1.26 percentage points to 5.8% in fiscal 2026, revenue less transaction costs at 4.2% of volume, and $9.56bn of loans held for investment carrying the rate risk directly.

Neither disclosure explains the selling in both names last month. The long end of the Treasury curve is the likelier culprit.

UPSTAFRMSOFINUPGYSEZLOPFIENVADAVEHOODBILLSCHWPYPLAI Loan UnderwritingConsumer Credit QualityLoan Securitization FundingLong-End Rate RiskFintech Bank Charters
TickerCompanySegmentTrend · 13mo30D1Y
The subject · what this brief is about
UPSTUpstartDigital Payments & Fintech Platforms🔴 Cont. Bear−9.8%−58.9%
AFRMAffirmConsumer Fintech & Lending🌱 Emerging Bull−3.9%−15.8%
Compared against · context, not the story
SOFISoFi TechnologiesDigital Payments & Fintech Platforms⚠️ Emerging Bear−0.9%−29.8%
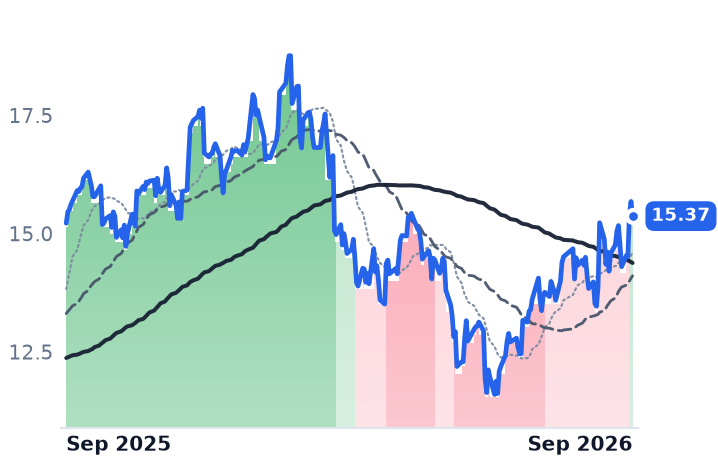
NUNuEmerging Markets & Specialized Banking⚠️ Emerging Bear+11.1%+1.0%
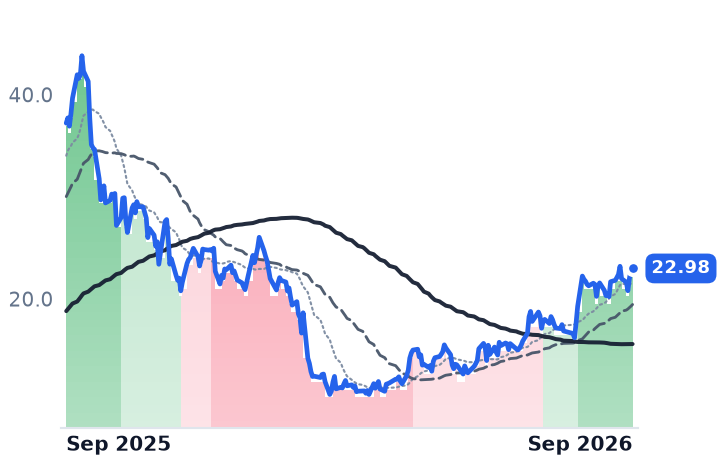
PGYPagaya TechnologiesFintech Data & AI🌱 Emerging Bull+8.0%−38.2%
SEZLSezzleDigital Payments & Fintech Platforms🌱 Emerging Bull+2.2%+37.0%
OPFIOppFiFintech & Digital Finance🔴 Cont. Bear−21.1%−29.1%
ENVAEnova InternationalOther🟢 Cont. Bull−8.7%+94.8%
DAVEDaveFintech & Digital Finance🟢 Cont. Bull+19.7%+95.0%
HOODRobinhood MarketsRetail & Digital Brokerage🟢 Cont. Bull+30.9%+4.1%
BILLBill.comFintech & Digital Finance🌱 Emerging Bull+2.4%−2.1%
SCHWThe Charles SchwabWealth Management & Advisory🟢 Cont. Bull+1.6%+18.1%
PYPLPayPalDigital Payments & Fintech Platforms🔴 Cont. Bear−7.0%−19.2%

12-month price & trend

UPST
Upstart
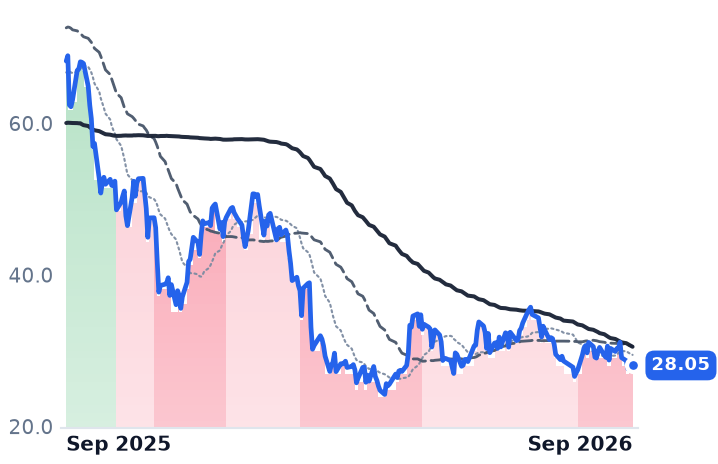
28.05
−0.47 (−1.65%)
vs. prior close
Price20d50d150d
UPST 12-month price
Digital Payments & Fintech Platforms
AFRM
Affirm
72.35
−1.95 (−2.62%)
vs. prior close
Price20d50d150d
AFRM 12-month price
Consumer Fintech & Lending
SOFI
SoFi Technologies
18.22
−0.29 (−1.57%)
vs. prior close
Price20d50d150d
SOFI 12-month price
Digital Payments & Fintech Platforms
TickerMkt capP/EP/E fwdP/SP/S fwdP/GPP/GP fwdEV/EBITDAFCF yld
UPST$2.7B45.1x40.2x2.1x1.9x2.2x2.0x48.8x-11.1%
AFRM$24.2B12.7x36.7x5.8x4.4x8.5x6.5x25.3x4.1%
SOFI$20.0B34.5x26.0x3.9x4.3x5.1x5.6x20.4x-12.6%
NU
Nu
15.37
−0.31 (−1.98%)
vs. prior close
Price20d50d150d
NU 12-month price
Emerging Markets & Specialized Banking
PGY
Pagaya Technologies
22.98
+0.09 (+0.39%)
vs. prior close
Price20d50d150d
PGY 12-month price
Fintech Data & AI
SEZL
Sezzle
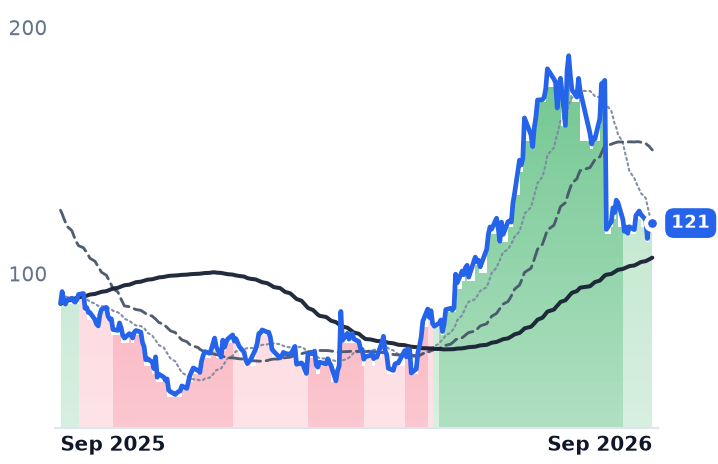
121
−2.38 (−1.94%)
vs. prior close
Price20d50d150d
SEZL 12-month price
Digital Payments & Fintech Platforms
TickerMkt capP/EP/E fwdP/SP/S fwdP/GPP/GP fwdEV/EBITDAFCF yld
NU$58.9B18.6x14.0x3.4x2.7x7.7x6.2x21.4x6.4%
PGY$1.1B12.2x9.9x0.9x0.8x2.1x1.8x9.4x20.9%
SEZL$3.3B22.5x19.4x6.9x5.6x7.8x6.3x17.3x7.2%
OPFI
OppFi
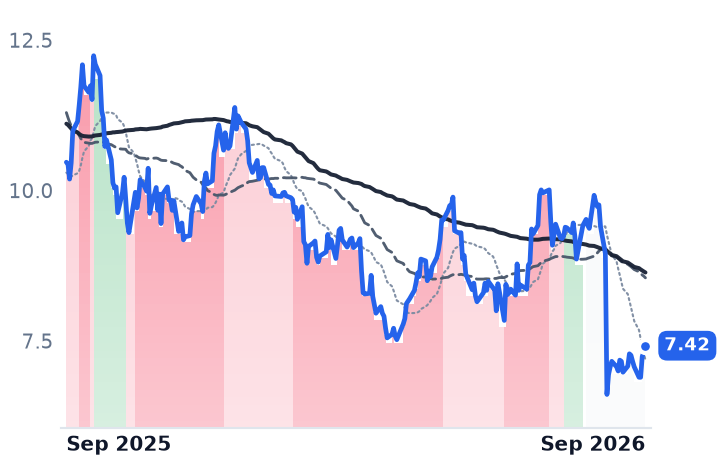
7.42
+0.10 (+1.37%)
vs. prior close
Price20d50d150d
OPFI 12-month price
Fintech & Digital Finance
ENVA
Enova International
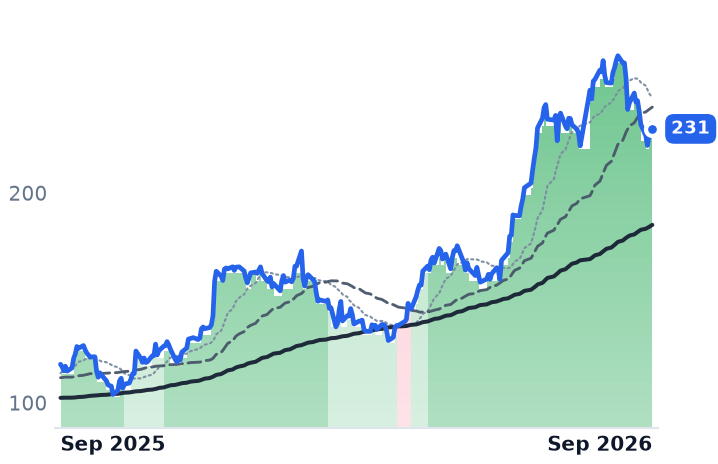
231
−2.59 (−1.11%)
vs. prior close
Price20d50d150d
ENVA 12-month price
Other
DAVE
Dave
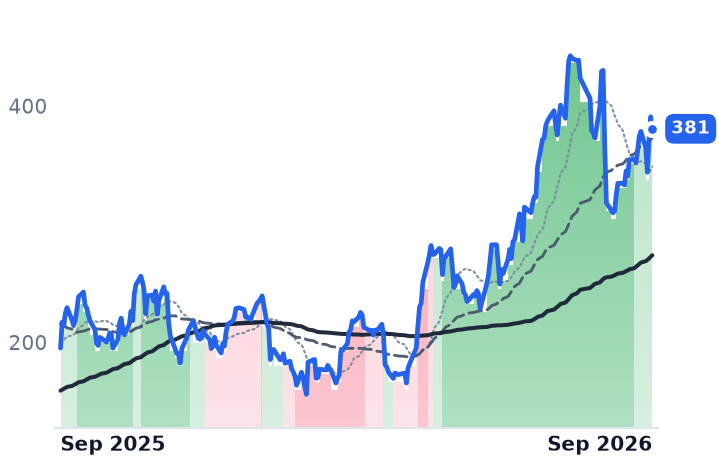
381
−10.17 (−2.60%)
vs. prior close
Price20d50d150d
DAVE 12-month price
Fintech & Digital Finance
TickerMkt capP/EP/E fwdP/SP/S fwdP/GPP/GP fwdEV/EBITDAFCF yld
OPFI$611.4M2.1x5.1x1.1x1.0x1.0x0.9x7.0x63.6%
ENVA$4.1B12.5x10.0x1.2x1.1x1.9x1.7x13.7x45.5%
DAVE$4.6B20.6x25.2x7.1x6.3x8.6x7.6x15.8x7.1%
HOOD
Robinhood Markets
122
−2.61 (−2.09%)
vs. prior close
Price20d50d150d
HOOD 12-month price
Retail & Digital Brokerage
BILL
Bill.com
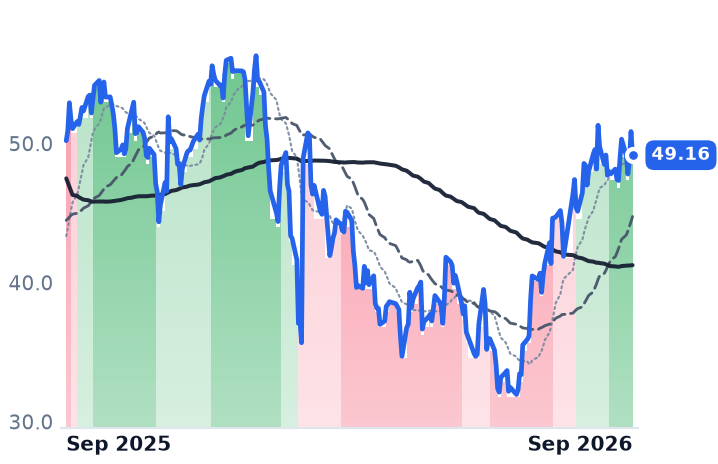
49.16
−1.70 (−3.34%)
vs. prior close
Price20d50d150d
BILL 12-month price
Fintech & Digital Finance
SCHW
The Charles Schwab
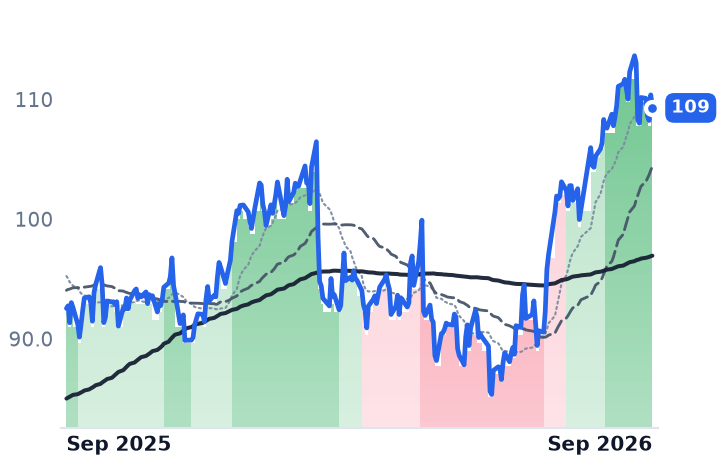
109
−1.09 (−0.99%)
vs. prior close
Price20d50d150d
SCHW 12-month price
Wealth Management & Advisory
TickerMkt capP/EP/E fwdP/SP/S fwdP/GPP/GP fwdEV/EBITDAFCF yld
HOOD$69.5B36.6x42.0x15.1x13.9x18.3x16.9x29.0x3.1%
BILL$5.0Bn/m13.4x3.0x2.7x3.8x3.5x58.7x9.6%
SCHW$158.1B16.8x15.1x5.6x5.9x6.5x6.9x10.4x6.2%
PYPL
PayPal
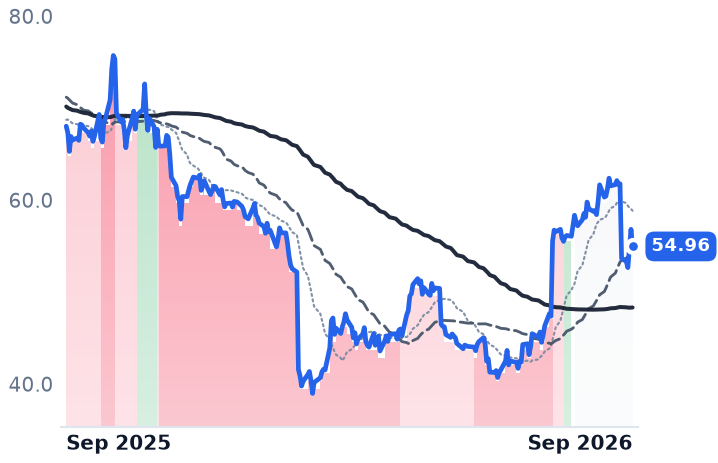
54.96
−1.86 (−3.27%)
vs. prior close
Price20d50d150d
PYPL 12-month price
Digital Payments & Fintech Platforms
TickerMkt capP/EP/E fwdP/SP/S fwdP/GPP/GP fwdEV/EBITDAFCF yld
PYPL$39.2B8.0x8.4x1.2x1.1x2.5x2.5x5.8x14.1%

Consensus projections

TickerFY2026EFY2027EFY2028E
UPSTRevenue+37.1%+30.9%+28.7%
EPS−58.2%+163.5%+60.1%
AFRMRevenue+32.0%+30.3%+24.7%
EPS+2220.4%+59.0%+45.6%
SOFIRevenue+31.3%+22.3%+23.6%
EPS+64.3%+34.3%+26.0%
NURevenue+54.4%+21.7%+14.0%
EPS+42.6%+32.7%+26.4%
PGYRevenue+11.8%+13.4%+11.9%
EPS+53.5%+38.6%+48.1%
SEZLRevenue+32.4%+27.0%
EPS+51.5%+27.4%
OPFIRevenue+2.5%+16.8%+30.3%
EPS−10.2%+35.6%+38.4%
ENVARevenue+19.9%+17.3%+25.1%
EPS+28.4%+21.5%+32.5%
DAVERevenue+32.5%+21.9%+27.1%
EPS+8.9%+46.5%+38.8%
HOODRevenue+9.9%+22.8%+15.3%
EPS−9.8%+37.0%+18.0%
BILLRevenue+13.2%+11.3%+10.5%
EPS+26.1%+41.5%+17.6%
SCHWRevenue+11.6%+10.0%+9.3%
EPS+23.5%+17.5%+15.9%
PYPLRevenue+3.2%+4.1%+4.4%
EPS−1.0%+8.6%+9.0%

Forward fiscal years only. Blank means no analyst coverage for that year.

Upstart disclosed on September 3 that it originated $1,342.1m of loans in August, up 57% year over year across 26.5 origination days. That is an acceleration on two fronts: the June quarter ran 50% growth, and July — the figure management cited on the August 4 call — ran 34%. The same release held the Upstart Macro Index at 1.50, unchanged from the August reading.

Those two numbers are the whole business in miniature. Upstart, which runs an artificial-intelligence underwriting platform for personal, auto and home loans and employs 1,405 people under co-founder and chief executive Paul Gu, is not the lender its industry label implies. It scores a borrower, hands the loan to a bank partner or an institutional buyer, and books a fee. Loans held on its own balance sheet were $1.06bn at June 30, up only 5% year over year and 5.9% of total outstandings — the lowest in about two years. Volume growth of 57% in a month when the company's own default index says losses are running about 50% above a normal-economy baseline means third-party capital is still bidding, at a price it finds acceptable.

The capital came in, the credit went sideways

Upstart has signed $10.8bn of incremental committed capacity so far this year, including three deals worth $5bn since the May call, and completed a $569m securitization it describes as its largest since 2021 and priced at the tightest spreads in three years. Its institutional capital partners have renewed at 100% since 2023. June-quarter revenue grew 42% to $377.2m on a 96.7% gross margin, with conversion rising to 19.7% from 18.5% and 91% of loans fully automated.

"We grew, our credit performed, and we expanded margins. We didn't have to trade one for another," Gu told investors on August 4. The caveat sits in the index he publishes himself: 1.50 in September against 1.50 in August and 1.49 on July 8 — flat at an elevated level, below the 2024 peak of 1.68 but above 1.0 continuously since early 2022. Separately, Upstart won conditional approval from the Office of the Comptroller of the Currency on July 23 to build a national bank, targeted for early 2027; management says it does not change the third-party funding strategy.

Affirm carries the rate risk on its own books

Affirm, the point-of-sale installment platform run by Max Levchin, bills the same consumer through a different meter and keeps the paper. Its June quarter put gross merchandise volume up 36% to $14.1bn and revenue less transaction costs up 39% to $589m, or 4.2% of volume — the take rate expanded. The engine was funding: costs fell 126 basis points to 5.8% in fiscal 2026, and chief financial officer Rob O'Hare guided fiscal 2027 take rates broadly consistent with fiscal 2026 on a similar funding mix. "Fiscal fourth quarter was our most profitable quarter ever, even without the tax allowance release," Levchin said on the August 27 call. Operating margin reached 24.3% against 6.6% a year earlier.

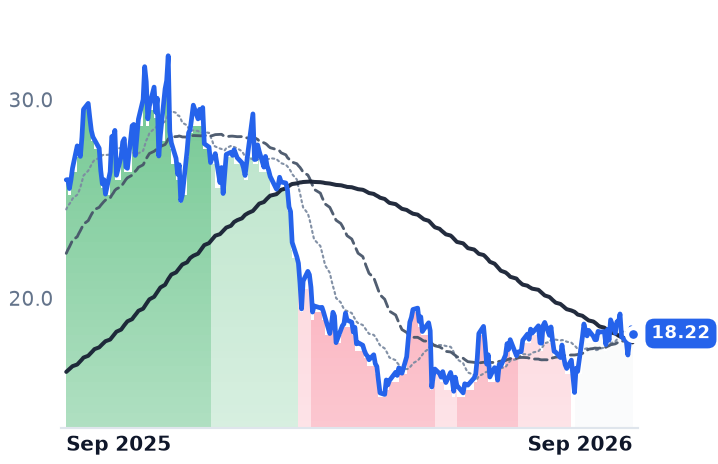
The exposure sits in the balance sheet: loans held for investment of $9.56bn against $7.03bn a year earlier, with funding debt doubled to $3.3bn. Thirty-day delinquencies on monthly installment loans were 2.5%, against 2.7% to 2.8% in the prior three quarters, with 44% of receivables non-prime. SoFi's deposit-funded personal-loan book tells the same story from the other side — net charge-offs of 3.7%, down 70 basis points sequentially excluding delinquent loan sales.

What the month's selling was actually about

Both stocks fell roughly 8% over the thirty days to September 4 — Affirm from $78.66 to $72.35, Upstart from $30.68 to $28.05 — while sell-side targets on Affirm went up and Mizuho initiated coverage with a Buy on September 3. Affirm's sharpest leg, a 10.1% slide from $77.76 on August 28 to $69.94 on September 1, began the day long-dated yields hit one-year highs and came with no company news attached.

The hypothesis that these shares are riding easing money has it backwards. The Federal Reserve has not cut in 2026, holding at 3.50–3.75% into the September 16 meeting, and the 30-year Treasury yield eased only to 5.25% on September 4 after touching 5.34% in mid-August, its highest since 2007. The Treasury will double its long-end buyback operations to at least $4bn from September 9. The funding curve moved against these companies during the drawdown, not for them.

So the verdict splits. Affirm's advance over three months is earned — gross profit stepped up faster than the share price, taking price to trailing gross profit from roughly 9.63x in mid-August to 8.50x now, with 6.49x forward against 30% consensus revenue growth for fiscal 2027. Upstart's 2.19x trailing and 1.98x forward on the same measure is about a quarter of Affirm's, on similar expected growth, and nothing in the August print justifies it; the honest offset is that at 40.2x forward earnings on consensus of $0.70 a share for this year, and a trailing free-cash-flow yield of −11.1% because loan purchases run through operating cash flow, the cheapness only exists on one lens. Affirm's trailing price-to-earnings of 12.7x is unusable — fiscal 2026 net income of $1.93bn contains a one-off deferred-tax valuation-allowance release.

The monthly disclosure is the rare piece of financial reporting that arrives before the quarter is written. Early October brings the September figure, and it will say whether the buyers who absorbed $1.34bn of Upstart paper in August still want it with the long bond above 5%.

Thor Guided to Lose Share in the North American Towable Market It Leads

Hypothesis Opus 5 · Research Opus 5 · Writing Opus 5 · Prompt v1.6

Thor Industries is the largest towable recreational-vehicle maker in North America, and its own fiscal 2026 plan assumes it ships into a mid-teens percentage decline in retail and gives up share on top of that. The June guidance cut moved earnings to $3.30-$3.80 a share from $3.75-$4.25 while leaving revenue guidance intact — the entire cut sits in margin.

The usual explanation for a shipment collapse is a bloated dealer channel working off units. It does not apply here. Dealer inventories are lean at 18 to 20 weeks of supply against a 26-to-30-week norm, floorplan borrowing rates have fallen, and retail registrations are dropping faster than wholesale shipments. The buyer left before the channel filled. Thor's towable gross margin fell 470 basis points to 10.2%; Winnebago held group gross margin roughly flat and trades at 0.71x book, the deepest discount in the complex.

THOWGOPATKLCIITowable RV DemandDealer Floorplan InventorySteel & Aluminum TariffsRV Component Suppliers
TickerCompanySegmentTrend · 13mo30D1Y
The subject · what this brief is about
THOThor IndustriesRV Manufacturers⚠️ Emerging Bear−3.3%−30.2%
WGOWinnebago IndustriesRV Manufacturers⚠️ Emerging Bear−3.5%−12.3%
Compared against · context, not the story
PATKPatrick IndustriesRV & Marine Furnishings⚠️ Emerging Bear−6.8%−26.4%
LCIILCI IndustriesRV Components & Suppliers⚠️ Emerging Bear−5.7%−0.6%

12-month price & trend

THO
Thor Industries
76.94
+1.16 (+1.53%)
vs. prior close
Price20d50d150d
THO 12-month price
RV Manufacturers
WGO
Winnebago Industries
31.03
+0.98 (+3.26%)
vs. prior close
Price20d50d150d
WGO 12-month price
RV Manufacturers
PATK
Patrick Industries
82.84
+1.25 (+1.53%)
vs. prior close
Price20d50d150d
PATK 12-month price
RV & Marine Furnishings
TickerMkt capP/EP/E fwdP/SP/S fwdP/GPP/GP fwdEV/EBITDAFCF yld
THO$4.0B15.4x17.4x0.4x0.4x3.3x3.3x7.3x5.0%
WGO$877.2M22.8x13.1x0.3x0.3x2.4x2.4x10.1x20.6%
PATK$2.7B18.2x19.4x0.7x0.7x3.0x3.0x10.0x4.7%
LCII
LCI Industries
103
+1.56 (+1.54%)
vs. prior close
Price20d50d150d
LCII 12-month price
RV Components & Suppliers
TickerMkt capP/EP/E fwdP/SP/S fwdP/GPP/GP fwdEV/EBITDAFCF yld
LCII$2.5B11.8x12.0x0.6x0.6x2.4x2.4x7.7x11.5%

Consensus projections

TickerFY2026EFY2027EFY2028E
THORevenue+0.9%+3.2%+4.3%
EPS−6.8%+25.8%+14.8%
WGORevenue−0.9%+4.5%+4.6%
EPS+21.3%+30.9%+24.5%
PATKRevenue+0.2%+5.5%+8.2%
EPS−1.5%+24.5%+26.7%
LCIIRevenue−2.0%+5.4%+1.5%
EPS+17.7%+11.7%+24.8%

Forward fiscal years only. Blank means no analyst coverage for that year.

Thor Industries, which builds conventional travel trailers, luxury fifth wheels and Class A, B and C motorhomes in North America and motorcaravans in Europe, told investors on June 3 that its plan for the year assumes North American retail demand falls by a mid-teens percentage and that it loses a low-single-digit share of the towable market it leads. It cut fiscal 2026 diluted earnings guidance to $3.30-$3.80 a share from $3.75-$4.25 and left revenue guidance at $9.0-9.5bn. The cut is entirely a margin cut.

That matters because of how an RV maker earns revenue. Thor sells nothing to a camper; it books a sale when a unit is wholesaled to an independent dealer who finances it on floorplan credit. Reported sales are therefore dealer restocking decisions, and the honest demand meter is retail registrations. When the two diverge, the usual story is a destock — dealers clearing a channel stuffed in a boom. That is not this cycle.

The channel already cleared

Dealer inventories are lean. Patrick Industries, which supplies components to the RV plants, puts dealer stock at 18 to 20 weeks of supply against a 26-to-30-week historical norm; LCI Industries independently confirms the same range and calls it healthy. The interest bill has eased too: Camping World, the largest RV retailer, reported an average floorplan rate of 5.98% for the June quarter against 6.46% a year earlier.

What has gone is the buyer. Industry wholesale shipments through July ran 13.9% below last year at 183,592 units, but new retail registrations fell 19.0% in May, the ninth consecutive monthly decline. Camping World's own count has new registrations down 16.4% for the year to May while used registrations rose 2.4% — affordability substitution, visible in one line. Retail is falling faster than wholesale, which inverts the destock: there is nothing to work off, and restocking cannot begin until registrations stop sinking.

Where the cost went

Thor's fiscal third quarter, ended April 30, produced revenue of $2.782bn, down 3.9%, on a gross margin of 12.75% against 16.66%. Operating income fell 45.2% to $96.0m. North American Towable sales dropped 24.6% to $881.8m with unit shipments down 25% and segment gross margin down 470 basis points to 10.2%. Motorized went the other way on volume — sales up 7.7% on 9.1% more units — but at a net price per unit 1.4% lower than a year earlier.

A flat sticker is the problem, because the input side did not stay flat. LCI reports steel prices up 20% year over year and aluminum up 80%, with tariffs, freight and energy behind the commodities themselves; a proclamation effective April 6 imposed a flat 50% tariff on articles made almost entirely of steel, aluminum or copper, the exact inputs in RV frames and exterior structures. "Our approach and our philosophy with pricing is not to just pass on pricing for the sake of pricing," LCI chief financial officer Lillian Etzkorn told investors on August 5. Nobody is passing it on, so it lands in gross margin.

Thor's forward book is thinning behind that. North American backlog fell 24.1% to $1.152bn, with towable orders down 39.1% to $386m. "Our North American Towable segment is facing continuing and amplified headwinds," chief executive Bob Martin said on the third-quarter results.

Europe is doing the load-bearing

The Erwin Hymer business Thor bought in 2019 is now the group's ballast: European sales rose 11.8% to $987.6m, roughly 36% of the total, pretax income rose 21.3% to $56.2m, and European dealer inventory fell 11.2%. Roughly a third of Thor's revenue is insulated from the American dealer channel — which is why the group still earns money at all.

Winnebago Industries, a fifth of Thor's size and home to Grand Design, Newmar and Barletta pontoons, is the mirror image. Revenue fell 9.9% to $698.7m in its May quarter and towable revenue fell 26.1% on a mix shift toward lower price points, yet group gross margin barely moved, at 13.58% against 13.68%. "We stayed disciplined, aligning production closely with retail," chief executive Michael Happe said on June 25, the day it cut full-year guidance. Its $1.40 annual dividend is close to all of guided reported earnings.

The verdict

Thor's 31.5% twelve-month decline is earned. Its forward multiple, 17.4x on consensus of $4.43 for fiscal 2027, sits above its 15.4x trailing multiple, because profits are falling faster than the share price — the only cheap readings are asset-based, 0.93x book and 7.3x trailing enterprise value to earnings before interest, tax, depreciation and amortization. Winnebago at 0.71x book is a genuine discount, but its 13.1x forward multiple rests on a 31% earnings rebound that the registration data does not yet support. The suppliers, meanwhile, out-earned their customers: LCI expanded adjusted operating margin 110 basis points to 9.3% on 20% lower RV volume, and it is merging with Patrick.

The shares have stopped falling — 50-day averages that sat below 200-day averages across all four names through the spring had flattened by September 1. Patrick says it can flex production up quickly if retail inflects. The optionality is intact and unarmed; nothing in nine straight months of registration declines dates when the trigger gets pulled.

Monolithic Power Samples 800-Volt Parts Now; Navitas Dates Its Rack Revenue to 2027

Hypothesis Opus 5 · Research Opus 5 · Writing Opus 5 · Prompt v1.6

Nvidia's biggest quarter yet did nothing for the chipmakers that supply power to its racks: the listed power and analog names sold off together in the week after the August 26 report, and the two most exposed to the coming high-voltage rack fell hardest.

Their businesses are not doing the same thing. Monolithic Power's enterprise data revenue reached $380.6m in the June quarter, up 164% from a year earlier, and it raised that segment's full-year growth outlook from 85% to 130%. Navitas earned no gross profit at all on $10.5m of revenue and puts its own 800-volt rack revenue in 2027.

One de-rating looks like the sector-wide valuation reset it sits inside; the other looks earned by the numbers.

MPWRNVTSVICRADITXNMCHPNVDA800VDC Rack PowerPower Management ICsGaN & SiC DevicesAI Data-Center BuildoutAnalog Chip Cycle
TickerCompanySegmentTrend · 13mo30D1Y
The subject · what this brief is about
MPWRMonolithic Power SystemsAnalog & Mixed-Signal⚠️ Emerging Bear−12.7%+42.4%
NVTSNavitas SemiconductorOther⚠️ Emerging Bear−15.0%+110.3%
Compared against · context, not the story
VICRVicorOther🟢 Cont. Bull−14.8%+272.9%
ADIAnalog DevicesAnalog & Mixed-Signal🟢 Cont. Bull−7.1%+46.5%
TXNTexas Instruments IncorporatedAnalog & Mixed-Signal🟢 Cont. Bull−9.7%+42.0%
MCHPMicrochip Technology IncorporatedAnalog & Mixed-Signal⚠️ Emerging Bear−12.4%+15.3%
NVDANVIDIAAI & Data Center GPUs🟢 Cont. Bull+2.9%+36.9%

12-month price & trend

MPWR
Monolithic Power Systems
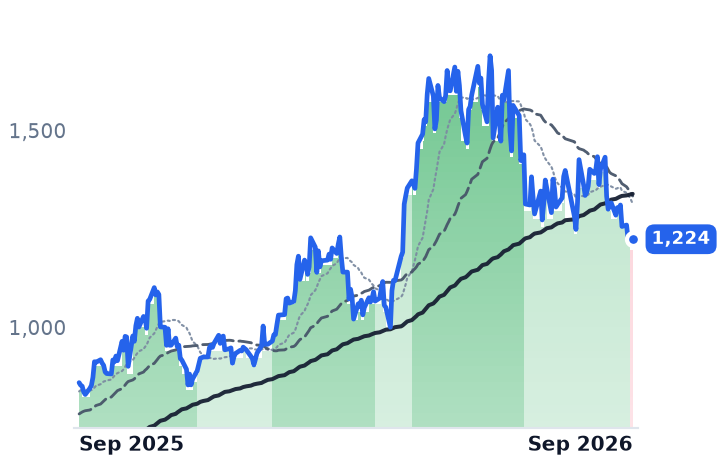
1,224
+10.21 (+0.84%)
vs. prior close
Price20d50d150d
MPWR 12-month price
Analog & Mixed-Signal
NVTS
Navitas Semiconductor
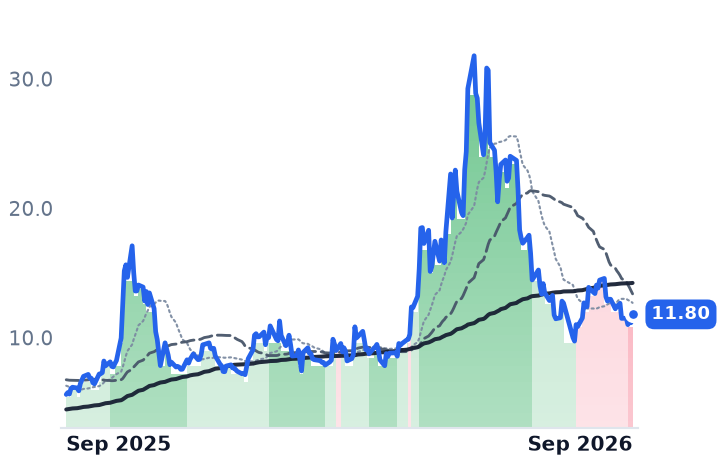
11.80
+0.65 (+5.78%)
vs. prior close
Price20d50d150d
NVTS 12-month price
Other
VICR
Vicor
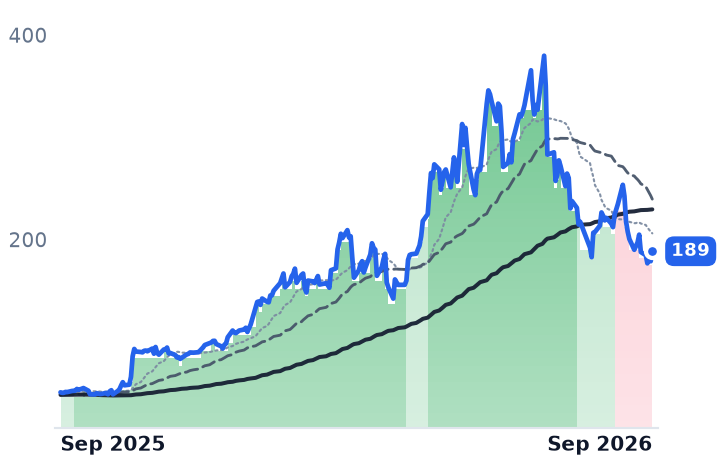
189
+9.79 (+5.48%)
vs. prior close
Price20d50d150d
VICR 12-month price
Other
TickerMkt capP/EP/E fwdP/SP/S fwdP/GPP/GP fwdEV/EBITDAFCF yld
MPWR$60.1B74.6x44.6x18.4x14.5x33.3x26.3x58.4x1.0%
NVTS$3.1Bn/m84.3x64.6xn/m-2.2%
VICR$8.9B61.8x57.4x18.9x14.8x33.3x26.2x66.6x0.6%
ADI
Analog Devices
362
+5.75 (+1.61%)
vs. prior close
Price20d50d150d
ADI 12-month price
Analog & Mixed-Signal
TXN
Texas Instruments Incorporated
258
+4.61 (+1.82%)
vs. prior close
Price20d50d150d
TXN 12-month price
Analog & Mixed-Signal
MCHP
Microchip Technology Incorporated
74.17
+1.06 (+1.45%)
vs. prior close
Price20d50d150d
MCHP 12-month price
Analog & Mixed-Signal
TickerMkt capP/EP/E fwdP/SP/S fwdP/GPP/GP fwdEV/EBITDAFCF yld
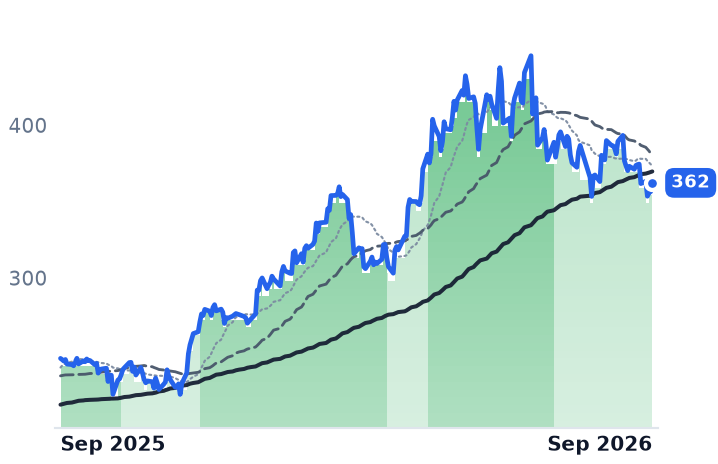
ADI$181.1B43.9x28.9x13.0x12.0x19.8x18.2x28.8x2.7%
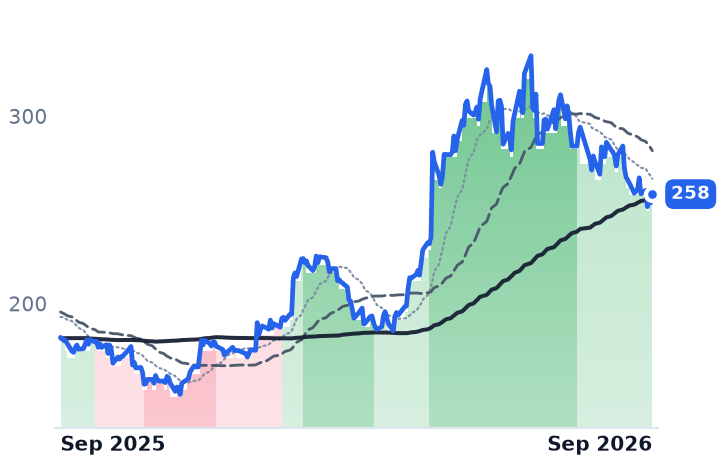
TXN$258.4B42.8x33.4x13.3x11.8x22.8x20.2x29.5x2.1%
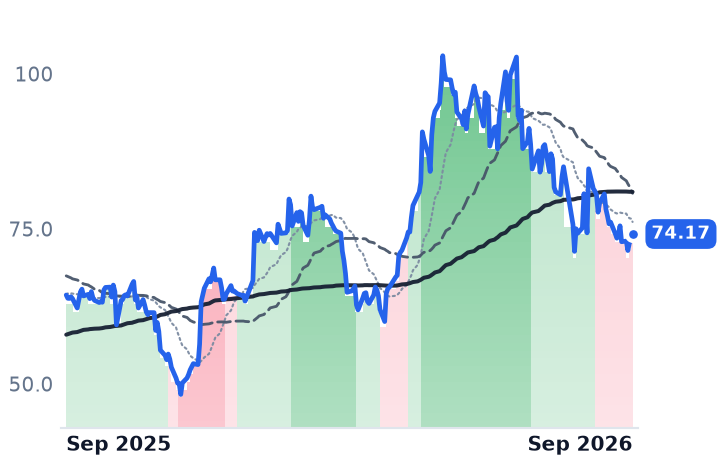
MCHP$40.2B102.6x20.3x7.8x6.3x13.0x10.4x26.9x2.8%
NVDA
NVIDIA
230
+1.91 (+0.84%)
vs. prior close
Price20d50d150d
NVDA 12-month price
AI & Data Center GPUs
TickerMkt capP/EP/E fwdP/SP/S fwdP/GPP/GP fwdEV/EBITDAFCF yld
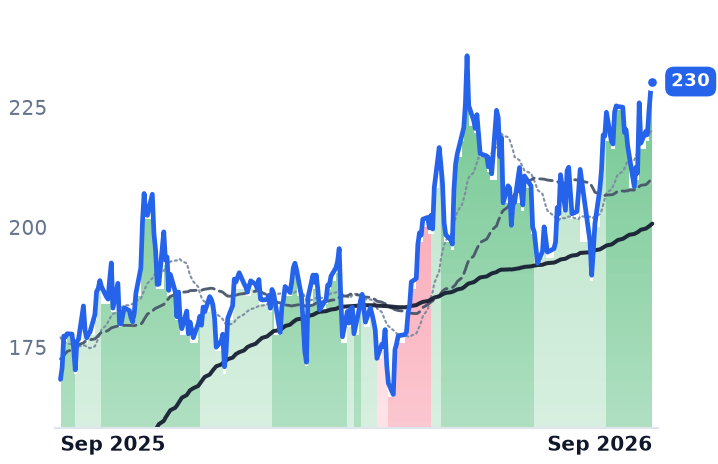
NVDA$5.5T34.3x25.0x21.5x13.9x29.0x18.7x28.3x2.2%

Consensus projections

TickerFY2026EFY2027EFY2028E
MPWRRevenue+49.2%+28.7%+20.2%
EPS+54.8%+31.0%+20.2%
NVTSRevenue+4.7%+52.5%+59.8%
EPS−21.9%−17.9%−44.8%
VICRRevenue+33.1%+55.6%+22.2%
EPS+58.9%+73.2%+33.0%
ADIRevenue+37.7%+21.9%+11.1%
EPS+65.6%+29.0%+17.0%
TXNRevenue+23.8%+14.0%+10.8%
EPS+55.0%+20.5%+18.4%
MCHPRevenue+6.2%+37.1%+16.4%
EPS+20.7%+132.2%+25.6%
NVDARevenue+65.1%+84.2%+43.2%
EPS+59.0%+91.7%+42.0%

Forward fiscal years only. Blank means no analyst coverage for that year.

Nvidia reported data-center revenue of $89bn on August 26 and guided the October quarter to $108bn, including no China sales; its shares rose 8.7%, the biggest single-day gain since April 2025. Over the following week the semiconductor companies that convert wall current into the volts those accelerators actually run on broke down. Monolithic Power's shares fell out of the uptrend they had held since mid-July on September 2 and their trend readings turned sharply negative on September 4 — the same session Microchip's did. Navitas had gone first, on September 1; Vicor on August 12.

What is being repriced is dollars of power-conversion content per rack. No one buys "a power chip" — they buy watts delivered at a specified voltage, and that specification is changing. Nvidia's 800-volt direct-current architecture strips out conversion stages but makes every remaining stage more semiconductor-hungry, and it reaches full-scale production with the Kyber rack systems in 2027. Two listed companies sit on that socket from opposite ends of the income statement.

Paid now

Monolithic Power Systems, which sells direct-current voltage-regulation chips and modules into servers, cars and industrial gear, is the incumbent. June-quarter revenue was $980.6m, up 47.6% year on year — the fourth straight quarter of acceleration, from 18.9% a year ago. Enterprise data revenue was $380.6m, up 164.3% from a year earlier and 44.8% sequentially, and the company lifted its full-year growth outlook for that business from 85% to 130%. Gross margin held at 55.2% while operating margin widened 6.2 percentage points to 31.0%.

On the July 30 call, management described channel inventory as "very low," unlike the 2024 cycle, said book-to-bill was well above 1.0, and said enterprise data has "no concentrated customers." Founder-chief executive Michael Hsing called the company the "highest-power-density company in the world" in optical-transceiver power. Its answer to the architecture change is its own: 800-volt alternating-to-direct-current parts sampling on in-house silicon carbide rather than gallium nitride, and 48-volt vertical power modules ramping at more than a couple of customers. The board added $500m to the buyback, taking it to $1bn.

Paid in 2027

Navitas Semiconductor, a 190-employee designer of gallium-nitride and silicon-carbide power devices, is the option. June-quarter revenue was $10.5m, down 27.3% year on year though up 22.5% sequentially, and it has generated roughly minus $0.6m of cumulative gross profit across four quarters on $36.5m of sales. Management reports a 39.5% gross margin on a non-GAAP basis; the reported figure is negative, and the $228.2m net loss is dominated by a $203.1m non-cash earnout remeasurement against a $9.3m adjusted loss. Chief executive Chris Allexandre said the "Navitas 2.0" transformation is substantially complete, and chief financial officer Tonya Stevens said AI infrastructure would be a third or more of revenue by year-end.

The company's own timetable puts sidecar racks in mid-2027 and gallium nitride in accelerator-level conversion from late 2027. September-quarter guidance is $13.5m. It ended June with $557.4m of cash and no debt, having raised $373m at $21.89 a share — 46% above where the stock now trades — with diluted shares up 18.5% year on year. Its first US-made Gen 5 parts from GlobalFoundries' Vermont fab, announced September 1, are a qualification milestone rather than a sale.

The reset, not the socket

The obvious reading — that the customer is reassigning the power socket — does not survive the numbers. Over thirty days Navitas fell 15.0%, Vicor 14.8%, Monolithic Power 12.7%, Microchip 12.4%, Texas Instruments 9.7% and Analog Devices 7.1%, a spread far too narrow to isolate one company's loss, while Nvidia itself rose. The Philadelphia Semiconductor Index set a record on June 22 and then fell as much as 29% on light guidance elsewhere, yields and tariff threats. Every peak on this shelf landed inside five weeks from late May to end-June. And the socket was never single-sourced: Nvidia's published 800-volt list names ten silicon suppliers, both of these among them, plus five power-shelf vendors and Eaton, Schneider Electric and Vertiv.

So the two de-ratings are not the same event. Monolithic Power has given back a third of its price-to-trailing-gross-profit multiple, to 33.3x from 49.8x in May, while its fastest-growing segment more than doubled — the compression is the sector's, not the business's, though at 74.6x trailing and 44.6x forward earnings it still costs far more than Analog Devices at 19.9x gross profit. What it has not yet answered is Analog Devices' $1.5bn purchase of Empower Semiconductor, whose regulators sit under the accelerator and feed current vertically — the exact socket Monolithic Power is priced to own. Navitas at 84.3x trailing sales is a different case: nothing in the reported quarter refutes the de-rating, and consensus puts real growth in 2027-28.

Between here and the mid-2027 racks it is counting on, Navitas will report four more quarters. Monolithic Power will report the same four while shipping the parts.

Karman Booked $1.3bn of Backlog, Then Lost Its CFO and Drew a Short Report

Hypothesis Opus 5 · Research Opus 5 · Writing Opus 5 · Prompt v1.6

A category of space-propulsion suppliers looks like it is rolling over. One stock is doing all of it, and its reported business is accelerating.

Karman Holdings, which builds payload fairings, interstage structures and solid-propulsion units for missile-defense and launch programs, grew second-quarter revenue 58% to $182.1m, widened gross margin to 43%, lifted backlog 65% to $1.3bn and raised its full-year revenue forecast to $730m-745m. Since then its finance chief has resigned, a secondary offering was announced, and a short seller attacked its acquisition disclosure.

The reported numbers earn none of the decline; the multiple does. Even after the fall Karman trades at 68.1x forward earnings and does not yet generate free cash. BWX Technologies, the naval-reactor maker sitting in the same category, is down 3.8% over twelve months — this is one company's problem.

KRMNBWXTHIICCJLMTNOCGDSMRSolid Rocket PropulsionMissile Defense & HypersonicsLaunch Vehicle StructuresNaval Nuclear ReactorsAcquisition Roll-Up AccountingGovernance & Disclosure Risk
TickerCompanySegmentTrend · 13mo30D1Y
The subject · what this brief is about
BWXTBWX TechnologiesNaval & Shipbuilding⚠️ Emerging Bear−7.2%−3.5%
Compared against · context, not the story
KRMNKarmanMissiles, Weapons & Fire Control⚠️ Emerging Bear−31.3%−35.9%
HIIHuntington Ingalls IndustriesNaval & Shipbuilding⚠️ Emerging Bear−11.9%+6.7%
CCJCamecoUranium⚠️ Emerging Bear+3.4%+30.7%
LMTLockheed MartinLarge Diversified Primes⚠️ Emerging Bear−10.7%+15.9%
NOCNorthrop GrummanLarge Diversified Primes⚠️ Emerging Bear−9.9%−10.9%
GDGeneral DynamicsLarge Diversified Primes🟢 Cont. Bull−8.3%+12.8%
SMRNuScale PowerAdvanced Nuclear🔴 Cont. Bear−1.2%−71.4%

12-month price & trend

KRMN
Karman
39.98
−0.54 (−1.33%)
vs. prior close
Price20d50d150d
KRMN 12-month price
Missiles, Weapons & Fire Control
BWXT
BWX Technologies
158
−2.66 (−1.66%)
vs. prior close
Price20d50d150d
BWXT 12-month price
Naval & Shipbuilding
HII
Huntington Ingalls Industries
286
−4.80 (−1.65%)
vs. prior close
Price20d50d150d
HII 12-month price
Naval & Shipbuilding
TickerMkt capP/EP/E fwdP/SP/S fwdP/GPP/GP fwdEV/EBITDAFCF yld
KRMN$5.3B140.3x68.1x9.0x7.2x21.6x17.2x42.9x-0.5%
BWXT$14.4B40.6x33.2x4.1x3.8x18.6x17.2x28.6x2.2%
HII$11.3B17.0x15.3x0.9x0.8x6.8x6.7x12.7x3.3%
CCJ
Cameco
101
+0.12 (+0.12%)
vs. prior close
Price20d50d150d
CCJ 12-month price
Uranium
LMT
Lockheed Martin
525
−7.67 (−1.44%)
vs. prior close
Price20d50d150d
LMT 12-month price
Large Diversified Primes
NOC
Northrop Grumman
515
−13.26 (−2.51%)
vs. prior close
Price20d50d150d
NOC 12-month price
Large Diversified Primes
TickerMkt capP/EP/E fwdP/SP/S fwdP/GPP/GP fwdEV/EBITDAFCF yld
CCJ$42.0B163.2x62.6x16.7x11.8x60.7x42.9x67.3x0.9%
LMT$119.0B24.8x17.2x1.6x1.5x16.1x15.3x17.0x4.8%
NOC$76.8B16.8x19.3x1.8x1.7x8.8x8.5x12.2x4.3%
GD
General Dynamics
359
−6.48 (−1.77%)
vs. prior close
Price20d50d150d
GD 12-month price
Large Diversified Primes
SMR
NuScale Power
9.70
−0.05 (−0.51%)
vs. prior close
Price20d50d150d
SMR 12-month price
Advanced Nuclear
TickerMkt capP/EP/E fwdP/SP/S fwdP/GPP/GP fwdEV/EBITDAFCF yld
GD$90.5B20.8x20.1x1.7x1.6x11.0x10.7x15.2x6.9%
SMR$2.8Bn/m261.9x91.1x432.7xn/m-27.7%

Consensus projections

TickerFY2026EFY2027EFY2028E
KRMNRevenue+57.5%+27.5%+25.8%
EPS+62.0%+61.1%+38.7%
BWXTRevenue+20.6%+9.6%+7.0%
EPS+24.1%+11.6%+11.7%
HIIRevenue+10.8%+6.4%+6.4%
EPS+23.6%+12.3%+16.4%
CCJRevenue+3.6%+10.9%+7.7%
EPS+7.3%+69.4%+25.2%
LMTRevenue+6.1%+5.4%+5.5%
EPS+38.4%+7.1%+6.2%
NOCRevenue+5.1%+6.7%+6.1%
EPS+7.2%+7.9%+8.6%
GDRevenue+6.4%+4.6%+4.2%
EPS+7.9%+9.5%+7.9%
SMRRevenue−26.7%+434.9%+101.2%
EPS−74.7%+33.4%−18.3%

Forward fiscal years only. Blank means no analyst coverage for that year.

Karman Holdings makes the payload fairings, aerodynamic interstage structures and solid-propulsion units that sit inside missile-defense interceptors, hypersonic vehicles and launch vehicles. On its August 6 call it reported second-quarter revenue of $182.1m, up 58% from a year earlier. Every operating line moved with it: gross margin widened to 43% from 41%, operating income rose 73%, backlog reached $1.3bn, up 65%, and full-year revenue guidance went to $730m-745m.

Then the news stopped being about the business. Chief financial officer Mike Willis said he would step down, with Chris Boynton taking the seat on September 14; the company announced a secondary offering; and in early September the short seller J Capital published a report attacking Karman's disclosure of its serial acquisitions, a sequence AAII catalogued as the shares slid. Karman closed at $39.98 on September 4 against $54.71 a month earlier. That gap is the story — and it is also why a slice of the listed space-propulsion complex reads as though an industry is deteriorating when only one company is being repriced.

The neighbors did not move like this

The useful comparison is BWX Technologies, the sole qualified manufacturer of naval nuclear reactors and fuel for the U.S. Navy's submarines and carriers, which is grouped alongside Karman in propulsion. BWXT fell 7.2% over the same thirty days and is down 3.8% over twelve months. The defense primes were softer — Huntington Ingalls off 10.9%, Lockheed Martin 9.7% — in a month when the 30-year Treasury yield reached a 19-year high above 5.33%, which mechanically compresses what buyers pay for long-dated earnings across the whole group. Karman's 27% is several times any of that. Nothing sector-wide is doing this to it.
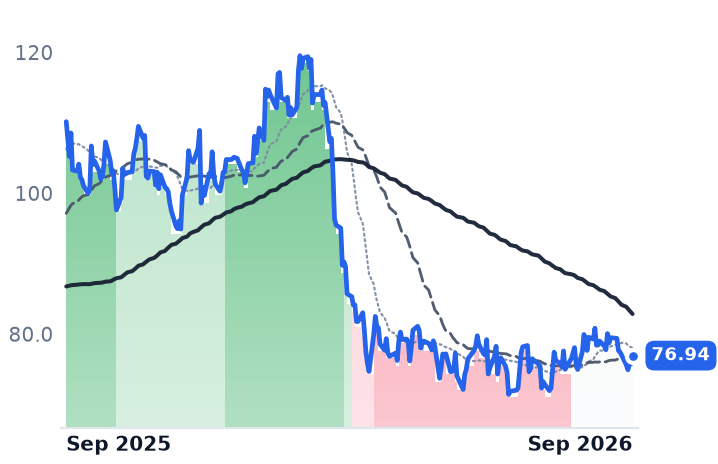
What the price was carrying

Even after the drop, Karman trades at 68.1x forward earnings and 140.3x trailing, at 21.6x trailing gross profit, and its trailing free-cash-flow yield is slightly negative. BWXT, growing far more slowly but converting cash, is at 33.2x forward and 18.6x trailing gross profit. A company that has been buying growth, does not yet self-fund it, and is changing finance chiefs is precisely the profile against which a disclosure attack does maximum damage — whether or not the attack is correct.
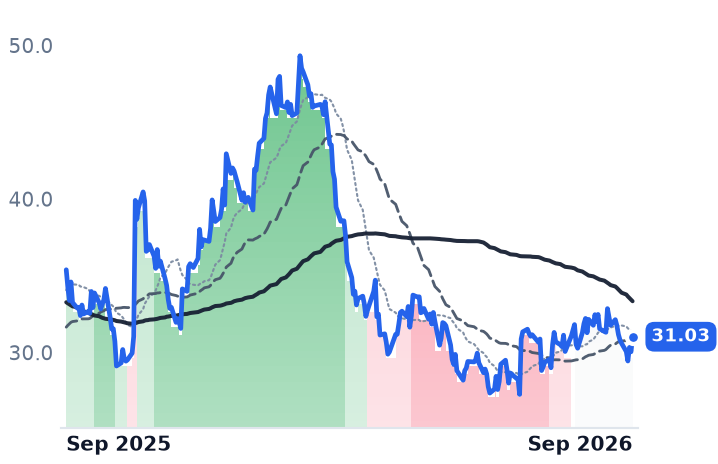
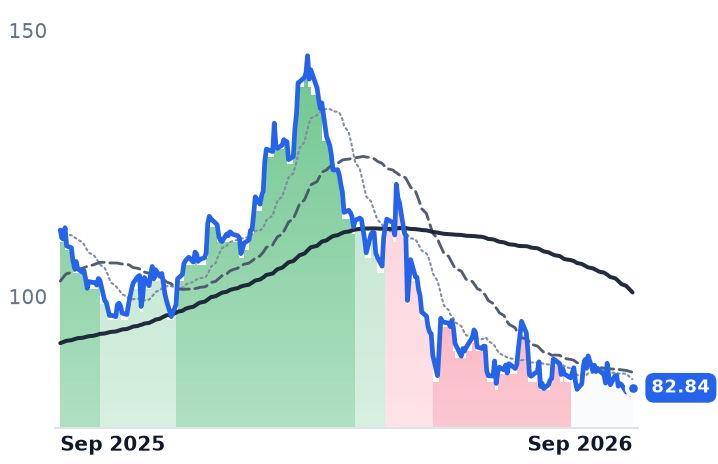
What the multiple was priced for is on the transcript. "Some customers are now citing demand to increase certain annual production buys by as much as a factor of 10x," chief executive Jonathan Rambeau told investors on August 6. "Which would dwarf earlier projections of 2, 3, or 4x multiples of current build rates."
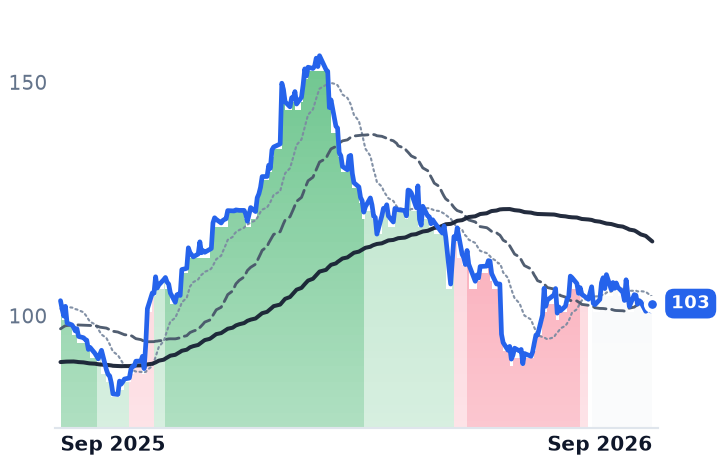
The verdict

Split the decline in two. Karman traded at $97.14 in early March; the six-month slide from there is the unwind of a price that treated Rambeau's ten-fold scenario as booked rather than cited, and the reported business — accelerating revenue, widening margin, a raised forecast — argues that unwind was about the multiple rather than the operations. The August-September leg is different: a resignation, an equity sale and a short report inside five weeks are governance events, and they have hit a balance sheet that cannot yet fund its own growth.

What none of the available disclosure settles is the question the short report actually poses: how much of that 58% is acquired volume rather than organic demand, and how durable the accounting behind it is. Until that is answered in a filing, the growth rate and the multiple are arguing past each other.

Boynton signs his first quarterly numbers in his new job within weeks. That set of figures, more than any interceptor build rate, is what the stock is now trading on.