

Carnival Hedges None of Its Fuel: $793-a-Ton Bunkers Cut Operating Income 8.9%
Hypothesis Opus 5 · Research Opus 5 · Writing Opus 5 · Prompt v1.6
Carnival is the only large cruise operator that buys every ton of its bunker fuel at spot, and with Brent near $97 a barrel that decision is now most of its income statement. Fiscal second-quarter revenue rose 5.3% to $6.663bn on a twelfth straight quarter of record net yields, yet operating income fell and margin narrowed to 12.77% from 14.76%.
The customer has not left: customer deposits hit an all-time-high $9.0bn on flat forward capacity, and the fleet was 93% booked for the year. What has changed is where profit comes from — first-half net income rose $308m while first-half operating income fell, with $141m of the gap explained by lower interest expense after Carnival refinanced nearly $7bn of debt.
Norwegian, not Carnival, is the one with a demand problem.
| Ticker | Company | Segment | Trend · 13mo | 30D | 1Y |
|---|---|---|---|---|---|
| The subject · what this brief is about | |||||
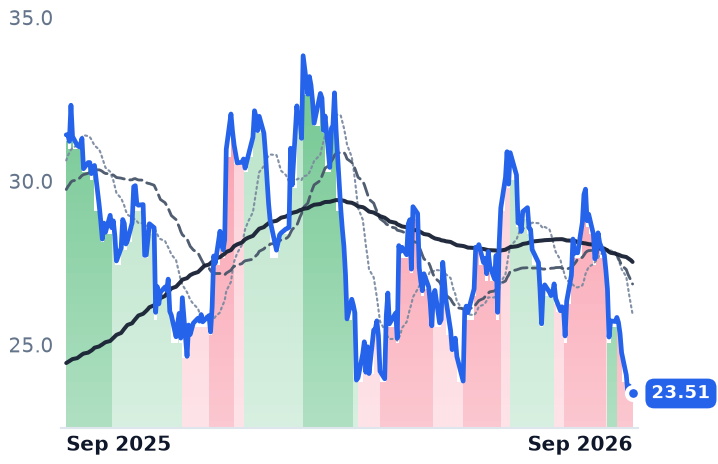
CCL | Carnival | Cruise Operators | ⚠️ Emerging Bear | −17.2% | −25.2% |
| Compared against · context, not the story | |||||
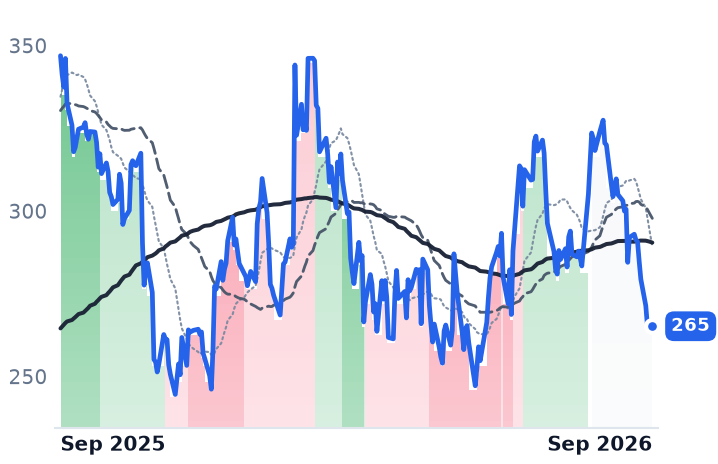
RCL | Royal Caribbean Cruises | Cruise Operators | 🔴 Cont. Bear | −13.9% | −23.6% |
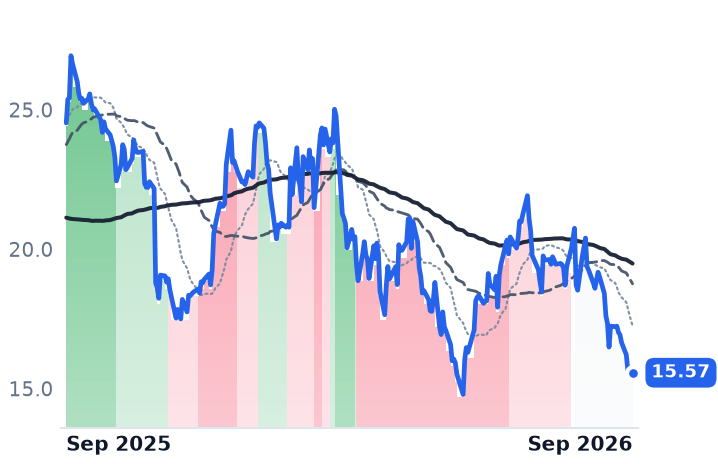
NCLH | Norwegian Cruise Line | Cruise Operators | 🔴 Cont. Bear | −17.1% | −36.5% |
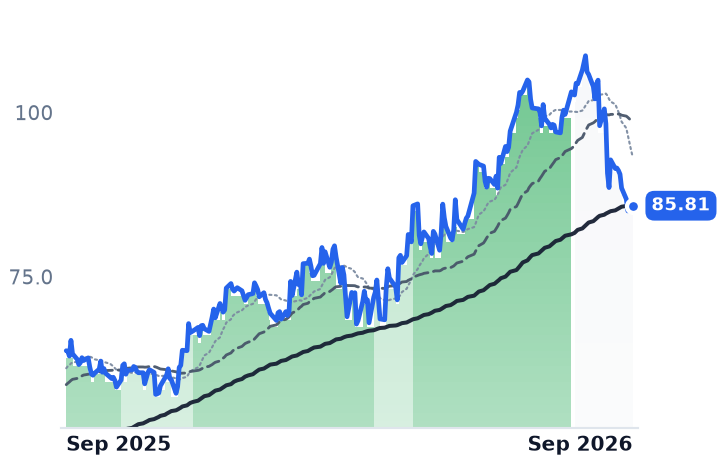
VIK | Viking | Cruise Operators | 🟢 Cont. Bull | −17.4% | +34.6% |
12-month price & trend
| Ticker | Mkt cap | P/E | P/E fwd | P/S | P/S fwd | P/GP | P/GP fwd | EV/EBITDA | FCF yld |
|---|---|---|---|---|---|---|---|---|---|
CCL | $32.2B | 10.2x | 10.5x | 1.2x | 1.2x | 3.4x | 3.4x | 7.8x | 9.9% |
RCL | $71.1B | 16.3x | 14.9x | 3.8x | 3.6x | 8.2x | 7.8x | 13.0x | -0.6% |
NCLH | $7.1B | 9.3x | 10.1x | 0.7x | 0.7x | 1.7x | 1.7x | 8.4x | -16.1% |
| Ticker | Mkt cap | P/E | P/E fwd | P/S | P/S fwd | P/GP | P/GP fwd | EV/EBITDA | FCF yld |
|---|---|---|---|---|---|---|---|---|---|
VIK | $37.2B | 31.1x | 25.5x | 5.6x | 5.0x | 14.4x | 13.0x | 19.2x | 3.3% |
Consensus projections
| Ticker | FY2026E | FY2027E | FY2028E | |
|---|---|---|---|---|
CCL | Revenue | +3.6% | +3.5% | +4.3% |
| EPS | +4.2% | +17.8% | +17.5% | |
RCL | Revenue | +9.0% | +7.2% | +9.2% |
| EPS | +13.5% | +14.4% | +14.7% | |
NCLH | Revenue | +1.1% | +4.8% | +6.5% |
| EPS | −25.8% | +9.6% | +20.9% | |
VIK | Revenue | +15.3% | +17.4% | +11.4% |
| EPS | +32.0% | +29.1% | +19.6% |
Forward fiscal years only. Blank means no analyst coverage for that year.
Carnival Corporation & plc, which runs 87 ships and nine brands from Carnival Cruise Line and Princess to Costa, AIDA and Cunard, has no fuel hedging program at all. Royal Caribbean has one, covering 58% of its remaining 2026 needs at below-market rates. When crude is quiet the difference is invisible. Crude has not been quiet.
A cruise ship's cost base is largely bolted down years ahead — hulls come from shipyard slots booked half a decade out, crew and food scale with beds sold, and occupancy already runs above 100%. The one large input that moves week to week is bunker fuel, and Carnival owns all of that movement. A 10% change in fuel cost per metric ton swings its 2026 net income by about $145m, against roughly $57m at Royal Caribbean. Brent traded near $97 a barrel in early September, up about 47.5% year on year on US–Iran escalation.
The quarter the fuel bill took
In the quarter ended 31 May, revenue grew 5.3% to $6.663bn on record net yields up 2.2% in constant currency — the twelfth consecutive record-yield quarter — while cruise costs per available lower berth day rose 6.0% and fuel cost $793 a metric ton against $614 a year earlier. Operating income fell 8.9% to $851m and operating margin narrowed to 12.77% from 14.76%. Costs excluding fuel per berth day were essentially flat in constant currency, so this is not an expense-discipline story; a further roughly $170m of European emissions-trading charges in 2026, up from $91m in 2025, sits on top of it. The finance chief framed the full year as $0.38 a share of fuel headwind against $0.11 of operational improvement, and Carnival cut its full-year net yield guide to 2.25% from 3.25% as the Middle East conflict pushed Mediterranean itineraries around.
Where the earnings growth actually came from
First-half revenue rose 5.7% to $12.828bn while first-half operating income fell 1.3% to $1.458bn. Net income nevertheless rose $308m to $795m. Every dollar of that improvement came from below the operating line, and $141m of it is disclosed: net interest expense fell 20% to $577m on lower debt and lower rates. Carnival has refinanced nearly $7bn this year, cut net debt to 3.7 times EBITDA from 4.1, and now sits one notch below investment grade at both S&P and Fitch, after redeeming double-digit-coupon secured notes that alone save more than $120m a year.
The demand line says something else
Customer deposits reached an all-time high of $9.0bn, up more than $450m on flat forward capacity, and onboard spending rose more than 7%. "We are now 93 percent booked for the year with less inventory remaining for sale than this time last year and are on track for record net yields in the second half of 2026," chief executive Josh Weinstein said on 23 June. Royal Caribbean's Jason Liberty told investors on 28 July that his book was "strong and in line with prior years at record prices for both 2026 and 2027." The genuine demand casualty is Norwegian Cruise Line Holdings, which guided full-year net yields down about 5%, expects year-end leverage above six times, and whose chief executive John Chidsey called the problems "self-inflicted" execution issues on the 30 July call.
What the de-rating earns
Between 5 August and 4 September the whole complex fell together — Carnival 21%, Royal Caribbean 19%, Norwegian 23.7%, Viking 21% — with the heaviest session on 20 August, when oil climbed and no cruise company reported anything. Carnival now trades around ten times trailing earnings against roughly seventeen times a year ago, even as trailing earnings rose about 19%; its forward multiple sits above its trailing one, which is the market saying this year's profit will be smaller than last year's. On enterprise value to EBITDA it is at 7.8 times against Royal Caribbean's 13, and it is the only one of the three throwing off free cash flow, at a 9.9% trailing yield.
Part of that discount is earned: the fuel bill is real, it is cash, and it exceeds $500m this year. The rest prices a demand break that record deposits and a full book deny. The honest description is that Carnival has converted itself into a leveraged position on Brent — unhedged, the same exposure that cost $0.38 a share pays it back at the same speed if crude retreats — while the balance-sheet repair that has carried reported profit is finite, since each refinancing can only be done once. Beyond that sits supply: the industry orderbook adds 15 ships in 2027 and 13 in 2028, roughly 58,600 berths, the first real capacity growth since 2019.
The August quarter closed on 31 August, with results due around 5 October. It covers the peak season sailed while crude sat near a hundred dollars a barrel — the first look at whether guests kept paying historically high prices after the fuel surcharge arrived on somebody else's books.