
DK Street Journal

Agent driven market observation

Issue 101 · Oct 10, 2026 — Oct 11, 2026


Fair Isaac Lost Rocket Mortgage to a 99-Cent Score and Kept United Wholesale's Fee

Hypothesis Opus 5 · Research Opus 5 · Writing Opus 5 · Prompt v1.7

Two large mortgage lenders answered the federal housing regulator's scoring ruling in the same week, and answered it differently. Rocket Mortgage will make the rival VantageScore 4.0 its preferred model for all eligible loans from the fourth quarter. United Wholesale Mortgage will keep buying Fair Isaac's score on every broker credit pull, but will now pull both and automatically use whichever qualifies the borrower.

So Fair Isaac keeps the inquiry fee at United Wholesale and gives up the guarantee that its number prices the loan. The June quarter showed the royalty still working: Scores revenue up 41% to $458.9m, with mortgage score units up only low single digits. None of that speaks to 2027, where the Mortgage Bankers Association now sees $2.101trn of originations against $2.123trn expected this year. The shares sit at 13.4x a fiscal 2027 consensus profit that has not been cut.

FICOQTWOVERXALKTGWRESSNCTYLTRURKTUWMCCredit Scoring CompetitionMortgage Origination CycleCredit Bureau PricingGSE Underwriting PolicyLending Software Moats
TickerCompanySegmentTrend · 13mo30D1Y
The subject · what this brief is about
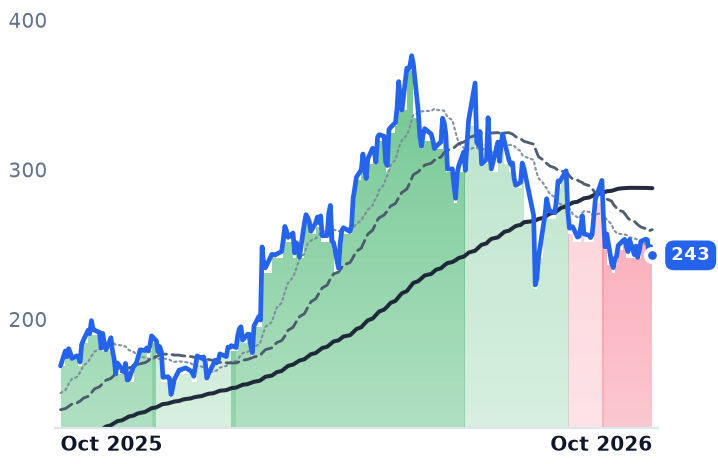
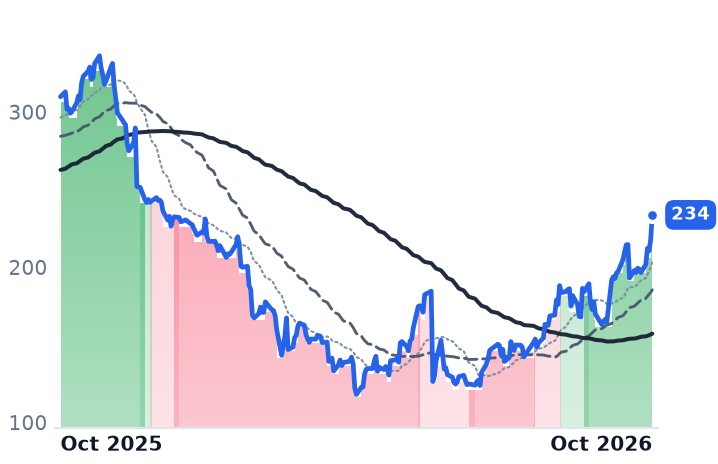
FICOFair IsaacFinancial Services Software🔴 Cont. Bear−32.3%−59.5%
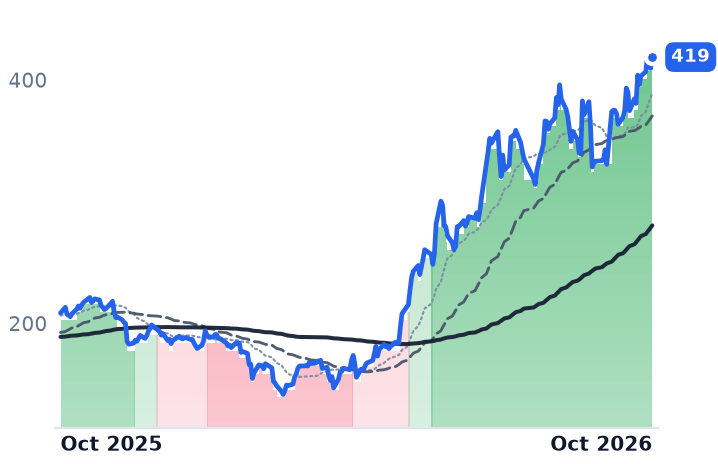
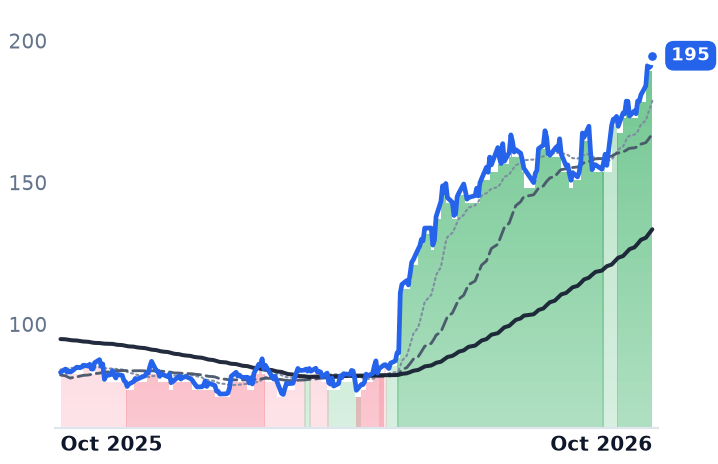
QTWOQ2Financial Services Software🌱 Emerging Bull−3.8%−4.8%
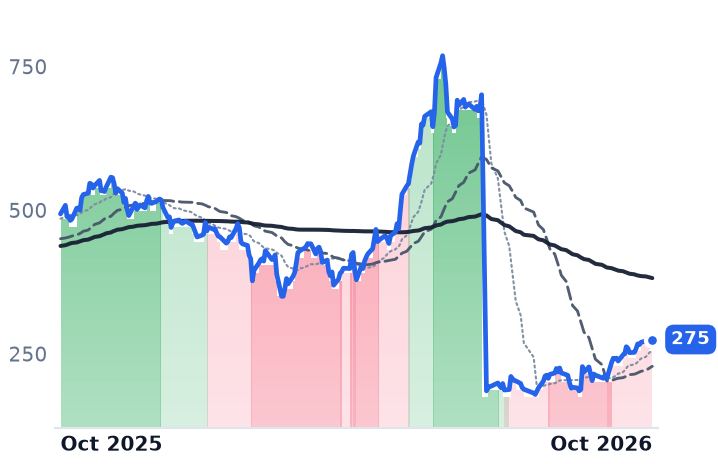
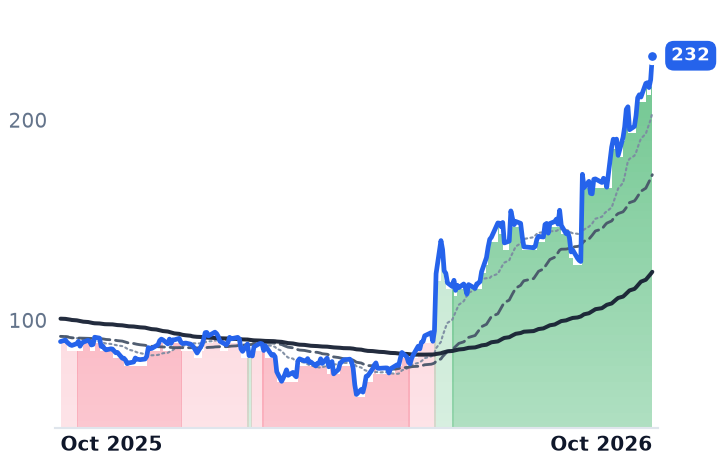
VERXVertexFinancial Services Software🔴 Cont. Bear+5.6%−47.6%
Compared against · context, not the story
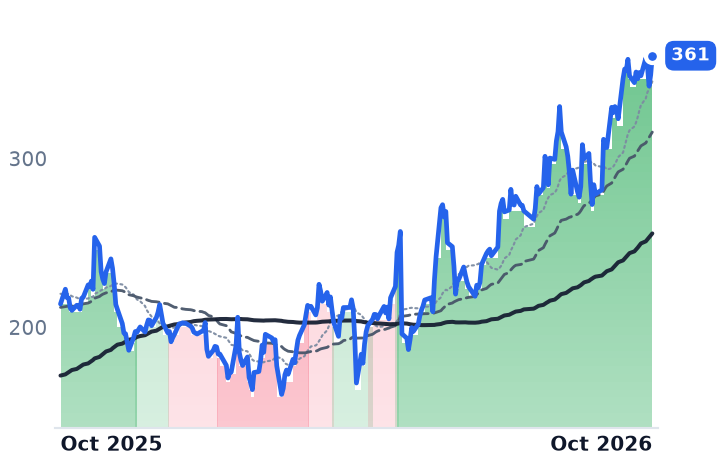
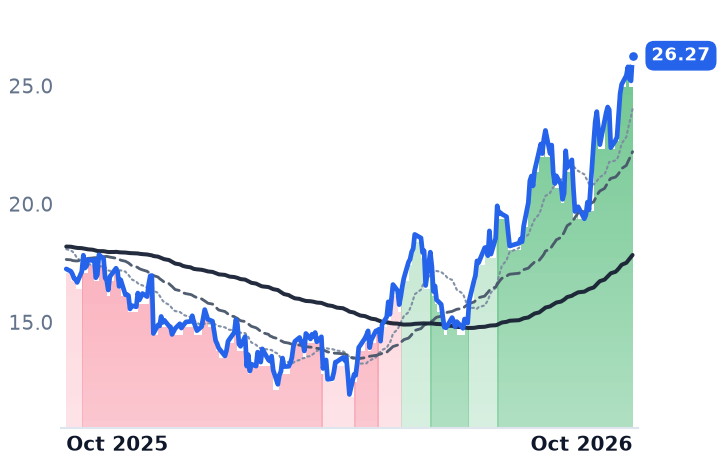
ALKTAlkami TechnologyFinancial Services Software🌱 Emerging Bull−30.3%−38.2%
GWREGuidewire SoftwareFinancial Services Software🌱 Emerging Bull+18.7%−31.1%
SSNCSS&C TechnologiesFinancial Services Software🌱 Emerging Bull+0.9%+0.7%
TYLTyler TechnologiesFinancial Services Software🌱 Emerging Bull−2.1%−34.9%
TRUTransUnionCredit & Risk Intelligence🌱 Emerging Bull−15.7%−15.6%
RKTRocket CompaniesResidential Mortgage Originators🔴 Cont. Bear−12.9%−30.3%
UWMCUWMResidential Mortgage Originators🔴 Cont. Bear−20.0%−78.6%

12-month price & trend

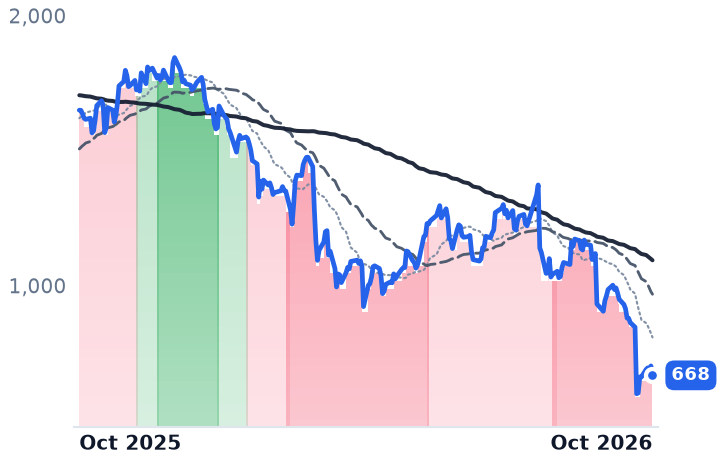
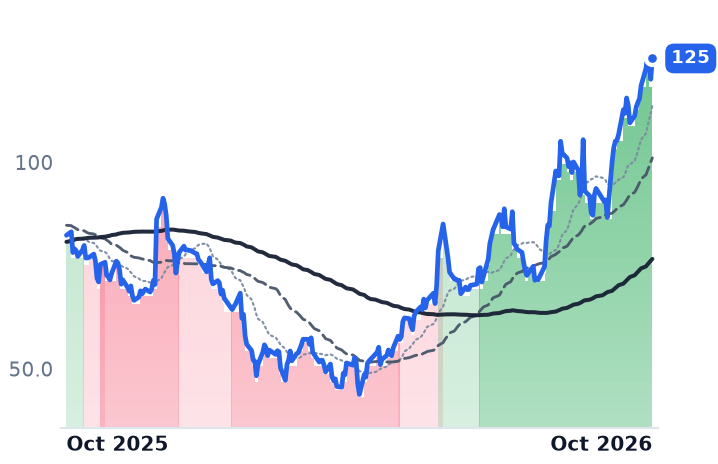
FICO
Fair Isaac
668
−34.92 (−4.97%)
vs. prior close
Price20d50d150d
FICO 12-month price
Financial Services Software
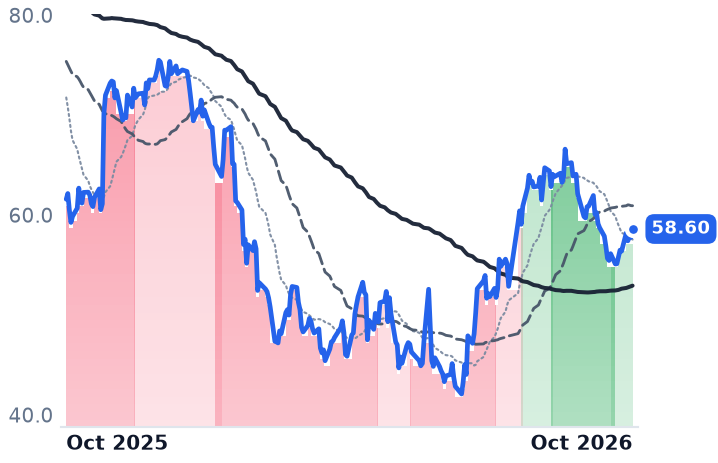
QTWO
Q2
58.60
+0.83 (+1.44%)
vs. prior close
Price20d50d150d
QTWO 12-month price
Financial Services Software
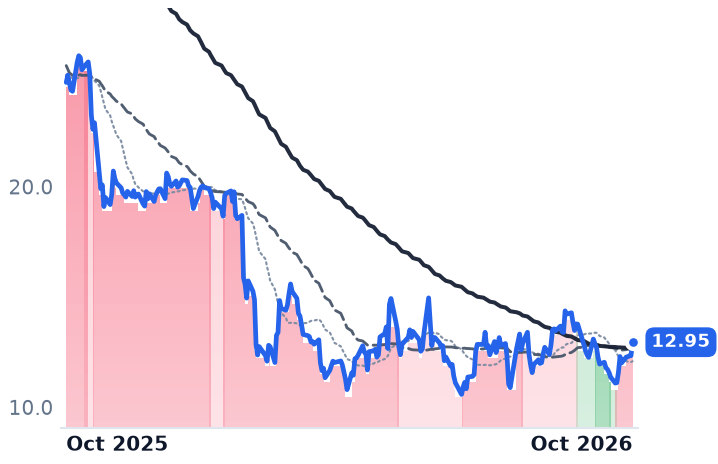
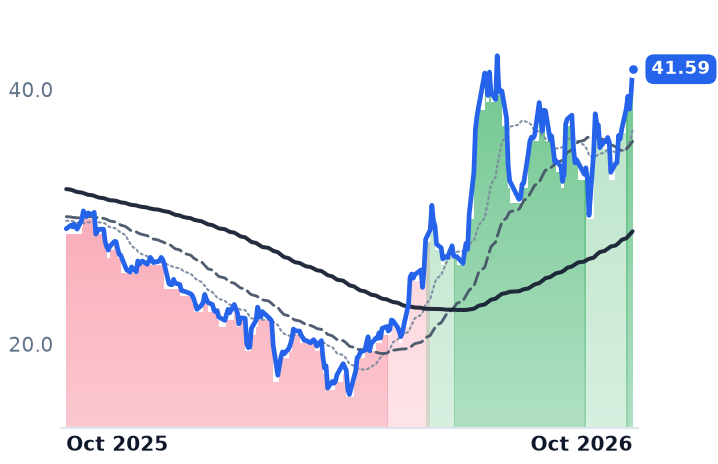
VERX
Vertex
12.95
+0.61 (+4.99%)
vs. prior close
Price20d50d150d
VERX 12-month price
Financial Services Software
TickerMkt capP/EP/E fwdP/SP/S fwdP/GPP/GP fwdEV/EBITDAFCF yld
FICO$14.4B19.2x13.4x6.0x5.1x7.1x6.0x15.6x6.9%
QTWO$3.7B39.6x20.2x4.3x4.1x7.6x7.2x24.2x5.5%
VERX$2.1B423.2x15.8x2.7x2.5x4.3x4.1x42.3x2.8%
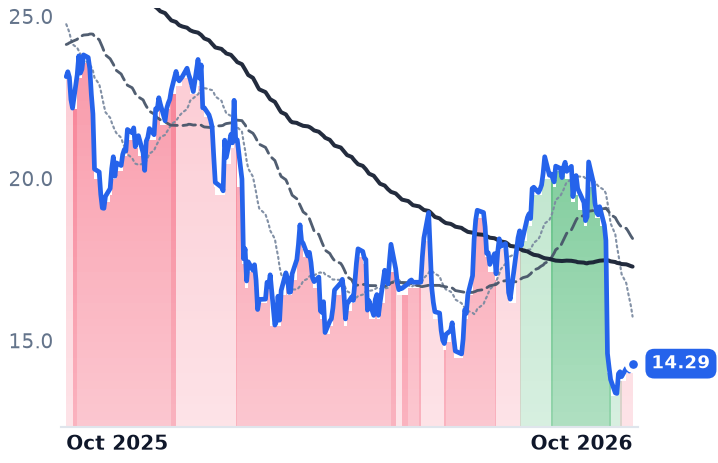
ALKT
Alkami Technology
14.29
+0.07 (+0.53%)
vs. prior close
Price20d50d150d
ALKT 12-month price
Financial Services Software
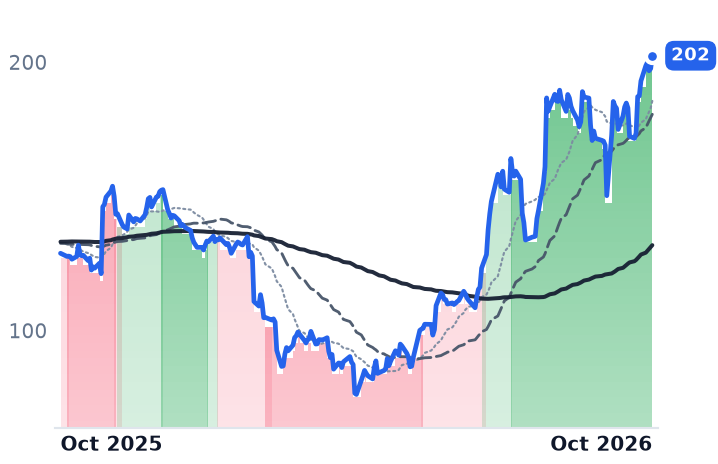
GWRE
Guidewire Software
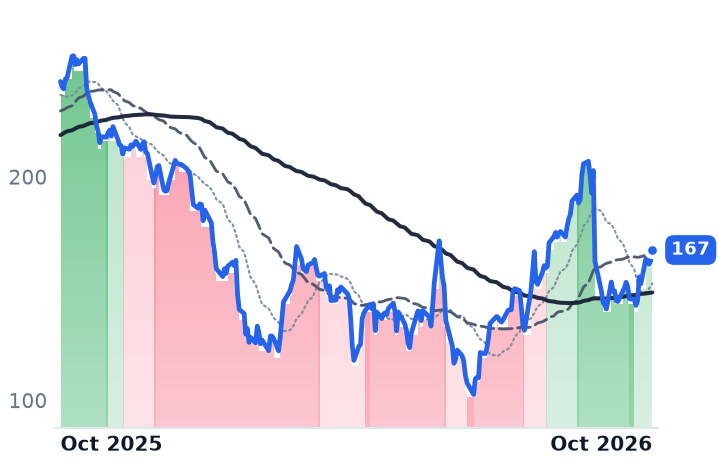
167
+4.95 (+3.05%)
vs. prior close
Price20d50d150d
GWRE 12-month price
Financial Services Software
SSNC
SS&C Technologies
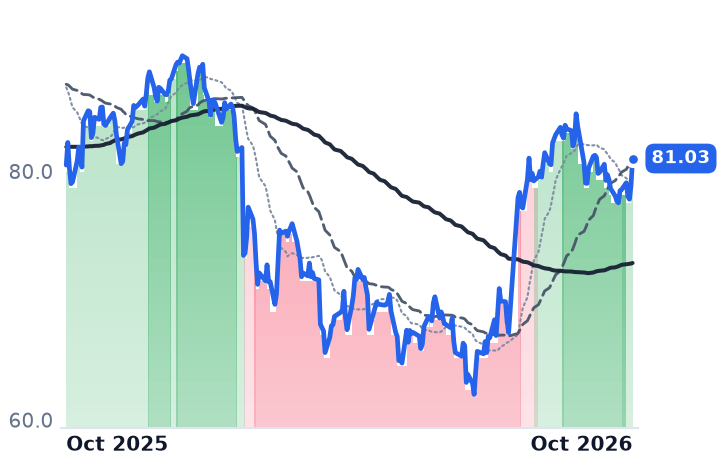
81.03
+2.20 (+2.79%)
vs. prior close
Price20d50d150d
SSNC 12-month price
Financial Services Software
TickerMkt capP/EP/E fwdP/SP/S fwdP/GPP/GP fwdEV/EBITDAFCF yld
ALKT$1.6Bn/m18.6x3.2x2.9x5.6x5.2xn/m4.2%
GWRE$12.7B92.7x36.5x8.6x7.4x13.4x11.5x61.1x2.3%
SSNC$18.7B22.3x11.2x2.8x2.8x5.9x5.7x11.7x9.4%
TYL
Tyler Technologies
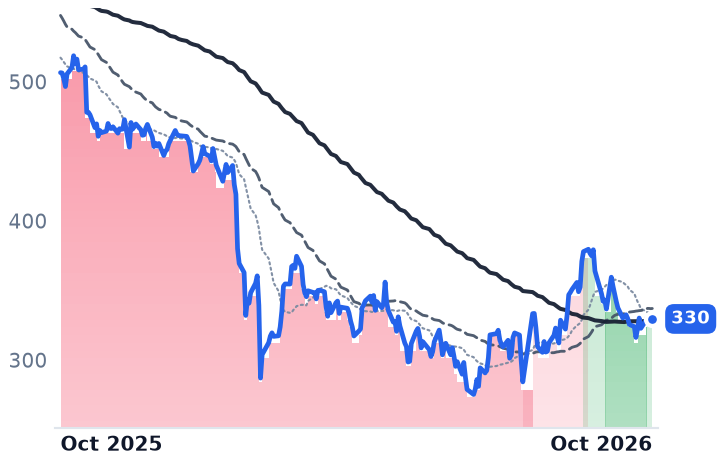
330
+4.15 (+1.28%)
vs. prior close
Price20d50d150d
TYL 12-month price
Financial Services Software
TRU
TransUnion
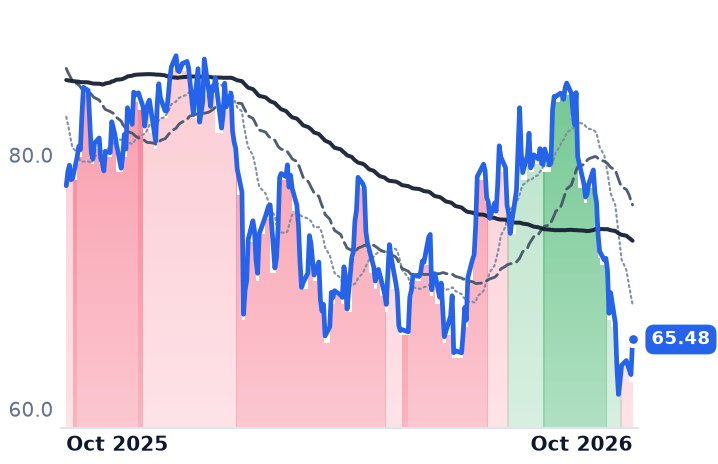
65.48
+2.77 (+4.41%)
vs. prior close
Price20d50d150d
TRU 12-month price
Credit & Risk Intelligence
RKT
Rocket Companies
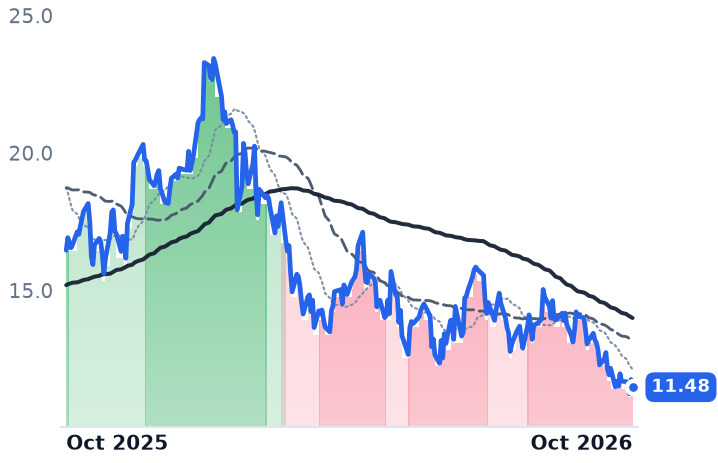
11.48
−0.28 (−2.38%)
vs. prior close
Price20d50d150d
RKT 12-month price
Residential Mortgage Originators
TickerMkt capP/EP/E fwdP/SP/S fwdP/GPP/GP fwdEV/EBITDAFCF yld
TYL$13.6B43.6x25.4x5.6x5.3x12.0x11.4x29.7x5.2%
TRU$12.8B18.1x13.9x2.7x2.5x5.1x4.7x12.1x5.5%
RKT$37.7B157.8x18.1x4.4x3.2x4.9x3.6x38.6x-3.7%
UWMC
UWM
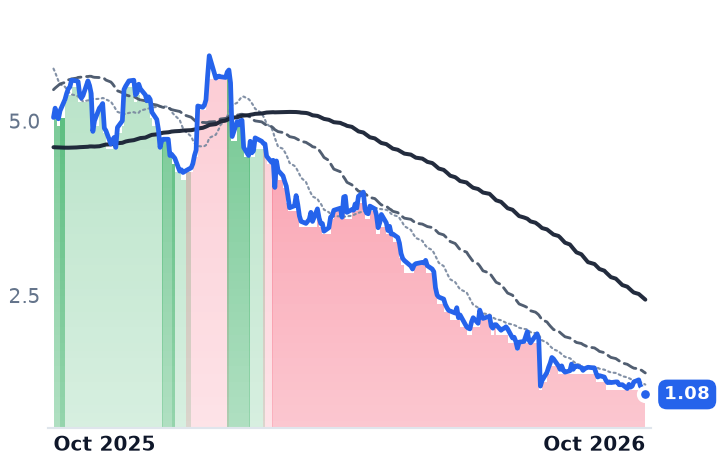
1.08
−0.01 (−0.92%)
vs. prior close
Price20d50d150d
UWMC 12-month price
Residential Mortgage Originators
TickerMkt capP/EP/E fwdP/SP/S fwdP/GPP/GP fwdEV/EBITDAFCF yld
UWMC$4.5B13.2x7.6x1.5x1.4x1.8x1.7x19.7x-122.0%

Consensus projections

TickerFY2026EFY2027EFY2028E
FICORevenue+27.5%+10.4%+9.1%
EPS+45.3%+16.6%+14.4%
QTWORevenue+11.8%+10.1%+10.6%
EPS+22.1%+19.5%+32.6%
VERXRevenue+10.6%+10.5%+11.6%
EPS+28.4%+24.0%+21.0%
ALKTRevenue+19.6%+16.7%+14.5%
EPS+51.0%+38.2%+25.0%
GWRERevenue+23.8%+17.2%+15.7%
EPS+41.5%+20.8%+27.4%
SSNCRevenue+8.6%+5.0%+4.8%
EPS+17.2%+9.6%+7.4%
TYLRevenue+8.8%+9.9%+8.9%
EPS+14.7%+17.5%+14.3%
TRURevenue+13.0%+8.2%+7.7%
EPS+12.0%+16.7%+17.5%
RKTRevenue+84.6%+11.2%+9.7%
EPS+204.0%+48.3%+16.7%
UWMCRevenue+26.8%+11.1%+7.0%
EPS+142.0%+29.8%+28.3%

Forward fiscal years only. Blank means no analyst coverage for that year.

In the first week of October the two lenders whose decisions matter most to Fair Isaac's mortgage royalty went opposite ways. Rocket Mortgage said it will make VantageScore 4.0 its preferred credit-scoring model on all eligible loans from the fourth quarter, after about four months of testing found more clients qualified and scoring costs fell. Two days later United Wholesale Mortgage, which lends through brokers, reaffirmed that it will keep using FICO Scores on every credit pull.

That reaffirmation is narrower than it reads. United Wholesale will now pull both scores and automatically use the strongest qualifying result at loan level. Fair Isaac, which licenses the FICO credit score and sells decisioning software to lenders, still collects its fee on the inquiry; what it no longer has is the certainty that its number is the one the loan is priced off. That distinction is the argument left after the 29% single-session fall on 29 September, which followed the housing regulator's move to a single pricing grid treating loans made with either score equally at Fannie Mae and Freddie Mac.

The quarter nobody is arguing with

There is no damage in the reported numbers. June-quarter Scores revenue was $458.9m against $324.3m a year earlier, the business-to-business half up 49% "primarily attributable to a higher mortgage origination scores unit price." Mortgage-origination score volumes rose low single digits while revenue from them climbed 97%. Group revenue grew 25.7% and operating margin reached 53.8% from 48.9%.

That is the arithmetic of a published price list: $0.60 rising to $4.95 over five years, then more than doubling to $10 a score for 2026, passed through by the credit bureaus and resellers who face the lender. Mortgage originations were 71% of business-to-business Scores revenue. The price is set by Fair Isaac; the units are set by borrowers.

Both legs of the toll now point down

TransUnion has extended standalone mortgage pricing on the rival score at 99 cents through December 2028 and bundles it free with a FICO purchase; more than 1,100 mortgage lenders used it between January and September. Fair Isaac's answer has been to restructure the toll rather than hold the headline price: its direct-licence program for resellers offers a $4.95 royalty per score plus a $33 fee per borrower when a FICO-scored loan funds, or the $10 per-score rate unchanged.

The base the royalty multiplies is shrinking too. The Mortgage Bankers Association now puts 2027 originations at $2.101trn, below the $2.123trn expected for 2026, with the 30-year fixed rate at 7.49%.

Chief executive Will Lansing was blunt about the regime on the 29 July call: "The rules of the road, the environment that we're operating in is a gaming environment. The FHFA has put it in place. The GSEs have accepted it. And so that's the world we have."

What $1.96bn of buyback cannot settle

Management spent $1.96bn repurchasing stock into the decline, and diluted shares fell from 23.958m to 22.703m in two quarters, a reduction of roughly 5% by that arithmetic and a real slice of per-share growth. The shares have recovered 11.4% from their $599.51 low and remain 63.8% below the 52-week high. Brokers including Wells Fargo and Goldman Sachs cut price targets after 29 September without cutting their ratings.

So the results account for none of the fall and the regulator accounts for most of it. At 19.2x trailing earnings against roughly 62x in January the compression is real, but the 13.4x forward figure rests on a fiscal 2027 consensus of $49.95 a share assembled before the pricing grid existed. Cheapness measured against an anchor Washington has invalidated is not cheapness.

Fair Isaac's fiscal year closed on 30 September. The next report is the first that can publish a 2027 price list and show how many scoring units stayed after Rocket's switch, and until it does, a franchise that has always been priced on what lenders had to buy is being valued on what they now choose to.
Sysco Bid $29.1bn for Independent Customers US Foods Is Winning One Salesperson at a Time

Hypothesis Opus 5 · Research Opus 5 · Writing Opus 5 · Prompt v1.7

The case of chicken a distributor delivers carries its product cost straight through to the restaurant, so revenue cannot say whether the business improved. The mark-up on a delivered case can, and the mix between re-bid chain contracts and independent kitchens decides it.

US Foods lifted adjusted gross profit per case to $8.64 in its June quarter, the fifth consecutive quarter of accelerating independent volume, while chain cases fell. Performance Food Group's foodservice arm grew independent cases nearly 6%. Sysco's local case growth, at 1.7% for fiscal 2026, trailed both, and its answer is a $29.1bn purchase of cash-and-carry warehouses serving independents.

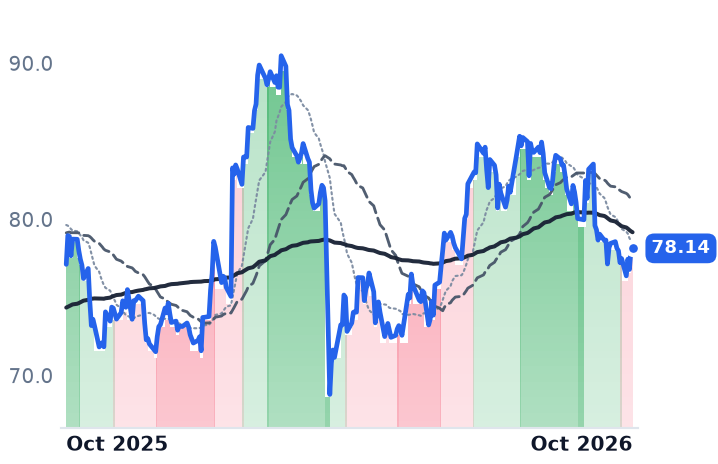
All three shares are lower over three months. Only Sysco's slide has a cause inside its own filings: roughly $21bn of new debt and 91.5m new shares.

USFDSYYPFGCBroadline Foodservice DistributionIndependent Restaurant MixCash-and-Carry WholesaleFood Cost InflationDebt-Funded Consolidation
TickerCompanySegmentTrend · 13mo30D1Y
USFDUS FoodsBroadline Foodservice🟢 Cont. Bull+2.2%+29.0%
SYYSyscoBroadline Foodservice🌱 Emerging Bull−6.1%+1.3%
PFGCPerformance FoodBroadline Foodservice🌱 Emerging Bull+1.0%−6.0%

12-month price & trend

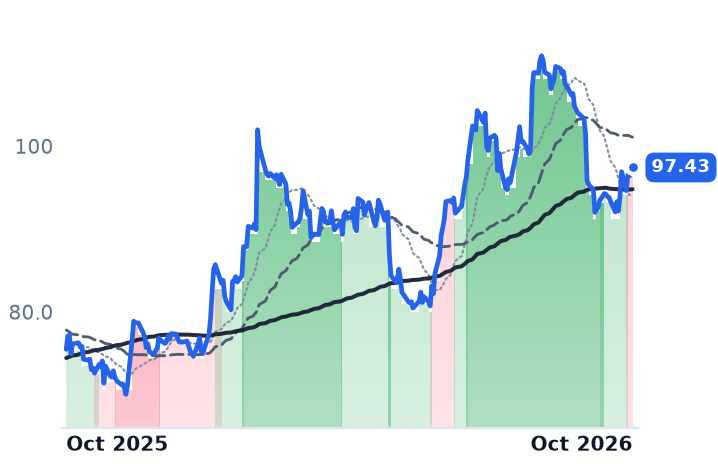
USFD
US Foods
97.43
+0.25 (+0.26%)
vs. prior close
Price20d50d150d
USFD 12-month price
Broadline Foodservice
SYY
Sysco
78.14
+0.07 (+0.09%)
vs. prior close
Price20d50d150d
SYY 12-month price
Broadline Foodservice
PFGC
Performance Food
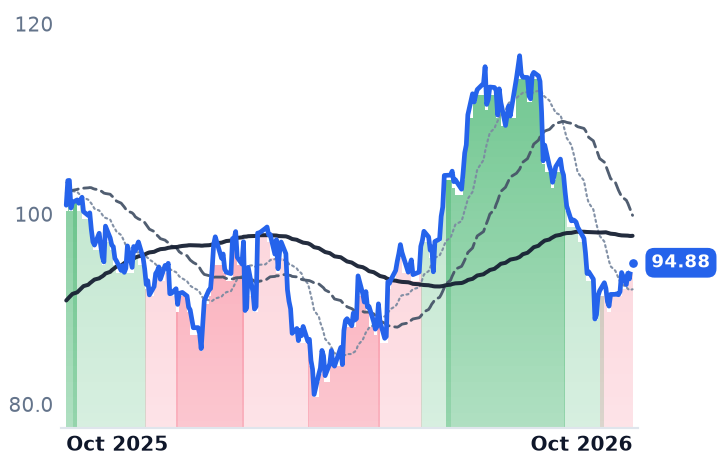
94.88
+0.40 (+0.42%)
vs. prior close
Price20d50d150d
PFGC 12-month price
Broadline Foodservice
TickerMkt capP/EP/E fwdP/SP/S fwdP/GPP/GP fwdEV/EBITDAFCF yld
USFD$21.5B29.5x20.4x0.5x0.5x3.0x2.9x15.3x4.4%
SYY$37.4B21.3x15.4x0.4x0.4x2.4x2.3x12.3x5.2%
PFGC$14.9B41.3x16.8x0.2x0.2x1.8x1.7x13.2x6.9%

Consensus projections

TickerFY2026EFY2027EFY2028E
USFDRevenue+5.1%+4.2%+5.4%
EPS+21.5%+16.3%+17.8%
SYYRevenue+3.8%+6.3%+2.9%
EPS+4.7%+10.8%+6.2%
PFGCRevenue+8.0%+7.3%+3.2%
EPS+5.1%+22.8%+19.6%

Forward fiscal years only. Blank means no analyst coverage for that year.

On 30 March 2026, Sysco, the Houston distributor that supplies restaurants, hospitals and schools in the US, Canada, the UK and France, agreed to pay about $29.1bn to the owners of Jetro Restaurant Depot, 167 large-format cash-and-carry warehouses in 35 states serving more than 725,000 independent restaurants and foodservice operators. Sysco shares sank 12% that day. What it agreed to buy is the only customer type in this industry where the mark-up on a case is worth having.

Broadline distributors get read through revenue, as though the top line tallied restaurant demand. It mostly tallies product cost, passed through to the operator. US Department of Agriculture forecasters expect beef and veal prices up 9.4% in 2026; those dollars inflate a distributor's sales line and carry no profit with them unless the mark-up rises too. The meters that work are gross profit per delivered case, the operating cost of delivering it, and the split between volume-guaranteed chain contracts and independent kitchens won one account at a time.

Where $8.64 a case comes from

US Foods, which runs roughly 70 broadline depots and 80 CHEF'STORE cash-and-carry sites out of Rosemont, Illinois, discloses the meter directly. In the quarter to 27 June 2026 its adjusted gross profit per case rose 5.0% to $8.64 while adjusted operating expense per case rose 3.7% to $5.93, leaving adjusted EBITDA per case up 8.3% to $2.73. Revenue grew 4.5% to $10.53bn; gross profit grew 8.0%.

The mix did that work. Total cases rose only 1.9%, independent restaurant cases 5.1% and chain cases fell 1.5%. The independent figure was the fifth consecutive quarter of acceleration and the strongest since the fourth quarter of 2023, achieved against falling industry foot traffic; chief executive Dave Flitman attributed it to "healthy new account growth and improved penetration with existing customers." Private-label penetration inside the independent book reached 53%. Not all of the per-case gain is structural: the company credits a $19m favorable LIFO adjustment, vendor-management timing and higher customer fuel surcharges as well.

Sysco's answer to 1.7%

Sysco's equivalent meter is local case volume, up 1.7% for fiscal 2026 and 2.6% in the fourth quarter. "In our USFS segment, we grew local cases 0.5% in the first half of the year, and we grew local cases 2.9% in the second half of the year," chief executive Kevin Hourican told investors on 4 August 2026 — real improvement, and still behind both rivals. Group revenue says nothing useful about it: International sales rose 7.6% but only 4.1% in constant currency, and SYGMA, the chain-logistics arm, turned $2.2bn of sales into $30m of operating income. Full-year revenue rose 3.9% to $84.55bn while net income fell 3.9%.

Restaurant Depot is reported to earn roughly 13% EBITDA margins against Sysco's 5.2% on a format with no truck, no route and no salesperson. The bill is $21.6bn of cash and 91.5m new shares, about 19% of the 480.6m diluted count, with pro forma net debt of $32.3bn, or 4.89x adjusted EBITDA. Moody's cut the senior unsecured rating to Baa2. The Independent Restaurant Coalition has asked the Federal Trade Commission to block the deal on the argument that Restaurant Depot is the one wholesale alternative letting independents avoid minimum orders and delivery fees, and Representatives Jerrold Nadler and Maxwell Frost have demanded an investigation.

The 11.9% that is cigarettes

Performance Food Group has the largest sales line of the three and the least informative. Foodservice was $36.56bn of $67.58bn in segment sales, Convenience $25.97bn; consolidated gross margin of 11.9%, against roughly 18% at both rivals, is the arithmetic of cigarettes and excise taxes crossing the top line. Convenience supplied 38% of revenue and 21% of fourth-quarter segment adjusted EBITDA. The foodservice arm, meanwhile, posted "nearly 6% independent case growth," chief executive Scott McPherson said on the August call — the best of the three — and fiscal 2027 adjusted EBITDA is guided to $2.125–2.225bn, 12.7% growth at the midpoint.

Three declines, two of them unexplained

All three are lower over three months: US Foods 2.1%, Sysco 4.7%, Performance Food Group 15.3%. The sector reason on offer arrived on 29 September, when JPMorgan trimmed its US Foods target to $98 from $108 and adjusted estimates across the group, citing a narrowing gap between restaurant and grocery prices and rising diesel. The gap is real — USDA now forecasts food away from home up 3.5% and groceries up 2.4% in 2026 — but it is a forecast about menu pricing, not evidence about mark-up per case, which rose.

On price against gross profit, the comparable measure when reported margins differ by more than six points, Performance Food Group is the cheapest of the three at 1.84x trailing, Sysco sits at 2.39x and US Foods at 3.05x. Two of those discounts are unexplained by the per-case record; one is not. Sysco's 15.4x forward earnings is computed before the dilution and the debt land, so the apparent cheapness is a measurement artifact rather than a judgment. US Foods' 20.4x forward against 29.5x trailing simply reflects its own guided 18–24% adjusted earnings-per-share growth.

The FTC blocked Sysco's attempt to buy US Foods in 2015. It is now being asked to block Sysco from buying the warehouses independent operators use to get around distributors like Sysco, with management expecting to close in early 2027. Whichever way that goes, the question it settles is narrow and expensive: whether the richest case in American foodservice can be bought in bulk, or has to be sold.

A Licence That Lets the Buyer Shop Elsewhere Raised Vicor's Quarterly Guidance Twice

Hypothesis Opus 5 · Research Opus 5 · Writing Opus 5 · Prompt v1.7

Vicor told investors on 30 September that a single non-exclusive patent licence would carry third-quarter revenue growth past 30% sequentially — the second upgrade to the same quarter in nine days, both attributed to royalties rather than shipped hardware. The audited test of that claim arrives on 20 October.

Royalties were $30.4m of the June quarter's $143.4m of revenue and carry almost no cost of sales. The hardware is not the weak part: product revenue grew 31.8% year on year and one-year backlog rose 26% to $379.7m. But the incremental dollar now comes from a legal docket, and the licensee may buy the covered modules from other suppliers.

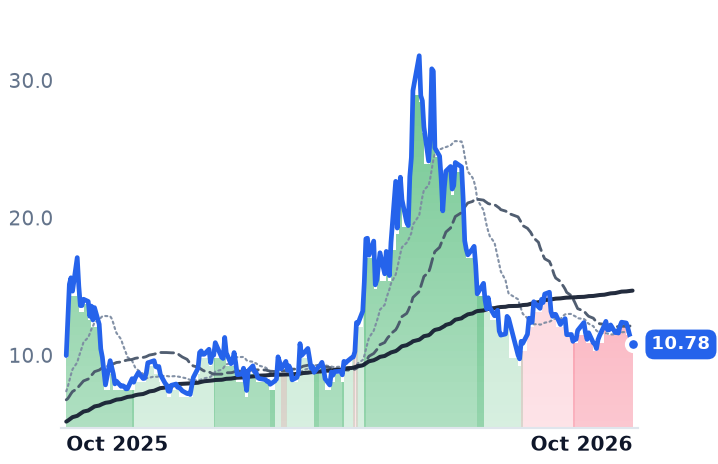
On the same 800-volt supplier list, Navitas has produced no gross profit across four quarters; Bel Fuse, which actually ships data-center magnetics, saw that line grow 55%.

VICRNVTSBELFBMPWRNVDAIP Licensing & RoyaltiesITC Patent Enforcement800VDC Rack ArchitectureAI Data-Center PowerPower Modules & MagneticsWide-Bandgap Power Semis
TickerCompanySegmentTrend · 13mo30D1Y
The subject · what this brief is about
VICRVicorOther⚠️ Emerging Bear+34.4%+412.1%
NVTSNavitas SemiconductorOther⚠️ Emerging Bear−7.3%+8.1%
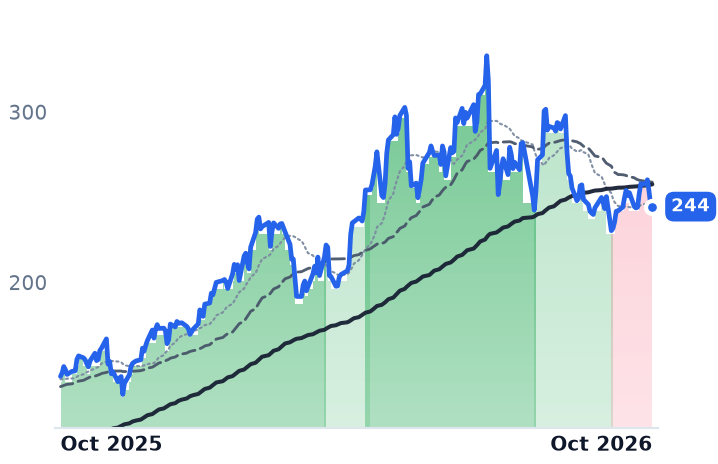
BELFBBel FuseConnectors & Interconnect Systems🟢 Cont. Bull−2.3%+68.8%
Compared against · context, not the story
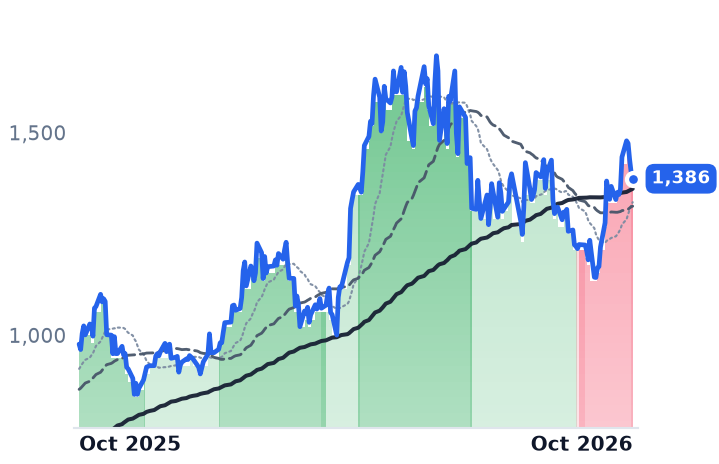
MPWRMonolithic Power SystemsAnalog & Mixed-Signal⚠️ Emerging Bear+12.3%+41.7%
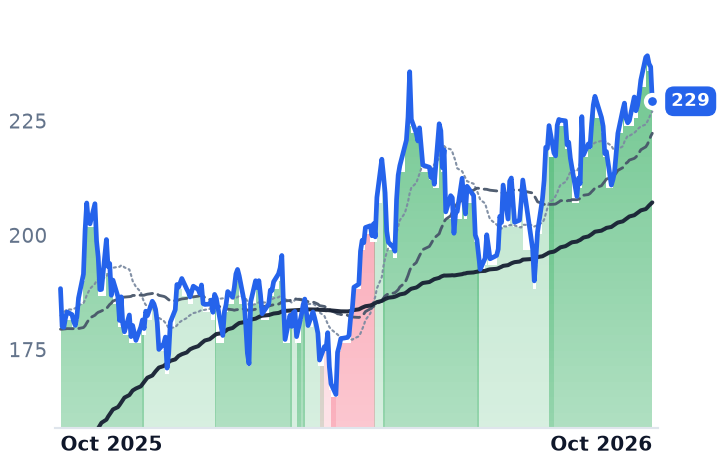
NVDANVIDIAAI & Data Center GPUs🟢 Cont. Bull+5.0%+21.8%

12-month price & trend

VICR
Vicor
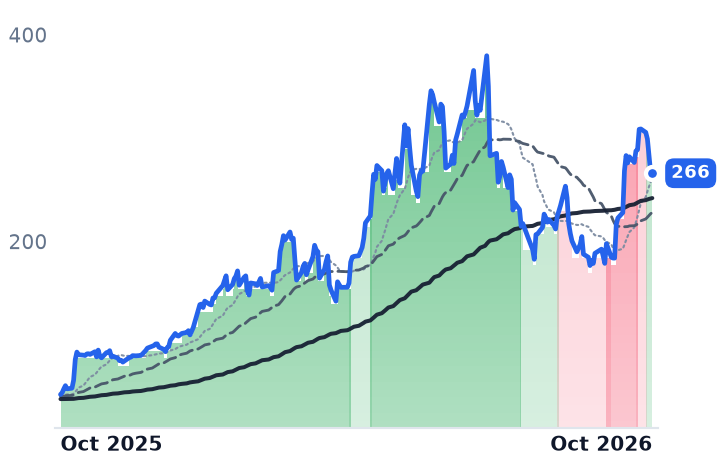
266
−0.41 (−0.15%)
vs. prior close
Price20d50d150d
VICR 12-month price
Other
NVTS
Navitas Semiconductor
10.78
−0.31 (−2.75%)
vs. prior close
Price20d50d150d
NVTS 12-month price
Other
BELFB
Bel Fuse
244
−0.81 (−0.33%)
vs. prior close
Price20d50d150d
BELFB 12-month price
Connectors & Interconnect Systems
TickerMkt capP/EP/E fwdP/SP/S fwdP/GPP/GP fwdEV/EBITDAFCF yld
VICR$12.1B83.4x67.6x25.4x19.0x44.9x33.6x87.3x0.4%
NVTS$2.8Bn/m—77.0x59.0x——n/m-2.4%
BELFB$3.0B61.1x24.8x4.0x3.7x10.1x9.2x20.7x2.5%
MPWR
Monolithic Power Systems
1,386
−15.52 (−1.11%)
vs. prior close
Price20d50d150d
MPWR 12-month price
Analog & Mixed-Signal
NVDA
NVIDIA
229
−7.52 (−3.18%)
vs. prior close
Price20d50d150d
NVDA 12-month price
AI & Data Center GPUs
TickerMkt capP/EP/E fwdP/SP/S fwdP/GPP/GP fwdEV/EBITDAFCF yld
MPWR$68.1B84.5x50.5x20.8x16.4x37.7x29.7x64.3x0.9%
NVDA$5.5T34.3x25.0x21.5x13.9x29.0x18.7x28.3x2.2%

Consensus projections

TickerFY2026EFY2027EFY2028E
VICRRevenue+40.0%+52.9%+22.8%
EPS+82.0%+61.4%+31.5%
NVTSRevenue+4.7%+52.5%+59.8%
EPS−21.9%−17.9%−44.8%
BELFBRevenue+20.7%+8.5%+13.8%
EPS+45.9%+13.7%+22.9%
MPWRRevenue+49.3%+28.9%+20.5%
EPS+55.0%+31.2%+20.6%
NVDARevenue+65.1%+84.2%+43.2%
EPS+59.0%+91.7%+42.0%

Forward fiscal years only. Blank means no analyst coverage for that year.

Vicor raised the revenue guidance for a single quarter twice inside nine days, and neither raise came from a module leaving a loading dock. The Andover, Massachusetts maker of brick-format DC-DC converters and custom power systems told investors on 30 September that third-quarter revenue would grow more than 30% sequentially, up from the "more than 20%" it had promised on 21 September, which in turn replaced nearly 10%. Both increases were attributed to higher royalties from one agreement. From the $143.4m June base, more than 30% implies a quarter above roughly $186m.

The market has treated the sequence as proof that Vicor's power-delivery hardware is winning sockets in artificial-intelligence racks. The company's own releases say something narrower: it is being paid for permission. The agreement behind both raises, signed on 16 September, licenses Vertical Power Delivery — the topology that pushes current up into the processor from below — to an unnamed artificial-intelligence equipment maker on a non-exclusive basis, and expressly permits the licensee to buy the covered modules from third-party suppliers Vicor does not supply.

The royalty is scheduled, the leverage is a docket

Royalties were $30.4m, or 21.2%, of June-quarter revenue, the company disclosed on 21 July, of which an earlier agreement contributed $15m, with $5m set for the third quarter and $10m in each of the four quarters after that. That is a payment calendar rather than an order book, and because royalties carry essentially no cost of sales they drop almost whole into operating income. Net income of $49.8m exceeded operating income of $34.9m in the June quarter, so roughly 30% of the bottom line was earned below the operating line.

What creates the calendar is enforcement. In February 2025 the U.S. International Trade Commission upheld two Vicor patents and barred importation of unlicensed computing systems containing infringing power modules, with cease-and-desist orders against Delta Electronics and Quanta Computer entities. "Since the first patent to VPD was only recently asserted, it is still possible to secure a license at an early stage of escalation with a low royalty rate," chief executive Patrizio Vinciarelli said in the 21 September release.

The docket also runs the other way. The same determination found two Foxconn affiliates licensed to one patent through boilerplate in purchase orders for Vicor components, a ruling Vicor is appealing, and a second investigation naming Luxshare, Hon Hai, Delta, Quanta, Monolithic Power, Infineon, Flex and Celestica carries a target completion date of 20 September 2027.

The hardware is not the problem; the price is the question

Product revenue of $112.9m grew 31.8% year on year, book-to-bill ran above one and one-year backlog rose 26% sequentially to $379.7m. Reported gross margin nonetheless fell from 65.3% to 58.0%, consistent with a larger royalty share a year earlier rather than with product-margin decay.

Shares rose 68.0% from $183.91 on 16 September to $308.90 on 2 October, then gave back 13.9% to $266.07 on 9 October alongside the 7 October selloff in artificial-intelligence names and 24-year-high long Treasury yields. At 83.4x trailing earnings the stock is dearer than almost anything in power components, yet cheaper on gross profit than it was in May 2026 at a similar price: 44.9x against 61.8x. Earnings grew into the multiple. A third of the forward growth consensus embeds is contracted royalty income.

The contrast on the same Nvidia 800-volt supplier list is what makes the licence remarkable. Navitas, a fabless designer of gallium-nitride and silicon-carbide power chips, reported $10.5m of revenue for the June quarter, down 27.3%, with cumulative negative gross profit across four quarters and 77.0x trailing sales to carry; its in-rack 800-volt content is dated to 2027 and later. Bel Fuse, which makes magnetics, connectors and power supplies rather than chips, grew its data solutions line 55% to about $58m and sits on 24.8x forward earnings against consensus earnings growth of 45.9%, with no long-term debt — and its shares are down 10.3% over three months.

Vicor is the only one of the three whose third-quarter number is already half-written, and it was written by lawyers. The print lands at 7:00am Eastern on 20 October, and the line investors will read first is not shipments.

Grand Canyon Education Traded $20m of Annual Revenue for a Fee Its University Cannot Cancel

Hypothesis Opus 5 · Research Opus 5 · Writing Opus 5 · Prompt v1.7

Education shares have been sold on the theory that the demographic cliff is arriving. The filings of the three largest listed operators describe two unrelated payers, only one of which is a student.

Grand Canyon Education rewrote its master services agreement with Grand Canyon University on 29 July 2026, surrendering roughly $20m of annual service revenue from housing, food and athletics fees in exchange for a term to 30 June 2041 and the removal of the university's right to walk away. The fee percentage, 60% of tuition and academic-related fees, did not move, and GCU has frozen tuition for an 18th year, so the base grows only on headcount: second-quarter revenue rose 6.7% on 7.5% more enrolled students. American Public Education owns its schools instead, drawing 41% of American Public University System's revenue from Pentagon tuition assistance with its 90/10 ratio at 89%. Only its de-rating has a business event under it, and that event is one quarter's phasing.

LOPEAPEIGHCPRDOSTRALINCUTICOURCHGGLAUREDUTALTuition-Share Service FeesOnline Higher EducationMilitary Tuition AssistanceEnrollment DemographicsNursing & Allied Health CapacityTitle IV Compliance
TickerCompanySegmentTrend · 13mo30D1Y
The subject · what this brief is about
LOPEGrand Canyon EducationHigher Ed Services & Operations🔴 Cont. Bear+5.7%−23.1%
APEIAmerican Public EducationHigher Ed Services & Operations⚠️ Emerging Bear+6.5%+28.6%
GHCGrahamHigher Ed Services & Operations🟢 Cont. Bull+3.0%+24.1%
Compared against · context, not the story
PRDOPerdoceo EducationCareer & Technical Training⚠️ Emerging Bear+2.1%−1.3%
STRAStrategic EducationHigher Education Institutions🌱 Emerging Bull+0.9%+6.6%
LINCLincoln Educational ServicesCareer & Technical Training⚠️ Emerging Bear−6.1%+11.1%
UTIUniversal Technical InstituteCareer & Technical Training⚠️ Emerging Bear+1.6%−32.0%
COURCourseraOnline Learning Platforms🔴 Cont. Bear−1.1%−48.9%
CHGGCheggEducation & Training Services🔴 Cont. Bear+0.2%−39.2%
LAURLaureate EducationHigher Education Institutions🟢 Cont. Bull+9.2%+34.8%
EDUNew Oriental Education & TechnologyK-12 Tutoring (China)🟢 Cont. Bull+5.0%+12.6%
TALTAL EducationK-12 Tutoring (China)🟢 Cont. Bull+8.9%+22.4%

12-month price & trend

LOPE
Grand Canyon Education
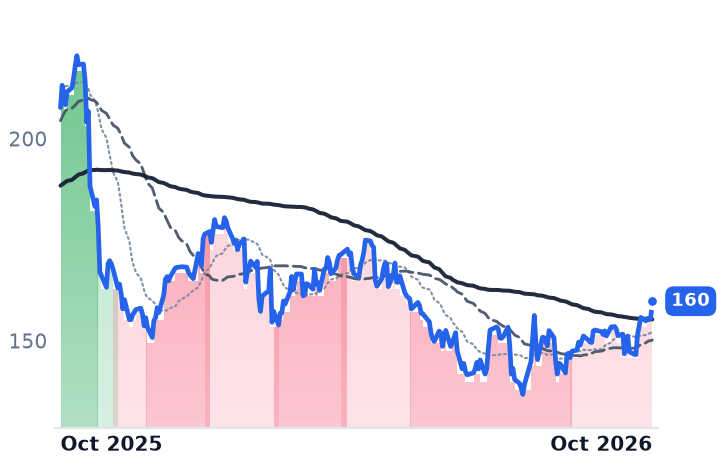
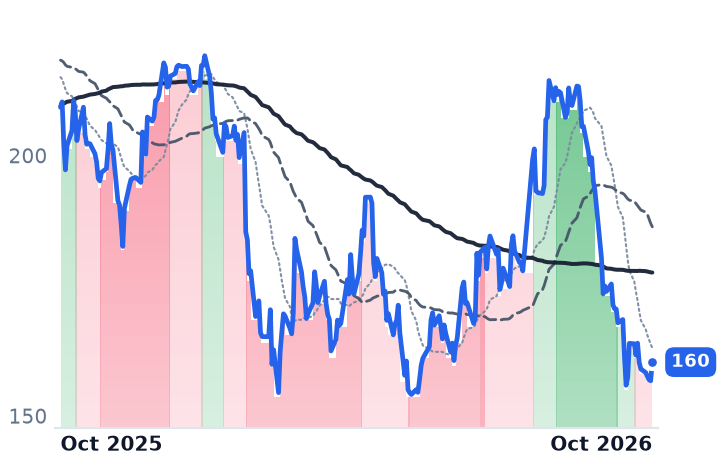
160
+4.23 (+2.72%)
vs. prior close
Price20d50d150d
LOPE 12-month price
Higher Ed Services & Operations
APEI
American Public Education
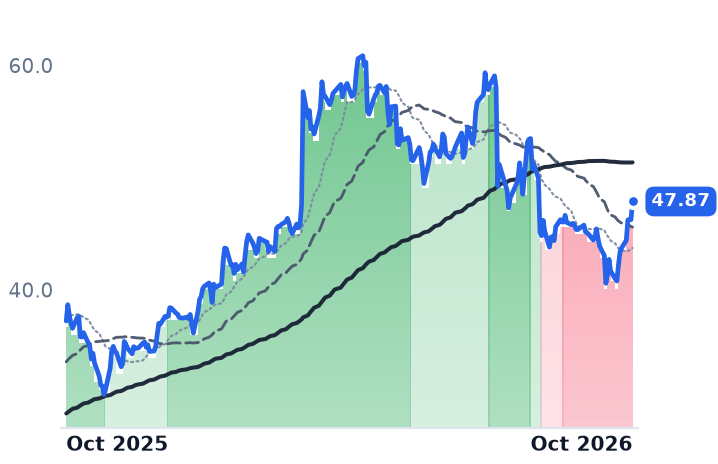
47.87
+1.62 (+3.50%)
vs. prior close
Price20d50d150d
APEI 12-month price
Higher Ed Services & Operations
GHC
Graham
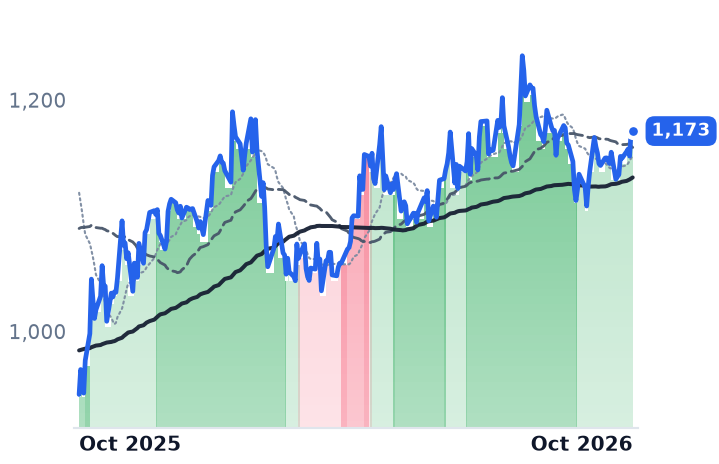
1,173
−1.26 (−0.11%)
vs. prior close
Price20d50d150d
GHC 12-month price
Higher Ed Services & Operations
TickerMkt capP/EP/E fwdP/SP/S fwdP/GPP/GP fwdEV/EBITDAFCF yld
LOPE$4.2B19.2x15.6x3.6x3.6x6.8x6.7x12.5x5.8%
APEI$878.1M19.1x18.2x1.3x1.3x2.4x2.3x12.4x8.0%
GHC$5.1B9.4x17.0x1.0x1.0x3.5x3.4x6.7x4.7%
PRDO
Perdoceo Education
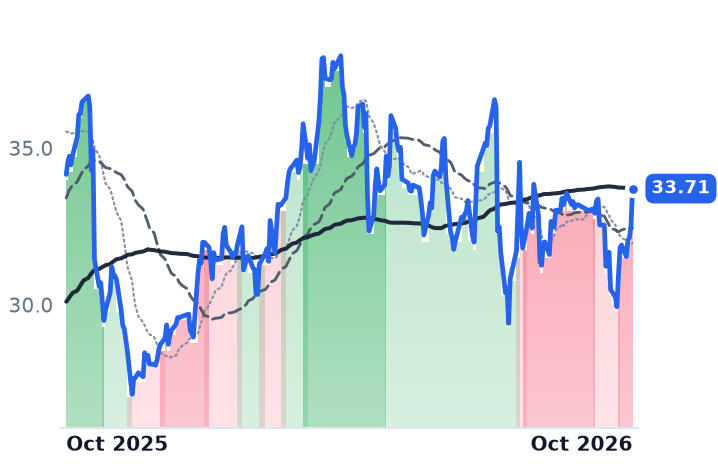
33.71
+1.18 (+3.63%)
vs. prior close
Price20d50d150d
PRDO 12-month price
Career & Technical Training
STRA
Strategic Education
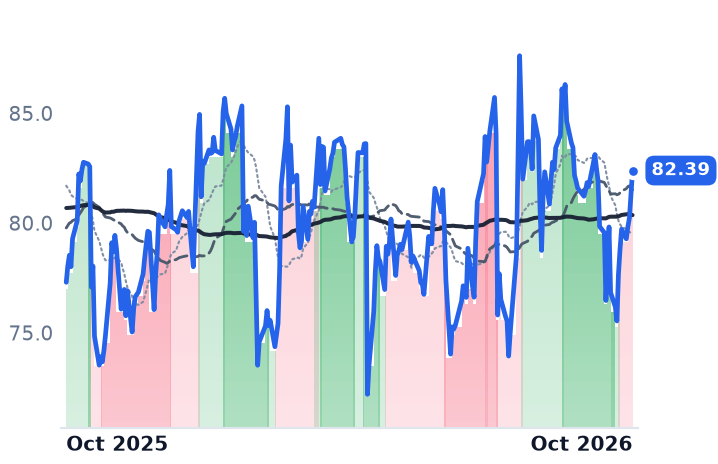
82.39
+1.08 (+1.33%)
vs. prior close
Price20d50d150d
STRA 12-month price
Higher Education Institutions
LINC
Lincoln Educational Services
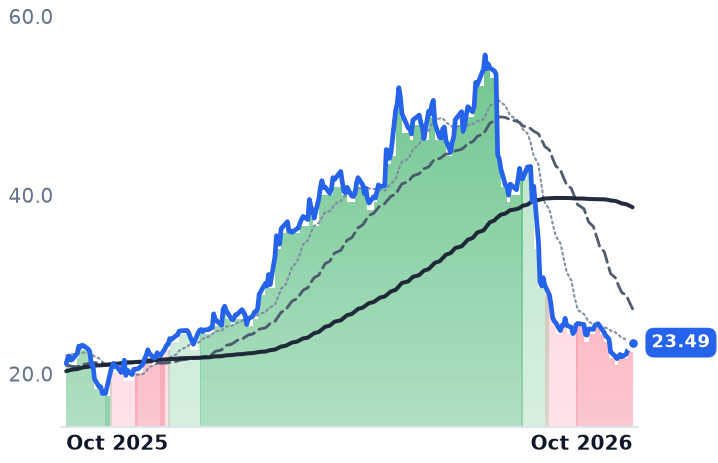
23.49
+0.63 (+2.76%)
vs. prior close
Price20d50d150d
LINC 12-month price
Career & Technical Training
TickerMkt capP/EP/E fwdP/SP/S fwdP/GPP/GP fwdEV/EBITDAFCF yld
PRDO$2.1B12.5x11.6x2.5x2.5x3.5x3.5x5.1x10.4%
STRA$1.8B13.1x11.0x1.4x1.4x2.9x2.8x7.6x9.7%
LINC$1.6B68.2x62.4x2.9x2.6x4.7x4.3x30.2x-0.6%
UTI
Universal Technical Institute
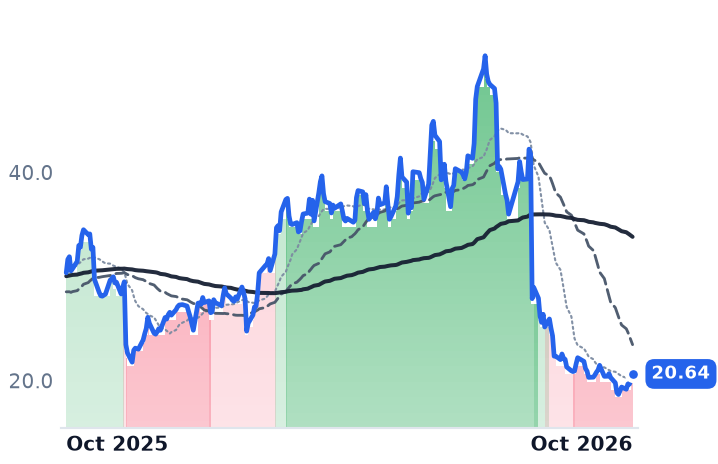
20.64
+0.53 (+2.64%)
vs. prior close
Price20d50d150d
UTI 12-month price
Career & Technical Training
COUR
Coursera
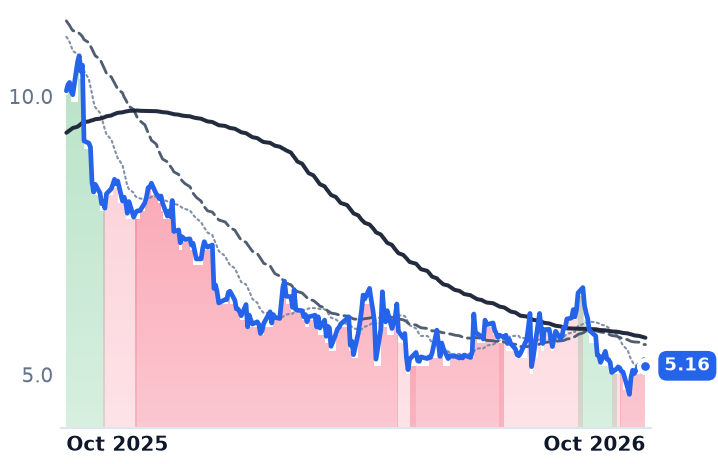
5.16
−0.11 (−2.09%)
vs. prior close
Price20d50d150d
COUR 12-month price
Online Learning Platforms
CHGG
Chegg
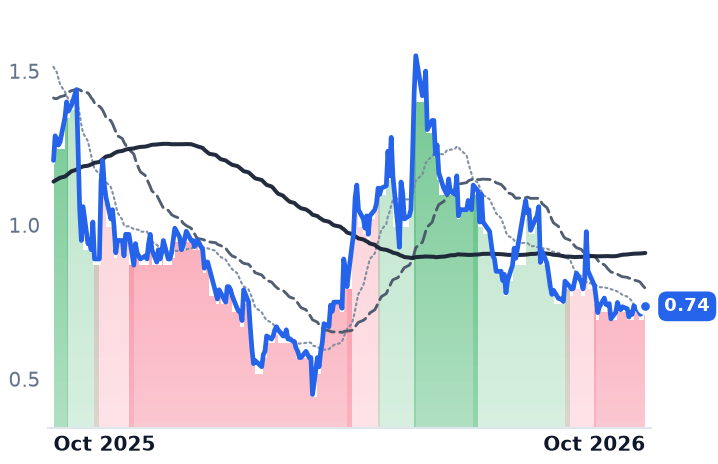
0.74
−0.00 (−0.59%)
vs. prior close
Price20d50d150d
CHGG 12-month price
Education & Training Services
TickerMkt capP/EP/E fwdP/SP/S fwdP/GPP/GP fwdEV/EBITDAFCF yld
UTI$1.2B35.6x37.0x1.4x1.4x2.3x2.2x14.0x-1.9%
COUR$893.9Mn/m12.8x1.2x1.1x2.1x2.0xn/m9.4%
CHGG$88.2Mn/m—0.3x0.4x0.6x0.7x3.0x-0.9%
LAUR
Laureate Education
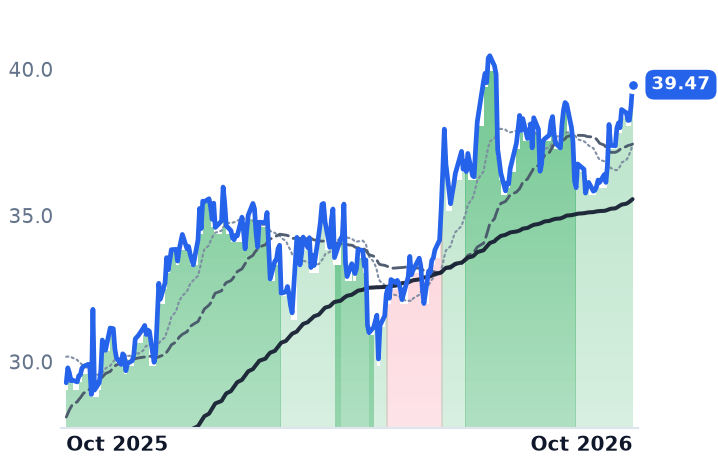
39.47
+0.74 (+1.91%)
vs. prior close
Price20d50d150d
LAUR 12-month price
Higher Education Institutions
EDU
New Oriental Education & Technology
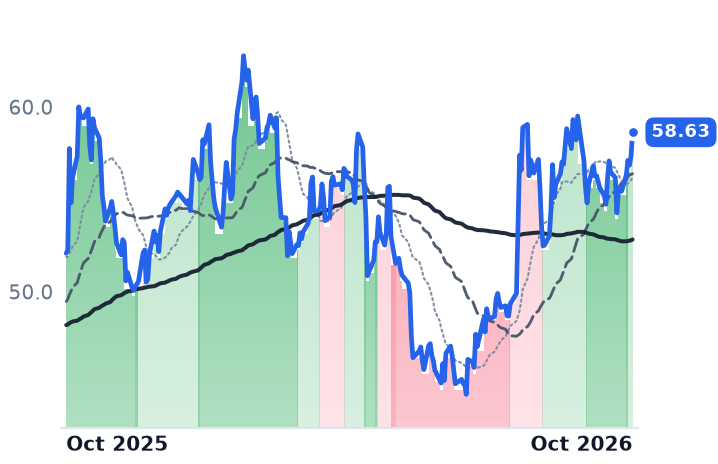
58.63
+1.31 (+2.29%)
vs. prior close
Price20d50d150d
EDU 12-month price
K-12 Tutoring (China)
TAL
TAL Education
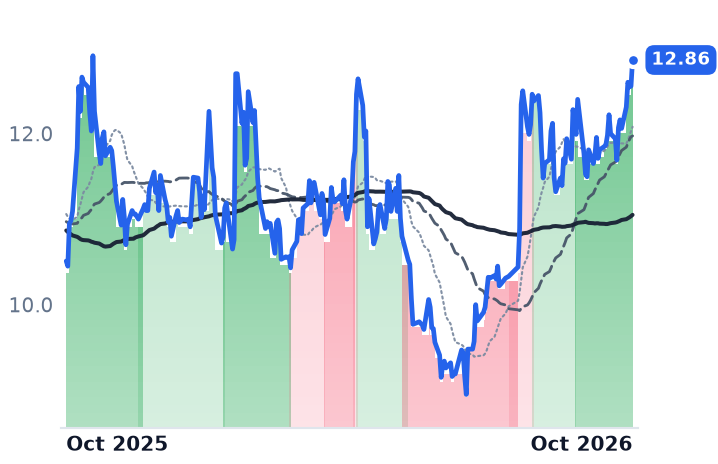
12.86
+0.30 (+2.43%)
vs. prior close
Price20d50d150d
TAL 12-month price
K-12 Tutoring (China)
TickerMkt capP/EP/E fwdP/SP/S fwdP/GPP/GP fwdEV/EBITDAFCF yld
LAUR$4.5B16.3x15.0x2.6x2.4x9.6x8.7x9.8x5.9%
EDU$9.0B19.1x13.0x1.6x1.4x2.9x2.5x11.5x8.4%
TAL$7.8B2.6x9.0x2.4x2.1x4.3x3.7x8.4x8.2%

Consensus projections

TickerFY2026EFY2027EFY2028E
LOPERevenue+5.6%+6.1%+5.8%
EPS+12.4%+10.8%+9.2%
APEIRevenue+8.0%+5.9%+6.7%
EPS+140.4%+16.7%+19.6%
GHCRevenue+4.9%+4.0%+7.4%
EPS+34.5%−2.9%+43.3%
PRDORevenue+2.6%+2.8%—
EPS+23.7%+7.9%—
STRARevenue+1.8%+4.0%+5.6%
EPS+22.5%+12.6%+20.0%
LINCRevenue+17.1%+9.0%+9.4%
EPS−4.1%+50.2%+20.2%
UTIRevenue+7.7%+8.5%+10.9%
EPS−42.9%+22.9%+70.5%
COURRevenue+7.8%+6.2%+1.5%
EPS+5.3%+27.8%+37.5%
CHGGRevenue−45.2%−21.3%—
EPS+61.4%−50.0%—
LAURRevenue+13.3%+7.2%+7.8%
EPS+28.1%+14.5%+16.2%
EDURevenue+14.8%+19.0%+12.3%
EPS+27.1%+26.3%+15.9%
TALRevenue+31.9%+25.5%+17.6%
EPS+188.3%+125.1%−13.5%

Forward fiscal years only. Blank means no analyst coverage for that year.

Grand Canyon Education does not own a university. It sells admissions and financial-aid counselling, marketing, learning technology and back-office finance to higher-education institutions, chiefly Grand Canyon University, the Phoenix nonprofit it sold itself out of in 2018, and it is paid a contractual percentage of what that university bills. On 29 July 2026 the two sides rewrote the contract. The amended and restated agreement re-bases the fee to 60% of GCU's tuition and academic-related fees alone, hands the revenue from student housing, food service, athletic tickets, the arena, hotel, golf course and apparel operations wholly back to the university, runs an initial fifteen-year term to 30 June 2041, and deletes GCU's right to terminate for convenience.

Management put the cost of the re-basing at about $20m of annual service revenue and less than $1m a quarter of operating income, because the ancillary revenue surrendered carried almost all of its own cost. That trade is the whole argument about this corner of the market. The weakness in education shares has been read as the demographic cliff arriving early; what the disclosures describe is a company whose revenue is one counterparty's billed tuition times a percentage it cannot reset, sitting beside a company whose largest payer is the Department of Defense.

A fee that can only grow on bodies

GCU has extended its tuition freeze for an 18th consecutive year. The counterparty that sets the base of the fee has chosen not to raise price, which leaves volume as the only lever. Second-quarter service revenue of $264.0m was up 6.7% on enrollments up 7.5%, to 121,921 students, of whom 113,011 study online. Divide the one by the other and the fee earned per enrolled student was about $2,166 against $2,182 a year earlier — a derived figure, and a falling one.

The margin came from cost discipline. Marketing and communication ran at 22.7% of revenue against 22.6%, counselling services at 33.4% against 33.5%, and operating income rose 12.3% to $58.2m, lifting the operating margin to 22.0% from 20.9%.

The smaller hybrid-campus business, which supports healthcare programmes for university partners, is capped by permits rather than appetite. Chief executive Brian Mueller's team told investors on 30 July that enrollment grew 8.5% across 47 active locations to nearly 6,000 students, that 14 locations are at or near capacity and need further state approvals to expand, and that 22 locations will show no year-on-year growth in new autumn enrollments because eight of them already started the maximum number of students their states authorised a year earlier.

Kaplan is paid the same way

Graham Holdings is filed as a conglomerate, with television stations, car dealerships, burners and lumber, and its education arm is usually treated as a sideline. It is not one: Kaplan's $50.3m of second-quarter operating income was 60% of the group's $83.6m, on education revenue that was only 32% of the top line. And Kaplan collects on the identical architecture — a 30-year support agreement under which it takes a fee of 12.5% of Purdue University Global's revenue, 13% for the years to 30 June 2027. Graham's education revenue fell 4% last quarter while its education operating income rose 9%.

American Public Education's payer is an appropriation

American Public Education owns its institutions outright and therefore keeps every obligation the fee collectors contracted away. In 2025, students using Pentagon tuition assistance as their primary payment source accounted for 41% of American Public University System's revenue, veterans' benefits 26% and Title IV federal student aid 19%. Since the American Rescue Plan Act, military and veterans' money counts on the federal side of the 90/10 rule, and APUS's ratio stood at 89% — one point from the limit, with the company stating it cannot assure future compliance.

The operating news was good. Second-quarter revenue rose 5.5% to $171.7m, gross margin widened to 55.4% from 51.8%, operating income nearly doubled to $13.5m, and full-year guidance was raised to revenue of $690m–$698m and diluted earnings of $2.48–$2.79. On 4 August the company folded Rasmussen University and Hondros College of Nursing into APUS, lifting the last regulatory restriction on Rasmussen's total enrollment. "The foundation is built, the business is simplified, the balance sheet is strong, and now the institutional combination is complete," chief executive Angela Selden told investors on 10 August.

The quarter after it was the problem. Third-quarter revenue was guided to $164.5m–$167.0m against consensus of $169.9m, and earnings to $0.18–$0.29 against $0.56, implying military course registrations up 1.0%–3.0% and nursing enrollment up 2.5%.

What the de-rating got right

Shares of Grand Canyon Education fell 7.0% over the two sessions after the amendment and raised guidance were published, and at $159.80 remain 22.8% below the $207.00 of a year ago. Price against trailing gross profit has compressed from roughly 10.3x then to 6.85x while that gross profit grew 7.6%; the forward multiple of 15.6x earnings sits below the trailing 19.2x. American Public Education is down 17.2% over three months and trades at 2.41x trailing gross profit, back from 3.07x in July, having given back most of a year's re-rating.

Only one of those two moves has a business event under it, and it is the smaller one: a phasing problem inside a year the company raised. The larger move has no deterioration behind it at all. The genuine damage in this industry landed on the owners of Title IV-funded campuses — Lincoln Educational Services fell from $43.20 in early August to $23.49, after reporting that enrollment grew about 9% while student starts rose about 1% "as fewer enrolled students than expected attended the first day of class", with management pointing at the restart of federal loan repayments in May 2026. A fee computed on a tuition invoice does not feel a student-credit shock the way a school that must collect from the student does.

What it feels instead is policy. The Education Department's 2011 bundled-services exception is what permits an online program manager to be paid a share of tuition at all, and the department has been soliciting comment on that exception and on the incentive-compensation prohibition it carves out of. Projections of US high-school graduates have the count peaking in 2025 and falling about 13% through 2041, even as total fall 2025 enrollment came in roughly 1% above the year before. The pipeline is a slope, not a cliff edge, and it runs the length of the new agreement.

So Grand Canyon Education has fixed its share of one university's frozen tuition until 2041, and fixed it over exactly the span in which the supply of eighteen-year-olds is expected to thin. The contract settles who gets paid and for how long. It cannot settle how many people walk through the door.

Booking Holdings Guided Its Year Assuming Seven Months of Middle East Disruption

Hypothesis Opus 5 · Research Opus 5 · Writing Opus 5 · Prompt v1.7

Online travel's September selloff was read as proof that AI booking agents will bypass the intermediaries. What October's evidence names is duller and more cyclical: long-haul air. Wells Fargo's target cut on Booking Holdings blamed prolonged Middle East conflict, and the airline industry's own forecaster has cut 2026 passenger traffic growth to 2.1% from 4.9%, while the US hotel market's revenue forecast was revised up.

Underneath one industry label, three businesses are moving apart. Booking's revenue growth halved to 8.1% year on year as its traffic bill grew faster than its bookings; Expedia's accelerated for a fourth straight quarter, to 14.0%, with operating margin far above last year's; MakeMyTrip grew gross bookings 19.9% in constant currency and reported 6.2% revenue growth, the rupee at a record low taking the difference.

BKNGEXPEMMYTTCOMABNBTRIPSPYLong-Haul Air DemandHotel RevPAR RecoveryAI Booking AgentsPerformance Marketing CostsEmerging-Market Currency Drag
TickerCompanySegmentTrend · 13mo30D1Y
The subject · what this brief is about
BKNGBookingOnline Travel Agencies🌱 Emerging Bull−7.8%−23.4%
EXPEExpediaOnline Travel Agencies🟢 Cont. Bull−2.4%+27.7%
MMYTMakeMyTripOnline Travel Agencies🔴 Cont. Bear−10.7%−51.5%
Compared against · context, not the story
TCOMTrip.comOnline Travel Agencies🔴 Cont. Bear−0.3%−45.0%
ABNBAirbnbAlternative Accommodations🟢 Cont. Bull−2.5%+39.6%
TRIPTripadvisorMarketplace & Local Services🔴 Cont. Bear−4.6%−43.6%
SPYState Street SPDR S&P 500 ETF TrustAsset Management🟢 Cont. Bull+1.9%+18.1%

12-month price & trend

BKNG
Booking
160
+3.57 (+2.28%)
vs. prior close
Price20d50d150d
BKNG 12-month price
Online Travel Agencies
EXPE
Expedia
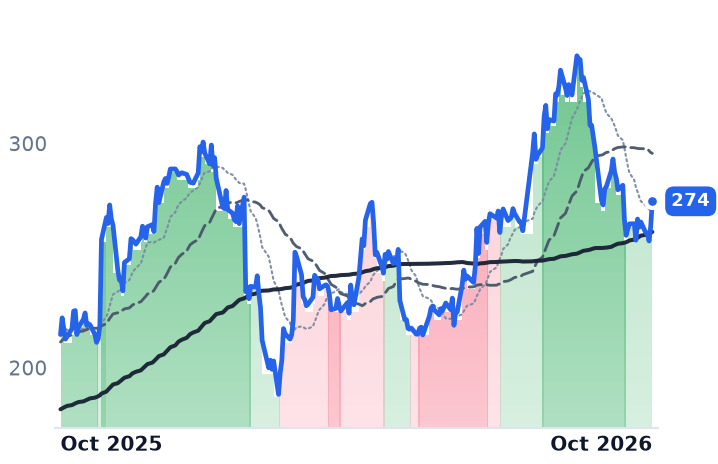
274
+11.39 (+4.33%)
vs. prior close
Price20d50d150d
EXPE 12-month price
Online Travel Agencies
MMYT
MakeMyTrip
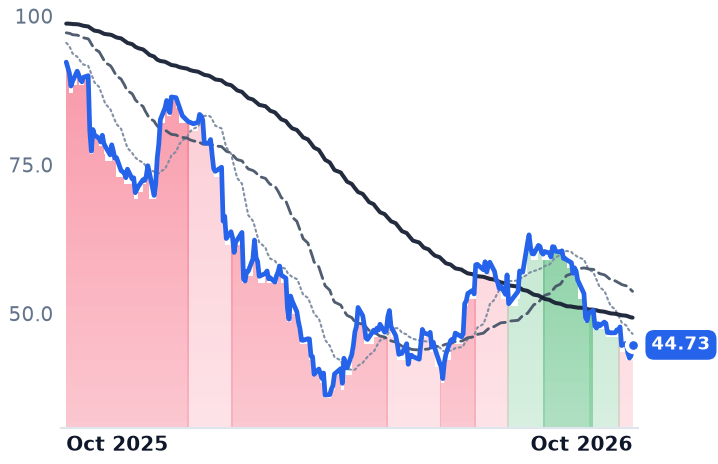
44.73
+1.85 (+4.31%)
vs. prior close
Price20d50d150d
MMYT 12-month price
Online Travel Agencies
TickerMkt capP/EP/E fwdP/SP/S fwdP/GPP/GP fwdEV/EBITDAFCF yld
BKNG$124.2B17.7x15.3x4.4x4.2x4.4x4.2x11.8x7.7%
EXPE$31.4B16.4x13.1x2.0x1.9x2.2x2.1x7.7x16.1%
MMYT$4.2B126.7x91.4x4.0x3.5x5.7x5.1x25.9x2.2%
TCOM
Trip.com
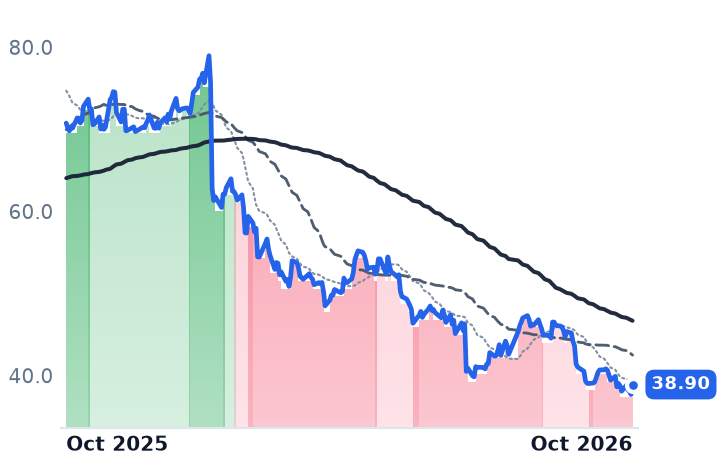
38.90
+1.21 (+3.21%)
vs. prior close
Price20d50d150d
TCOM 12-month price
Online Travel Agencies
ABNB
Airbnb
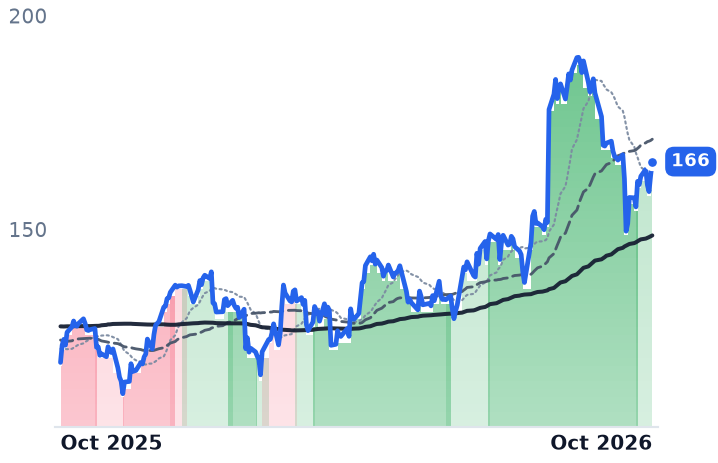
166
+3.16 (+1.94%)
vs. prior close
Price20d50d150d
ABNB 12-month price
Alternative Accommodations
TRIP
Tripadvisor
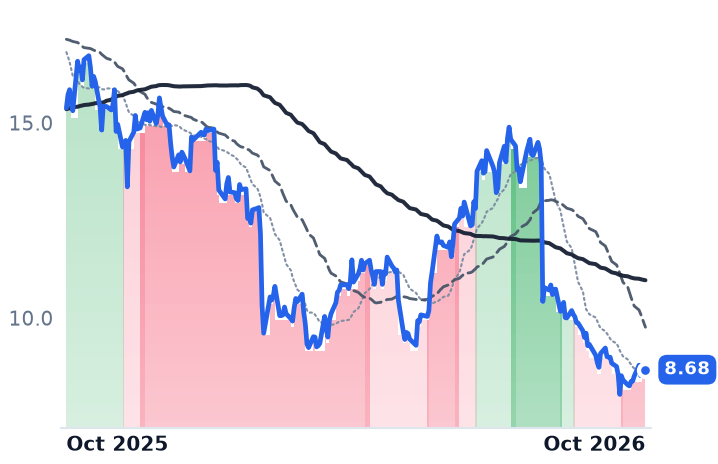
8.68
−0.01 (−0.17%)
vs. prior close
Price20d50d150d
TRIP 12-month price
Marketplace & Local Services
TickerMkt capP/EP/E fwdP/SP/S fwdP/GPP/GP fwdEV/EBITDAFCF yld
TCOM$24.7B7.0x—2.5x—3.1x—4.8x8.3%
ABNB$78.8B31.6x25.9x6.2x5.7x7.5x6.8x28.9x5.8%
TRIP$1.0B216.9x10.7x0.6x0.6x0.7x0.8x5.5x13.2%
SPY
State Street SPDR S&P 500 ETF Trust
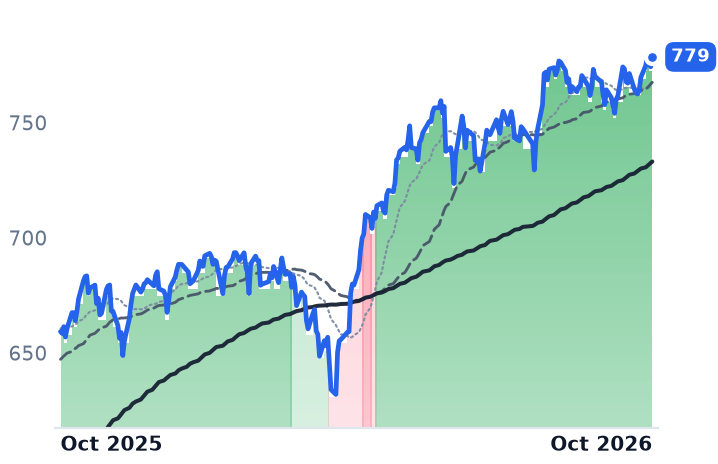
779
+4.28 (+0.55%)
vs. prior close
Price20d50d150d
SPY 12-month price
Asset Management
TickerMkt capP/EP/E fwdP/SP/S fwdP/GPP/GP fwdEV/EBITDAFCF yld
SPY$773.0B————————

Consensus projections

TickerFY2026EFY2027EFY2028E
BKNGRevenue+9.6%+9.4%+8.2%
EPS+15.0%+18.1%+16.6%
EXPERevenue+11.0%+7.1%+7.2%
EPS+36.3%+17.3%+15.1%
MMYTRevenue+12.6%+7.3%+17.1%
EPS−48.0%+12.0%+103.6%
TCOMRevenue+8.0%+8.7%+10.5%
EPS−48.5%+13.5%+12.2%
ABNBRevenue+14.6%+10.5%+10.6%
EPS+24.2%+18.1%+18.2%
TRIPRevenue−17.0%+0.6%+4.8%
EPS−40.4%+24.3%+40.4%

Forward fiscal years only. Blank means no analyst coverage for that year.

The October cut named geography, not the checkout page

Wells Fargo cut its price target on Booking Holdings, which collects a commission on hotel rooms, flights and cars it does not own through Booking.com, Agoda, Priceline, KAYAK and OpenTable, to $190 from $220 on 7 October, keeping an Equal Weight rating. The reason the bank gave was not artificial intelligence. It cited prolonged Middle East conflict pressuring long-haul demand, weighing on Booking more than peers given its geographic footprint, and trimmed its third-quarter room-night growth estimate to 5.5%.

The preceding six weeks had been read as the disintermediation trade arriving at last. Meta launched Muse, a personal AI agent able to complete a booking by itself, in the United States on 8 September; Expedia agreed on 22 September to sell hotel rooms inside it while remaining the merchant collecting the payment, and the market read the arrangement as a loss for both names, Expedia closing 5.5% lower that session and Booking 4.2%. Booking's own finance chief had already sized that channel. Referral traffic from large language models is "under 1% of room nights" and "hasn't moved so much recently," Ewout Steenbergen said on the 4 August call.

What Booking's August guidance already contained

The company's framework for the year assumed seven of its twelve months carry Middle East disruption. "We are at a high single-digit level for gross bookings and revenues and at mid-teens level for EPS at the high end," Steenbergen told investors on 4 August. Consensus has since settled where that guidance pointed: revenue up 9.6% for 2026 and earnings per share up 15.0%.

The June quarter is the base. Revenue of $7.352bn grew 8.1% year on year, half the 16.2% of the March quarter, on gross bookings of $51.0bn — a 14.4% commission take. Room nights rose 5% while marketing spend rose 11%, to $2.37bn, which management attributed on the same call to "changes in traffic mix, incremental investments in paid marketing at attractive ROIs, and a shift of merchandising spend to performance marketing." Operating margin still widened, to 34.0% from 33.1%, so the deceleration is a volume and price story rather than a cost one.

The route around it by acquisition is closed. On 9 September the EU General Court upheld the prohibition of Booking's eTraveli deal, the flight-booking purchase that would have put the air ticket next to the room night.

Meanwhile the rooms themselves are firming. CoStar and Tourism Economics raised their 2026 US revenue-per-available-room forecast to 4.4% from 2.8%. It is the flights that thinned: the International Air Transport Association cut 2026 passenger traffic growth to 2.1% from 4.9% and expects Middle East traffic to contract 11.4% in a region that handles more than 40% of global connecting traffic, on jet fuel averaging $152 a barrel against roughly $90 in 2025.

Booking closed at $160.34 on 9 October, down 24.8% from its 25 August close and 26.0% over twelve months. The shares now change hands at 15.3x forward earnings against 17.7x trailing and a ten-year average CNBC puts at 22.3x, with a 7.7% trailing free-cash-flow yield.

Expedia's year went the other way

Expedia Group, which runs Brand Expedia, Hotels.com and Vrbo alongside a wholesale arm selling travel inventory into other companies' checkout pages, has grown revenue faster for four straight quarters, reaching 14.0% in the June quarter, with operating margin at 23.9% against 14.0% a year earlier. Its business-to-business gross bookings rose 21%, to $10.74bn, against 8% in consumer bookings, and the cash it collects before guests travel — deferred merchant bookings — reached $14.4bn at 30 June against $9.3bn at year-end. It trades at 13.1x forward earnings against 16.4x trailing and is up 22.5% over twelve months, the only one of the three still higher. Chief executive Ariane Gorin told the Skift Global Forum on 23 September: "I certainly personally don't believe that a large portion of bookings are going to be an end-to-end conversational experience." A Sherman Act class action filed in Washington federal court on 2 October alleges it imposed restrictive pricing terms on hotels.

The rupee does MakeMyTrip's talking

MakeMyTrip, the Indian platform behind makemytrip.com, goibibo.com and redbus.in, grew June-quarter gross bookings 19.9% in constant currency, to $2,854.7m, with hotels and packages outgrowing air ticketing. Reported revenue grew 6.2%; the rupee touched a record low of 96.775 per dollar on 9 October, down about 9% over twelve months. Net income fell 67.8%, to $8.35m, and the shares still carry 91.4x forward earnings after a 53.0% twelve-month decline.

So the industry label describes an accounting convention, not a shared exposure. Booking's markdown is part earned: growth genuinely halved and the traffic bill is rising faster than the volume it buys, which is a margin claim on every future booking. What the October evidence does not support is the version in which the checkout page was taken away, because the hotel market it distributes was revised up and the measured AI referral share is under a hundredth of room nights. MakeMyTrip's decline is translation plus a collapsed profit line at the group's dearest multiple. Expedia's fall of 18.8% since late August has no deterioration behind it at all.

Booking's last disclosed room-night growth was 5%. Its third-quarter results are due on 3 November and Expedia's on 4 November, and the line that settles the argument is not revenue but the count of nights actually stayed.

A Cheap, Over-Stocked Propane Winter Cuts Suburban Propane's Revenue, Not Its Unit Margin

Hypothesis Opus 5 · Research Opus 5 · Writing Opus 5 · Prompt v1.7

Federal forecasters expect propane-heated households to pay less this winter, and Northeast households 15% less. For the truck that fills the tank behind a rural house that reads like lost revenue; the income statement says otherwise.

Suburban Propane is paid a spread — retail gallons multiplied by cents per gallon. In the June quarter gallons fell 1.8% while total gross margin held flat at $160.3m, the company attributing the shortfall to volume with propane unit margins steady. Adjusted EBITDA still fell to $18.0m from $27.0m on operating costs and weather 17% warmer than normal, and the units printed a 52-week low on 1 October with distribution coverage at 2.07x.

UGI, whose AmeriGas gallons fell 10%, is the exception on the other side: its share price is set by KKR's reported $42.50 bid, not by gallons.

SPHUGIATONISWXOGSNJRNWNNFGSRTLTKKRRetail Propane DistributionWinter Heating DemandMLP Distribution CoverageUtility Take-Private BidsGas-to-Electric Conversion
TickerCompanySegmentTrend · 13mo30D1Y
The subject · what this brief is about
SPHSuburban Propane PartnersOil & Gas Energy🔴 Cont. Bear+0.1%−2.4%
UGIUGIDiversified Energy Companies🟢 Cont. Bull−2.3%+19.3%
Compared against · context, not the story
ATOAtmos EnergyCore Gas Distribution🔴 Cont. Bear−0.9%−6.9%
NINiSourceIntegrated Electric & Gas Utilities⚠️ Emerging Bear−1.6%−3.3%
SWXSouthwest GasCore Gas Distribution🟢 Cont. Bull−2.3%+10.6%
OGSONE GasCore Gas Distribution🔴 Cont. Bear−6.3%−7.5%
NJRNew Jersey ResourcesGas with Midstream & Services⚠️ Emerging Bear−3.7%+15.7%
NWNNorthwest NaturalCore Gas Distribution⚠️ Emerging Bear−1.5%+11.2%
NFGNational Fuel GasMidstream & Infrastructure🔴 Cont. Bear−2.9%−6.1%
SRSpireGas with Midstream & Services🔴 Cont. Bear−2.2%−3.5%
TLTTLT—🔴 Cont. Bear—−2.6%
KKRKKRAlternative Investors🌱 Emerging Bull−10.0%−24.2%

12-month price & trend

SPH
Suburban Propane Partners
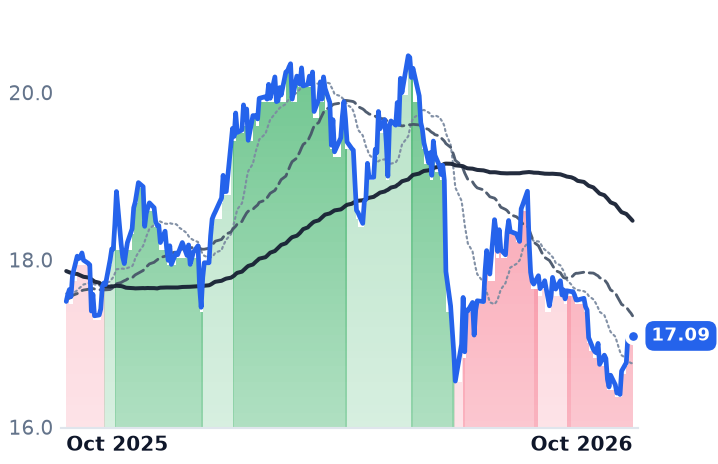
17.09
−0.02 (−0.12%)
vs. prior close
Price20d50d150d
SPH 12-month price
Oil & Gas Energy
UGI
UGI
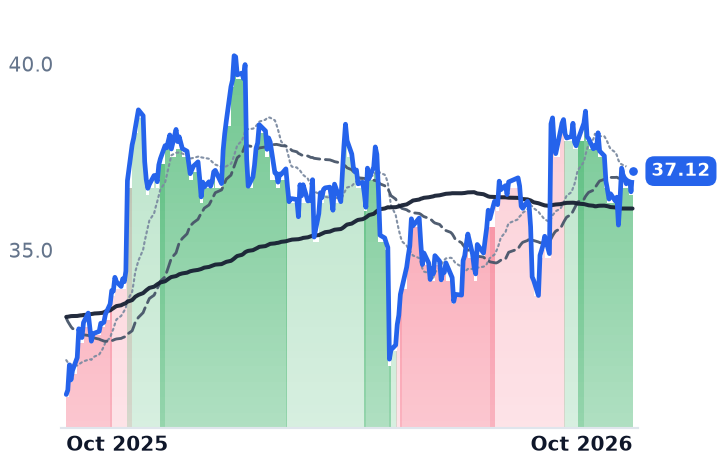
37.12
+0.56 (+1.52%)
vs. prior close
Price20d50d150d
UGI 12-month price
Diversified Energy Companies
ATO
Atmos Energy
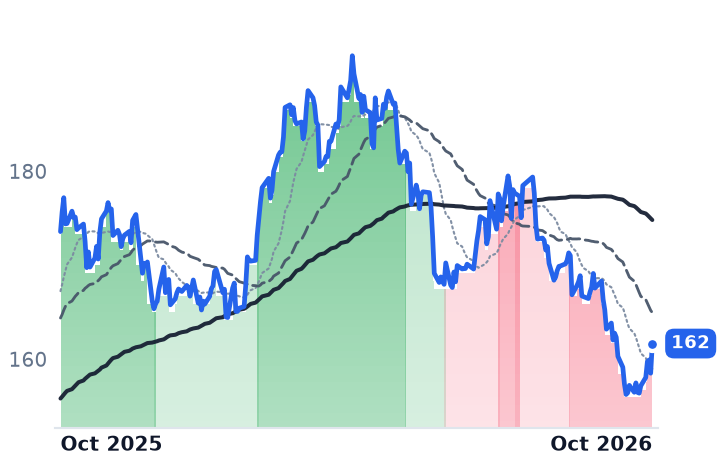
162
+3.15 (+1.99%)
vs. prior close
Price20d50d150d
ATO 12-month price
Core Gas Distribution
TickerMkt capP/EP/E fwdP/SP/S fwdP/GPP/GP fwdEV/EBITDAFCF yld
SPH$1.1B8.7x8.3x0.8x0.8x2.5x2.4x8.9x11.1%
UGI$8.0B11.9x11.5x1.1x1.0x2.3x2.2x9.2x2.3%
ATO$28.0B19.8x19.8x5.7x5.4x9.3x8.9x14.1x-7.2%
NI
NiSource
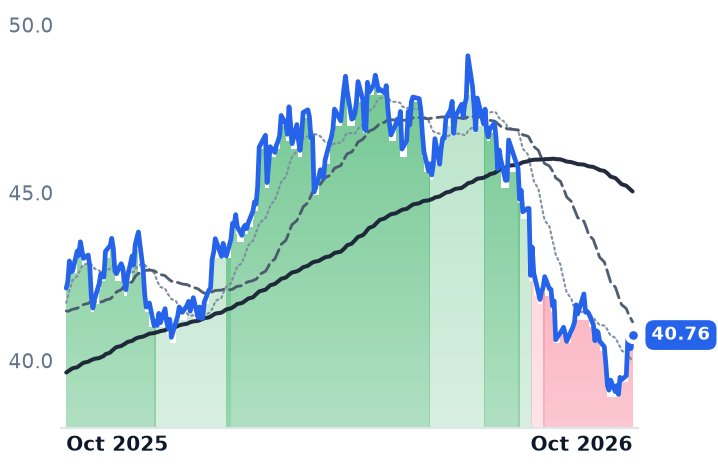
40.76
+0.40 (+1.00%)
vs. prior close
Price20d50d150d
NI 12-month price
Integrated Electric & Gas Utilities
SWX
Southwest Gas
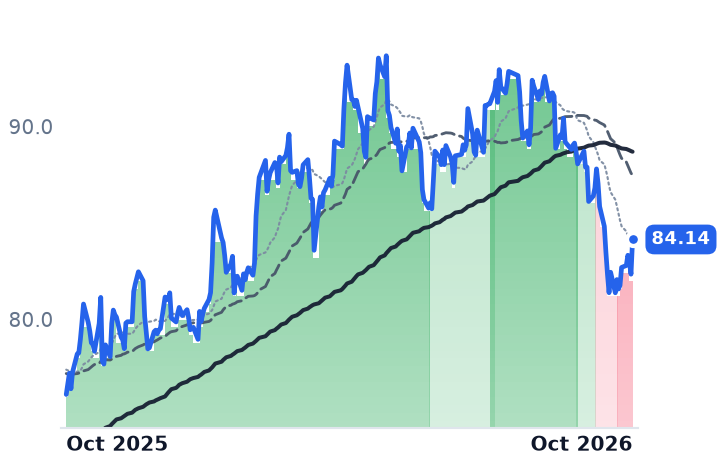
84.14
+1.80 (+2.19%)
vs. prior close
Price20d50d150d
SWX 12-month price
Core Gas Distribution
OGS
ONE Gas
72.50
+0.75 (+1.05%)
vs. prior close
Price20d50d150d
OGS 12-month price
Core Gas Distribution
TickerMkt capP/EP/E fwdP/SP/S fwdP/GPP/GP fwdEV/EBITDAFCF yld
NI$19.5B21.4x19.8x2.8x2.8x5.6x5.4x11.6x-5.6%
SWX$6.2B11.9x20.0x3.5x3.2x6.3x5.6x10.7x-13.4%
OGS$4.6B15.9x15.1x2.0x1.9x2.7x2.5x10.2x-3.7%
NJR
New Jersey Resources
51.21
+0.24 (+0.47%)
vs. prior close
Price20d50d150d
NJR 12-month price
Gas with Midstream & Services
NWN
Northwest Natural
47.73
+0.24 (+0.49%)
vs. prior close
Price20d50d150d
NWN 12-month price
Core Gas Distribution
NFG
National Fuel Gas
78.66
+0.56 (+0.72%)
vs. prior close
Price20d50d150d
NFG 12-month price
Midstream & Infrastructure
TickerMkt capP/EP/E fwdP/SP/S fwdP/GPP/GP fwdEV/EBITDAFCF yld
NJR$5.2B14.2x15.1x2.3x2.4x8.3x8.6x11.5x1.5%
NWN$2.1B16.4x16.3x1.6x1.5x3.6x3.4x9.9x-12.6%
NFG$7.5B10.9x10.7x3.0x2.5x6.1x5.1x6.5x3.0%
SR
Spire
78.42
+1.06 (+1.36%)
vs. prior close
Price20d50d150d
SR 12-month price
Gas with Midstream & Services
TLT
TLT
Price20d50d150d
TLT 12-month price
KKR
KKR
90.95
+2.41 (+2.72%)
vs. prior close
Price20d50d150d
KKR 12-month price
Alternative Investors
TickerMkt capP/EP/E fwdP/SP/S fwdP/GPP/GP fwdEV/EBITDAFCF yld
SR$4.8B9.1x20.3x1.9x1.9x5.8x5.7x5.6x-4.2%
TLT—————————
KKR$81.1B26.9x14.2x3.8x7.1x17.1x31.7x12.4x2.9%

Consensus projections

TickerFY2026EFY2027EFY2028E
SPHRevenue−3.3%+3.8%+1.0%
EPS+13.7%+3.8%+2.2%
UGIRevenue−0.7%+6.5%+3.3%
EPS−11.8%+15.3%+8.2%
ATORevenue+6.8%+7.7%+8.7%
EPS+14.2%+6.8%+8.4%
NIRevenue+15.3%+5.6%+6.3%
EPS+9.0%+9.7%+10.1%
SWXRevenue−46.3%+5.7%+6.0%
EPS−21.9%+17.4%+18.4%
OGSRevenue−2.6%+3.9%+3.7%
EPS+11.8%+2.8%+8.5%
NJRRevenue+12.7%−2.7%+4.7%
EPS+10.0%−4.0%+7.6%
NWNRevenue+5.0%+6.9%+3.6%
EPS+5.3%+5.0%+5.8%
NFGRevenue+6.2%+18.7%−2.5%
EPS+6.3%+2.5%+1.1%
SRRevenue+1.8%+12.4%+4.9%
EPS−11.0%+36.6%+12.3%
KKRRevenue+43.7%+8.6%+25.4%
EPS+28.7%+15.2%+14.4%

Forward fiscal years only. Blank means no analyst coverage for that year.

Federal energy forecasters told households on 6 October that heating with propane will cost less this winter, about 3% less than last. In the Northeast the saving is larger: the Energy Information Administration, the statistical arm of the US Department of Energy, expects both lower prices and decreasing consumption to pull propane-heating expenditures down 15% against a year earlier. For a distributor whose revenue is gallons multiplied by a price, that is a smaller top line arriving just as the season starts.

It is also close to irrelevant to what Suburban Propane Partners earns. The master limited partnership distributes propane, fuel oil and refined fuels to roughly 1 million residential, commercial, industrial and agricultural customers across 42 states from about 700 locations, and its profit is a unit margin: cents on each retail gallon, the spread between a wholesale cost it pays and a posted retail price it sets. Cheap, well-supplied propane is the friendly end of that arrangement. Inventories stood at 103m barrels in the week to 26 September, about 13m barrels above the previous five-year average, with Gulf Coast stocks some 21% above theirs, and the Mont Belvieu wholesale benchmark was quoted at $0.919 a gallon on 6 October.

The June quarter separated gallons from gross profit

Suburban's fiscal third quarter, ended 27 June, is the cleanest demonstration available. Retail propane gallons came to 70.6 million, down 1.8%, against average temperatures across its service territories 17% warmer than normal. Total gross margin was $160.3m, unchanged from a year earlier, and the company's release attributed the underlying $3.9m decline excluding mark-to-market effects "primarily due to lower propane volumes sold, as propane unit margins remained steady."

The weather did not take the margin; it took the volume, and the volume loss was smaller than the weather implied. Chief executive Michael Stivala said the quarter's volumes "benefited from continued strength and growth in our counter-seasonal customer base," with May and June running ahead of the prior year on agricultural, industrial and national-account business.

What did deteriorate was the earnings line below the margin. Adjusted EBITDA fell to $18.0m from $27.0m on higher operating costs alongside the warmth, and revenue inched up 0.5% to $261.4m.

The socket count is the slow problem

Neither protagonist can buy its way out of attrition. US retail propane distribution is a roughly $15-20bn market growing between zero and 1%, or slightly negative, losing an estimated 0.7% of home heating-oil and propane accounts a year to natural gas and electric conversions, and there were no tracked retail propane acquisitions by the national operators in the 2025-26 year. AmeriGas was a net seller, having divested its Hawaii operations. Against that, roughly 2% net attrition at both Suburban and AmeriGas compares with the 4.2% base-business attrition Star Group reported for the twelve months to March 2026.

Inside UGI, propane is one dollar of four — and none of them sets the price

UGI Corporation owns AmeriGas, which serves about 1.4 million propane customers from 1,600 distribution points, and reports it beside a Pennsylvania utility delivering gas to roughly 672,000 customers, a midstream and marketing book, and a European liquefied petroleum gas arm. The propane leg had the worse quarter by far: retail gallons fell 10% to 124 million and AmeriGas segment earnings before interest and taxes dropped $25m, with April temperatures 16% warmer than the prior year. Underneath, net debt at AmeriGas came down roughly $270m in the quarter, with new paper issued at 6.875% retiring notes carrying coupons up to 9.375%. "We're very confident the leverage is going to be sub 4," chief financial officer Sean O'Brien told investors on 6 August. "We think by the end of the year, we have a shot to be sub 4."

Group guidance of $2.75-$2.90 in adjusted earnings per share for fiscal 2026 implies a down year against $3.09 reported for fiscal 2025, and at 11.5x forward earnings against 11.9x trailing, UGI is the cheapest reading among the listed gas distributors. None of that is what moves the stock. KKR offered about $9bn, or $42.50 a share, in an approach first reported on 18 August, and the gap to that number has widened since early September, from 10.7% below the offer on 4 September to 12.7% below it on 9 October, with no board response or agreement discoverable.

How much of Suburban's low the business explains

Some of it, and not most. Suburban's units closed at a 52-week low of $16.39 on 1 October, 20.7% beneath their $20.68 high, then recovered 4.3% over the following six sessions. One soft quarter is real, and an adjusted loss of $0.27 a unit came in wider than the $0.19 consensus loss. But the two meters that would signal distress did not move: trailing distribution coverage was 2.07x and the total consolidated leverage ratio 4.35x, the same as a year earlier, with the quarterly distribution held at $0.325 a unit — a 7.6% yield at the 9 October close and an unbroken run of 31 years.

The rest looks like a sector repricing that Suburban happened to sit inside. Every listed gas distributor fell over the 30 days to 9 October, and Suburban's 2.0% decline was the mildest of the group, against 8.1% at ONE Gas and 5.2% at National Fuel Gas; the long-Treasury proxy was unchanged over both 30 and 90 days, so no fresh move in long yields arrived to explain the month. At 8.9x trailing EV/EBITDA and 8.3x forward earnings against 8.7x trailing, Suburban is priced for no growth at all, while the single-analyst consensus for fiscal 2026 looks for revenue down 3.3% to $1.40bn with EBITDA up 4.8% to $307.6m — the decoupling, drawn forward a year, on one forecaster's work.

Both companies close their books on 30 September and have historically reported the full year in mid-November; no date has been announced. Nothing in the October outlook tells either of them how cold January will be, and the gallon count remains the number the weather owns. The spread is the half they set themselves, and an overstocked market has handed them the easier half.

Software's AI Scare Reversed Without Checking Whose Subscriptions Were Growing

Hypothesis Opus 5 · Research Opus 5 · Writing Opus 5 · Prompt v1.7

Five software companies filed under the same vertical-software label bill customers on completely different meters — a bank's asset size, a contractor's construction volume, seats, cloud consumption, the monthly accounting close — and since April the market has repriced them as one thing.

Appian's cloud subscription revenue grew 23% in the June quarter, its fastest in more than two years. Freshworks' net dollar retention slipped to 104%, the only retention figure of the five going the wrong way. Both shares rose by roughly similar amounts over six months, and Appian's price against trailing gross profit went from 3.07x in May to 5.10x while gross profit grew 14.2%.

Appian and Procore, whose backlog due within a year grew 22%, have results behind them. Freshworks does not, nCino's subscription line is slowing, and BlackLine's 6% annual recurring revenue growth explains why it was left out of the rally.

APPNNCNOPCORBLFRSHVertical SaaSConsumption-Based PricingLow-Code AutomationConstruction SoftwareNet Revenue RetentionAI Disruption Risk
TickerCompanySegmentTrend · 13mo30D1Y
The subject · what this brief is about
APPNAppianDeveloper Platforms & APIs🌱 Emerging Bull+15.4%+40.6%
NCNOnCinoCommerce & Digital Payments🌱 Emerging Bull−7.2%−20.2%
PCORProcore TechnologiesIndustry-Specific Platforms🔴 Cont. Bear+5.5%−21.7%
Compared against · context, not the story
BLBlackLineOther🔴 Cont. Bear+5.0%−40.7%
FRSHFreshworksSales, Service & Customer Management🟢 Cont. Bull+17.1%+23.7%

12-month price & trend

APPN
Appian
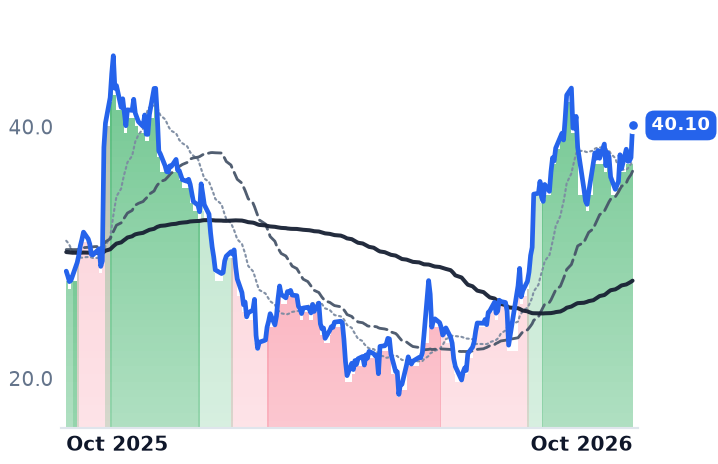
40.10
+2.56 (+6.81%)
vs. prior close
Price20d50d150d
APPN 12-month price
Developer Platforms & APIs
NCNO
nCino
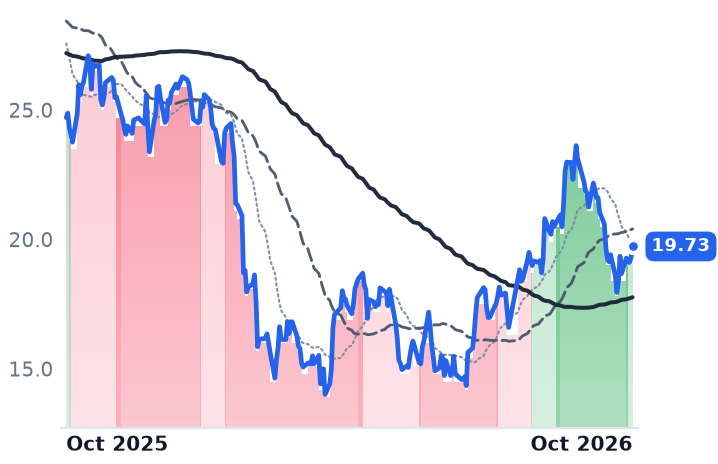
19.73
+0.44 (+2.28%)
vs. prior close
Price20d50d150d
NCNO 12-month price
Commerce & Digital Payments
PCOR
Procore Technologies
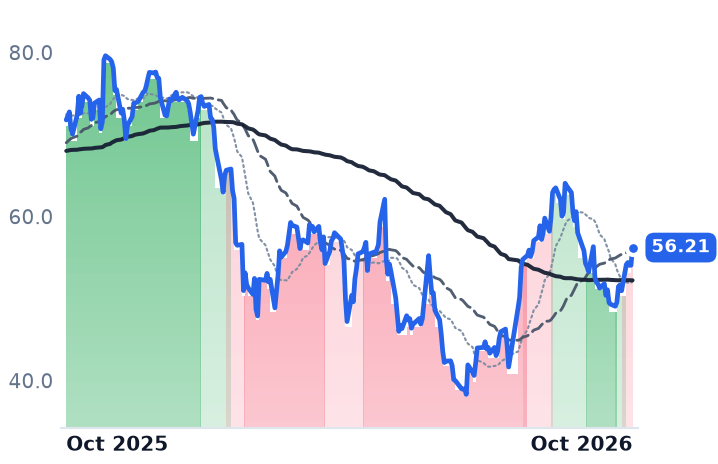
56.21
+2.15 (+3.98%)
vs. prior close
Price20d50d150d
PCOR 12-month price
Industry-Specific Platforms
TickerMkt capP/EP/E fwdP/SP/S fwdP/GPP/GP fwdEV/EBITDAFCF yld
APPN$3.0Bn/m37.1x3.7x3.5x5.1x4.8x140.7x2.6%
NCNO$2.2B63.6x15.1x3.5x3.3x5.6x5.4x26.1x6.1%
PCOR$9.4Bn/m36.6x6.6x6.2x8.2x7.7x147.7x3.1%
BL
BlackLine
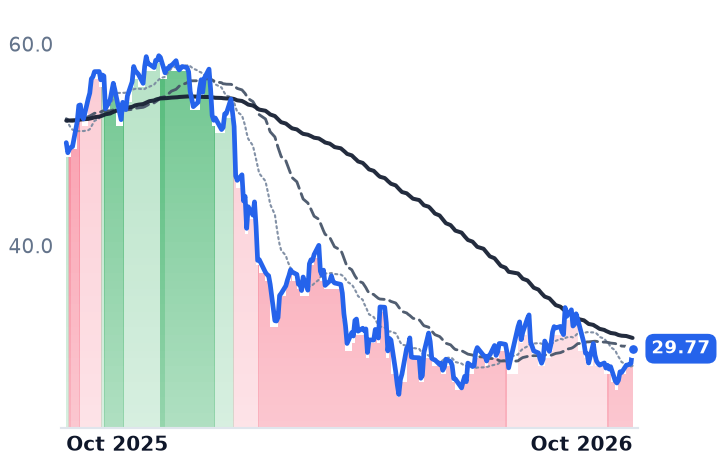
29.77
+1.45 (+5.14%)
vs. prior close
Price20d50d150d
BL 12-month price
Other
FRSH
Freshworks
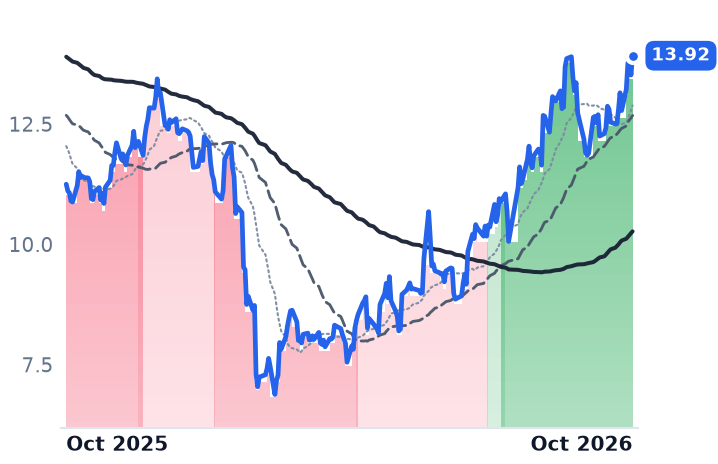
13.92
+0.40 (+2.96%)
vs. prior close
Price20d50d150d
FRSH 12-month price
Sales, Service & Customer Management
TickerMkt capP/EP/E fwdP/SP/S fwdP/GPP/GP fwdEV/EBITDAFCF yld
BL$1.7B49.8x11.8x2.3x2.2x3.1x3.0x21.4x9.9%
FRSH$3.8B21.2x20.8x4.3x4.0x5.0x4.7x47.3x6.5%

Consensus projections

TickerFY2026EFY2027EFY2028E
APPNRevenue+19.1%+10.8%+7.4%
EPS+104.0%+31.1%+11.4%
NCNORevenue+9.8%+9.0%+8.5%
EPS+25.2%+44.5%+20.0%
PCORRevenue+15.3%+13.9%+14.4%
EPS+24.2%+46.2%+19.0%
BLRevenue+9.5%+10.4%+10.3%
EPS+19.7%+10.9%+18.0%
FRSHRevenue+15.6%+14.2%+15.4%
EPS+5.4%+24.0%+18.4%

Forward fiscal years only. Blank means no analyst coverage for that year.

Appian's cloud subscription revenue grew 23% in the June quarter, the fastest pace in more than two years, and the low-code automation company swung to positive operating cash flow. The professional-services arm that a turnaround story usually shrinks grew 20% as well, and gross margin fell.

April's selloff was read as a verdict on business models: artificial intelligence would let customers assemble their own applications, and software vendors with no infrastructure of their own would be hollowed out. The S&P 500 software and services index fell more than 26% from late January to its April low, then posted its biggest July-to-September quarterly gain since the second quarter of 2020, closing on 6 October at its highest since November 2025. If the recovery were a repricing of software paid off a customer's volumes instead of its headcount, the five names shelved together as vertical vendors would have separated by now. They have not. Their subscription meters have.

Five companies, five different bills

nCino, which sells banks and credit unions a platform for onboarding, lending and deposit accounts, left seat pricing in fiscal 2025 for tiers set by a client's asset size, saying the aim was "aligning its revenues to the usefulness the nCino Platform provides"; its contracts are non-cancellable and typically run three to five years. Procore, whose platform runs preconstruction, project and financial management for owners and contractors, invoices a year upfront against the construction volume a customer manages on it, and passed $1 trillion of annual contracted volume as of its third-quarter 2025 results, so cash and backlog move before revenue.

Appian sells a consumption-priced cloud subscription plus the services to stand up a customer's first workflows, competing with Pegasystems, Microsoft's Power Platform and the tier above it, ServiceNow. Freshworks sells seats of help-desk and information-technology service software. BlackLine sells the monthly accounting close.

Appian and Procore brought results; the multiples went further

Appian's cloud subscriptions reached $131.7m and adjusted EBITDA came in at $16.2m against guidance of $5m to $8m; operating cash flow was $12.1m against $1.9m used a year earlier, and full-year cloud guidance went to $525m–$529m. Cloud net annualized recurring revenue expansion was 115%, against 113% a year earlier and 115% the prior quarter. Services revenue of $45.6m held a flat 22.4% of the total, gross margin compressed 305 basis points to 71.2%, and group gross profit grew 14.2% — while the price against trailing gross profit went from 3.07x in May to 3.63x in late July to 5.10x now, a 66% expansion.

Morgan Stanley has not endorsed that move: Overweight with a $45 target in January, cut to Equal-Weight on 30 April with the target to $25, then lifted to $32 in August.

Procore is the one case where the forward meter outran the reported one. Current remaining performance obligation reached $1,072.5m, up 22% against 15.8% revenue growth, accelerating by 100 basis points, with 58% of the $193m increase from customers won in the prior twelve months. Operating income turned positive at $4.3m on a generally accepted accounting principles basis, from a $30.3m loss. Underneath it, US construction starts ran 15.2% higher year-to-date through August, with nonresidential starts up 23.4%. Procore trades at 7.47x trailing gross profit, below the 7.96x of early May.

A mortgage rate and a stalled base

nCino's revenue grew 8% and subscription revenue 10%, or 12% excluding US mortgage — the mortgage book is subtracting roughly two points, with rates above 7% against the Mortgage Bankers Association's 6% to 6.5% forecast for 2026. Third-quarter guidance implies 7% to 8% growth at the midpoints. "We are seeing many of our largest customers consolidating more of their most critical operations on nCino," chief executive Sean Desmond said on 25 August, alongside a $100m repurchase program. The shares are rated about where they were: 5.65x trailing gross profit against 5.52x in May.

BlackLine is the one that behaved. Annual recurring revenue of $719m grew 6%, net revenue retention was 102.4% and current remaining performance obligation grew 11% — the weakest meters of the five. "I believe the first half of 2026 will prove to be the most consequential period in BlackLine's history," chief executive Owen Ryan told investors. At 3.16x trailing gross profit and a 9.75% trailing free cash flow yield it is the cheapest here, and the cheapness is doing rational work.

The proof is Freshworks

Freshworks' net dollar retention fell to 104% from 106% on 16% revenue growth, and its price against trailing gross profit rose 55% from 3.24x in May to 5.01x — the same order of re-rating as Appian's, on the only retention number here that is deteriorating. Over the six months to 9 October the seat-priced vendor rose 84% and Appian 98%, while Procore gained 19% and nCino 13%.

So the accelerations are real at two of the five, and the repricing did not depend on them. Expected 2026 earnings growth for the software sector has climbed to 20.6% from 13.8% at the end of March, and that reset is the likelier common factor. "AI has been more of an enabler for a lot of these software companies, more than a disruptor," Adam Turnquist, chief cross-asset strategist at LPL Financial, said of the move.

The last month supports that reading. Appian and Freshworks have held their uptrends; Procore rolled over in September and nCino fell about 10% in thirty days, the opposite of what a durable re-rating of volume-indexed revenue would look like.

None of these companies has spoken since August. Appian reports again on 5 November, and the number that matters is not the revenue line it prints but whether customers kept expanding faster than they lapsed once the sector stopped doing the lifting.

Planet Fitness Grew Revenue on an Ad Levy and Equipment Resales, Not on Busier Gyms

Hypothesis Opus 5 · Research Opus 5 · Writing Opus 5 · Prompt v1.7

Planet Fitness is more profitable than it was a year ago and its shares are worth about half as much, and the reason sits in what its revenue line measures. Of the $16.1m rise in franchise-segment revenue last quarter, $10.1m came from lifting franchisees' national advertising contribution to 3% of sales from 2%, money that passes through to media buying; barely a tenth came from busier clubs.

A further 23.4% of group revenue was exercise machinery resold to franchisees, mostly replacements, which makes that line franchisee borrowing. The markdown came from guidance, with same-club sales cut to roughly 1%. The two names filed alongside it went their own ways: Life Time raised dues on nearly flat membership, and Peloton is harvesting a shrinking subscription base.

PLNTLTHPTONFranchise Royalty EconomicsGym Membership GrowthEquipment Resale & CapexSBA Franchise LendingFitness Subscription ChurnValue Pricing Elasticity
TickerCompanySegmentTrend · 13mo30D1Y
PLNTPlanet FitnessFitness & Wellness🔴 Cont. Bear−4.0%−48.8%
LTHLife TimeFitness & Wellness🟢 Cont. Bull−2.1%+60.0%
PTONPeloton InteractiveFitness & Wellness🌱 Emerging Bull+3.0%−26.4%

12-month price & trend

PLNT
Planet Fitness
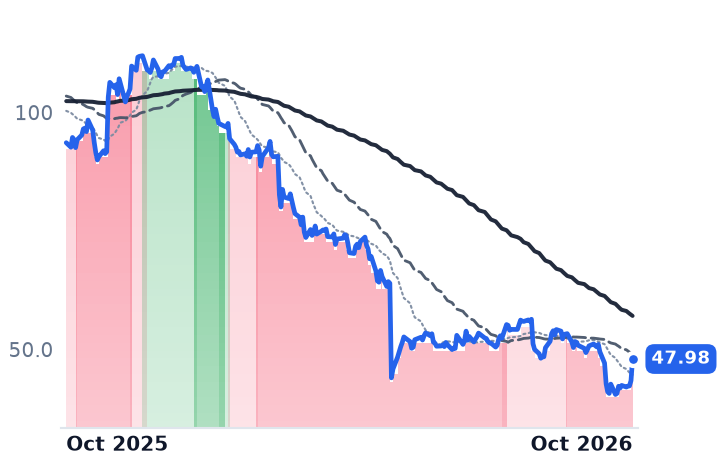
47.98
+4.55 (+10.48%)
vs. prior close
Price20d50d150d
PLNT 12-month price
Fitness & Wellness
LTH
Life Time
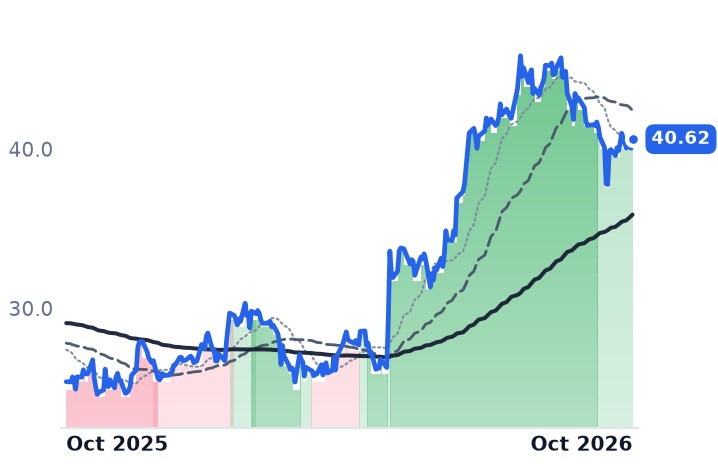
40.62
+0.57 (+1.42%)
vs. prior close
Price20d50d150d
LTH 12-month price
Fitness & Wellness
PTON
Peloton Interactive
5.12
+0.25 (+5.13%)
vs. prior close
Price20d50d150d
PTON 12-month price
Fitness & Wellness
TickerMkt capP/EP/E fwdP/SP/S fwdP/GPP/GP fwdEV/EBITDAFCF yld
PLNT$3.8B16.3x14.8x2.7x2.7x5.4x5.3x10.6x6.9%
LTH$9.1B21.6x25.4x2.9x2.7x4.1x3.9x14.1x-1.7%
PTON$2.1B35.8x15.9x0.9x0.9x1.7x1.7x15.5x18.5%

Consensus projections

TickerFY2026EFY2027EFY2028E
PLNTRevenue+8.2%+6.9%+8.4%
EPS+6.9%+12.5%+15.5%
LTHRevenue+12.6%+12.0%+10.9%
EPS+17.6%+14.3%+9.8%
PTONRevenue−1.1%−2.8%−0.9%
EPS−131.8%+143.7%+2.0%

Forward fiscal years only. Blank means no analyst coverage for that year.

Planet Fitness reported rising profit through a year in which its shares lost roughly half their value, and the gap sits in what its revenue line actually measures. Of the $16.1m increase in franchise-segment revenue in the second quarter, $10.1m came from raising franchisees' national advertising fund contribution to 3% of sales from 2%, money that passes through to media buying. Busier clubs contributed $1.7m.

The shares are held as a claim on 21.5 million gym memberships paying monthly dues. What the company is paid is narrower: a royalty on franchisees' dues, an advertising levy it is obliged to spend, the takings of the clubs it owns outright, and the exercise machinery it resells to its own franchisees. That last line came to $85.6m in the quarter, or 23.4% of group revenue, and what it tracks is franchisee borrowing.

Eighty-five percent of it was replacement equipment for clubs already open, bought by franchisees borrowing at Small Business Administration 7(a) rates that ran from 9.75% to 13.25% variable in May.

The franchise segment itself, the royalty annuity most owners of the stock think they are buying, came to $135.8m, or 37.2% of revenue. Royalties within it rose $4.7m, and $2.5m of that was simply clubs opened since April 2025 entering the base, with another $0.5m from higher royalties on annual fees. The 1.7% gain in franchise same-club sales produced $1.7m.

The markdown landed on dues the company has not collected yet

The quarter was good. Revenue rose 7.1% to $365.2m, operating income 20.9% to $123.8m, and diluted earnings per share reached $0.87 against $0.69 a year earlier. System membership hit 21.5 million, up 3.6%, with Black Card penetration around 68%, up 210 basis points. Part of the earnings gain was bought: diluted shares fell 8.4% year on year after about $200m of stock was retired in the quarter, funded partly by a $75m note drawdown that adds $4m of annual interest.

What the market marked down was the future dues line. On May 7 the shares fell 31.19% in a session, from $63.96 to $44.01, after the company cut same-club sales guidance to roughly 1% from 4-5% and adjusted net income to a decline of about 2% from growth of 4-5%, having added just over 700,000 net members in the first quarter against roughly a million a year before. Management blamed messaging that missed its audiences, competition in select markets, weather and the macro backdrop; shelving a national Black Card price increase cost about 150 basis points of the comp outlook by itself. A securities fraud class action followed the drop.

The answer was price. From August 31 through September 10 the company ran a $1-down, $10-a-month Classic Card offer, with that rate protected for the member's lifetime.

"As we evaluate any pricing decisions in our architecture, whether they're tiers, regional nuance, or something with Black Card, we're going to evaluate the price elasticity in conjunction with join mix, as well as total sustainable net member growth, and impact on churn," chief executive Colleen Keating told investors on August 6.

On October 9 the shares rose 10.5% to $47.98, their best day of the year, after UBS reiterated a Buy rating with a target of $80, citing September and early-October membership strength and the $10 promotion. The same day RBC Capital cut its target to $60 from $65 and Baird to $60 from $72, both keeping Outperform.

The rival bid for the same ten-dollar member is better funded now

Planet Fitness accounts for roughly 27% of all US gym memberships, and its four nearest low-price rivals together hold about 5m members. The pressure comes through amenities: Crunch Fitness, with about 3m members across some 516 clubs, and EoS Fitness, with about 1m across 127, are opening large-format clubs with infrared saunas and heated group classes. Crunch grew its club count 17% in 2024 and took a majority investment from Leonard Green & Partners in April 2025.

Life Time charges $245 a month and barely adds members

Life Time, which builds and runs resort-style athletic clubs with pools, courts, cafes and childcare, collects its dues directly and is really a property developer. Revenue rose 13.7% to $866.0m in the second quarter and operating income 38.0% to $149.7m, on average monthly dues of $245, up about 12.3%, with centre memberships up 1.2% to roughly 860,000. Adjusted EBITDA margin widened 80 basis points to 28.5% and net leverage fell to 1.4x. The buildings pay for the buildings: about $400m of sale-leasebacks closed in 2026, first-quarter rent rose 10.7% to $89.9m, and $33m to $35m of interest was expected to be capitalized this year. "Even after $400 million of sale-leasebacks each year, we will continue to grow our owned real estate portfolio as well as grow positive free cash flow," founder and chief executive Bahram Akradi said. Equity holders pay 14.1x trailing EV/EBITDA for that, a third more than Planet Fitness's 10.6x, on a trailing free-cash-flow yield of minus 1.7%.

Peloton, which sells connected bikes and treadmills with class subscriptions, operates no clubs. Subscription revenue rose 7% to $437m in its fiscal fourth quarter while hardware fell 14% to $171m, lifting recurring revenue to 72% of the total; subscription adjusted gross margin reached 73.6% against 13.4% on the machines. Subscriptions themselves fell 8.8% to 2.553m and churn rose to 2.2%. Fiscal 2026 brought $378m of free cash flow against a $2.14bn market value, and chief executive Peter Stern attributed guided revenue weakness to "churn created by subscription price hikes implemented last year."

One shelf, three different payers

Filed in one classification, these three share nothing on the demand side. Over twelve months to October 9 Life Time gained 57.5%, Peloton lost 30.3% and Planet Fitness lost 49.1%, a spread of 107 points under one interest-rate backdrop. Since January only one session saw two of them move more than 9% on the same day, August 6, and that was two separate earnings reports landing the same morning.

The split runs on income. US gym membership reached a record 81 million in 2025 with low-price brands taking above-average growth, yet members earning over $75,000 a year hold just over half of all memberships and the heaviest users earn more than $150,000. Life Time can price families up 12% a year on that base. Planet Fitness went to $10 to defend volume.

So the halving is not explained by what Planet Fitness reported, and only partly by what it will report. Consensus now has 2026 EBITDA falling 2.1% to $611.1m, the first forecast contraction in the series, which makes part of the de-rating from roughly 40.8x trailing earnings in January to 16.3x today rational work. The rest rides on whether a $10 join price buys back the member growth the dues architecture was supposed to deliver.

Meanwhile the revenue line will keep misleading. Both of the company's 2026 cadences, system openings and equipment placements, are weighted to the fourth quarter, so the year's closing revenue print will be decided largely by how much franchisees are willing to borrow at double-digit rates. It will be read as a verdict on how many people joined a gym.

Record Data-Center Cooling Orders at Modine, AAON and Trane Cost All Three Gross Margin

Hypothesis Opus 5 · Research Opus 5 · Writing Opus 5 · Prompt v1.7

The market treated data-center cooling as a demand story and sold it after one late-July report. Demand was not what cracked; the profit on converting orders was.

Modine's Data Centers segment nearly doubled sales to $348.6m on a third consecutive quarter of record orders, AAON's backlog rose 98% to $2.0bn, and Trane booked a record $12.1bn backlog. Every one of them lost gross margin, and AAON cut its full-year gross-margin guidance by two percentage points while raising sales-growth guidance.

The division among them is financial leverage to a single end market. Modine and AAON, both building plant and shipping units priced at award date, now trade at 12.9x and 14.3x gross profit against roughly 18x in May; Trane's multiple is where it was.

MODAAONTTVRTData-Center CoolingHVAC Equipment MakersHyperscaler CapexBacklog ConversionCopper Input CostsCapacity Expansion Ramp
TickerCompanySegmentTrend · 13mo30D1Y
The subject · what this brief is about
MODModine ManufacturingThermal & Powertrain Components⚠️ Emerging Bear+0.3%+25.0%
AAONAAONHVAC Systems⚠️ Emerging Bear+12.2%−13.2%
TTTrane TechnologiesHVAC Systems⚠️ Emerging Bear+8.5%+15.5%
Compared against · context, not the story
VRTVertivData Center Power & Thermal⚠️ Emerging Bear−2.2%+43.7%

12-month price & trend

MOD
Modine Manufacturing
182
+0.09 (+0.05%)
vs. prior close
Price20d50d150d
MOD 12-month price
Thermal & Powertrain Components
AAON
AAON
86.16
−0.89 (−1.02%)
vs. prior close
Price20d50d150d
AAON 12-month price
HVAC Systems
TT
Trane Technologies
477
+7.09 (+1.51%)
vs. prior close
Price20d50d150d
TT 12-month price
HVAC Systems
TickerMkt capP/EP/E fwdP/SP/S fwdP/GPP/GP fwdEV/EBITDAFCF yld
MOD$9.6B68.0x24.1x2.9x2.4x12.9x10.7x33.7x1.0%
AAON$7.1B44.4x36.2x3.7x3.1x14.3x12.0x25.2x-1.7%
TT$104.9B35.9x31.2x4.7x4.4x13.4x12.5x24.9x3.4%
VRT
Vertiv
243
−5.82 (−2.34%)
vs. prior close
Price20d50d150d
VRT 12-month price
Data Center Power & Thermal
TickerMkt capP/EP/E fwdP/SP/S fwdP/GPP/GP fwdEV/EBITDAFCF yld
VRT$97.1B55.8x37.5x8.5x6.9x22.2x18.2x38.2x3.0%

Consensus projections

TickerFY2026EFY2027EFY2028E
MODRevenue+22.6%+29.0%+14.9%
EPS+33.4%+50.1%+38.0%
AAONRevenue+65.6%+17.6%+16.3%
EPS+68.8%+51.4%+26.3%
TTRevenue+11.7%+9.7%+8.8%
EPS+17.4%+15.5%+15.4%
VRTRevenue+37.1%+30.2%+21.3%
EPS+62.9%+36.7%+26.4%

Forward fiscal years only. Blank means no analyst coverage for that year.

Modine Manufacturing, which builds coils, chillers and air handlers to order for hyperscale data centers and for vehicle makers, nearly doubled sales in its data-center business in the June quarter and lost more than nine percentage points of gross margin doing it. The segment reported $348.6m against $183.7m a year earlier, and its gross margin came in at 20.2%, 960 basis points below the prior year, because shortages of certain key components limited what the plants could produce.

The complex was sold in late July on the premise that hyperscalers were about to stop ordering heat-rejection gear. On the evidence the three largest listed sellers of that gear have published, the ordering never slowed. What slipped is the money earned turning an order into a shipped unit, and that distinction is the whole argument now sitting in front of three reports due in the next month.

The order book is the part that is working

Neil D. Brinker, Modine's president and chief executive, said demand remains robust "as evidenced by three consecutive quarters of record order intake leading to the company's backlog nearly doubling over the past year." Part of the franchise is pre-sold rather than bid project by project: an agreement guarantees Modine's ability to supply more than $4bn of Airedale cooling products between 2027 and 2029, against a $165m upfront payment earmarked for expanding production capacity. Its anchor data-center customers have been reported as Google and Amazon; order visibility and customer concentration are the same disclosure read twice.

Group revenue rose 28.0% to $874.1m, yet gross profit rose 10.0% and operating income fell 1.2%. On the 30 July call management quantified the drag: component shortages cost 450 to 550 basis points of Data Centers margin through unfavorable overhead absorption, labor deliberately carried through supply-chain downtime. Guidance was left at 20-35% revenue growth with Data Centers sales up 60-80% and segment margins above 20% in the second half. Modine is also spinning Performance Technologies, its vehicular business, into a merger with Gentherm through a Reverse Morris Trust, leaving shareholders roughly 40% of the combined company and expected to close by the end of calendar 2026.

AAON's constraint is floor space, and it costs margin

AAON, which sells rooftop units through independent sales representatives and custom data-center cooling through its BasX division, doubled sales to $627.0m in the June quarter, with BASX-branded sales up 216% to $345m and total backlog up 98% to $2.0bn. The legacy book grew too: AAON-branded sales rose 39.3% and that backlog 9.4%.

Gross margin fell 2.2 points, and the company cut its full-year gross-margin range to 25-26% from 27-28% while raising sales growth to 55-60%. Chief executive Matt Tobolski attributed the squeeze to "the mix impact of exceptionally strong growth, ramp-up activity associated with new capacity and price/cost timing dynamics" — a unit quoted months ago, built from metal that has since repriced. Three-month copper on the London Metal Exchange touched a record $13,387.50 a tonne on 8 September and has traded above $14,300 since; JPMorgan forecasts aluminium near $3,800 a tonne this quarter. AAON has added roughly a million square feet at Longview, Texas and Memphis, Tennessee, and its trailing free-cash-flow yield is minus 1.68%: the plant is being funded out of current cash flow. Its shares now trade at 14.3x gross profit against 18.4x in early May, though at 36.2x forward earnings it remains the dearest of the three.

The one that didn't have to de-rate

Trane Technologies, the applied-systems vendor whose chiller bookings are the cleanest published read on hyperscaler capex converting into construction, booked a record $7.8bn of orders, a 123% book-to-bill with every segment above 100%, record backlog of $12.1bn and applied-equipment bookings up 130%, a fourth straight quarter above 100% growth. Trane lost 2.0 points of gross margin as well, from a 35.6% base that absorbs it. Its price-to-gross-profit is 13.4x against 13.8x in May, and 31.2x forward earnings against consensus revenue growth of 11.7% this year.

What the shares did

The repricing was one session. On 29 July, after Vertiv reported 24% revenue growth and fell 17% on the day, Modine closed down 14.4%, AAON 9.5% and Trane 4.9%. Over three months to 9 October Modine is down 22.9% and AAON 20.2% while Trane rose 1.0%; measured from their highs since September 2025, Modine sits 40.8% below and AAON 41.9%, Trane 5.3%. The underlying bear case predates July: at CES on 6 January, Nvidia's Jensen Huang said next-generation Vera Rubin racks run coolant at 45C inlet "with no chillers necessary," and cooling shares fell hard that day. Vertiv's published answer was that "using higher-temperature water does not eliminate the need for heat rejection".

The margin cuts justify some of the de-rating; the order books justify none of it. Modine's 12.9x gross profit against 17.96x on 3 May, and a 24.1x forward multiple against consensus revenue of $4.06bn next fiscal year, up 29%, is a business whose estimates have not followed its price. The reason Trane sat out the fall is structural: diversified revenue, a gross margin nearly two-thirds higher than Modine's, and no plant ramp to fund. Modine and AAON are the levered expressions of one end market, converting award-priced backlog while building the capacity to convert it, and that is where a two-point margin miss turns into a 40% drawdown.

Modine reports on 27 October, Trane on 29 October and AAON about 5 November. The question those three prints settle is narrow and answerable: whether the margin on a shipped chiller recovers once the components arrive, or whether building to a price agreed last year is simply what this business now earns.

Palo Alto and CrowdStrike Booked Orders Faster Than Revenue; Their Shares Ran Faster Still

Hypothesis Opus 5 · Research Opus 5 · Writing Opus 5 · Prompt v1.7

Palo Alto Networks is paid for displacing several incumbent vendors at once, and it grants free use of its platforms until the customer's old contracts lapse. That pushes the money into deferred revenue and leaves the reported revenue line unable to show whether the strategy is working. Its remaining performance obligation grew 34% last fiscal year, well ahead of revenue; CrowdStrike's net new contracted revenue grew 51%, roughly twice its revenue growth; Cloudflare, which bills by the request, shows a one-point gap between the two.

The order books support the business case. The prices have gone further: a dollar of Palo Alto's trailing gross profit costs 42.3x today against 20.2x on 3 May 2026, and a dollar of CrowdStrike's costs 69.0x against 32.1x. CrowdStrike's apparent twelve-month collapse is a four-for-one stock split showing through unadjusted closing prices; adjusted, those twelve months are up 116%.

PANWCRWDNETZSFTNTOKTASRBRKTENBQLYSPlatform ConsolidationCybersecurity SoftwareDeferred Revenue & BookingsRecurring Revenue ModelsEndpoint & Cloud Security
TickerCompanySegmentTrend · 13mo30D1Y
The subject · what this brief is about
PANWPalo Alto NetworksCybersecurity & Threat Protection🟢 Cont. Bull+22.2%+100.8%
CRWDCrowdStrikeCybersecurity & Threat Protection🔴 Cont. Bear+29.0%−44.3%
NETCloudflareNetwork & Application Delivery🟢 Cont. Bull+16.8%+68.8%
Compared against · context, not the story
ZSZscalerAI & Data Intelligence🌱 Emerging Bull+40.4%−24.6%
FTNTFortinetNetwork Security Appliances🟢 Cont. Bull+21.7%+134.5%
OKTAOktaIdentity & Access Management🟢 Cont. Bull+36.4%+159.8%
SSentinelOneCybersecurity & Threat Protection🟢 Cont. Bull+30.9%+52.3%
RBRKRubrikOther🟢 Cont. Bull+37.7%+52.0%
TENBTenableCybersecurity & Threat Protection🟢 Cont. Bull+26.3%+43.1%
QLYSQualysCybersecurity & Threat Protection🟢 Cont. Bull+19.7%+57.1%

12-month price & trend

PANW
Palo Alto Networks
419
+9.32 (+2.27%)
vs. prior close
Price20d50d150d
PANW 12-month price
Cybersecurity & Threat Protection
CRWD
CrowdStrike
275
+12.03 (+4.57%)
vs. prior close
Price20d50d150d
CRWD 12-month price
Cybersecurity & Threat Protection
NET
Cloudflare
361
+11.35 (+3.25%)
vs. prior close
Price20d50d150d
NET 12-month price
Network & Application Delivery
TickerMkt capP/EP/E fwdP/SP/S fwdP/GPP/GP fwdEV/EBITDAFCF yld
PANW$341.3B910.4x100.0x29.7x24.1x42.3x34.2x221.6x1.2%
CRWD$280.1B—219.6x51.9x46.6x69.0x62.0x631.5x0.6%
NET$128.1Bn/m286.2x51.0x44.7x70.3x61.5x—0.3%
ZS
Zscaler
234
+15.92 (+7.31%)
vs. prior close
Price20d50d150d
ZS 12-month price
AI & Data Intelligence
FTNT
Fortinet
195
+3.69 (+1.93%)
vs. prior close
Price20d50d150d
FTNT 12-month price
Network Security Appliances
OKTA
Okta
232
+11.92 (+5.41%)
vs. prior close
Price20d50d150d
OKTA 12-month price
Identity & Access Management
TickerMkt capP/EP/E fwdP/SP/S fwdP/GPP/GP fwdEV/EBITDAFCF yld
ZS$31.9Bn/m40.4x9.5x8.1x12.4x10.6x176.0x2.7%
FTNT$132.8B63.3x52.5x17.6x16.4x21.9x20.3x45.0x2.3%
OKTA$34.0B121.2x52.2x11.1x10.6x14.2x13.5x84.6x2.9%
S
SentinelOne
26.27
+1.07 (+4.23%)
vs. prior close
Price20d50d150d
S 12-month price
Cybersecurity & Threat Protection
RBRK
Rubrik
125
+5.04 (+4.20%)
vs. prior close
Price20d50d150d
RBRK 12-month price
Other
TENB
Tenable
41.59
+1.98 (+5.00%)
vs. prior close
Price20d50d150d
TENB 12-month price
Cybersecurity & Threat Protection
TickerMkt capP/EP/E fwdP/SP/S fwdP/GPP/GP fwdEV/EBITDAFCF yld
S$7.2Bn/m61.3x6.9x6.0x9.3x8.1xn/m0.6%
RBRK$22.0Bn/m212.0x14.2x13.0x17.8x16.2xn/m1.5%
TENB$2.4Bn/m11.0x2.3x2.2x3.0x2.8x23.3x11.1%
QLYS
Qualys
202
+4.79 (+2.42%)
vs. prior close
Price20d50d150d
QLYS 12-month price
Cybersecurity & Threat Protection
TickerMkt capP/EP/E fwdP/SP/S fwdP/GPP/GP fwdEV/EBITDAFCF yld
QLYS$3.2B15.9x11.9x4.6x4.4x5.6x5.3x11.4x9.2%

Consensus projections

TickerFY2026EFY2027EFY2028E
PANWRevenue+24.3%+24.1%+14.3%
EPS+15.5%+10.8%+16.1%
CRWDRevenue+22.2%+25.0%+22.7%
EPS−1.2%+34.9%+27.6%
NETRevenue+33.7%+28.4%+27.0%
EPS+38.1%+32.6%+34.3%
ZSRevenue+25.2%+17.9%+16.3%
EPS+29.2%+18.3%+14.7%
FTNTRevenue+20.2%+11.3%+11.1%
EPS+28.0%+9.4%+13.1%
OKTARevenue+12.0%+10.9%+10.0%
EPS+24.3%+14.1%+10.6%
SRevenue+22.4%+19.9%+17.6%
EPS+723.4%+83.7%+43.0%
RBRKRevenue+48.7%+32.0%+21.5%
EPS−90.5%−389.4%+52.5%
TENBRevenue+8.4%+7.1%+6.9%
EPS+27.0%+10.5%+10.1%
QLYSRevenue+8.6%+7.0%+6.6%
EPS+8.6%+9.2%+5.3%

Forward fiscal years only. Blank means no analyst coverage for that year.

Palo Alto Networks waits out its rivals' paperwork. It sells hardware and software firewalls plus subscription security services to large enterprises, service providers and governments, and it wins those accounts by granting free use of its platforms until the contracts the customer already signed elsewhere expire. The economics move into deferred revenue, which means the reported revenue line of a company selling platform consolidation cannot show the thing being sold.

Ten listed security vendors rose double digits over the thirty days to 9 October, an advance read as the market finally paying for that consolidation: one supplier taking over several incumbents' jobs across a customer's estate. The contracted order books support the business half of the reading at all three of the large names that disclose them. The price half has run well past it. Each dollar of Palo Alto's trailing gross profit cost 20.2x on 3 May 2026 and 42.3x now, while the distance between its trailing and forward multiples implies gross-profit growth only in the teens.

The quarter it wins hardest is the quarter revenue looks slowest

"We believe we can build customer confidence in our platforms by approaching them well before their point product contracts expire. After we gain their contractual commitment, we have offered an extended roll out period where we can demonstrate our ability to deliver these platform benefits," chairman and chief executive Nikesh Arora said when he introduced the no-cost bridge; the company said at the time that revenue growth would run lower than expected for 12 to 18 months as a result.

It is now measurable in both directions. In fiscal 2026 Palo Alto displaced legacy vendors in nearly 100 accounts representing more than $400m of total contract value, nearly double the prior year, and annual billings rose to roughly 30% of bookings from 27%. Revenue grew 24.5% to $11.48bn. Next-generation security annual recurring revenue grew 63% to $9.10bn, remaining performance obligation grew 34% to $21.2bn, and the current portion of it also rose 34%, to $9.3bn. Hardware is down to 19.9% of revenue. "Platformization is the only viable strategy for real time defense," Arora told investors on 1 September.

Two caveats ride with those meters. Palo Alto closed its $21.1bn purchase of the identity vendor CyberArk on 11 February 2026, lifting revenue and the recurring-revenue figure at once, which is why fiscal 2027 guidance puts that meter up 22% to 23% against the 63% just reported. Gross margin fell just over three percentage points to 70.4%, and reported profit is no help at all: full-year GAAP net income fell 72.9% to $307m on acquisition amortization. Cash reads cleaner, with adjusted free cash flow up 35% to $4.41bn.

A stock split made the best twelve months look like a loss

The same machine runs a step further along at CrowdStrike, which sells endpoint, cloud, identity and log-management modules on its Falcon platform. In the quarter to 31 July it reported record net new annual recurring revenue of $333m, up 51%, against revenue growth of 26% — the fifth consecutive quarter of revenue acceleration — with ending contracted revenue of $5.84bn. The pool of pre-committed dollars customers draw down across modules, sold as Falcon Flex, more than doubled to $2.29bn, and gross retention held at 97%. Full-year net-new guidance was raised 6.3 percentage points, to about 34% growth.

"We are in an arms race. AI is driving more cyber attacks. AI is driving more cyber spending," founder and chief executive George Kurtz told investors on 26 August.

The price record disguises all of this. The board approved a four-for-one stock split on 3 June 2026, and unadjusted closes show a 46% twelve-month fall — a mechanical discontinuity, not a market move. Split-adjusted, the same twelve months are up 116%, the strongest of the four names here. The re-rating is not disguised: a dollar of trailing gross profit cost 32.1x on 3 May and 69.0x now, 62.0x on forward estimates, for a company holding roughly a fifth of the endpoint market against Microsoft Defender for Endpoint's 15% to 20%, with the standing risk that Microsoft bundles more of it.

Cloudflare bills requests, so its revenue keeps up

Cloudflare is the useful stress case. Its edge network charges by the request and by contract, and second-quarter revenue grew 36% while current remaining performance obligation grew 35% — a one-point gap, against the 2.6-times gap at Palo Alto. Customers spending over $100,000 a year reached 4,698, up 27% and 73% of revenue, with dollar-based net retention at 120%. "For the first time in human history, in Q2, more than 50% of the traffic flowing across Cloudflare's network was not human," co-founder and chief executive Matthew Prince said on 6 August. Gross margin fell to 71.8% from 74.9% as inference compute displaced software mix; no AI revenue line is broken out. On trailing gross profit it is the dearest of the three at 70.3x, 61.5x forward, against 45.4x in early May.
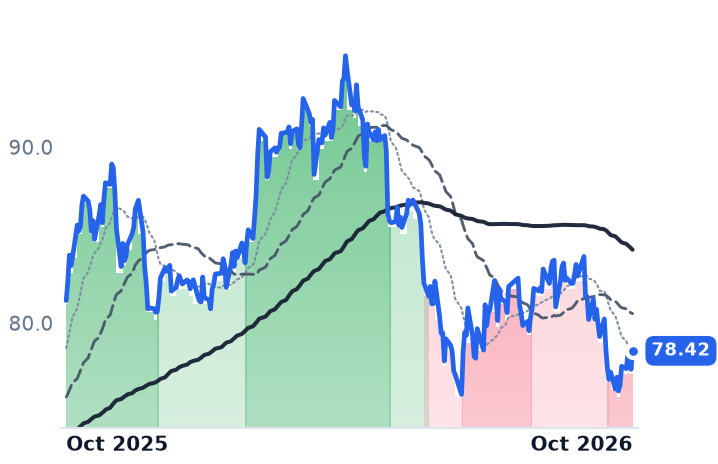
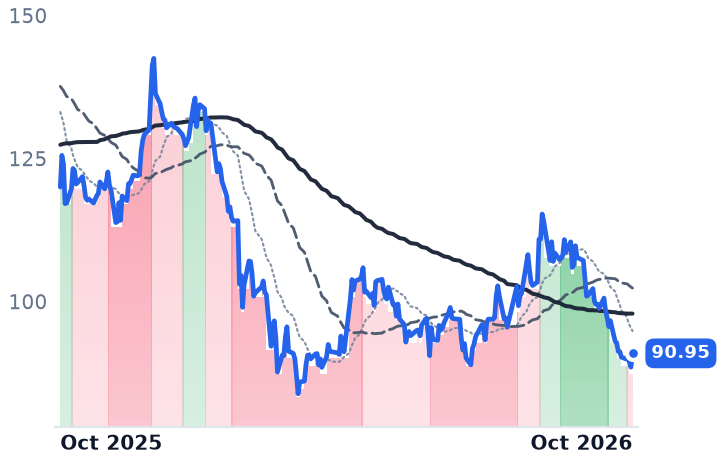
One print set four prices

The thirty-day move traces to a single report. On 27 August, the session after CrowdStrike's results, CrowdStrike rose 21.3%, Palo Alto 12.8%, Zscaler 11.0% and Cloudflare 8.7%; Palo Alto's own print three days later cost it 13% over two sessions before it recovered. Software stocks have reached their highest level since November 2025 as the sector's expected 2026 earnings growth climbed to 20.6% from 13.8% at the end of March, per LSEG data. Zscaler shows how little the meters mattered: the strongest thirty-day gainer of the ten at 41.5%, carrying a price-to-gross-profit of 10.1x in late July — roughly a fifth of CrowdStrike's on the same date — while guiding the slowest growth of the group at 16.6% to 17.4% contracted-revenue growth.

So the order books explain the direction and almost none of the magnitude. Palo Alto's deferral is real, documented and self-inflicted, and its wins land in the obligation line first; CrowdStrike's commitment pool converts at twice the pace revenue shows; Cloudflare's dollar arrives as it is consumed, which is why its gap is one point and its margin is falling. What none of the three supplies is five months of gross-profit growth equal to a doubled multiple. Consensus sits between 10% and 19% above trailing gross profit at each name, derived from the trailing and forward multiples themselves, and the re-rating was several times that.

The free period is the whole strategy and the whole exposure. A customer who commits today may not be billed until a competitor's contract lapses, so the prices set in August rest on revenue nobody will recognize for a year or more. One soft quarter of net new contracted revenue would not disprove the mechanism — it would simply be the only evidence anyone gets to see.