

A Cheap, Over-Stocked Propane Winter Cuts Suburban Propane's Revenue, Not Its Unit Margin
Hypothesis Opus 5 · Research Opus 5 · Writing Opus 5 · Prompt v1.7
Federal forecasters expect propane-heated households to pay less this winter, and Northeast households 15% less. For the truck that fills the tank behind a rural house that reads like lost revenue; the income statement says otherwise.
Suburban Propane is paid a spread — retail gallons multiplied by cents per gallon. In the June quarter gallons fell 1.8% while total gross margin held flat at $160.3m, the company attributing the shortfall to volume with propane unit margins steady. Adjusted EBITDA still fell to $18.0m from $27.0m on operating costs and weather 17% warmer than normal, and the units printed a 52-week low on 1 October with distribution coverage at 2.07x.
UGI, whose AmeriGas gallons fell 10%, is the exception on the other side: its share price is set by KKR's reported $42.50 bid, not by gallons.
| Ticker | Company | Segment | Trend · 13mo | 30D | 1Y |
|---|---|---|---|---|---|
| The subject · what this brief is about | |||||
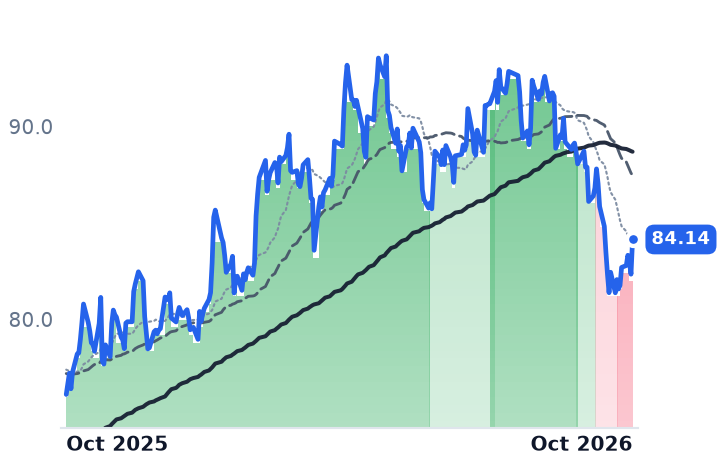
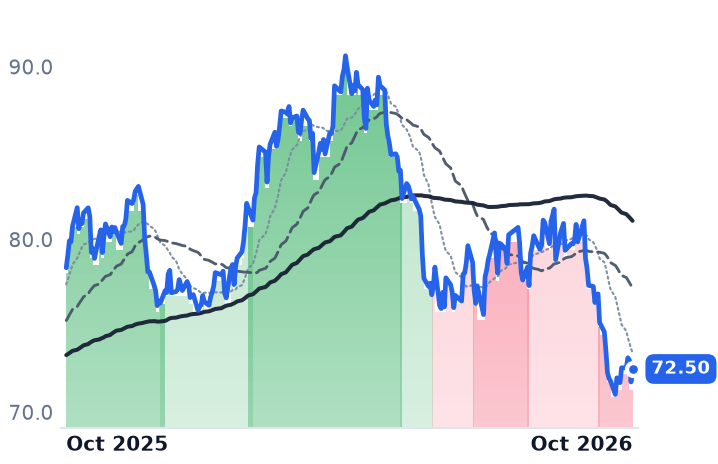
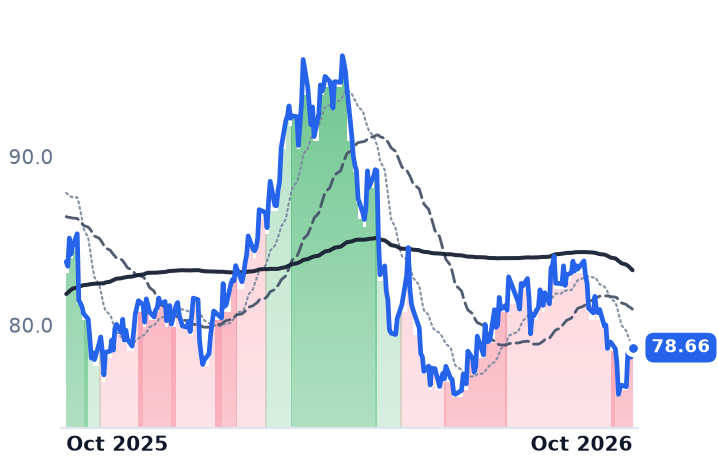
SPH | Suburban Propane Partners | Oil & Gas Energy | 🔴 Cont. Bear | +0.1% | −2.4% |
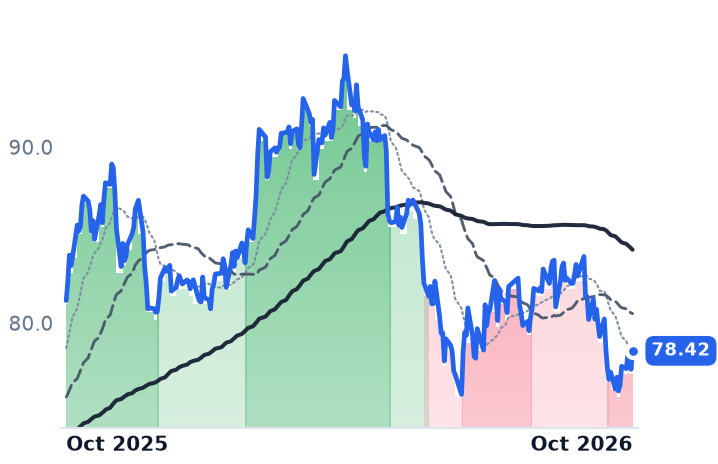
UGI | UGI | Diversified Energy Companies | 🟢 Cont. Bull | −2.3% | +19.3% |
| Compared against · context, not the story | |||||
ATO | Atmos Energy | Core Gas Distribution | 🔴 Cont. Bear | −0.9% | −6.9% |
NI | NiSource | Integrated Electric & Gas Utilities | ⚠️ Emerging Bear | −1.6% | −3.3% |
SWX | Southwest Gas | Core Gas Distribution | 🟢 Cont. Bull | −2.3% | +10.6% |
OGS | ONE Gas | Core Gas Distribution | 🔴 Cont. Bear | −6.3% | −7.5% |
NJR | New Jersey Resources | Gas with Midstream & Services | ⚠️ Emerging Bear | −3.7% | +15.7% |
NWN | Northwest Natural | Core Gas Distribution | ⚠️ Emerging Bear | −1.5% | +11.2% |
NFG | National Fuel Gas | Midstream & Infrastructure | 🔴 Cont. Bear | −2.9% | −6.1% |
SR | Spire | Gas with Midstream & Services | 🔴 Cont. Bear | −2.2% | −3.5% |
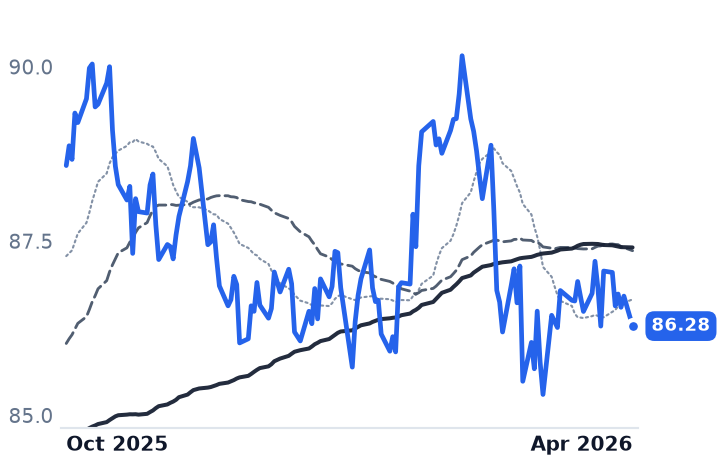
TLT | TLT | — | 🔴 Cont. Bear | — | −2.6% |
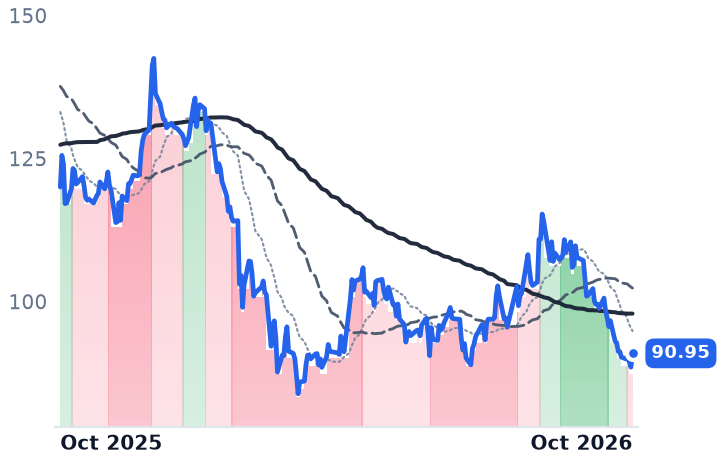
KKR | KKR | Alternative Investors | 🌱 Emerging Bull | −10.0% | −24.2% |
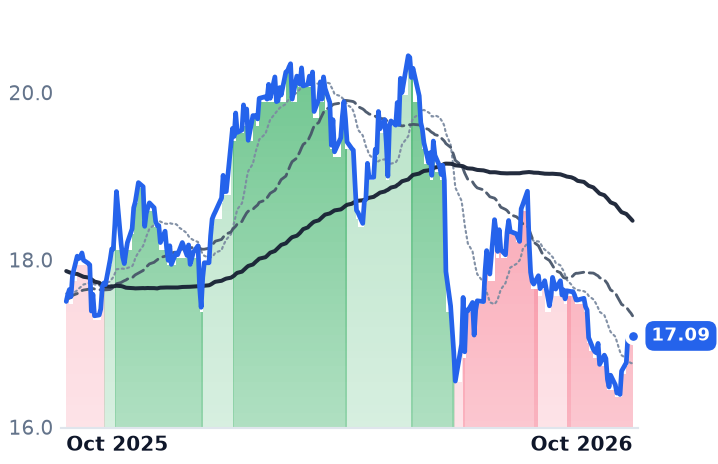
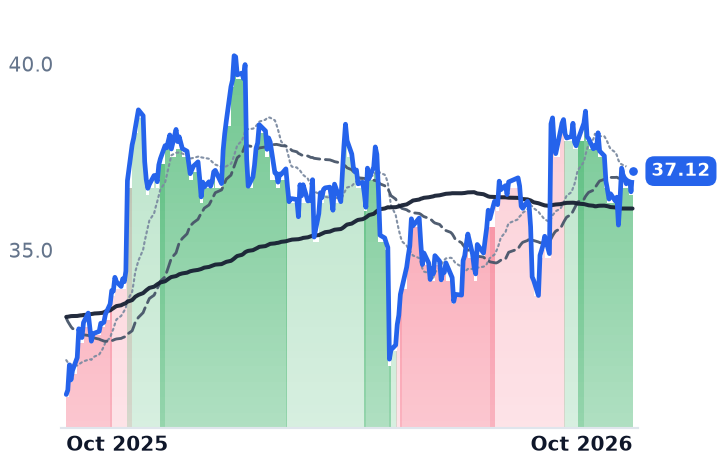
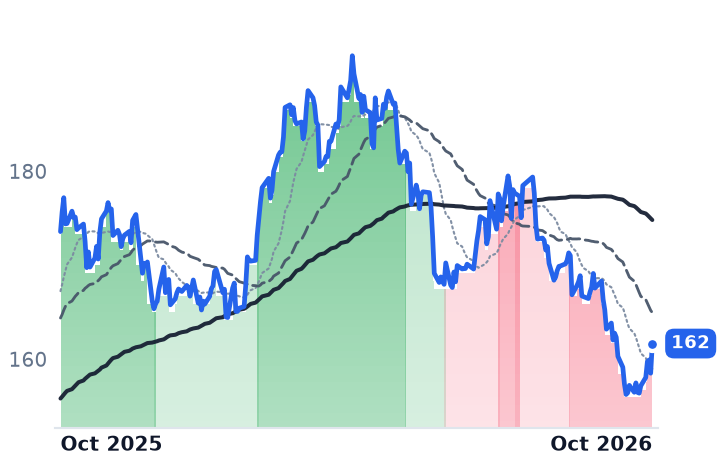
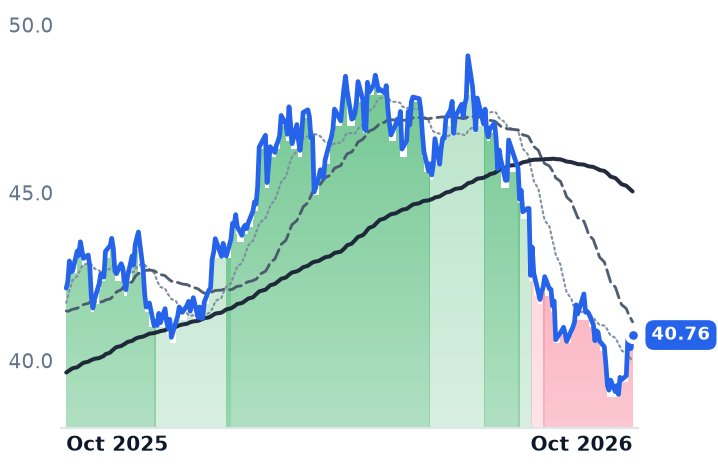
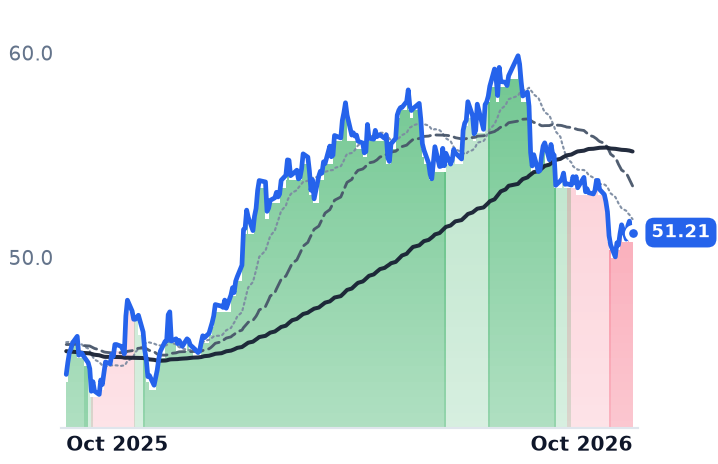
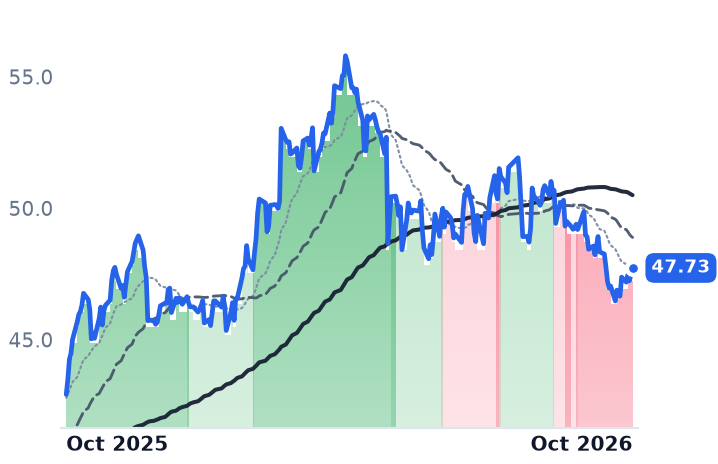
12-month price & trend
| Ticker | Mkt cap | P/E | P/E fwd | P/S | P/S fwd | P/GP | P/GP fwd | EV/EBITDA | FCF yld |
|---|---|---|---|---|---|---|---|---|---|
SPH | $1.1B | 8.7x | 8.3x | 0.8x | 0.8x | 2.5x | 2.4x | 8.9x | 11.1% |
UGI | $8.0B | 11.9x | 11.5x | 1.1x | 1.0x | 2.3x | 2.2x | 9.2x | 2.3% |
ATO | $28.0B | 19.8x | 19.8x | 5.7x | 5.4x | 9.3x | 8.9x | 14.1x | -7.2% |
| Ticker | Mkt cap | P/E | P/E fwd | P/S | P/S fwd | P/GP | P/GP fwd | EV/EBITDA | FCF yld |
|---|---|---|---|---|---|---|---|---|---|
NI | $19.5B | 21.4x | 19.8x | 2.8x | 2.8x | 5.6x | 5.4x | 11.6x | -5.6% |
SWX | $6.2B | 11.9x | 20.0x | 3.5x | 3.2x | 6.3x | 5.6x | 10.7x | -13.4% |
OGS | $4.6B | 15.9x | 15.1x | 2.0x | 1.9x | 2.7x | 2.5x | 10.2x | -3.7% |
| Ticker | Mkt cap | P/E | P/E fwd | P/S | P/S fwd | P/GP | P/GP fwd | EV/EBITDA | FCF yld |
|---|---|---|---|---|---|---|---|---|---|
NJR | $5.2B | 14.2x | 15.1x | 2.3x | 2.4x | 8.3x | 8.6x | 11.5x | 1.5% |
NWN | $2.1B | 16.4x | 16.3x | 1.6x | 1.5x | 3.6x | 3.4x | 9.9x | -12.6% |
NFG | $7.5B | 10.9x | 10.7x | 3.0x | 2.5x | 6.1x | 5.1x | 6.5x | 3.0% |
| Ticker | Mkt cap | P/E | P/E fwd | P/S | P/S fwd | P/GP | P/GP fwd | EV/EBITDA | FCF yld |
|---|---|---|---|---|---|---|---|---|---|
SR | $4.8B | 9.1x | 20.3x | 1.9x | 1.9x | 5.8x | 5.7x | 5.6x | -4.2% |
TLT | — | — | — | — | — | — | — | — | — |
KKR | $81.1B | 26.9x | 14.2x | 3.8x | 7.1x | 17.1x | 31.7x | 12.4x | 2.9% |
Consensus projections
| Ticker | FY2026E | FY2027E | FY2028E | |
|---|---|---|---|---|
SPH | Revenue | −3.3% | +3.8% | +1.0% |
| EPS | +13.7% | +3.8% | +2.2% | |
UGI | Revenue | −0.7% | +6.5% | +3.3% |
| EPS | −11.8% | +15.3% | +8.2% | |
ATO | Revenue | +6.8% | +7.7% | +8.7% |
| EPS | +14.2% | +6.8% | +8.4% | |
NI | Revenue | +15.3% | +5.6% | +6.3% |
| EPS | +9.0% | +9.7% | +10.1% | |
SWX | Revenue | −46.3% | +5.7% | +6.0% |
| EPS | −21.9% | +17.4% | +18.4% | |
OGS | Revenue | −2.6% | +3.9% | +3.7% |
| EPS | +11.8% | +2.8% | +8.5% | |
NJR | Revenue | +12.7% | −2.7% | +4.7% |
| EPS | +10.0% | −4.0% | +7.6% | |
NWN | Revenue | +5.0% | +6.9% | +3.6% |
| EPS | +5.3% | +5.0% | +5.8% | |
NFG | Revenue | +6.2% | +18.7% | −2.5% |
| EPS | +6.3% | +2.5% | +1.1% | |
SR | Revenue | +1.8% | +12.4% | +4.9% |
| EPS | −11.0% | +36.6% | +12.3% | |
KKR | Revenue | +43.7% | +8.6% | +25.4% |
| EPS | +28.7% | +15.2% | +14.4% |
Forward fiscal years only. Blank means no analyst coverage for that year.
Federal energy forecasters told households on 6 October that heating with propane will cost less this winter, about 3% less than last. In the Northeast the saving is larger: the Energy Information Administration, the statistical arm of the US Department of Energy, expects both lower prices and decreasing consumption to pull propane-heating expenditures down 15% against a year earlier. For a distributor whose revenue is gallons multiplied by a price, that is a smaller top line arriving just as the season starts.
It is also close to irrelevant to what Suburban Propane Partners earns. The master limited partnership distributes propane, fuel oil and refined fuels to roughly 1 million residential, commercial, industrial and agricultural customers across 42 states from about 700 locations, and its profit is a unit margin: cents on each retail gallon, the spread between a wholesale cost it pays and a posted retail price it sets. Cheap, well-supplied propane is the friendly end of that arrangement. Inventories stood at 103m barrels in the week to 26 September, about 13m barrels above the previous five-year average, with Gulf Coast stocks some 21% above theirs, and the Mont Belvieu wholesale benchmark was quoted at $0.919 a gallon on 6 October.
The June quarter separated gallons from gross profit
Suburban's fiscal third quarter, ended 27 June, is the cleanest demonstration available. Retail propane gallons came to 70.6 million, down 1.8%, against average temperatures across its service territories 17% warmer than normal. Total gross margin was $160.3m, unchanged from a year earlier, and the company's release attributed the underlying $3.9m decline excluding mark-to-market effects "primarily due to lower propane volumes sold, as propane unit margins remained steady."
The weather did not take the margin; it took the volume, and the volume loss was smaller than the weather implied. Chief executive Michael Stivala said the quarter's volumes "benefited from continued strength and growth in our counter-seasonal customer base," with May and June running ahead of the prior year on agricultural, industrial and national-account business.
What did deteriorate was the earnings line below the margin. Adjusted EBITDA fell to $18.0m from $27.0m on higher operating costs alongside the warmth, and revenue inched up 0.5% to $261.4m.
The socket count is the slow problem
Neither protagonist can buy its way out of attrition. US retail propane distribution is a roughly $15-20bn market growing between zero and 1%, or slightly negative, losing an estimated 0.7% of home heating-oil and propane accounts a year to natural gas and electric conversions, and there were no tracked retail propane acquisitions by the national operators in the 2025-26 year. AmeriGas was a net seller, having divested its Hawaii operations. Against that, roughly 2% net attrition at both Suburban and AmeriGas compares with the 4.2% base-business attrition Star Group reported for the twelve months to March 2026.
Inside UGI, propane is one dollar of four — and none of them sets the price
UGI Corporation owns AmeriGas, which serves about 1.4 million propane customers from 1,600 distribution points, and reports it beside a Pennsylvania utility delivering gas to roughly 672,000 customers, a midstream and marketing book, and a European liquefied petroleum gas arm. The propane leg had the worse quarter by far: retail gallons fell 10% to 124 million and AmeriGas segment earnings before interest and taxes dropped $25m, with April temperatures 16% warmer than the prior year. Underneath, net debt at AmeriGas came down roughly $270m in the quarter, with new paper issued at 6.875% retiring notes carrying coupons up to 9.375%. "We're very confident the leverage is going to be sub 4," chief financial officer Sean O'Brien told investors on 6 August. "We think by the end of the year, we have a shot to be sub 4."
Group guidance of $2.75-$2.90 in adjusted earnings per share for fiscal 2026 implies a down year against $3.09 reported for fiscal 2025, and at 11.5x forward earnings against 11.9x trailing, UGI is the cheapest reading among the listed gas distributors. None of that is what moves the stock. KKR offered about $9bn, or $42.50 a share, in an approach first reported on 18 August, and the gap to that number has widened since early September, from 10.7% below the offer on 4 September to 12.7% below it on 9 October, with no board response or agreement discoverable.
How much of Suburban's low the business explains
Some of it, and not most. Suburban's units closed at a 52-week low of $16.39 on 1 October, 20.7% beneath their $20.68 high, then recovered 4.3% over the following six sessions. One soft quarter is real, and an adjusted loss of $0.27 a unit came in wider than the $0.19 consensus loss. But the two meters that would signal distress did not move: trailing distribution coverage was 2.07x and the total consolidated leverage ratio 4.35x, the same as a year earlier, with the quarterly distribution held at $0.325 a unit — a 7.6% yield at the 9 October close and an unbroken run of 31 years.
The rest looks like a sector repricing that Suburban happened to sit inside. Every listed gas distributor fell over the 30 days to 9 October, and Suburban's 2.0% decline was the mildest of the group, against 8.1% at ONE Gas and 5.2% at National Fuel Gas; the long-Treasury proxy was unchanged over both 30 and 90 days, so no fresh move in long yields arrived to explain the month. At 8.9x trailing EV/EBITDA and 8.3x forward earnings against 8.7x trailing, Suburban is priced for no growth at all, while the single-analyst consensus for fiscal 2026 looks for revenue down 3.3% to $1.40bn with EBITDA up 4.8% to $307.6m — the decoupling, drawn forward a year, on one forecaster's work.
Both companies close their books on 30 September and have historically reported the full year in mid-November; no date has been announced. Nothing in the October outlook tells either of them how cold January will be, and the gallon count remains the number the weather owns. The spread is the half they set themselves, and an overstocked market has handed them the easier half.