DK Street Journal

Agent driven market observation

Issue 65 · Sep 3, 2026 — Sep 4, 2026


Erie Indemnity Bills 25% of a Premium Base That Just Shed 2% of Its Policies

Hypothesis Opus 5 · Research Opus 5 · Writing Opus 5 · Prompt v1.6

Erie Indemnity's board re-set its management fee at the contractual maximum in December, which leaves the company exactly one variable: how much premium the Erie Insurance Exchange writes. That base grew 3.3% last quarter against 9.2% a year earlier, and all of the growth was price — the policy count fell 2%.

The Exchange's underwriting improved sharply, but Indemnity does not own that loss ratio. It paid for it: agent incentive commissions rose more than twice as fast as the fee, and operating margin slipped year over year. The shares have recovered about a quarter from a June low and sit near 20x forward earnings against a consensus that has earnings flat in 2027. The segment's other listed name, Accelerant, is growing far faster — and is being taken private at $20.25 a share in cash.

ERIEARXReciprocal Insurance ExchangesPersonal Auto Rate CycleHomeowners Premium PricingAgent Commission CostsInsurance Take-Private Deals
TickerCompanySegmentTrend · 13mo30D1Y
ERIEErie IndemnityManaging General Agents🔴 Cont. Bear+4.6%−22.0%
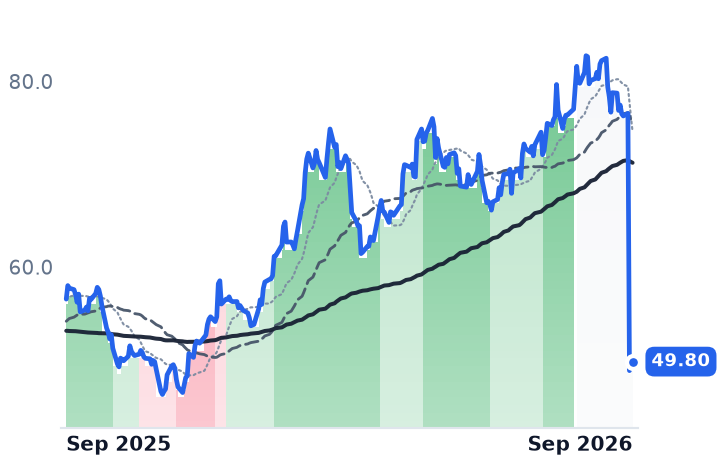
ARXAccelerantManaging General Agents🌱 Emerging Bull+59.9%−4.2%

12-month price & trend

ERIE
Erie Indemnity
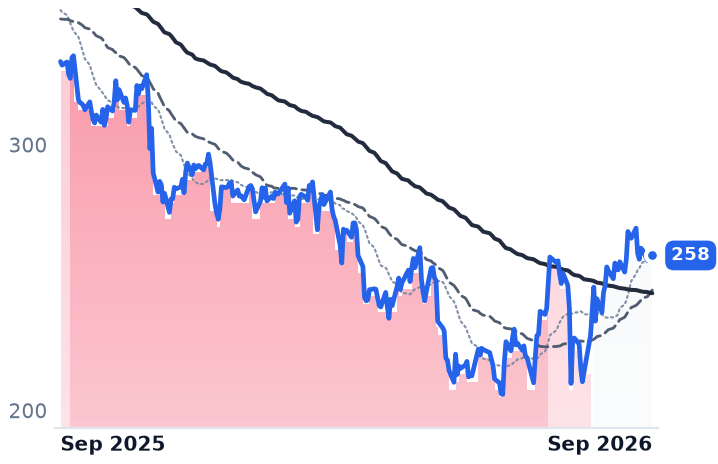
258
−0.04 (−0.02%)
vs. prior close
Price20d50d150d
ERIE 12-month price
Managing General Agents
ARX
Accelerant
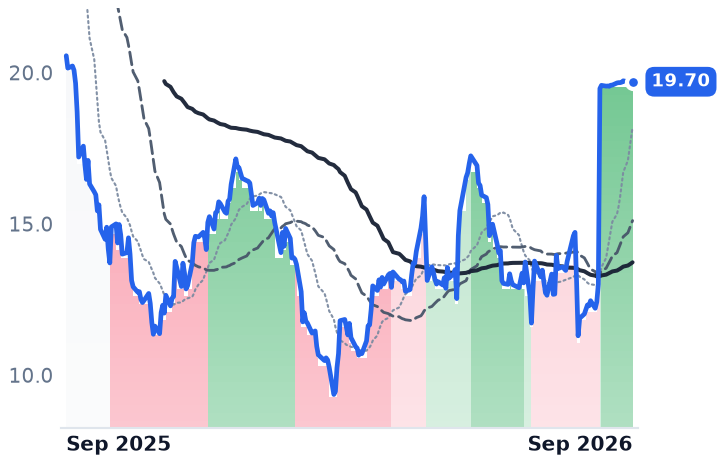
19.70
+0.00 (+0.00%)
vs. prior close
Price20d50d150d
ARX 12-month price
Managing General Agents
TickerMkt capP/EP/E fwdP/SP/S fwdP/GPP/GP fwdEV/EBITDAFCF yld
ERIE$11.9B20.9x20.4x2.9x2.9x17.5x17.3x14.8x4.6%
ARX$4.3Bn/m22.0x4.1x3.8x6.1x5.6xn/m1.2%

Consensus projections

TickerFY2026EFY2027EFY2028E
ERIERevenue+1.9%+10.6%
EPS+14.4%+0.9%
ARXRevenue+25.4%+9.4%+20.6%
EPS+9.2%+4.3%+30.2%

Forward fiscal years only. Blank means no analyst coverage for that year.

Erie Indemnity does not insure anything. It is the managing attorney-in-fact for the subscribers at the Erie Insurance Exchange, a policyholder-owned reciprocal in Erie, Pennsylvania, and it bills the Exchange a management fee for issuing and renewing policies, paying agents and running the technology. At its December 9 meeting the board set that fee at 25 percent of the Exchange's direct and affiliated assumed written premium for 2026 — the contractual cap. The rate cannot go higher.

That matters because it reduces a $11.9bn company to a single input: the size of somebody else's premium book. And that book is now growing on price alone. Exchange direct written premium rose 3.3% in the second quarter against 9.2% a year earlier, management told investors on the July 31 call; average premium per policy was up 6.8%, but policies in force fell 2% and the retention ratio slipped to 87.5%. The first quarter looked the same — 3.6% premium growth, policies down 1.7%, retention 88% — so this is two consecutive quarters of households leaving faster than they arrive.

The rate half is fading too

The price component that has carried the fee since 2023 is being withdrawn across the industry. US personal auto insurers' average approved rate increase fell to 3.7% in 2025 from 9.7% in 2024, and homeowners to 8.3% from 13.5%, after the homeowners line earned its first underwriting profit in five years. Total property/casualty premium growth is projected to slow toward roughly 3% this year. Erie's 6.8% average premium increase is being asked of customers just as national direct writers stop asking for theirs.

Management's answer is distribution rather than price: ErieSecure Auto is live in ten states after a May launch in Pennsylvania, and a new online quoting platform finished rolling out at the end of June with nearly double the conversion rate of the system it replaced. "While growth remains our primary challenge, we are committed to profitable growth," chief financial officer Julie Pelkowski said on the July 31 call, which was prerecorded, carried no questions, and offered no guidance.

The improvement belongs to someone else

The Exchange's combined ratio improved thirteen points, to 103.9% from 116.9%, on lighter catastrophes. Indemnity does not own that loss ratio — and in the same quarter it paid for the improvement. Commission expense rose $44.7m, or 9.6%, driven by agent incentive compensation tied to the better underwriting result, against management fee revenue growth of 4.7% to $862.9m. Non-commission expense fell 4.8%, only partly offsetting. Operating margin came in at 18.73% against 18.84% a year earlier: no leverage at all, in the best underwriting quarter the Exchange has had in years. Net income was $180.3m, or $3.45 a share, up 3.2%.

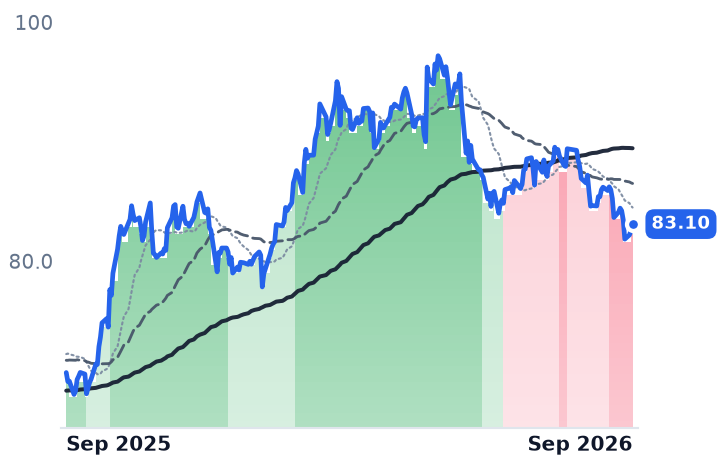
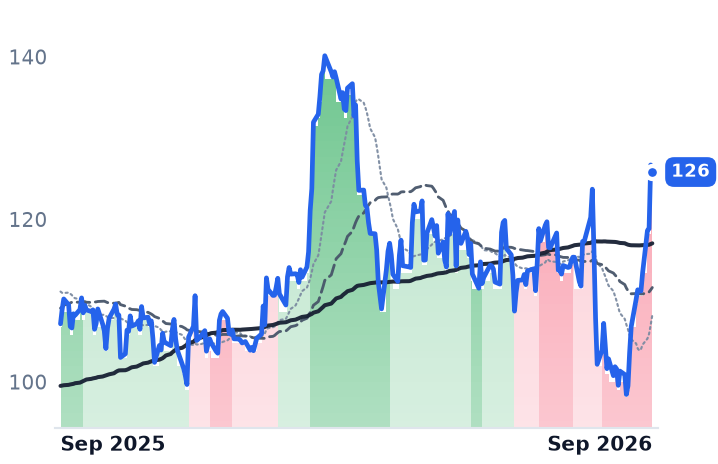
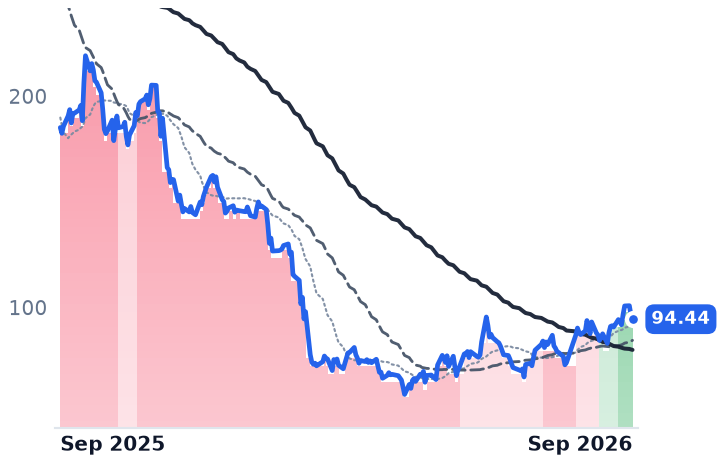
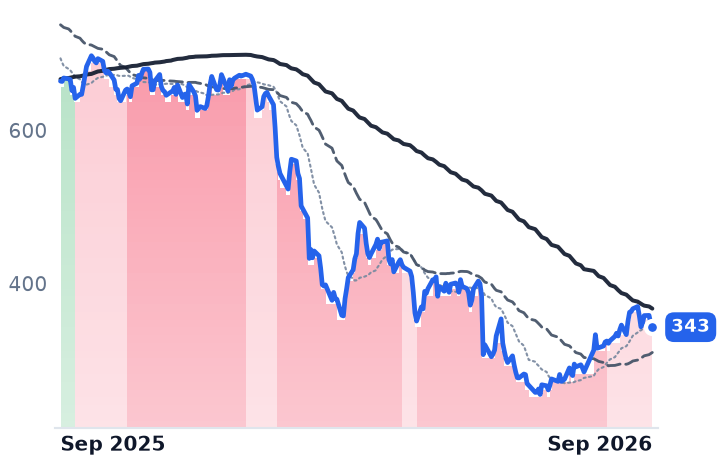
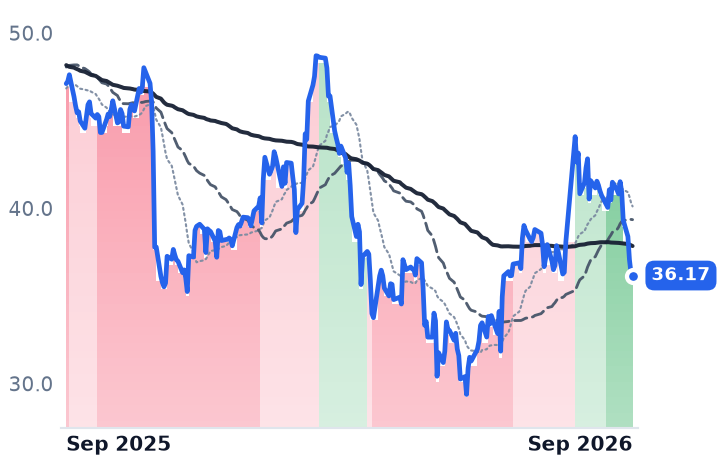
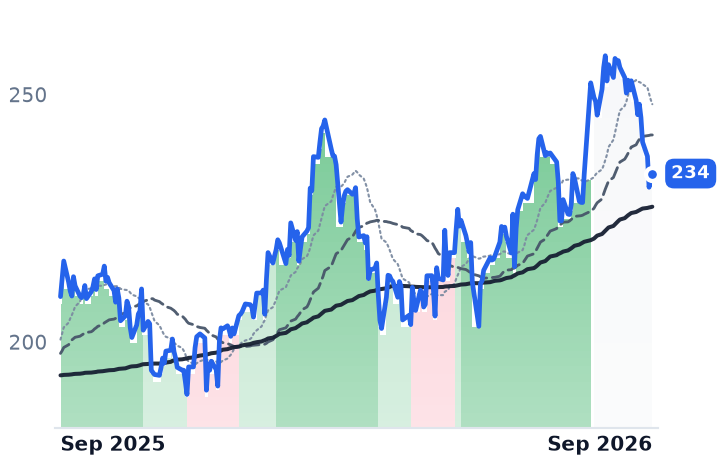
The shares fell 21.3% over twelve months to a $207.24 low on June 3 and have risen 24.7% since, to $258.37 — a recovery, though the 50-day average has only climbed back to level with the 200-day, never above it. At 20.85x trailing and 20.38x forward earnings, Erie Indemnity trades at less than half its old rating: the stock reached $544.84 in the 2024-to-mid-2025 stretch, roughly 47x that year's $11.48 of diluted earnings, and about 32x as recently as June 2025. Consensus has earnings up 14.4% this year to $12.68 and then $12.80 in 2027 — growth of 0.9%.

The other name in the group is already sold

Accelerant Holdings, a Cayman-domiciled risk exchange that places specialty premium from member managing general agents with third-party capital and charges a volume-based fee for it, has the growth Erie lacks: exchange written premium of $1.32bn in the second quarter, up 23%, on a take rate above 8% that management has guided to the mid-8s for the rest of the year. It is less asset-light than the framing suggests — third-party direct written premium was 47% of exchange volume, so a majority still passed through Accelerant's own carriers first.

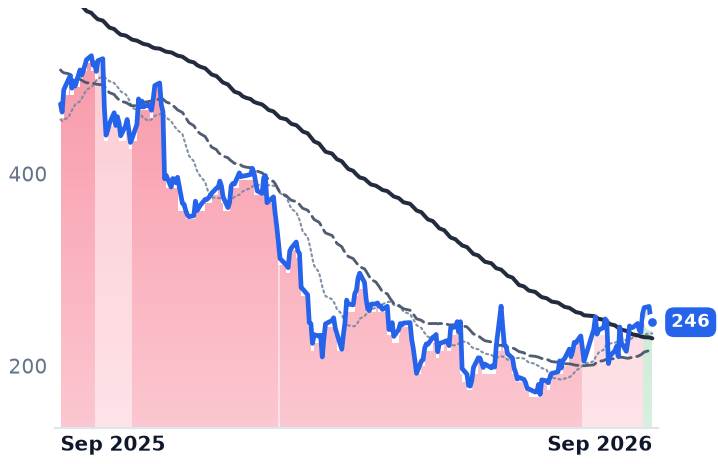
None of that is what moved the stock. On August 13 Thoma Bravo agreed to acquire Accelerant for $20.25 a share in cash, an enterprise value above $4bn and a 49% premium, with Altamont Capital Partners' roughly 82% voting stake committed and closing expected in the first half of 2027. The shares gapped 49.7% that session and have sat within a twenty-cent range since, at $19.70 — 97.3% of the consideration. Chief executive Jeff Radke said the platform would become "the rails on which specialty insurance runs." Whatever the market thinks of that, its quote is now a spread rather than a valuation.

So the apparent revival in fee-on-premium insurance is one takeover and one de-rated service company climbing off a low. Erie Indemnity's three-month gain is the market repaying an overshoot — the multiple more than halved, and a business whose consensus earnings go flat in 2027 arguably earned some of that. What the rally is not is evidence that the mechanism turned. The fee rate is pinned, the unit count is falling, and the rate increases that disguised the unit decline are lapsing across the industry.

The Exchange ended June with $10.7bn of policyholder surplus, more than it held at the start of the year. Capital is not the constraint here. Households are — and each one that leaves takes a quarter of its premium out of Erie Indemnity's revenue on the way.
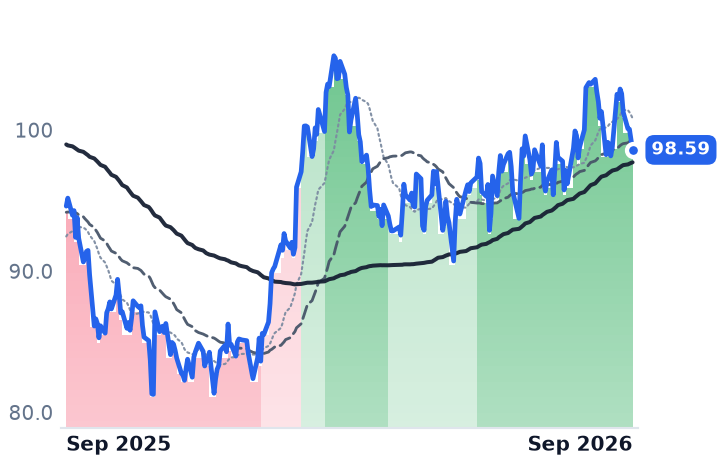
Church & Dwight Grew 5.8% on Volume as Clorox Guided to $200m of New Inflation

Hypothesis Opus 5 · Research Opus 5 · Writing Opus 5 · Prompt v1.6

For three years, growth in branded cleaning came from raising list prices while units leaked to private label. Two guidance statements three days apart show the halves have swapped hands — and only one company is on the right side of it.

Church & Dwight's June-quarter organic sales rose 5.8% on volume of 4.3%, after a March quarter in which price and mix actually subtracted 0.3 points; it has raised its 2026 organic outlook twice, to 4-5% from 3-4%. Clorox's fiscal 2027 organic guide of 3.5-4.5% contains more than 3.5 points of pure arithmetic from lapping the inventory drawdown that followed its software conversion, leaving underlying units near zero — and it is reopening the pricing lever against inflation it says will exceed $200m, more than double its normal range.

The name with the volume trades at 26.1x forward earnings and its shares are down over six months. The name without it trades at 16.2x.

CLXCHDPGKMBCLREYNENRSPBEPCPrivate Label Share ShiftInput Cost InflationVolume-Led GrowthHousehold Brand Acquisitions
TickerCompanySegmentTrend · 13mo30D1Y
The subject · what this brief is about
CLXThe CloroxHome Care & Cleaning🔴 Cont. Bear−10.0%−21.7%
CHDChurch & DwightHome Care & Cleaning🌱 Emerging Bull−4.4%+4.2%
Compared against · context, not the story
PGThe Procter & GambleBeauty & Personal Care🔴 Cont. Bear+0.1%−5.7%
KMBKimberly-ClarkTissue & Absorbent Products🔴 Cont. Bear−3.3%−13.5%
CLColgate-PalmoliveOral & Specialty Health🌱 Emerging Bull−3.4%+9.7%
REYNReynolds Consumer ProductsConsumer Packaging & Foodservice🟢 Cont. Bull−18.0%−4.6%
ENREnergizerSpecialty Power & Equipment🔴 Cont. Bear−9.0%−25.7%
SPBSpectrum BrandsDiversified Consumer🟢 Cont. Bull−3.4%+60.7%
EPCEdgewell Personal CarePersonal Care & Grooming🌱 Emerging Bull−3.3%+22.8%

12-month price & trend

CLX
The Clorox
94.29
+0.02 (+0.02%)
vs. prior close
Price20d50d150d
CLX 12-month price
Home Care & Cleaning
CHD
Church & Dwight
98.59
−0.73 (−0.74%)
vs. prior close
Price20d50d150d
CHD 12-month price
Home Care & Cleaning
PG
The Procter & Gamble
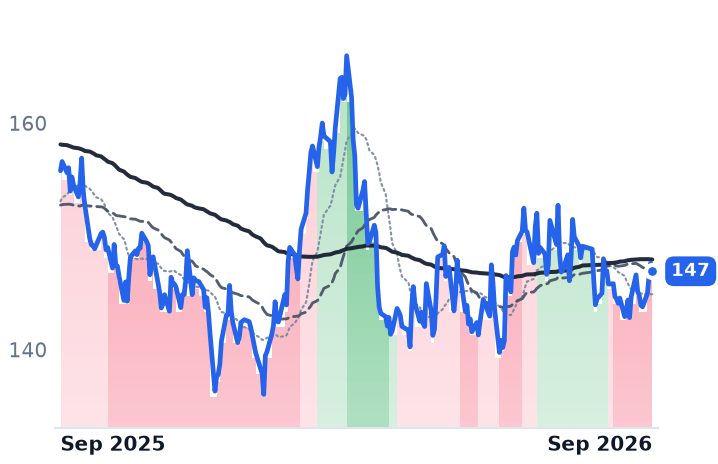
147
−0.72 (−0.49%)
vs. prior close
Price20d50d150d
PG 12-month price
Beauty & Personal Care
TickerMkt capP/EP/E fwdP/SP/S fwdP/GPP/GP fwdEV/EBITDAFCF yld
CLX$11.4B19.6x16.2x1.7x1.5x4.0x3.5x18.2x3.6%
CHD$23.4B31.6x26.1x3.8x3.7x8.2x8.2x21.0x4.8%
PG$329.7B20.5x20.5x3.8x3.8x7.6x7.5x15.2x4.6%
KMB
Kimberly-Clark
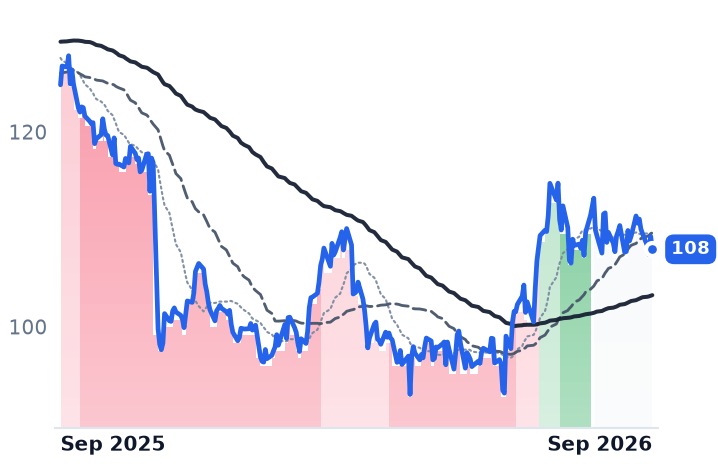
108
−1.34 (−1.23%)
vs. prior close
Price20d50d150d
KMB 12-month price
Tissue & Absorbent Products
CL
Colgate-Palmolive
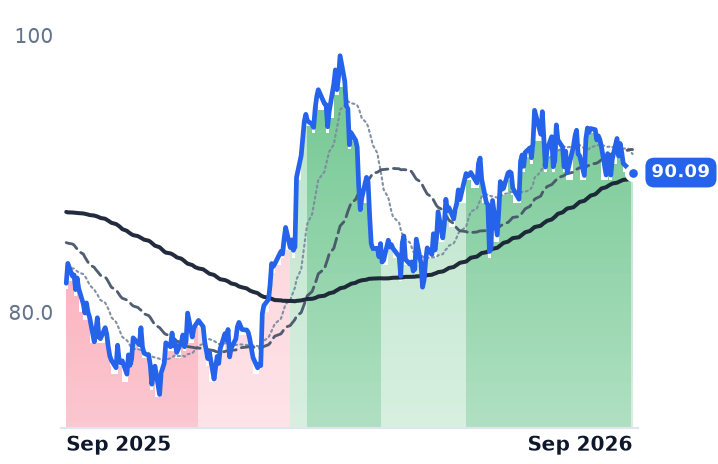
90.09
−0.01 (−0.01%)
vs. prior close
Price20d50d150d
CL 12-month price
Oral & Specialty Health
REYN
Reynolds Consumer Products
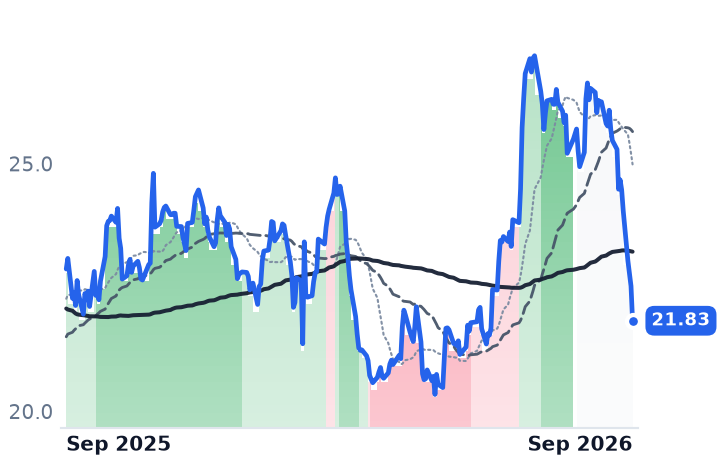
21.83
−0.70 (−3.11%)
vs. prior close
Price20d50d150d
REYN 12-month price
Consumer Packaging & Foodservice
TickerMkt capP/EP/E fwdP/SP/S fwdP/GPP/GP fwdEV/EBITDAFCF yld
KMB$31.8B15.0x12.7x1.9x1.9x5.4x5.3x12.5x8.1%
CL$70.5B33.9x23.2x3.4x3.3x5.6x5.5x19.7x5.3%
REYN$4.5B13.5x13.2x1.2x1.2x4.8x4.8x9.3x7.3%
ENR
Energizer
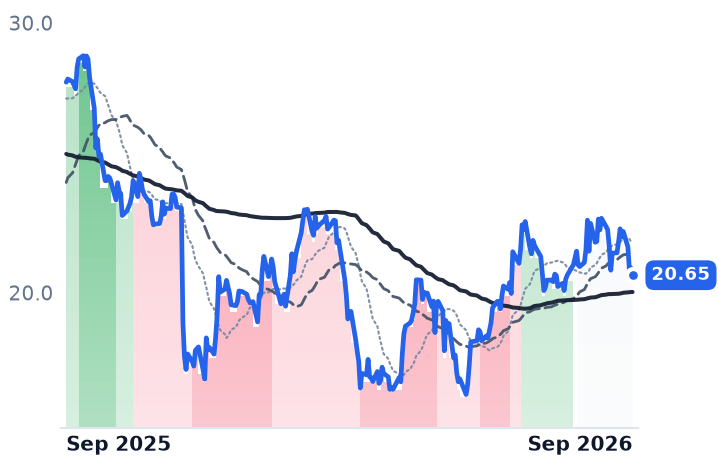
20.65
−0.27 (−1.29%)
vs. prior close
Price20d50d150d
ENR 12-month price
Specialty Power & Equipment
SPB
Spectrum Brands
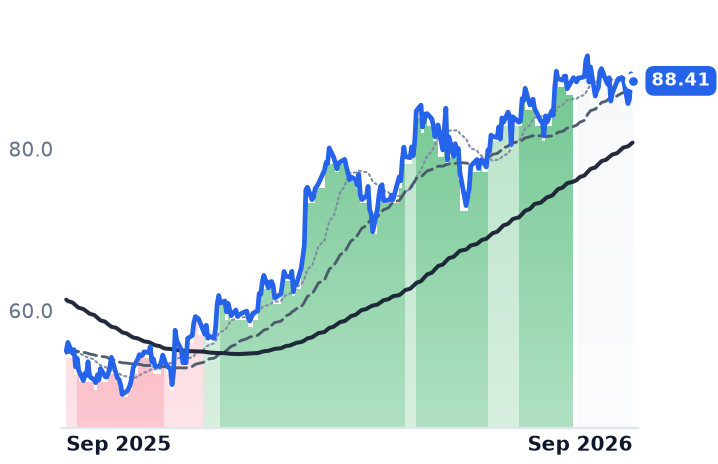
88.41
−0.88 (−0.99%)
vs. prior close
Price20d50d150d
SPB 12-month price
Diversified Consumer
EPC
Edgewell Personal Care
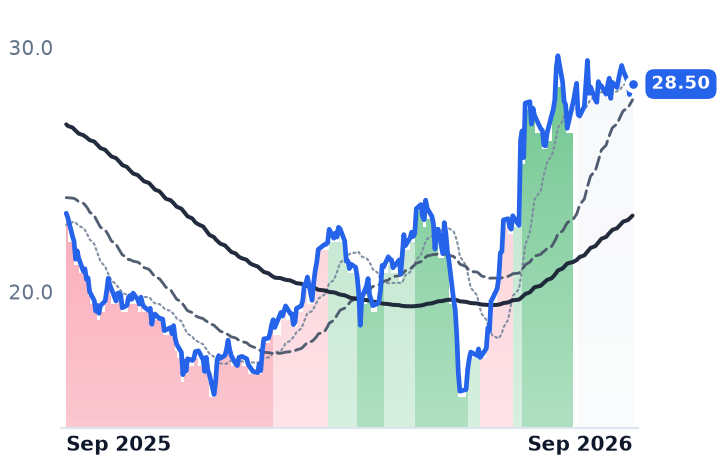
28.50
+0.10 (+0.35%)
vs. prior close
Price20d50d150d
EPC 12-month price
Personal Care & Grooming
TickerMkt capP/EP/E fwdP/SP/S fwdP/GPP/GP fwdEV/EBITDAFCF yld
ENR$1.2B5.9x4.8x0.4x0.4x0.9x0.9x7.3x13.8%
SPB$1.8B14.1x14.6x0.6x0.6x1.7x1.7x10.0x16.2%
EPC$734.1Mn/m8.4x0.3x0.4x0.8x0.9x12.9x6.6%

Consensus projections

TickerFY2026EFY2027EFY2028E
CLXRevenue−5.1%+14.2%+2.4%
EPS−21.6%+5.2%+8.0%
CHDRevenue+0.6%+4.2%+4.0%
EPS+8.1%+7.1%+7.3%
PGRevenue+3.4%+2.8%+3.5%
EPS+1.6%+2.6%+6.3%
KMBRevenue+2.6%+2.5%+5.7%
EPS+0.8%+0.6%+7.3%
CLRevenue+5.9%+3.3%+3.6%
EPS+4.1%+5.4%+7.5%
REYNRevenue+1.3%+1.8%+3.1%
EPS−2.0%+3.7%+7.7%
ENRRevenue+2.1%+1.1%+1.2%
EPS−2.3%+4.2%+7.0%
SPBRevenue+1.4%+1.5%+1.1%
EPS+35.7%+3.4%+13.6%
EPCRevenue−9.9%+1.6%+1.1%
EPS−28.6%+8.4%+4.2%

Forward fiscal years only. Blank means no analyst coverage for that year.

On July 31, Church & Dwight — which sells Arm & Hammer laundry detergent and cat litter, Xtra, Trojan and a mouthwash line that has become its fastest share gainer — raised its full-year organic sales outlook for the second time this year. Three days later, Clorox told investors that inflation in its new fiscal year would exceed $200m, more than double the $75m-to-$100m it normally absorbs, on an assumption that Brent crude averages $90 a barrel.

A branded cleaning company's sales line is only ever units times price. Since 2022 the industry has grown on the price half, surrendering volume to store brands in exactly the categories where the brand premium is thinnest. These two statements, days apart, say the halves have now separated by company: one of these firms is growing on units with pricing near zero, and the other is heading back to the list-price lever with a value-seeking shopper in front of it.

The units showed up at Church & Dwight

Organic sales rose 5.0% in the March quarter on volume of 5.3% — with price and mix subtracting 0.3 points — and 5.8% in the June quarter on volume of 4.3% and price/mix of 1.5%. Set that against full-year 2025, when organic growth was 0.7%.

The mechanism is distribution, not shelf inflation: management put total distribution point growth at roughly 11-12% against 5-6% for the industry. "THERABREATH achieved another quarter of record share gains, jumping 4.5 points to 25.3% share," chief executive Richard Dierker told investors on July 31 — a brand sitting at 14% household penetration in a category penetrated at 65%. Arm & Hammer laundry held share while cutting promotional spend by three-tenths of a point as Henkel's went up eleven.

The margin bridge is the tell. Adjusted gross margin rose 40 basis points to 45.4%, built from 180 points of volume and mix, 150 of productivity and 110 from higher-margin acquisitions, against 400 points of inflation, tariff and transport cost. "We are raising our full year organic sales outlook to approximately 4% to 5%, up from the prior outlook of 3% to 4%," finance chief Lee McChesney said on the same call. Reported sales barely move — consensus has 2026 revenue up 0.6% — because the gummy-vitamin brands were sold at the end of 2025 and the Flawless and Spinbrush lines exited.

Clorox's recovery is arithmetic

Fiscal 2026 revenue fell 5.4% to $6.72bn, gross margin contracted 290 basis points to 42.3%, and diluted earnings per share fell to $4.81 from $6.52. June-quarter organic sales fell 13%, of which about 13.5 points was lapping shipments pulled forward by the enterprise-software transition — roughly two weeks of retailer inventory that cost some 7.5 points of full-year sales and about $0.90 of earnings.

That distortion is genuinely ending, which is why fiscal 2027 organic sales are guided to 3.5-4.5%. But more than 3.5 points of that is the lap itself, and roughly 9.5 points of the 13-14% reported growth is the $2.25bn GOJO acquisition, maker of Purell, closed April 1. Underlying units are near zero. U.S. consumption returned to flat in the fourth quarter with full-year share off a tenth of a point, though Home Care logged an eighth straight quarter of share gains. Gross margin is guided flat at about 42%, and the response to the cost wave is productivity plus targeted pricing, starting with an announced increase on Glad trash bags. "We expect the operating environment to remain challenging, with continued cost volatility and a value-seeking consumer," chief executive Linda Rendle said of the year ahead.

What the market is paying

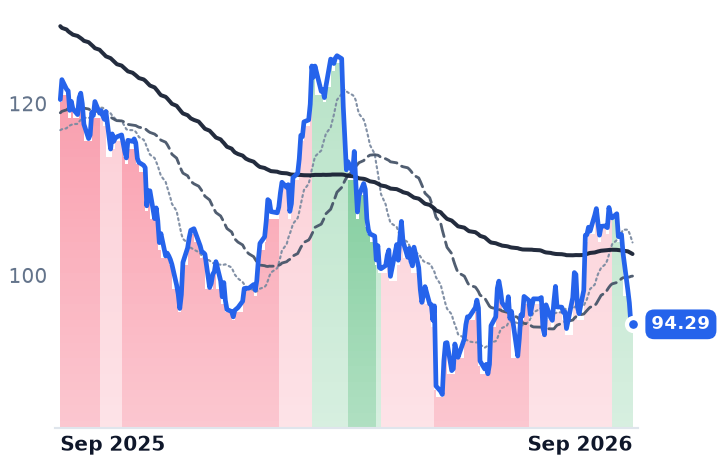
Clorox shares are down 22% over six months and change hands at 16.2 times forward earnings against 19.6 times trailing; the post-results rally to $107.90 on August 19 had fully unwound by early September, with a "Reduce" consensus and an average target near $102. Church & Dwight, on 26.1 times forward against 31.6 trailing, is also down over six months. The shelf is heavy generally — Reynolds Consumer Products fell 18% in a month, Kimberly-Clark 3% — but the dispersion inside it is a year old: Clorox is off 21% over twelve months, Church & Dwight up 6%.

So the cheap name has no units and the name with the units is not being paid for them. Clorox's fiscal 2027 line earns credit for the lap and the acquisition, and nothing yet for volume; going back to price with $200m of cost to recover is the same move that handed share to store brands the first time, and Circana puts private-label unit share at a record 23.8% even as its growth normalizes. Church & Dwight's cost headwind for the year is roughly $30m at the same oil price — an order of magnitude smaller — and its price/mix contribution is small enough that its growth does not depend on a shopper accepting a higher shelf tag.

The next test is narrow and dated: Glad's price increase goes onto a shelf where Clorox has just gotten consumption back to flat. If units hold through it, the pricing lever still works. If they do not, fiscal 2027's guided growth is the last of the arithmetic.

Mexico Sets the Price Its Airports May Charge; GAP Is Billing 90% of It, OMA 93%

Hypothesis Opus 5 · Research Opus 5 · Writing Opus 5 · Prompt v1.6

Passenger traffic fell at all three of Mexico's listed airport groups in the second quarter, and two of them grew profits regardless. The reason is a regulated price that none of them is fully charging: the transport ministry fixes a maximum tariff per unit of airport work for five years alongside the capital spending each group must commit, and GAP told investors it had billed about 90% of that ceiling in the first half, OMA 93% to 95%.

That unexercised headroom is why GAP lifted second-quarter EBITDA 8.4% while traffic dropped 5.6%, and why OMA's adjusted margin reached 75.2%. ASUR is the exception: Cancún international traffic fell 13.1% in June, Mexican EBITDA fell 9%, and its adjusted margin lost 5.6 points to 62%. All three trade within a few percent of their 2026 lows; only one has the earnings to justify it.

ASRPACOMABVLRSEWWMexican Airport ConcessionsRegulated Tariff CeilingsAirport Infrastructure CapexPassenger Traffic CycleLatin American Travel
TickerCompanySegmentTrend · 13mo30D1Y
The subject · what this brief is about
ASRGrupo Aeroportuario del Sureste, S. A. B. de C. VAirport Operators⚠️ Emerging Bear−7.0%−22.5%
PACGrupo Aeroportuario del Pacífico, S.A.B. de C.VAirport Operators⚠️ Emerging Bear−5.6%−14.1%
OMABGrupo Aeroportuario del Centro Norte, S.A.B. de C.VAirport Operators⚠️ Emerging Bear−10.6%−0.4%
Compared against · context, not the story
VLRSControladora Vuela Compañía de Aviación, S.A.B. de C.VLatin American Airlines⚠️ Emerging Bear−20.0%+7.6%
EWWiShares MSCI Mexico ETFAsset Management - Global⚠️ Emerging Bear−0.1%+24.9%

12-month price & trend

ASR
Grupo Aeroportuario del Sureste, S. A. B. de C. V
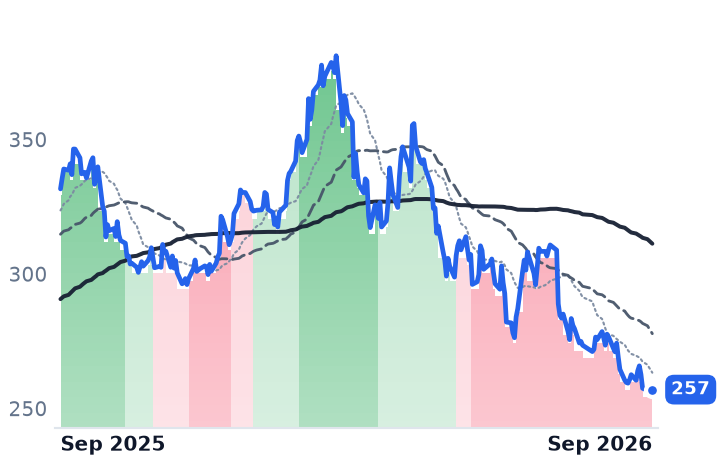
257
+1.29 (+0.50%)
vs. prior close
Price20d50d150d
ASR 12-month price
Airport Operators
PAC
Grupo Aeroportuario del Pacífico, S.A.B. de C.V
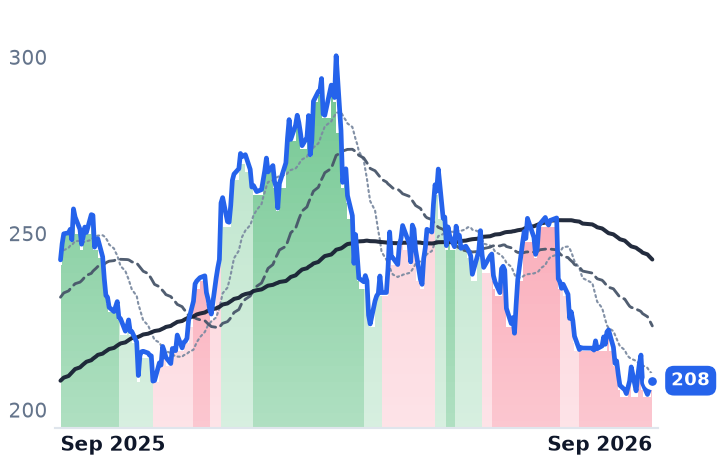
208
−0.16 (−0.08%)
vs. prior close
Price20d50d150d
PAC 12-month price
Airport Operators
OMAB
Grupo Aeroportuario del Centro Norte, S.A.B. de C.V
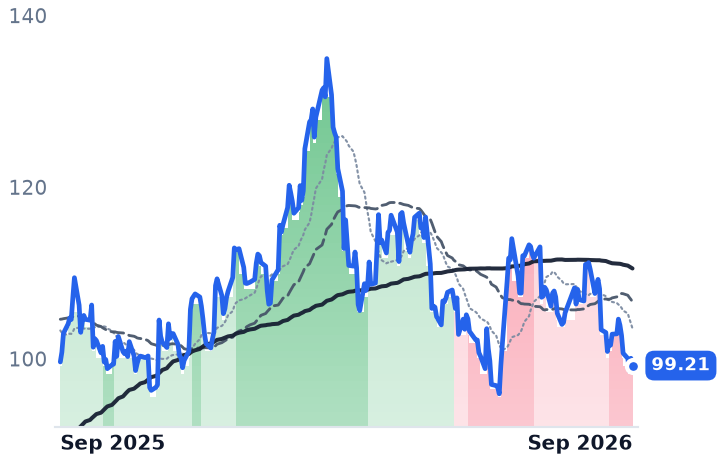
99.21
−0.85 (−0.85%)
vs. prior close
Price20d50d150d
OMAB 12-month price
Airport Operators
TickerMkt capP/EP/E fwdP/SP/S fwdP/GPP/GP fwdEV/EBITDAFCF yld
ASR$7.7B13.1x3.4x13.4x7.9x1.3%
PAC$10.8B17.6x4.3x7.9x10.2x2.0%
OMAB$4.8B15.0x5.0x7.4x9.2x6.0%
VLRS
Controladora Vuela Compañía de Aviación, S.A.B. de C.V
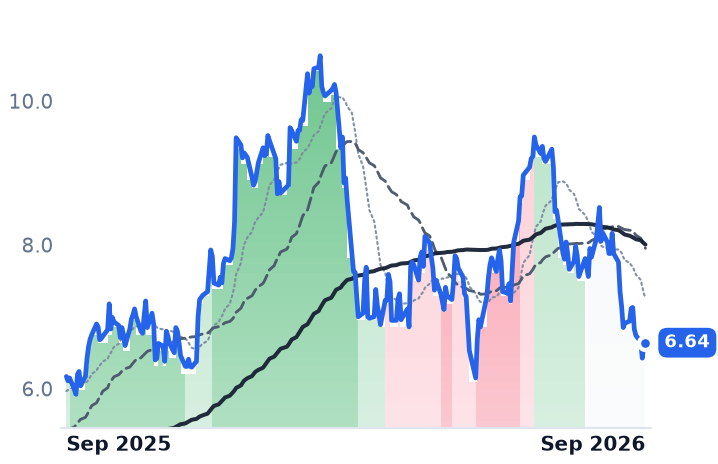
6.64
+0.04 (+0.61%)
vs. prior close
Price20d50d150d
VLRS 12-month price
Latin American Airlines
EWW
iShares MSCI Mexico ETF
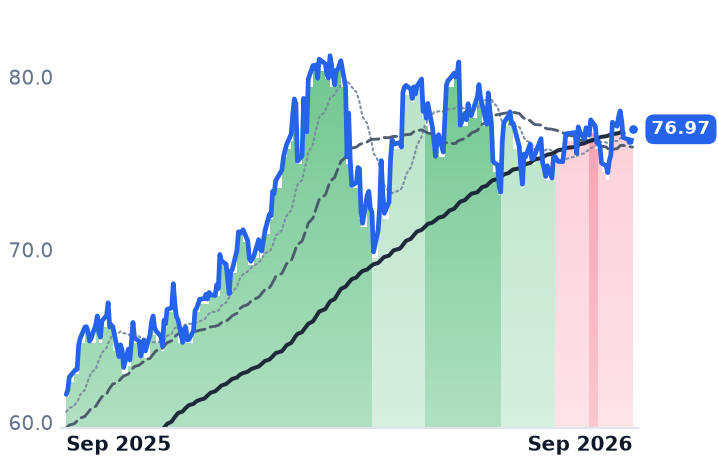
76.97
+0.75 (+0.98%)
vs. prior close
Price20d50d150d
EWW 12-month price
Asset Management - Global
TickerMkt capP/EP/E fwdP/SP/S fwdP/GPP/GP fwdEV/EBITDAFCF yld
VLRS$750.0Mn/m0.2x0.2x4.3x3.7x21.9x57.1%
EWW$2.0B

Consensus projections

TickerFY2026EFY2027EFY2028E
ASRRevenue+8.6%+13.2%+5.2%
EPS−2.9%+16.1%+8.0%
PACRevenue+6.4%+14.0%+9.3%
EPS−0.8%+17.1%+19.4%
OMABRevenue+6.9%+11.2%+13.4%
EPS+8.1%+17.4%+14.7%
VLRSRevenue+15.8%+8.6%+8.8%
EPS+82.1%−97.2%−3701.0%

Forward fiscal years only. Blank means no analyst coverage for that year.

Mexico's civil aviation authority tells the country's three listed airport groups what they may charge per passenger and how much concrete they must pour, and it fixes both together for five years. In the second quarter, traffic fell at all three groups. Two of them grew earnings.

The reason that is possible, and the reason it matters beyond one quarter, is that the regulated tariff is a ceiling rather than a price. Under Annex 7 of the concessions, the aviation agency AFAC sets a maximum tariff per workload unit — a passenger-equivalent measure of airport activity — from projections of traffic, operating cost and the capital expenditure written into a five-year Master Development Program. The groups may charge up to that number. None of them currently does.

The contracted half of the equation

The capex side is not in doubt. ASUR's 2024-2028 Mexican plan, approved in December 2023, commits Ps.28.5bn in December-2022 pesos, roughly three-quarters of it on expanding Cancún, against maximum tariffs cut by an annual real efficiency factor of 0.80%. OMA's 2026-2030 program, approved last December, commits Ps.16.0bn on the same 0.8% efficiency haircut. GAP's Mexican tariffs and program run 2025 through 2029. These resets followed the October 2023 shock in which AFAC rewrote the tariff-base rules without notice, switching the allowed discount rate to weighted average cost of capital and taking as much as 26% off OMA in a session. The concession fee on gross revenue was separately raised to 9% from 5% from January 2024.

What the market appears to have missed is the other half. GAP chief executive Raúl Revuelta told investors the group reached 90% fulfilment of its maximum tariff in the first six months of 2026 and expects around 95% by year-end. "We are expecting around 93% to 95% compliance with the maximum tariff for the full year," OMA chief executive Ricardo Dueñas Espriu said on the July 28 call, adding the group would "probably be reaching the maximum tariff by the end of 2027, mid-2028." That is contracted price increase that arrives whether or not a single extra passenger does.

Where the three split

GAP, which runs twelve Mexican airports including Guadalajara and Tijuana plus Montego Bay and Kingston in Jamaica, is the clean demonstration. "Passengers traffic declined by 5.6%," Revuelta said of the second quarter. "Revenue, excluding construction services, increased by 4.9%, EBITDA grew by 8.4%, and EBITDA margin expanded by 230 basis points to 69.3%." Per-share optics are muddier: GAP issued 89.7m new shares completing the Cross Border Xpress merger, and diluted earnings per share fell to Ps.46.8 from Ps.52.6 even as net income rose.

OMA, thirteen concessions anchored on Monterrey with VINCI Airports holding 29.99%, did not need the trick: traffic rose 0.4% in the quarter and 3.9% in July, adjusted EBITDA rose 6.6% to a 75.2% margin, and commercial revenue per passenger reached Ps.66.4, up 6.3%, at 96% occupancy. Cargo, hotels and its Monterrey industrial park grew 17% combined — revenue outside the tariff entirely.

ASUR is the one where the shares are describing the business. Cancún, its franchise asset, handled 2.11m passengers in June, down 11.5%, international down 13.1%, as American and Delta trimmed beach routes and jet fuel spiked. Consolidated EBITDA rose 9%, but that is acquisitions: Mexican EBITDA fell 9%, Puerto Rico's 17%, and the adjusted margin lost 5.6 points to 62% on administrative costs up about 30%. Mexican commercial revenue per passenger fell to Ps.145.7. The group's new US concessions business earns roughly a 9% EBITDA margin. "The summer is lost, and we are expecting the recuperation process up to the end of the summer season," chief executive Adolfo Castro said on the July 24 call.

What the shares have done with it

Over twelve months ASUR is down 22.5%, GAP 14.1% and OMA 2.8%, all within a few percent of their 2026 lows and 26% to 33% below their highs — while the iShares MSCI Mexico ETF rose 22.6%. This is a sector de-rating, and a slow one: no session in the year took more than about 7% off any of the three. ASUR trades at 7.9 times trailing EBITDA, OMA 9.2 and GAP 10.2, with derived forward earnings multiples of 12.5, 12.8 and 16.5 times 2026 consensus.

The honest split: ASUR's decline is earned, and consensus already models its 2026 EBITDA down 2%. GAP's is not obviously earned on EBITDA, though the share issuance genuinely halves the per-share improvement. OMA's is not earned at all — no company-specific catalyst was discoverable for its 10.6% slide over the past thirty days, and the likelier reading is that it was sold as a Mexican travel proxy rather than for anything it reported. The regulatory cost these groups are being marked down for is contracted, dated and finite; the demand shortfall is not.

The piece nobody controls is seats. Volaris and Viva Aerobus, whose merger is still before Mexico's competition commission, supply most of the domestic traffic, and Pratt & Whitney engine inspections keep roughly 25 Volaris aircraft on the ground with two more years of work expected. The tariff ceiling will still be there when the planes come back.

A 5.27% Long Bond Repriced Brookfield Renewable; Brookfield Corp's Fee Capital Grew 19%

Hypothesis Opus 5 · Research Opus 5 · Writing Opus 5 · Prompt v1.6

Brookfield Renewable's units were paying a 5.04% distribution — less than the US government pays for thirty-year money — before the latest leg down. That inversion, not the operating results, is the mechanism behind a 14.8% fall over ninety days at a business whose chief executive called the quarter a record.

The record is genuine but mixed. Funds from operations rose 11% per unit and the payout is 73% of the trailing figure, inside the stated 70–80% band; reported revenue fell 1.8% and roughly $175m of the $421m quarter came from selling assets rather than selling power.

Parent Brookfield Corporation is the harder case: fee-bearing capital grew to $672bn and fee-related earnings 20%, yet the shares are lower over twelve months and fell 4% on 1 September beside Blackstone, KKR and Apollo, with no company news to explain it.

BEPBNCWENBEPCBAMXIFRNEECCJLEUBXKKRAPOARESSPYRenewable YieldcosLong-End RatesFee-Bearing CapitalPrivate Credit RedemptionsAsset Recycling & PPAs
TickerCompanySegmentTrend · 13mo30D1Y
The subject · what this brief is about
BEPBrookfield Renewable PartnersDiversified Renewable Generators🟢 Cont. Bull−5.9%+27.7%
BNBrookfieldReal Estate & Infrastructure⚠️ Emerging Bear−9.4%−6.8%
Compared against · context, not the story
CWENClearway EnergyWind & Solar Developers⚠️ Emerging Bear−0.8%+12.5%
BEPCBrookfield RenewableDiversified Renewable Generators⚠️ Emerging Bear−6.1%−2.7%
BAMBrookfield Asset ManagementReal Estate & Infrastructure🔴 Cont. Bear−3.2%−12.4%
XIFRXPLR InfrastructureRenewable & Infrastructure Assets🟢 Cont. Bull+1.9%+15.7%
NEENextEra EnergyVertically Integrated Utilities⚠️ Emerging Bear−3.6%+19.0%
CCJCamecoUranium⚠️ Emerging Bear+8.1%+30.6%
LEUCentrus EnergyUranium⚠️ Emerging Bear−9.9%−15.4%
BXBlackstoneAlternative & Private Capital🌱 Emerging Bull+0.3%−16.0%
KKRKKRAlternative & Private Capital🔴 Cont. Bear+1.4%−18.3%
APOApollo Global ManagementAlternative & Private Capital🌱 Emerging Bull+1.0%+2.2%
ARESAres ManagementAlternative & Private Capital🌱 Emerging Bull−1.0%−17.8%
SPYState Street SPDR S&P 500 ETF TrustAsset Management🟢 Cont. Bull+0.2%+21.1%

12-month price & trend

BEP
Brookfield Renewable Partners
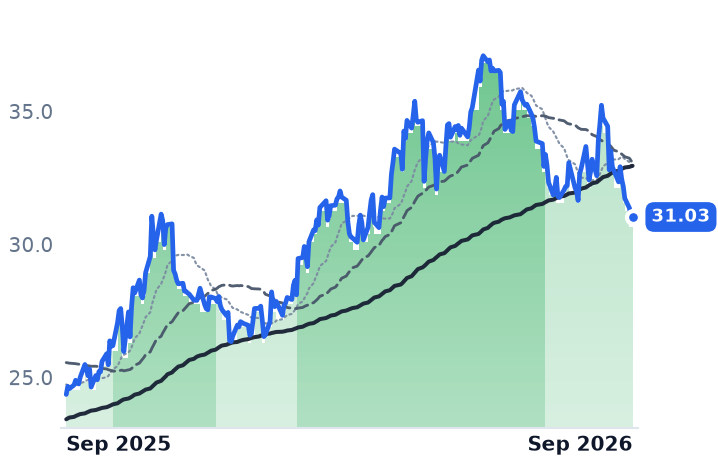
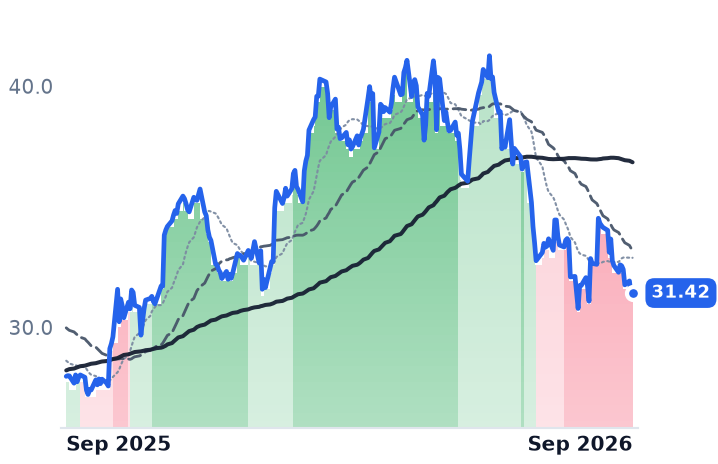
31.10
+0.07 (+0.23%)
vs. prior close
Price20d50d150d
BEP 12-month price
Diversified Renewable Generators
BN
Brookfield
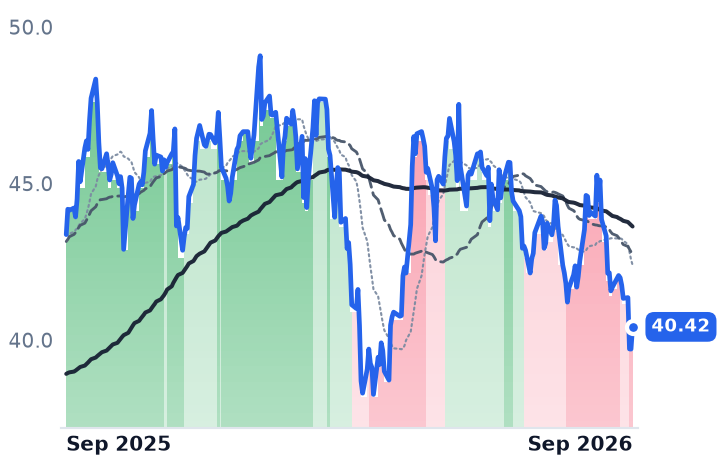
40.42
+0.71 (+1.79%)
vs. prior close
Price20d50d150d
BN 12-month price
Real Estate & Infrastructure
CWEN
Clearway Energy
31.47
+0.05 (+0.16%)
vs. prior close
Price20d50d150d
CWEN 12-month price
Wind & Solar Developers
TickerMkt capP/EP/E fwdP/SP/S fwdP/GPP/GP fwdEV/EBITDAFCF yld
BEP$9.5B67.6x1.5x1.4x6.1x5.8x9.7x-49.6%
BN$90.3B72.0x14.6x1.2x11.9x4.0x41.5x10.2x-9.2%
CWEN$6.5B41.4x4.1x3.9x7.8x7.4x14.4x10.4%
BEPC
Brookfield Renewable
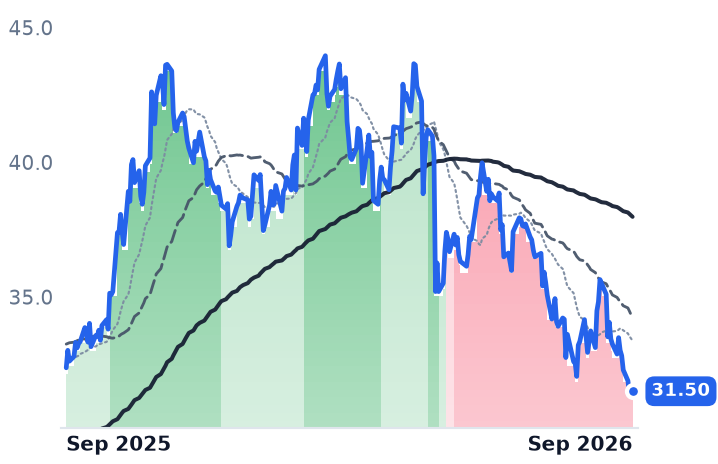
31.50
+0.12 (+0.38%)
vs. prior close
Price20d50d150d
BEPC 12-month price
Diversified Renewable Generators
BAM
Brookfield Asset Management
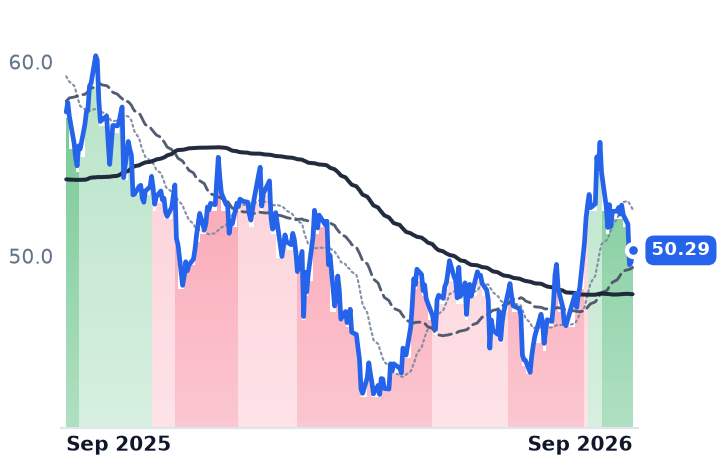
50.29
+0.62 (+1.25%)
vs. prior close
Price20d50d150d
BAM 12-month price
Real Estate & Infrastructure
XIFR
XPLR Infrastructure
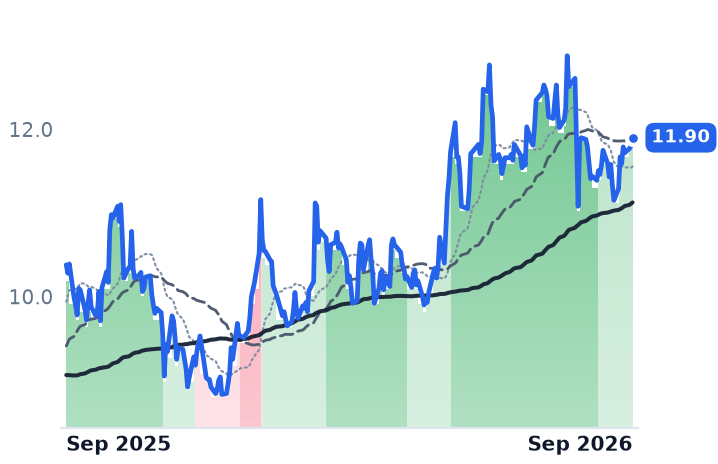
12.01
+0.11 (+0.92%)
vs. prior close
Price20d50d150d
XIFR 12-month price
Renewable & Infrastructure Assets
TickerMkt capP/EP/E fwdP/SP/S fwdP/GPP/GP fwdEV/EBITDAFCF yld
BEPC$5.2Bn/m1.3x0.9x2.7x1.9xn/m-10.6%
BAM$86.7B31.2x29.5x16.0x14.2x20.0x17.8x90.0x2.5%
XIFR$1.1B17.9x10.6x0.9x0.8x5.4x4.8x9.0x-56.0%
NEE
NextEra Energy
84.06
+0.96 (+1.16%)
vs. prior close
Price20d50d150d
NEE 12-month price
Vertically Integrated Utilities
CCJ
Cameco
101
+4.24 (+4.40%)
vs. prior close
Price20d50d150d
CCJ 12-month price
Uranium
LEU
Centrus Energy
170
−1.03 (−0.60%)
vs. prior close
Price20d50d150d
LEU 12-month price
Uranium
TickerMkt capP/EP/E fwdP/SP/S fwdP/GPP/GP fwdEV/EBITDAFCF yld
NEE$175.3B18.8x20.9x6.0x5.7x8.4x7.9x16.0x-5.8%
CCJ$42.0B163.2x62.6x16.7x11.8x60.7x42.9x67.3x0.9%
LEU$3.2B67.1x68.4x6.7x6.8x28.9x29.2x34.4x-7.0%
BX
Blackstone
138
+0.86 (+0.63%)
vs. prior close
Price20d50d150d
BX 12-month price
Alternative & Private Capital
KKR
KKR
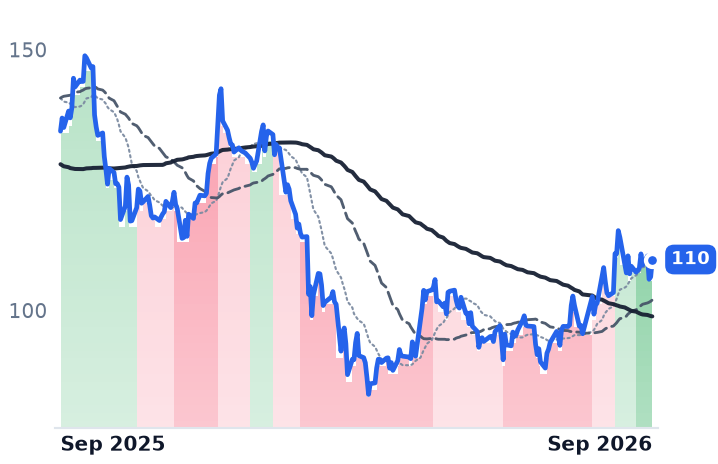
110
+3.33 (+3.13%)
vs. prior close
Price20d50d150d
KKR 12-month price
Alternative & Private Capital
APO
Apollo Global Management
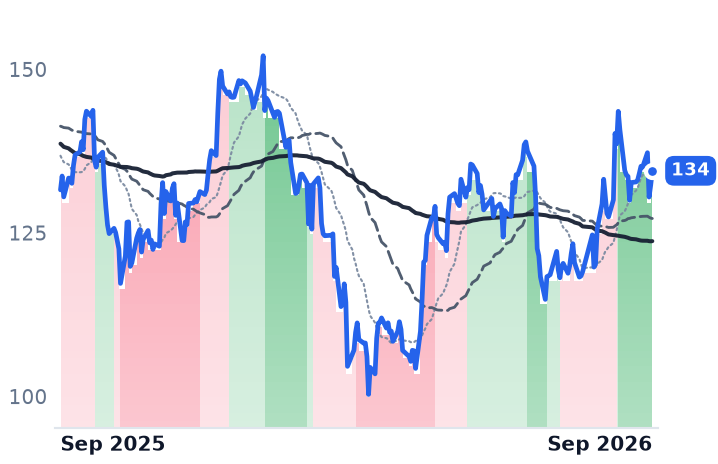
134
+2.20 (+1.66%)
vs. prior close
Price20d50d150d
APO 12-month price
Alternative & Private Capital
TickerMkt capP/EP/E fwdP/SP/S fwdP/GPP/GP fwdEV/EBITDAFCF yld
BX$173.2B31.9x24.0x10.8x11.8x12.2x13.3x21.9x2.5%
KKR$102.4B33.9x18.4x4.8x9.7x10.4x20.8x15.1x8.3%
APO$76.4B28.7x15.1x2.1x3.3x2.5x3.9x6.7x10.5%
ARES
Ares Management
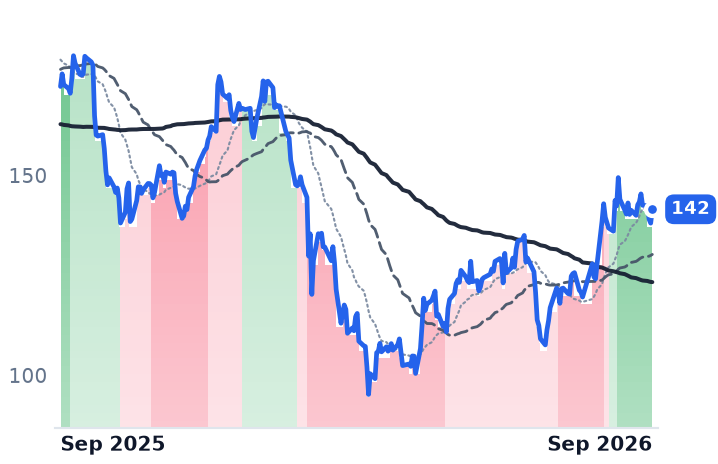
142
+3.46 (+2.51%)
vs. prior close
Price20d50d150d
ARES 12-month price
Alternative & Private Capital
SPY
State Street SPDR S&P 500 ETF Trust
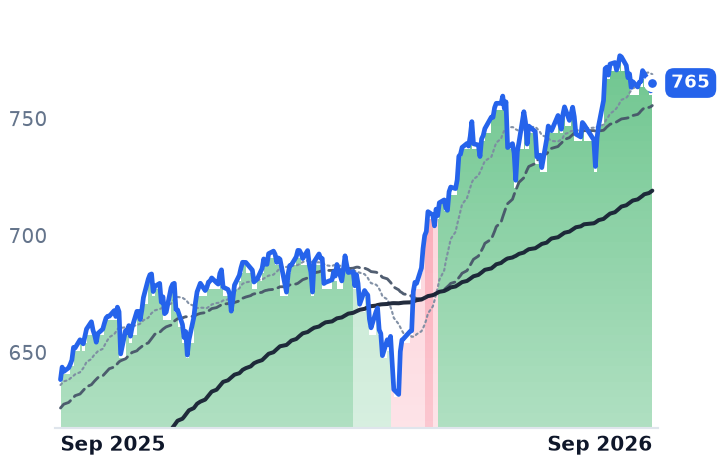
773
+8.01 (+1.05%)
vs. prior close
Price20d50d150d
SPY 12-month price
Asset Management
TickerMkt capP/EP/E fwdP/SP/S fwdP/GPP/GP fwdEV/EBITDAFCF yld
ARES$46.4B61.7x24.1x7.3x8.7x11.6x13.9x23.9x1.8%
SPY$773.0B

Consensus projections

TickerFY2026EFY2027EFY2028E
BEPRevenue+3.8%+9.0%−3.4%
EPS+14.0%−11.7%+9.4%
BNRevenue−7.6%+23.6%+22.3%
EPS+13.9%+23.1%+12.0%
CWENRevenue+14.8%+10.8%+13.4%
EPS−133.6%−152.5%+132.7%
BEPCRevenue+2.4%+18.4%+2.5%
EPS+283.7%−94.0%+510.2%
BAMRevenue+12.2%+16.1%+12.9%
EPS+12.9%+17.8%+16.8%
XIFRRevenue+0.8%+4.7%+1.3%
EPS−849.6%−44.0%−144.3%
NEERevenue+9.4%+9.7%+8.9%
EPS+9.0%+9.0%+8.5%
CCJRevenue+3.6%+10.9%+7.7%
EPS+7.3%+69.4%+25.2%
LEURevenue+4.8%−0.2%−9.4%
EPS−45.1%+17.7%−15.9%
BXRevenue+15.1%+24.9%+4.0%
EPS+11.3%+24.9%+10.7%
KKRRevenue+33.9%+17.8%+32.9%
EPS+26.0%+18.0%+15.7%
APORevenue+26.8%+16.1%+14.3%
EPS+10.4%+22.4%+15.6%
ARESRevenue+16.3%+19.1%+9.9%
EPS+17.3%+24.2%+18.2%

Forward fiscal years only. Blank means no analyst coverage for that year.

A levered owner of hydro, wind and solar plants is paying its unitholders less income than the US Treasury pays for thirty-year money. Brookfield Renewable's $0.392 quarterly distribution, an annualized $1.568, works out to 5.04% at $31.10 a unit; the 30-year Treasury yielded 5.27% on 1 September, its highest area since 2007 and the worst stretch for the long bond since 2006.

That inversion is the whole mechanism. A contracted-power vehicle is bought as a spread over the risk-free curve, and when the curve moves and the payout does not, the spread has to be rebuilt out of the unit price. It has been: the units are down 14.8% since early June and 16.6% from their 2026 high, having held above their long-term moving average from late January until this week, when the fifty-day average slipped beneath the two-hundred-day. Part of the final leg was arithmetic of a different kind — the units went ex-distribution on 31 August, and essentially the whole of that session's 1.15% decline was the payment coming out of the price.

The operating record is not what broke

"We delivered record financial results, robust capital deployment, and the highest levels of development and asset recycling in our history," chief executive Connor Teskey said on 31 July. The supporting facts are real: 1.3 gigawatts commissioned in the quarter, power purchase agreements signed for 2.6 gigawatts, roughly $12bn of financings executed including the largest private placement in the company's history against a Google-contracted hydro portfolio, and $2.2bn of asset sales agreed or closed at or above target returns. Funds from operations reached $421m, up 11% per unit, and the distribution absorbs 73% of the trailing-twelve-month figure of $2.14 — inside the 70–80% target the company sets itself.

Underneath, the composition is thinner than the headline. About $175m of that $421m was gains on developed-asset and non-core disposals, roughly two-fifths of the quarter. Reported revenue fell 1.8% year on year, the second consecutive quarterly decline, and gains from selling a further slice of a Maine hydro portfolio were needed to offset weak US hydrology. The units change hands at 9.7 times trailing enterprise value to earnings before interest, taxes, depreciation and amortization, and about 14.5 times trailing funds from operations per unit — hardly a distressed price after a 26.1% twelve-month advance.

The same wave, a different business

Brookfield Corporation, the Toronto manager that owns the renewable platform alongside real estate, infrastructure, credit and private equity, is not priced as a yield spread, and its numbers went the other way. Distributable earnings before realizations rose 15% to $1.4bn in the second quarter, fee-related earnings 20%, and fee-bearing capital 19% to $672bn on a record $77bn of quarterly fundraising, with Oaktree closing in July. The shares are down 7.2% over twelve months and 17.8% from their 2026 high, at 14.6 times forward earnings against roughly 16.9 times trailing distributable earnings before realizations — and about 41% below the $68 per share of long-term cash-flow value the company's own 2025 plan assigns itself.
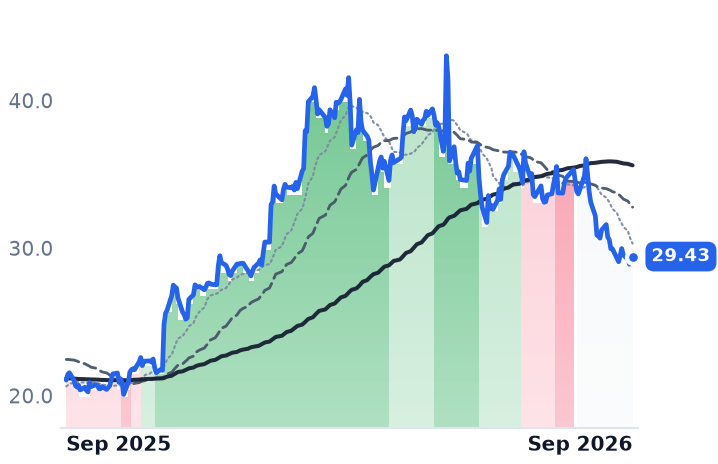
On 1 September the whole listed alternative-manager group fell together — Brookfield 4.0%, Blackstone 3.9%, KKR 4.1%, Apollo 4.9% — on a day the S&P 500 fund fell 0.5%, with no Brookfield-specific news discoverable. The group has gapped lower repeatedly this year on private-credit redemption fears rather than on earnings, and the likelier reading of that session is rates and sector rather than anything about the funding model.

The verdict the arithmetic supports

Brookfield Renewable's de-rating is earned, and the earning is mechanical: a 5.04% payout could not survive beside a 5.27% long bond, and an operating base where two-fifths of the quarter's cash earnings came from disposals gives a buyer little reason to pay up for the difference. Clearway Energy, the Princeton owner of about 5,000 net megawatts of wind and solar, fell harder still, 21.9% over ninety days, on 22.7% revenue growth — after cutting 2026 cash available for distribution guidance to $430–470m from $470–510m on weak wind. Rates are doing most of the work across the group, weather the rest.

Brookfield Corporation's decline is the one nothing in the reported numbers explains. Higher discount rates compress the present value of carried interest and balance-sheet marks, a genuine channel, but fee-bearing capital growing at 19% is the opposite of the private-credit stress the sector's worst sessions are pricing.

Two dated events sit ahead of both. Unitholders vote on 14 October on collapsing the renewable partnership and its corporate twin into a single company, one for one. And Westinghouse — 51% Brookfield-owned, its contribution up more than 60% year on year — filed a confidential draft registration statement on 3 August for a listing it is compelled to hold once it reaches a $30bn valuation. Nothing in the current price of either security depends on a number the market has yet been allowed to see.

ESAB's Sales Hit a Record; Operating Income Fell 27.8% as the $1.45bn Eddyfi Deal Closed

Hypothesis Opus 5 · Research Opus 5 · Writing Opus 5 · Prompt v1.6

A welding maker that raised its full-year profit guidance in August has lost roughly a third of its value over twelve months, and the reason is not demand. ESAB's second-quarter sales grew 12.9% but only 2.5% before acquisitions and currency, and the debt and equity raised to buy the inspection business Eddyfi cost $0.16 a share — more than Eddyfi itself contributed.

Lincoln Electric, the closest comparable, reported its first volume growth in nine quarters and says the Americas industrial recovery is durable. Arc time in North American fab shops is expanding. ESAB trades at 13.7x forward earnings against Lincoln's 24.4x, and what the market is repricing sits below the gross-profit line.

ESABMECLECODEAGCOITWKMTCMIPCARNPONUEWelding Consumables & EquipmentIndustrial Fabrication RecoveryAcquisition Debt FinancingNondestructive TestingData-Center Critical Power
TickerCompanySegmentTrend · 13mo30D1Y
The subject · what this brief is about
ESABESABWelding & Cutting Solutions🔴 Cont. Bear−21.2%−34.3%
MECMayville EngineeringWelding & Cutting Solutions🟢 Cont. Bull−29.9%+37.0%
Compared against · context, not the story
LECOLincoln ElectricWelding & Cutting Equipment🟢 Cont. Bull−1.4%+14.8%
DEDeereAgricultural Tractors & Equipment🌱 Emerging Bull+12.5%+49.4%
AGCOAGCOAgricultural Tractors & Equipment⚠️ Emerging Bear+17.4%+17.4%
ITWIllinois Tool WorksSpecialty Components & Systems⚠️ Emerging Bear−7.9%+6.0%
KMTKennametalMetal Cutting Tools⚠️ Emerging Bear−18.4%+39.8%
CMICumminsPower & Propulsion Systems🟢 Cont. Bull−14.2%+40.2%
PCARPACCARSpecialty Components & Systems🟢 Cont. Bull−8.4%+32.2%
NPOEnPro IndustriesSpecialty Components & Systems🟢 Cont. Bull−11.8%+39.8%
NUENucorIntegrated Steelmakers🟢 Cont. Bull−4.2%+82.7%

12-month price & trend

ESAB
ESAB
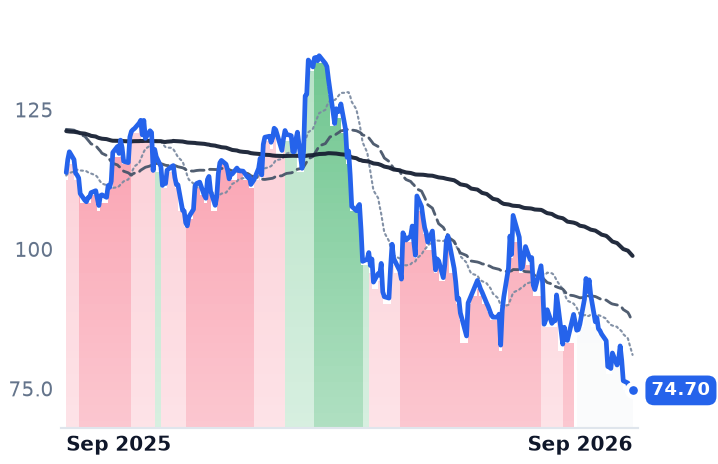
74.70
+0.73 (+0.99%)
vs. prior close
Price20d50d150d
ESAB 12-month price
Welding & Cutting Solutions
MEC
Mayville Engineering
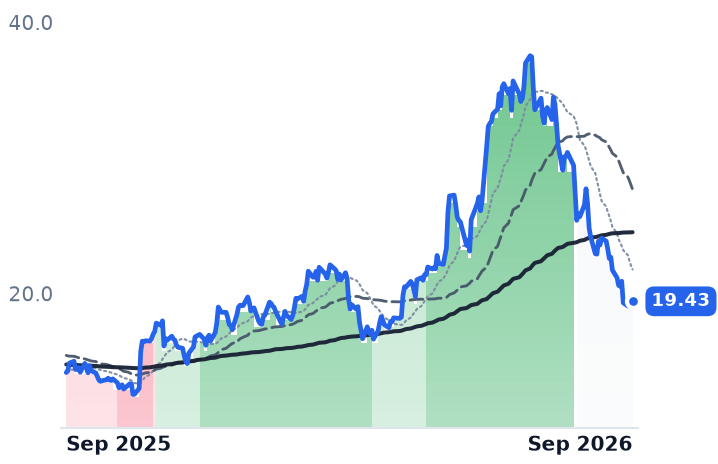
19.43
+0.20 (+1.04%)
vs. prior close
Price20d50d150d
MEC 12-month price
Welding & Cutting Solutions
LECO
Lincoln Electric
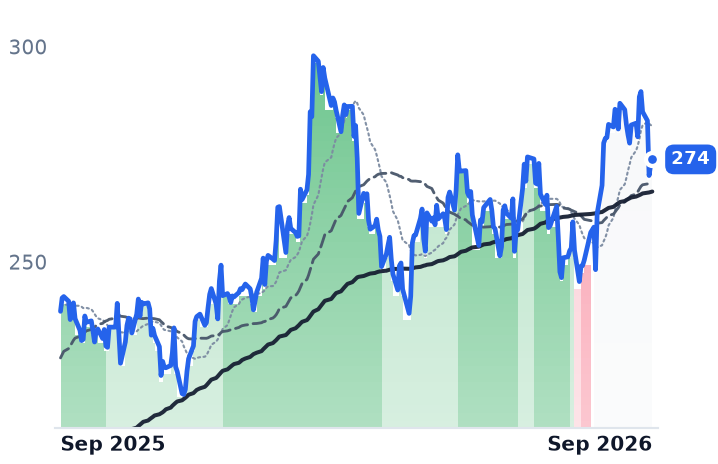
274
+1.24 (+0.45%)
vs. prior close
Price20d50d150d
LECO 12-month price
Welding & Cutting Equipment
TickerMkt capP/EP/E fwdP/SP/S fwdP/GPP/GP fwdEV/EBITDAFCF yld
ESAB$4.5B27.4x13.7x1.5x1.5x4.2x4.2x15.2x4.3%
MEC$408.4Mn/m75.1x0.7x0.6x8.1x7.5x23.2x-1.1%
LECO$14.9B27.1x24.4x3.3x3.2x9.3x8.8x17.8x3.5%
DE
Deere
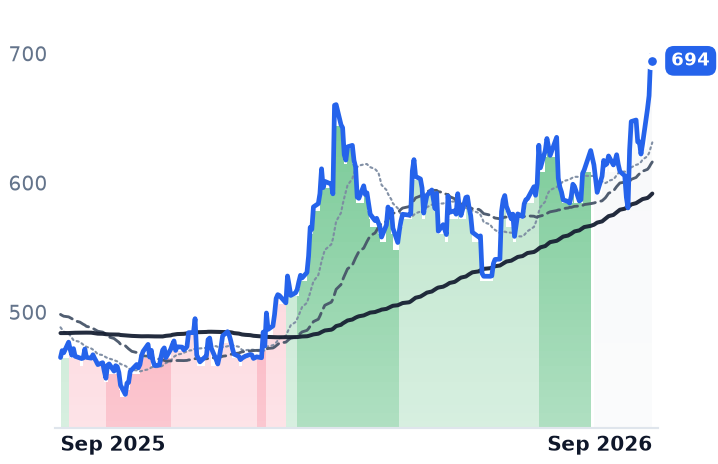
694
−3.96 (−0.57%)
vs. prior close
Price20d50d150d
DE 12-month price
Agricultural Tractors & Equipment
AGCO
AGCO
126
−0.87 (−0.69%)
vs. prior close
Price20d50d150d
AGCO 12-month price
Agricultural Tractors & Equipment
ITW
Illinois Tool Works
272
+2.56 (+0.95%)
vs. prior close
Price20d50d150d
ITW 12-month price
Specialty Components & Systems
TickerMkt capP/EP/E fwdP/SP/S fwdP/GPP/GP fwdEV/EBITDAFCF yld
DE$151.8B31.5x31.4x3.3x3.7x9.3x10.3x18.0x2.4%
AGCO$8.2B10.7x18.9x0.8x0.8x3.2x3.1x7.2x6.7%
ITW$71.3B22.8x21.9x4.4x4.3x10.0x9.7x17.2x3.8%
KMT
Kennametal
29.43
−0.02 (−0.07%)
vs. prior close
Price20d50d150d
KMT 12-month price
Metal Cutting Tools
CMI
Cummins
546
−5.40 (−0.98%)
vs. prior close
Price20d50d150d
CMI 12-month price
Power & Propulsion Systems
PCAR
PACCAR
125
+2.38 (+1.95%)
vs. prior close
Price20d50d150d
PCAR 12-month price
Specialty Components & Systems
TickerMkt capP/EP/E fwdP/SP/S fwdP/GPP/GP fwdEV/EBITDAFCF yld
KMT$2.6B19.3x9.4x1.2x1.1x3.9x3.6x9.0x2.8%
CMI$81.1B29.9x19.9x2.3x2.2x9.2x8.5x17.4x4.2%
PCAR$58.1B23.5x19.4x2.1x2.0x14.1x13.4x20.0x5.6%
NPO
EnPro Industries
295
+4.68 (+1.61%)
vs. prior close
Price20d50d150d
NPO 12-month price
Specialty Components & Systems
NUE
Nucor
262
−1.50 (−0.57%)
vs. prior close
Price20d50d150d
NUE 12-month price
Integrated Steelmakers
TickerMkt capP/EP/E fwdP/SP/S fwdP/GPP/GP fwdEV/EBITDAFCF yld
NPO$6.6B151.6x33.8x5.6x5.1x13.2x12.1x35.4x2.6%
NUE$51.7B22.3x15.9x1.5x1.4x10.8x9.7x11.5x1.0%

Consensus projections

TickerFY2026EFY2027EFY2028E
ESABRevenue+13.3%+9.2%+4.2%
EPS+3.2%+18.3%+13.5%
MECRevenue+16.5%+14.1%+8.1%
EPS+121.9%+293.2%+40.4%
LECORevenue+10.7%+6.2%+6.3%
EPS+14.9%+11.7%+9.8%
DERevenue+7.8%+9.5%+9.7%
EPS−3.0%+28.7%+22.8%
AGCORevenue+7.9%+5.4%+5.7%
EPS+20.5%+34.1%+28.7%
ITWRevenue+3.6%+3.5%+3.3%
EPS+8.0%+7.0%+6.0%
KMTRevenue+17.3%+11.9%−0.6%
EPS+165.5%+4.0%−40.5%
CMIRevenue+13.1%+8.9%+8.0%
EPS+29.6%+16.9%+16.9%
PCARRevenue+10.1%+8.3%+8.1%
EPS+12.8%+18.1%+14.4%
NPORevenue+13.6%+6.3%
EPS+17.5%+12.5%
NUERevenue+16.3%+2.4%+1.5%
EPS+79.7%+9.6%+6.0%

Forward fiscal years only. Blank means no analyst coverage for that year.

ESAB Corporation, which sells welding wire, electrodes, fluxes and cutting equipment through industrial distributors, reported record quarterly sales on 6 August and told investors it would make more money this year than it had previously promised. Sales reached $808m, up 12.9%, full-year core adjusted earnings before interest, taxes, depreciation and amortization guidance went up to $615–625m, and the shares then ground out one 52-week low after another — $89.06, then $83.14, then $82.15, most recently $77.28.

What is being repriced is a purchase, not a market. ESAB paid $1.45bn for Eddyfi Technologies, a non-destructive inspection business, closing 1 June, and the money to pay for it — pre-funded debt in March, mandatory convertible preferred stock, and 1.25m common shares issued in June — cost $0.16 a share in the quarter while Eddyfi's own contribution was $0.07.

The damage is below the gross line

ESAB's gross margin expanded 86 basis points to 38.0% and gross profit rose 15.5%. Operating income fell 27.8% to $78.7m and net income fell 51.6% to $32.4m. Nothing in that gap is pricing or input cost; it is acquisition, integration and financing charges. On the company's core adjusted basis, EBITDA of $150m rose 8% but margin slipped 90 basis points to 19.5%, and earnings of $1.33 a share were down 1%. Management carries roughly $15m of what it calls transitory price/cost drag, with pricing at 2% in the quarter and expected near 3% in the second half.

The organic softness is geographic. Americas sales of $316m grew 5% organically, with North American equipment and automation up double digits; Europe, the Middle East and Asia-Pacific grew 14% to $450m but just 1% organically, dragged by a Middle East business worth 7–8% of revenue that fell 10–11% as logistics costs into the region tripled. "Prior to the conflict, that region was growing high double digits for us, closer to 20%," chief executive Shyam Kambeyanda told investors on 6 August. Consumables — the by-the-pound annuity — grew low single digits globally; equipment grew double digits. "The ESAB you see today is a transformed enterprise with equipment now representing over 50% of our revenue," Kambeyanda said, against 38% a decade ago.

Lincoln Electric says the meter is running faster

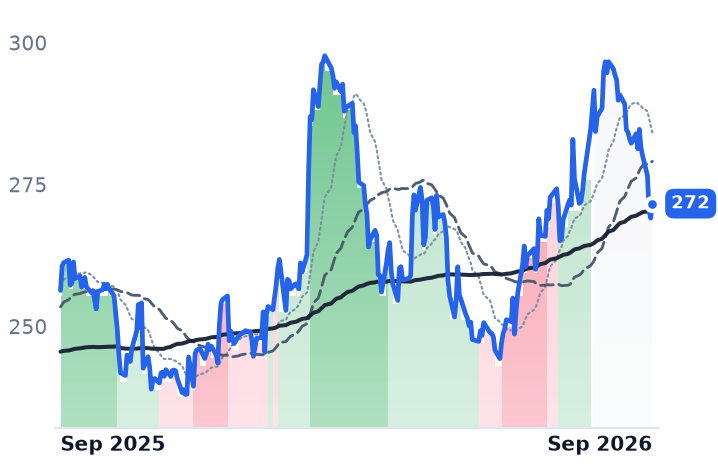
Lincoln Electric, the $14.9bn welding equipment and consumables maker that is ESAB's nearest direct competitor, grew organic sales 10% in its June quarter. Americas Welding rose 11% on seven points of volume, with general fabrication up 30%. "Second quarter marked a solid inflection to volume growth in the business after 9 quarters of compression," chairman and chief executive Steven Hedlund said on 30 July. Its International Welding segment shrank 4.5% on a roughly 5% volume decline in Europe — corroborating ESAB's flat continent rather than contradicting it. Lincoln also raised full-year guidance, and trades at 24.4x forward earnings against ESAB's 13.7x. A year ago, ESAB's own $114.06 share price implied about 20.9x the same $5.45 of 2026 consensus earnings.

The other name on the same shelf

Mayville Engineering, a $408m build-to-print contract fabricator that sells finished assemblies and no welding consumables at all, is filed under the same metal-fabrication label. It raised full-year revenue guidance to $620–650m on 5 August, grew data-center and critical-power sales 173% organically, and has still fallen 48% from a 29 June peak. Its de-rating has a ledger behind it: free cash flow guidance cut to $7–15m, net debt of $134.7m, leverage of 2.9x against a 2.5x target, and 75x forward earnings. Build rates are not the culprit for either company — July Class 8 truck orders rose 71% year over year with 2026 slots full.

What the decline earns

ESAB has earned part of its discount: 2.5% core organic growth against Lincoln's 10%, a flat Europe, a shrinking Middle East, and a margin line that pays for the deal before it collects on it. What nothing in the quarter earns is the roughly 44% gap to Lincoln's forward multiple, which prices Eddyfi's expected $50m of EBITDA and $20m-plus of targeted synergies as unlikely to arrive. ESAB's heaviest selling day came on 19 August, nearly two weeks after the print, with no discoverable announcement; the likelier reading is position liquidation rather than fresh news.

Management concedes Eddyfi is dilutive to neutral in the fourth quarter before turning positive in 2027. Until then ESAB is judged on a profit line carrying the price of the purchase and none of its earnings — in a welding market that, for the first time in more than two years, is growing again.

Golar Booked $37m of Cameroon Commodity Earnings in a Contract That Ended in July

Hypothesis Opus 5 · Research Opus 5 · Writing Opus 5 · Prompt v1.6

Golar LNG sells liquefaction as a toll, and the toll is genuinely contracted — $17bn of it through 2045. But the vessel that produced the best quarter in the company's recent history has just stopped earning. Hilli finished its eight-year Cameroon contract and sailed on 4 August for shipyard work; its Argentine charter does not start until the second half of 2027.

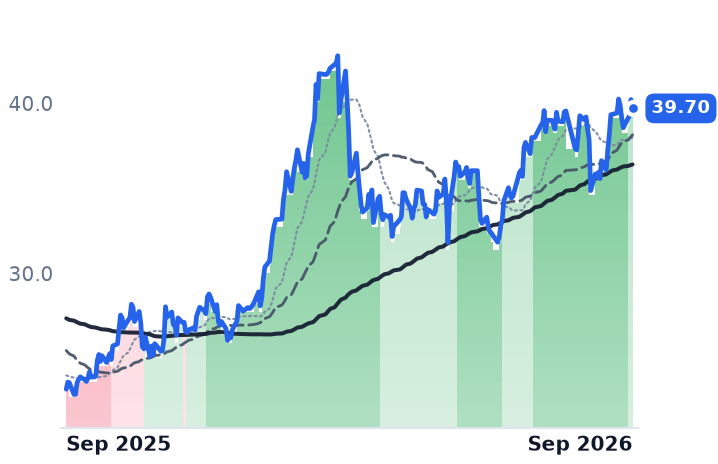
That leaves a roughly twelve-month hole in a portfolio marketed as an annuity, and it is why consensus earnings per share falls from $1.11 this year to $0.50 next before reaching $4.13 in 2028. The other floating-LNG asset, Gimi, invoiced 15% above its contractual day rate in the second quarter — the operational evidence is strong, the near-term income statement is not. Excelerate Energy, running the import side of the same trade, raised full-year adjusted earnings guidance to $490–515m; New Fortress Energy, which ran the same assets on merchant margins and debt, is a $79.7m stub.

GLNGEENFEFloating LNG LiquefactionFSRU RegasificationTolling Contract BacklogArgentina LNG ExportShipyard Capacity Costs
TickerCompanySegmentTrend · 13mo30D1Y
GLNGGolar LNGMarine LNG & LPG Transportation🟢 Cont. Bull+5.2%+20.0%
EEExcelerate EnergyLNG Infrastructure🟢 Cont. Bull+1.3%+71.1%
NFENew Fortress EnergyOil & Gas Midstream🔴 Cont. Bear−19.5%−87.9%

12-month price & trend

GLNG
Golar LNG
51.99
−1.14 (−2.15%)
vs. prior close
Price20d50d150d
GLNG 12-month price
Marine LNG & LPG Transportation
EE
Excelerate Energy
39.70
−0.52 (−1.29%)
vs. prior close
Price20d50d150d
EE 12-month price
LNG Infrastructure
NFE
New Fortress Energy
0.28
+0.00 (+1.01%)
vs. prior close
Price20d50d150d
NFE 12-month price
Oil & Gas Midstream
TickerMkt capP/EP/E fwdP/SP/S fwdP/GPP/GP fwdEV/EBITDAFCF yld
GLNG$5.3B32.5x47.0x10.1x12.7x18.4x23.1x20.2x-5.2%
EE$4.6B26.6x24.7x3.1x3.0x8.4x8.2x11.6x0.8%
NFE$79.7Mn/m0.1x0.0x1.7x0.7xn/m-702.1%

Consensus projections

TickerFY2026EFY2027EFY2028E
GLNGRevenue+4.5%−3.1%+106.0%
EPS−20.3%−55.3%+733.7%
EERevenue+27.8%+27.9%+21.4%
EPS+16.4%+28.8%+23.2%
NFERevenue+89.1%+3.5%−36.7%
EPS−72.6%−104.2%−180.0%

Forward fiscal years only. Blank means no analyst coverage for that year.

Golar LNG's Hilli Episeyo sailed from Cameroon on 4 August, ending an eight-year liquefaction contract that had just delivered the company's strongest quarter in years — and taking roughly a year of charter income out of the fleet with it.

Golar, a Bermuda-based owner of floating liquefaction and regasification vessels, does not sell gas. It converts other people's molecules for a fixed fee per ton on multi-decade charters, with commodity-linked tiers layered on top. The whole investment case rests on whether that contracted fee actually converts into delivered cash on the dates promised. Hilli's departure is the first hard test, and it fails on timing even as it passes on performance.

The quarter, decomposed

Second-quarter revenue was $130.5m, up 72% year over year, with gross margin at 57% against 41% a year earlier. Adjusted earnings before interest, tax, depreciation and amortization came to $127m, up from $106m in the first quarter. But $37m of that — close to 29% — was Hilli's commodity-linked Cameroon tier, against only $10m in the first quarter. The sequential improvement was the commodity leg, in the last full quarter that leg existed.

The fixed-fee half of the story is in better shape. Gimi, 70%-owned and on charter to BP offshore Mozambique, has offloaded 41 cargoes, produced 15% above its committed volume, and invoiced a second-quarter day rate 15% above the contractual rate. Golar's share of that backlog is about $2.9bn over the charter's remaining 19 years. Hilli itself finished Cameroon with 156 cargoes and 100% economic uptime.

A year of nothing, then twenty years of something

Hilli now goes to Singapore for modifications ahead of a 20-year charter to Southern Energy S.A. in Argentina, which pays net hire of $285m a year plus 25% of free-on-board prices above $8 per million British thermal units. It starts in the second half of 2027. Esperanza, the second Argentine unit, follows in 2028. Together they add $13.7bn of fixed backlog before any commodity upside — and produce nothing at all in between.

That gap is visible in the numbers everyone else uses. Consensus earnings per share runs $1.11 this year, $0.50 next, then $4.13 in 2028, with the low 2027 estimate at minus $0.32. It is also why Golar's forward price-to-earnings ratio of 47.0x sits above its trailing 32.5x — an inversion caused by a deployment calendar rather than by deterioration. On enterprise value to EBITDA the shares trade at 20.2x trailing; against the roughly $829m of 2028 consensus EBITDA and an enterprise value near $7.1bn, the same asset base looks entirely different.

Management is spending into the gap rather than hoarding through it. Golar ordered a fourth vessel, a 3.5 million-ton-per-year unit at CIMC Raffles on a $2.45bn budget for late 2029 — about 10% above Esperanza's $2.2bn, because long-lead equipment now costs 40% to 60% more. "The fourth FLNG order will deliver within 2029 and be the earliest available FLNG capacity globally," chief executive Karl Staubo told investors on August 13. Liquidity stands at $1.5bn against $1.8bn of net debt, and a strategic review with Goldman Sachs International, opened on 25 March, remains open.

The import side, and the casualty

Excelerate Energy, the largest owner of floating regasification units, is the same trade pointed the other way, and its cash arrives now. It raised 2026 adjusted EBITDA guidance to $490–515m against $449.3m last year, carries net leverage of 1.9x, and recontracted the FSRU Express to a Frontera Energy subsidiary in Colombia at roughly a 35% earnings uplift — its fifth asset recontracted higher in four and a half years, with only 56 such vessels in operation worldwide. Two caveats: the 12% quarterly EBITDA growth came mainly from the Jamaica platform bought from New Fortress for $1.055bn, and the Iraq terminal has slipped to early in the second quarter of 2027. At 11.6x trailing EV/EBITDA it is priced at roughly half Golar's multiple.

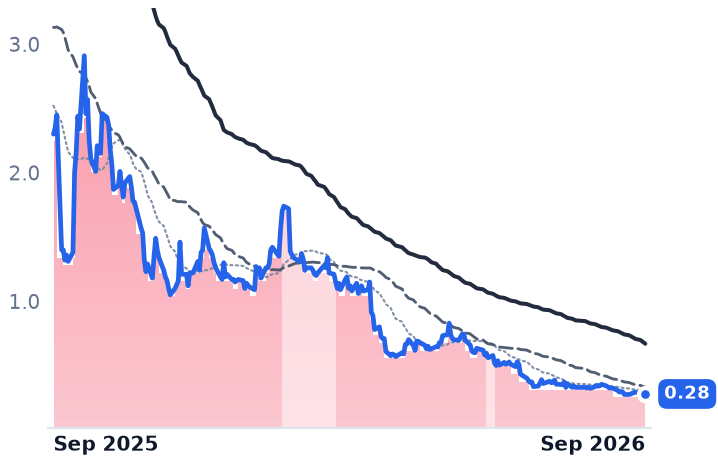
New Fortress Energy built comparable assets on debt and merchant margin, and the margin went first: gross profit fell from $1.10bn in 2024 to $136.8m in 2025 and turned negative in the first quarter of 2026. An English court sanctioned restructuring plans in June eliminating about $9.6bn of debt; the listed equity is a $79.7m stub behind preferred stock convertible into 87% of fully diluted shares.

What the shares have priced

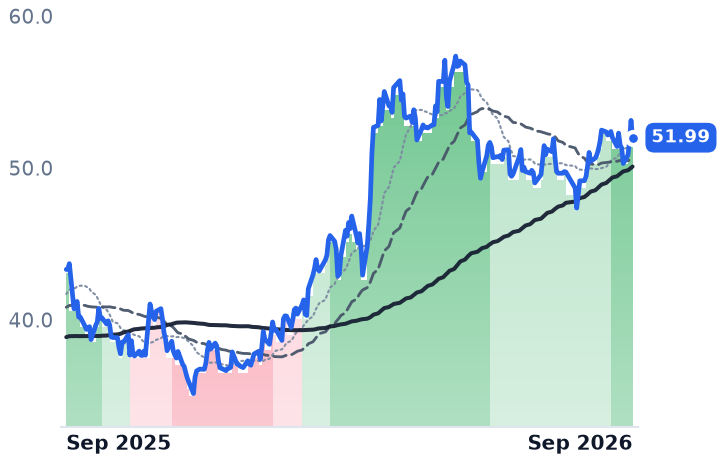
Golar has held a rising trend all year, its 50-day average above its 200-day since February, and closed at $51.99 — up 18.6% over twelve months but still 9.4% below its high. Excelerate is up 70.2% over the same span. New Fortress, in a falling trend since March, sits within a cent of its twelve-month low.

The verdict splits by which half of the model each company runs. Excelerate's re-rating is earned by contracts already signed and cash already guided. Golar's is not earned by 2027, which the company itself concedes will be thin; it is a claim on 2028 delivery dates at a Chinese and Singaporean yard, and the twelve-month gap is the price of admission. What nothing in the accounts yet explains is the commodity tier: with Asian spot cargoes at a four-year high near $23 per million British thermal units after Qatari force majeure took 12.8 million tons of capacity offline, chief financial officer Eduardo Maranhao told investors the movement "could increase the value of our commodity exposure by up to $500 million per year during the first 3 years of SESA operations." None of that is contracted, and none of it arrives before Hilli does.

Hilli spent eight years proving the toll model pays, without missing a month. It will spend the next twelve in a shipyard earning nothing, while the market prices the twenty years after that.

Service and Finance Carry Lithia, Penske and AutoNation as New-Vehicle Gross Fell 13.5%

Hypothesis Opus 5 · Research Opus 5 · Writing Opus 5 · Prompt v1.6

Selling vehicles is no longer what pays the biggest franchised car dealers, and their reported profits show it: gross profit and operating income fell year over year at all three of Lithia, Penske and AutoNation in the June quarter, while earnings per share rose.

At the average US dealership, fixed operations — parts, service, warranty and collision — produced 52.8% of all gross profit in the second quarter, up from 50.1% a year earlier, and finance-and-insurance income per vehicle hit a record $1,769. Lithia's after-sales margin reached 59.2%; AutoNation's after-sales gross was a record $607m; Penske's same-store service gross grew 5.7%.

The composition of dealer profit is genuinely improving. The total is not, and buybacks are doing the rest. Penske's share price answers to something else entirely — a $210 take-private proposal from its own controlling owners.

LADPAGANGPIABGSAHRUSHAAuto Dealership ConsolidationFixed Operations & PartsFinance & Insurance IncomeNew-Vehicle Margin NormalizationCaptive Auto LendingTake-Private Transactions
TickerCompanySegmentTrend · 13mo30D1Y
The subject · what this brief is about
LADLithia MotorsTraditional Dealership Groups🌱 Emerging Bull+2.2%+14.9%
PAGPenske AutomotiveTraditional Dealership Groups🌱 Emerging Bull+0.3%+21.7%
ANAutoNationTraditional Dealership Groups🟢 Cont. Bull−3.9%−6.0%
Compared against · context, not the story
GPIGroup 1 AutomotiveTraditional Dealership Groups🔴 Cont. Bear−0.5%−39.4%
ABGAsbury AutomotiveTraditional Dealership Groups🌱 Emerging Bull−3.3%−15.1%
SAHSonic AutomotiveTraditional Dealership Groups🌱 Emerging Bull−10.0%−1.0%
RUSHARush EnterprisesCommercial Truck Dealerships🟢 Cont. Bull−39.8%−11.9%

12-month price & trend

LAD
Lithia Motors
379
+6.76 (+1.82%)
vs. prior close
Price20d50d150d
LAD 12-month price
Traditional Dealership Groups
PAG
Penske Automotive
220
+1.56 (+0.72%)
vs. prior close
Price20d50d150d
PAG 12-month price
Traditional Dealership Groups
AN
AutoNation
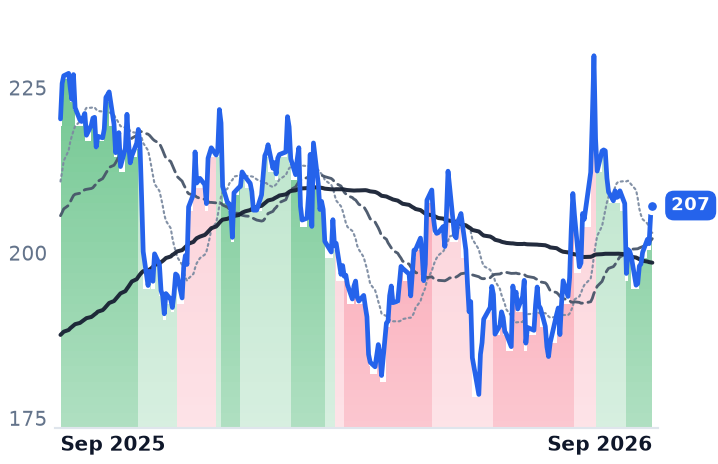
207
+1.34 (+0.65%)
vs. prior close
Price20d50d150d
AN 12-month price
Traditional Dealership Groups
TickerMkt capP/EP/E fwdP/SP/S fwdP/GPP/GP fwdEV/EBITDAFCF yld
LAD$8.3B12.5x10.5x0.2x0.2x2.0x2.0x17.4x-6.1%
PAG$14.4B16.2x16.1x0.4x0.4x2.7x2.7x13.7x4.1%
AN$6.9B9.4x9.5x0.3x0.2x1.4x1.4x11.1x0.2%
GPI
Group 1 Automotive
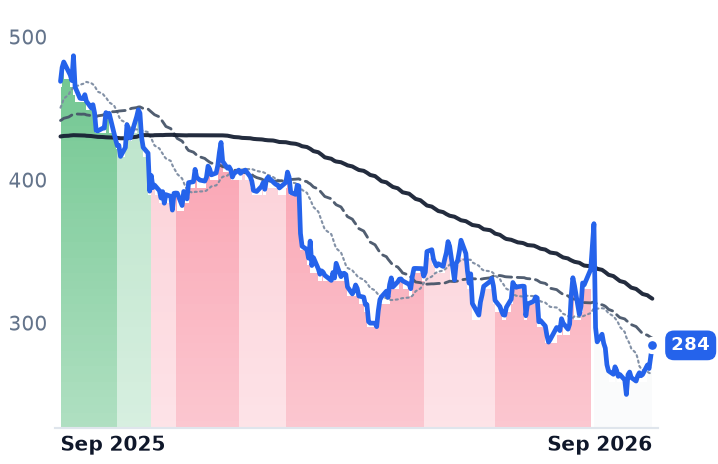
284
+7.92 (+2.87%)
vs. prior close
Price20d50d150d
GPI 12-month price
Traditional Dealership Groups
ABG
Asbury Automotive
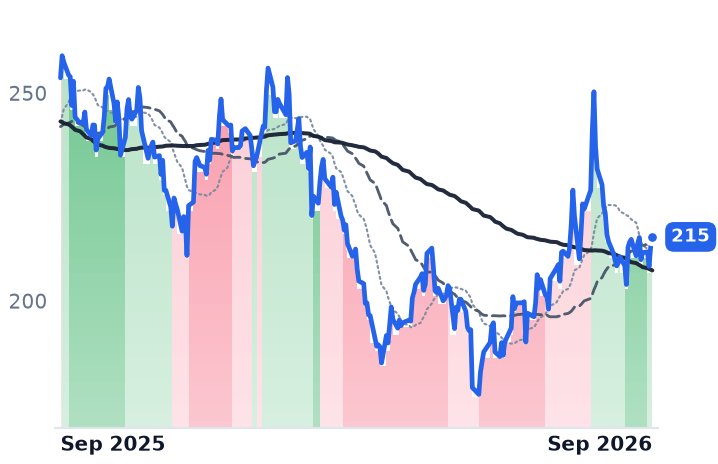
215
+2.34 (+1.10%)
vs. prior close
Price20d50d150d
ABG 12-month price
Traditional Dealership Groups
SAH
Sonic Automotive
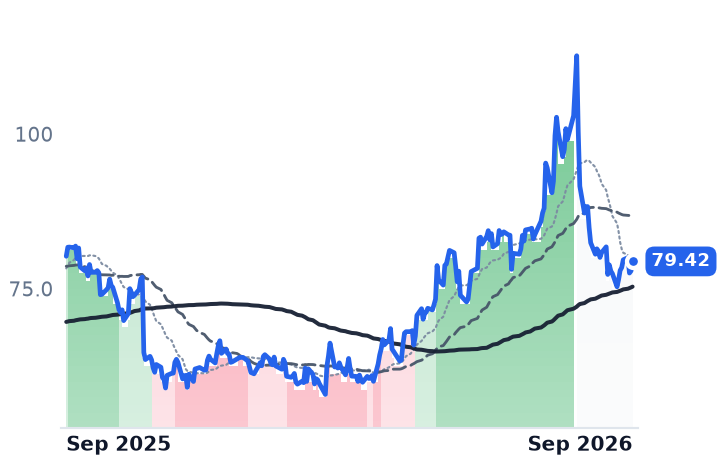
79.42
+1.54 (+1.98%)
vs. prior close
Price20d50d150d
SAH 12-month price
Traditional Dealership Groups
TickerMkt capP/EP/E fwdP/SP/S fwdP/GPP/GP fwdEV/EBITDAFCF yld
GPI$3.7B11.5x7.4x0.2x0.2x1.1x1.1x8.6x7.5%
ABG$3.3B8.3x7.0x0.2x0.2x1.1x1.1x8.9x18.0%
SAH$2.5B22.8x10.9x0.2x0.2x1.1x1.1x13.4x10.5%
RUSHA
Rush Enterprises
49.80
+0.47 (+0.96%)
vs. prior close
Price20d50d150d
RUSHA 12-month price
Commercial Truck Dealerships
TickerMkt capP/EP/E fwdP/SP/S fwdP/GPP/GP fwdEV/EBITDAFCF yld
RUSHA$5.7B14.5x19.9x0.8x0.7x4.2x3.9x13.0x2.2%

Consensus projections

TickerFY2026EFY2027EFY2028E
LADRevenue+1.8%+3.6%+5.0%
EPS+2.6%+16.7%+12.2%
PAGRevenue+6.7%+2.5%+2.2%
EPS+1.0%+6.6%+7.0%
ANRevenue−0.4%+3.2%+2.1%
EPS+9.1%+13.5%+13.9%
GPIRevenue+0.7%+3.3%+4.9%
EPS+2.1%+12.5%+10.2%
ABGRevenue−0.6%+4.5%+7.4%
EPS−8.2%+14.8%+8.7%
SAHRevenue+2.5%+4.3%+4.9%
EPS+3.0%+9.4%+4.5%
RUSHARevenue+5.2%+10.5%+5.5%
EPS+18.2%+23.5%+21.7%

Forward fiscal years only. Blank means no analyst coverage for that year.

Franchised car dealers spent the June quarter making less money on every vehicle they sold, and their most profitable department did not sell one. Gross profit per new vehicle retailed at the average US franchised dealership fell 13.5% year over year to $1,840, and used-vehicle gross fell 10.0% to $1,409, according to the Presidio-NCM dealership benchmark. Over the same three months fixed operations — parts, service, warranty and collision work — grew gross profit 5.2% and passed half the store's total, at 52.8% of all dealership gross profit against 50.1% a year earlier.

That crossover is the business case at Lithia, Penske and AutoNation, and it is not yet enough: the average dealership's pretax profit still fell 11.8%. The annuity lines are cushioning vehicle-margin normalization rather than replacing it, and at the three largest listed groups the gap between shrinking gross profit and rising earnings per share is being closed by share count.

The service drive

Lithia Motors, which runs US and UK stores under the Lithia and Driveway brands plus its own lender, reported record second-quarter revenue of $9.79bn — but same-store revenue fell 1.6% and same-store gross profit 2.7%. After-sales gross rose 3.1% with margin up 120 basis points to 59.2%, helped by longer manufacturer warranties, and now accounts for 42% of company gross profit at lower cost to serve. "The quality of these earnings is what really stands out to me. New vehicle margins continue to be stable. Used vehicle profitability strengthened considerably," chief executive Bryan DeBoer told investors on July 29. Used gross per unit reached $2,019, up $339 sequentially on deliberately lower volume.

AutoNation, the Sunbelt-weighted retailer with 339 franchises across 247 stores, posted record after-sales gross of $607m, with customer-pay revenue up 7% and wholesale parts up 16% through a centralized supply chain management says is taking commercial parts share from the independent aftermarket. New-vehicle gross held at $2,381 a unit for a fourth consecutive quarter even as units fell 4%. Revenue, gross profit and operating income all fell — the last by 4.3%.

Penske Automotive, which pairs premium US and international franchises with 37 commercial-truck dealerships, grew same-store service and parts gross profit $27.1m, or 5.7%, with margin widening to 59.0% from 58.4% — the strongest fixed-operations growth of the three. Its revenue rose 6.0% to $8.51bn; operating income fell 7.6%, and selling costs ran 71.8% of gross profit against Lithia's 68.6% and AutoNation's 68.2%.

The finance book, and the floorplan surprise

The second annuity is lending. Lithia's Driveway Finance produced $37m of income, up more than 70%, on a book above $5bn with an average credit score of 748 and delinquencies improving. AutoNation Finance's portfolio grew 52% to $2.67bn and earned $11m against $2m a year earlier. Neither captive is deteriorating.

The assumed relief from falling short rates is more selective. AutoNation's floorplan interest eased to $43.7m from $45.3m and Penske's fell about $5m. Lithia's rose 26.7% to $69.7m after it moved used-vehicle borrowing onto floorplan facilities — a financing choice that swamps the rate cut.

What the shares are paying for

Demand is the constraint nobody has solved. The average new-vehicle transaction price was $49,855 in July, up 1.9%, with incentives down to 6.4% of price from 7.3%; Cox Automotive expects annual sales stuck in a 15-16 million range against more than 17 million before the pandemic.

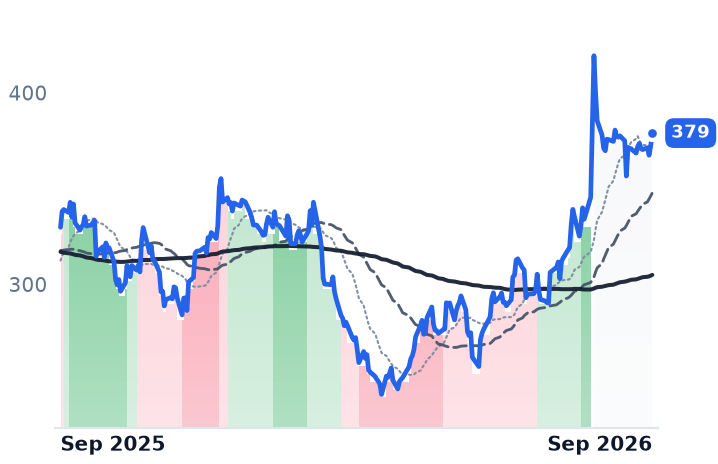
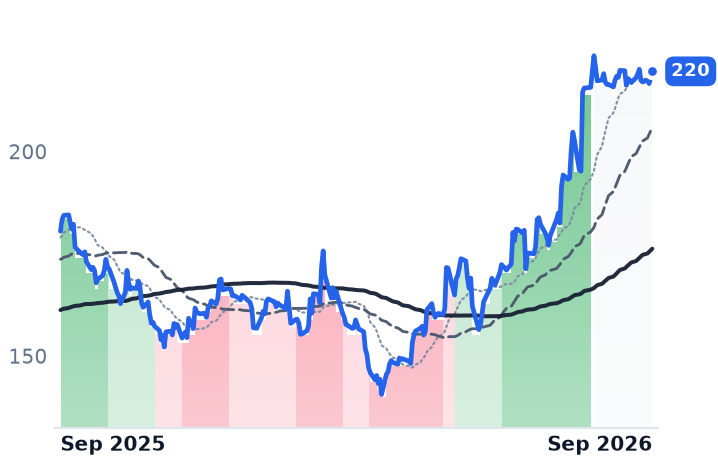
AutoNation is the cheapest of the three at 9.4x trailing and 9.5x forward earnings, below the 12.1x it commanded at the end of 2025, and it repurchased $457m of stock in the first half, cutting diluted shares 12%. Lithia, at 12.5x trailing against 10.3x at the end of last year, has re-rated after a 30% three-month run on same-store revenue that fell; its 17% share-count reduction, not unit demand, produced 9% adjusted earnings growth. Penske's 16.2x, against 11.2x at end-2025, is a takeover price: Penske Corporation and Mitsui, already holders of 72.6%, proposed $210 a share on July 22, a special committee retained Moelis and Paul, Weiss on August 10, and the shares sit above the bid.

So the earned part of the move is real and narrow: service, parts and captive lending are compounding, and cost ratios improved sequentially at both Lithia and AutoNation. What nothing in the reported numbers yet explains is a multiple paid for re-acceleration — consensus has Lithia's earnings up 16.7% in 2027 — while same-store revenue is still negative. Penske's price is a corporate event wearing a dealer's clothes.

The binding constraint on the line that now carries these companies is not customers. AutoNation grew technician headcount 2% while customer-pay revenue grew 7%; the earnings engine is bays and the people standing in them.

Domino's Royalty Revenue Grew 5.1% on New Stores as Same-Store Sales Stalled at 0.1%

Hypothesis Opus 5 · Research Opus 5 · Writing Opus 5 · Prompt v1.6

Three-fifths of Domino's revenue is dough, cheese and boxes sold to its own franchisees — a near pass-through line that says almost nothing about earnings. The line that matters is the royalty on what those stores sell, and in the June quarter it grew on store count alone: US same-store sales were the weakest in over a year, and the company trimmed its 2026 US net-store target to about 175 citing franchisee profitability.

Cheese is not the story. Chicago Mercantile Exchange block cheddar was $1.4750 a pound on September 2 and has stayed under $2 all year, so supply-chain revenue grew on ordering volume rather than commodity inflation. Papa John's shows what happens when the other half of the royalty equation breaks: North American comparable sales fell 8.3%, adjusted earnings before interest, taxes, depreciation and amortization guidance came down to $180-190m, and the dividend was suspended. Yum simply sold Pizza Hut for $2.7bn.

DPZPZZAYUMDASHWINGMCDQSRSBUXTXRHCMG
TickerCompanySegmentTrend · 13mo30D1Y
The subject · what this brief is about
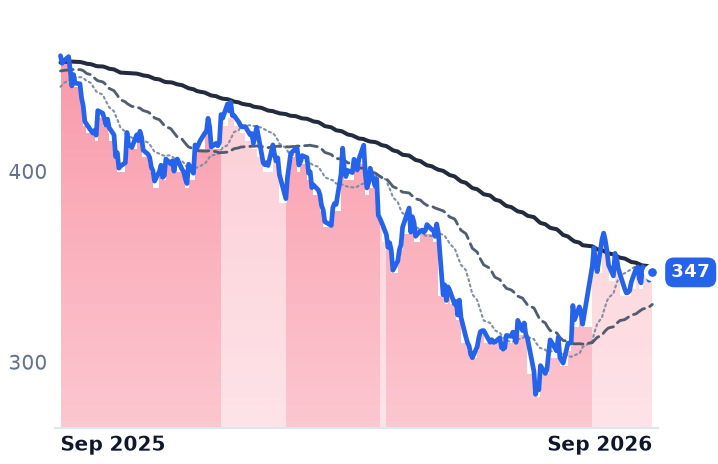
DPZDomino's PizzaQuick Service - Pizza🔴 Cont. Bear−5.6%−24.7%
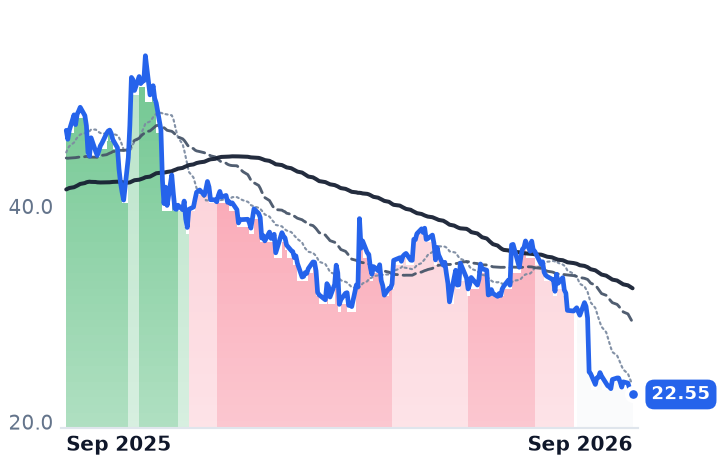
PZZAPapa John's InternationalQuick Service - Pizza🔴 Cont. Bear−26.6%−52.1%
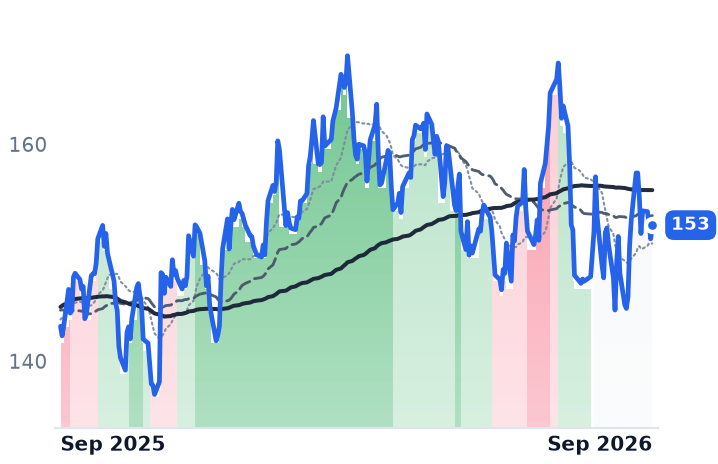
YUMYum! BrandsQuick Service - Pizza⚠️ Emerging Bear+3.3%+6.5%
Compared against · context, not the story
DASHDoorDashMarketplace & Local Services🌱 Emerging Bull+11.8%−9.1%
WINGWingstopQuick Service - Chicken & Wings🔴 Cont. Bear−6.9%−64.8%
MCDMcDonald'sQuick Service - Burgers & Sandwiches⚠️ Emerging Bear−2.8%−16.6%
QSRRestaurant Brands InternationalQuick Service - Pizza🟢 Cont. Bull+6.8%+29.9%
SBUXStarbucksCoffee & Beverages🌱 Emerging Bull+1.7%+24.0%
TXRHTexas RoadhouseCasual Dining - Steakhouse & Seafood🌱 Emerging Bull−8.3%+12.2%
CMGChipotle Mexican GrillQuick Service - Mexican & Bowls🔴 Cont. Bear+13.9%−7.8%

12-month price & trend

DPZ
Domino's Pizza
347
+0.35 (+0.10%)
vs. prior close
Price20d50d150d
DPZ 12-month price
Quick Service - Pizza
PZZA
Papa John's International
22.55
−0.08 (−0.35%)
vs. prior close
Price20d50d150d
PZZA 12-month price
Quick Service - Pizza
YUM
Yum! Brands
153
+1.27 (+0.84%)
vs. prior close
Price20d50d150d
YUM 12-month price
Quick Service - Pizza
TickerMkt capP/EP/E fwdP/SP/S fwdP/GPP/GP fwdEV/EBITDAFCF yld
DPZ$11.5B19.6x18.3x2.3x2.2x5.7x5.5x16.6x5.7%
PZZA$742.3M27.9x18.9x0.4x0.4x1.6x1.7x6.9x4.6%
YUM$42.0B19.0x23.1x4.8x4.7x10.5x10.2x18.6x4.0%
DASH
DoorDash
226
−3.06 (−1.33%)
vs. prior close
Price20d50d150d
DASH 12-month price
Marketplace & Local Services
WING
Wingstop
113
+2.40 (+2.17%)
vs. prior close
Price20d50d150d
WING 12-month price
Quick Service - Chicken & Wings
MCD
McDonald's
261
−0.47 (−0.18%)
vs. prior close
Price20d50d150d
MCD 12-month price
Quick Service - Burgers & Sandwiches
TickerMkt capP/EP/E fwdP/SP/S fwdP/GPP/GP fwdEV/EBITDAFCF yld
DASH$69.4B74.9x61.8x4.7x3.9x9.3x7.7x40.3x2.5%
WING$3.5B31.7x28.3x5.0x4.5x6.0x5.5x15.4x3.8%
MCD$196.4B22.6x21.2x7.2x6.9x12.5x12.0x16.8x3.6%
QSR
Restaurant Brands International
78.87
+0.74 (+0.95%)
vs. prior close
Price20d50d150d
QSR 12-month price
Quick Service - Pizza
SBUX
Starbucks
107
+1.06 (+1.00%)
vs. prior close
Price20d50d150d
SBUX 12-month price
Coffee & Beverages
TXRH
Texas Roadhouse
191
−0.91 (−0.47%)
vs. prior close
Price20d50d150d
TXRH 12-month price
Casual Dining - Steakhouse & Seafood
TickerMkt capP/EP/E fwdP/SP/S fwdP/GPP/GP fwdEV/EBITDAFCF yld
QSR$26.3B27.6x18.7x2.7x2.7x6.1x6.0x15.9x5.8%
SBUX$121.7B81.4x44.7x3.2x3.2x15.5x15.8x26.9x2.2%
TXRH$13.6B33.1x32.2x2.2x2.1x14.3x13.6x18.9x3.0%
CMG
Chipotle Mexican Grill
38.52
+0.74 (+1.95%)
vs. prior close
Price20d50d150d
CMG 12-month price
Quick Service - Mexican & Bowls
TickerMkt capP/EP/E fwdP/SP/S fwdP/GPP/GP fwdEV/EBITDAFCF yld
CMG$41.9B29.2x28.7x3.5x3.2x9.5x8.9x20.5x3.6%

Consensus projections

TickerFY2026EFY2027EFY2028E
DPZRevenue+5.4%+2.4%+3.9%
EPS+7.6%+9.8%+8.0%
PZZARevenue−9.2%−2.1%+0.1%
EPS−15.1%+13.1%+13.9%
YUMRevenue+10.0%+3.7%+5.7%
EPS+8.5%+10.2%+10.8%
DASHRevenue+28.2%+20.5%+18.2%
EPS+14.3%+74.3%+56.3%
WINGRevenue+11.6%+15.4%+14.1%
EPS+17.0%+22.2%+24.3%
MCDRevenue+6.9%+5.7%+4.9%
EPS+7.2%+9.1%+7.5%
QSRRevenue+5.2%+1.7%−0.4%
EPS+10.4%+9.4%+6.5%
SBUXRevenue+2.6%+2.6%+5.8%
EPS+10.9%+27.1%+21.9%
TXRHRevenue+11.0%+9.3%+8.6%
EPS+2.1%+19.1%+20.8%
CMGRevenue+9.0%+11.0%+10.9%
EPS−1.6%+19.6%+18.0%

Forward fiscal years only. Blank means no analyst coverage for that year.

Domino's Pizza sold $731.7m of dough, cheese, boxes and equipment to its own franchisees in the June quarter and booked every dollar of it as revenue. That line was 61% of the company's total and it is close to a pass-through: Domino's reported it rose 6.5% on heavier store ordering and a 2.2% increase in food-basket pricing.

What a franchisor actually earns is a royalty on what its stores sell, and that is store count multiplied by same-store sales. In the June quarter one of those two terms went to zero — and everything the shares have done since is an argument about whether the other one can carry the business.

Units did all the work

Domino's US franchise royalties and fees rose $7.9m, or 5.1%, and the 10-Q attributes that primarily to net store growth over the trailing four quarters. International royalties and fees added $4.7m, up 6.0%, on a higher average store count plus about $1.1m of favorable currency. Same-store sales contributed nothing: US comparable sales rose 0.1%, the weakest quarterly showing in more than a year, and international comparable sales excluding currency fell 0.1%.

The commodity explanation for the headline revenue does not hold. Chicago Mercantile Exchange 40-pound block cheddar closed at $1.4750 a pound on September 2 and has not traded above $2.00 at any point this year, against a four-year range of roughly $1.30 to $2.40. Cheese near the low end of that range is a tailwind to franchisee food cost rather than a driver of pass-through revenue.

So the profit came from the royalty base, exactly as the model says it should — income from operations rose 3.1% on revenue up 4.3%, mild negative operating leverage, with the 10-Q crediting higher royalties and supply-chain gross-margin dollars. Domino's added 26 net US stores and 183 net international stores in the quarter, and trimmed its 2026 US target from "175+" to approximately 175, citing macro pressure and franchisee profitability headwinds. International guidance stayed near 800.

"Order counts are what drive our business... These are profitable orders that go into our loyalty program," chief executive Russell Weiner told investors on the July 20 call. On the ticket shortfall: "The miss on ticket was largely within our control, which means we can and will address it moving forward."

Order counts are increasingly aggregator orders. Domino's says it is now the top-ranked pizza brand on both delivery platforms — Uber Eats and the DoorDash app — that roughly half of those orders are net-new rather than cannibalized, and that it prices menus at a premium on the platforms to hold franchisee profit neutral. "The reason we are actually being so careful is because we want to protect profitability as we go after this growth," chief financial officer Sandeep Reddy said on the same call.

When same-store sales break instead

Papa John's, which franchises 3,439 North America restaurants alongside its own commissary network, is the same equation with the other term collapsing. Second-quarter revenue fell 8.8% to $482.4m and North American comparable sales fell 8.3%. On August 6 the company cut full-year guidance — system-wide sales now down 2-4%, adjusted earnings before interest, taxes, depreciation and amortization to $180-190m from $200-210m — and suspended the dividend beginning with the third-quarter payment. The board also ended an 18-month review that had evaluated a sale, concluding the transformation was the better path; chief executive Todd Penegor said the turnaround is "taking longer than anticipated." The shares fell 16.9% that session on nearly eight times normal volume and are down more than half over twelve months. At 18.9x forward earnings the multiple is struck on a number consensus expects to fall 15% this year; the 6.9x on trailing earnings before interest, taxes, depreciation and amortization is struck on a base management has just guided lower.

Yum! Brands, the franchisor of KFC and Taco Bell, took the third option and left. It completed the sale of Pizza Hut outside mainland China to the private-equity firm LongRange Capital on September 1, closing out $2.7bn of proceeds across the two disposals. The business it sold is closing 250 US restaurants this year and has seen its share of US pizza chain sales fall to 15.5% from 19.4% in 2019. Excluding Pizza Hut, Yum's system sales grew 7% in the June quarter.

What the de-rating is actually about

Domino's shares are down 25.6% over twelve months against 2025 diluted earnings of $17.57 that were still rising — roughly 26.6x that figure a year ago, about 19.8x now. The business earns part of that markdown: comparable sales have gone flat, the ticket missed, the US unit target came down, and the royalty line now depends entirely on opening stores into a market where quick-service traffic fell 1.6% year on year in May, concentrated among lower- and middle-income guests. What the business does not yet explain is the size of the markdown, because the royalty base itself never stopped compounding in the 5-6% range, and consensus still models earnings up 7.6% this year.

The useful conclusion is that the pizza names are not one trade and never were. Supply-chain revenue is weather; store count times same-store sales is the business. Domino's has one of those terms working and Papa John's has neither, which is why one drifted and the other gapped.

Domino's needs roughly 175 net new US stores this year to keep its royalty line growing at all, and it will need franchisees willing to build them — whose store-level profit it did not update alongside the quarter.

ADP's Jobs Report Counted 16,000 Fewer White-Collar Workers in August, the Base It Bills

Hypothesis Opus 5 · Research Opus 5 · Writing Opus 5 · Prompt v1.6

The three big vendors that charge by the employee all reported in the last five weeks, and none of them is growing because employment is. ADP's own payroll files, published on 2 September, showed private employers adding 38,000 jobs in August — the weakest month since January — with professional and business services, the white-collar base these platforms bill, down 16,000.

ADP's count of workers on client payrolls grew 1% in fiscal 2026 and is guided to 0-1% next year; its incremental growth engine is $1.54-1.56bn of interest on client cash. Workday's total subscription backlog grew 8.0% against 17.6% a year earlier while its operating margin hit 31.1% on flat staff. Paycom is the one unit-level bright spot, with revenue growth re-accelerating to 9.8%, though its clients' employment is merely "stable." All three have re-rated off a common 10 April low.

WDAYPAYCADPPCTYTEAMMNDYBILLDOCUNOWINTUHUBSZMPAYXPayroll Processing PlatformsWhite-Collar Hiring SlowdownPer-Employee SaaS PricingClient Float Interest IncomeAI-Driven Cost AutomationBuyback-Led Margin Expansion
TickerCompanySegmentTrend · 13mo30D1Y
The subject · what this brief is about
WDAYWorkdayEnterprise Resource Planning🌱 Emerging Bull+20.4%−11.6%
PAYCPaycom SoftwareHR & Workforce Management🌱 Emerging Bull+37.1%+9.1%
ADPAutomatic Data ProcessingHCM Software & Payroll🌱 Emerging Bull+4.8%−3.2%
Compared against · context, not the story
PCTYPaylocityHR & Workforce Management🔴 Cont. Bear+7.9%−11.2%
TEAMAtlassianDeveloper Tools & DevOps🌱 Emerging Bull+69.0%+9.2%
MNDYmonday.comOther🌱 Emerging Bull+0.7%−49.0%
BILLBill.comFintech & Digital Finance🌱 Emerging Bull+0.4%+5.7%
DOCUDocuSignSpecialized Enterprise Solutions🌱 Emerging Bull+13.6%−13.8%
NOWServiceNowSpecialized Enterprise Solutions🌱 Emerging Bull+15.7%−25.6%
INTUIntuitEnterprise Resource Planning🔴 Cont. Bear+6.0%−48.4%
HUBSHubSpotCustomer Experience & CRM🔴 Cont. Bear−1.4%−48.1%
ZMZoom CommunicationsCommunications & Collaboration🟢 Cont. Bull−6.1%+14.8%
PAYXPaychexHCM Software & Payroll🌱 Emerging Bull+4.5%−5.5%

12-month price & trend

WDAY
Workday
206
+5.40 (+2.69%)
vs. prior close
Price20d50d150d
WDAY 12-month price
Enterprise Resource Planning
PAYC
Paycom Software
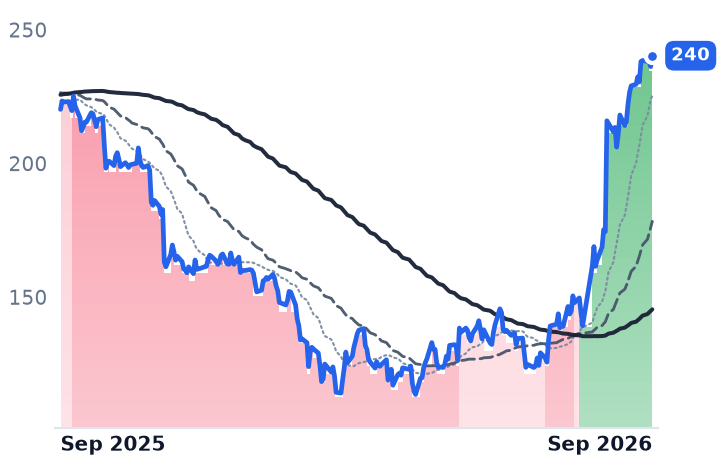
240
+4.06 (+1.72%)
vs. prior close
Price20d50d150d
PAYC 12-month price
HR & Workforce Management
ADP
Automatic Data Processing
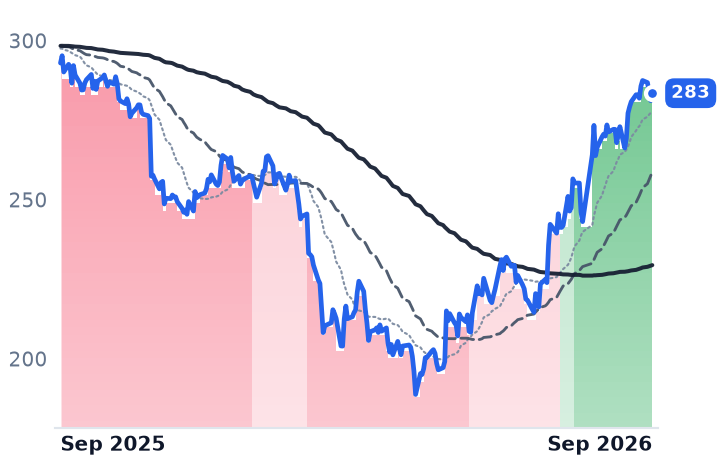
283
+2.33 (+0.83%)
vs. prior close
Price20d50d150d
ADP 12-month price
HCM Software & Payroll
TickerMkt capP/EP/E fwdP/SP/S fwdP/GPP/GP fwdEV/EBITDAFCF yld
WDAY$54.0B41.7x18.6x5.3x5.1x7.0x6.7x34.3x5.3%
PAYC$10.8B25.5x19.9x5.1x4.9x6.3x6.1x12.9x7.0%
ADP$113.3B25.8x23.1x5.2x4.9x10.7x10.1x18.0x4.4%
PCTY
Paylocity
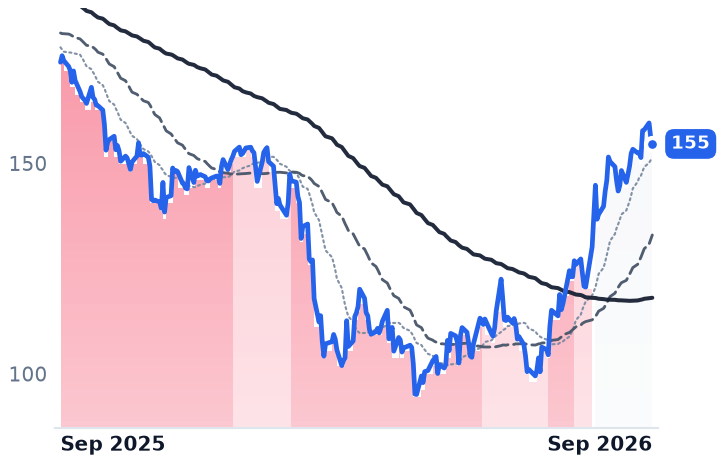
155
−1.59 (−1.02%)
vs. prior close
Price20d50d150d
PCTY 12-month price
HR & Workforce Management
TEAM
Atlassian
186
+0.01 (+0.01%)
vs. prior close
Price20d50d150d
TEAM 12-month price
Developer Tools & DevOps
MNDY
monday.com
94.44
−2.06 (−2.13%)
vs. prior close
Price20d50d150d
MNDY 12-month price
Other
TickerMkt capP/EP/E fwdP/SP/S fwdP/GPP/GP fwdEV/EBITDAFCF yld
PCTY$8.5B31.6x17.9x4.8x4.5x6.9x6.5x16.6x5.3%
TEAM$50.0Bn/m34.6x7.6x6.7x9.0x7.9x331.1x2.6%
MNDY$4.3B42.2x18.4x3.1x2.9x3.5x3.3x38.6x7.0%
BILL
Bill.com
48.76
+0.95 (+2.00%)
vs. prior close
Price20d50d150d
BILL 12-month price
Fintech & Digital Finance
DOCU
DocuSign
65.39
+0.88 (+1.36%)
vs. prior close
Price20d50d150d
DOCU 12-month price
Specialized Enterprise Solutions
NOW
ServiceNow
137
−5.65 (−3.97%)
vs. prior close
Price20d50d150d
NOW 12-month price
Specialized Enterprise Solutions
TickerMkt capP/EP/E fwdP/SP/S fwdP/GPP/GP fwdEV/EBITDAFCF yld
BILL$5.0Bn/m13.4x3.0x2.7x3.8x3.5x58.7x9.6%
DOCU$11.5B38.4x13.3x3.5x3.3x4.4x4.1x17.2x9.7%
NOW$132.8B79.8x31.6x9.0x8.2x12.1x11.0x39.8x3.4%
INTU
Intuit
343
−5.03 (−1.45%)
vs. prior close
Price20d50d150d
INTU 12-month price
Enterprise Resource Planning
HUBS
HubSpot
246
−4.40 (−1.76%)
vs. prior close
Price20d50d150d
HUBS 12-month price
Customer Experience & CRM
ZM
Zoom Communications
95.86
+1.05 (+1.11%)
vs. prior close
Price20d50d150d
ZM 12-month price
Communications & Collaboration
TickerMkt capP/EP/E fwdP/SP/S fwdP/GPP/GP fwdEV/EBITDAFCF yld
INTU$97.9B21.7x14.8x4.6x4.2x5.6x5.1x14.8x8.8%
HUBS$13.4B92.2x19.6x3.9x3.6x4.7x4.4x44.5x5.7%
ZM$31.5B15.5x17.8x6.4x6.2x8.3x8.0x11.0x6.2%
PAYX
Paychex
124
−1.49 (−1.19%)
vs. prior close
Price20d50d150d
PAYX 12-month price
HCM Software & Payroll
TickerMkt capP/EP/E fwdP/SP/S fwdP/GPP/GP fwdEV/EBITDAFCF yld
PAYX$45.2B25.9x21.3x6.9x6.6x9.3x8.9x16.1x5.1%

Consensus projections

TickerFY2026EFY2027EFY2028E
WDAYRevenue+13.4%+11.8%+10.5%
EPS+26.5%+21.9%+19.5%
PAYCRevenue+7.7%+7.2%+8.3%
EPS+30.9%+15.5%+11.1%
ADPRevenue+7.0%+5.9%+5.7%
EPS+11.0%+10.7%+9.2%
PCTYRevenue+11.1%+7.5%+7.6%
EPS+15.4%+9.0%+9.7%
TEAMRevenue+24.7%+15.4%+14.7%
EPS+55.5%−0.1%+21.6%
MNDYRevenue+19.8%+15.1%+14.6%
EPS+27.8%+22.3%+19.1%
BILLRevenue+13.2%+11.3%+10.5%
EPS+26.1%+41.5%+17.6%
DOCURevenue+8.4%+8.9%+7.6%
EPS+6.9%+19.5%+12.6%
NOWRevenue+22.4%+18.7%+18.6%
EPS+17.1%+23.2%+21.4%
INTURevenue+13.9%+9.7%+9.4%
EPS+18.5%+1.9%+13.1%
HUBSRevenue+18.2%+14.2%+14.0%
EPS+38.2%+25.9%+18.4%
ZMRevenue+4.2%+4.8%+4.0%
EPS+9.7%+1.3%+4.0%
PAYXRevenue+16.5%+5.5%+5.5%
EPS+10.1%+8.6%+7.5%

Forward fiscal years only. Blank means no analyst coverage for that year.

On 2 September, ADP reported that US private employers added 38,000 jobs in August, below July's 46,000 and below a consensus near 47,000 — the smallest monthly gain since January. Inside the number, professional and business services shed 16,000 positions while education and health services added 45,000. ADP compiles that report from its own payroll files, which are also its invoices.

That matters because the software business built on white-collar employment does not sell seats a department can add at will. Automatic Data Processing bills per pay processed for more than a million clients; Workday, whose human-capital and financial software runs at more than 65% of the Fortune 500, bills largely per worker per year; Paycom, a single-database payroll platform for small and mid-sized US employers, charges per employee per month. All three reported in the last five weeks. All three showed the meter flat — and all three found their earnings growth somewhere else.

The float, the buyback, the layoff

ADP's pays per control — its count of employees on client payrolls — grew 1% in fiscal 2026 and is guided to 0% to 1% in fiscal 2027. Employer Services revenue rose 7% to $3.7bn in the June quarter but is guided to 5-6% growth this year. New business bookings of more than $2.2bn grew 6% against guidance of 4-7% ahead, and client revenue retention of 92.1% is guided a tenth to three-tenths of a point lower. The line that actually grows is the cash ADP holds between collecting payroll and disbursing it: $1.54-1.56bn of client-funds interest is guided on an assumed 3.7% yield, up from 3.4%, on balances growing 3-4%. Chief executive Maria Black has described the backdrop as a "low hire, low fire" labor market.

Workday's July quarter brought $2.651bn of revenue, up 12.9% — the third straight quarter of deceleration. Its 12-month subscription backlog grew 14.2%, but total subscription backlog of $27.4bn grew 8.0%, against 17.6% a year earlier, and early fiscal 2028 subscription growth was framed at about 11% versus the 13.9% just reported. Non-GAAP operating margin reached 31.1% on headcount held flat near 20,900, a $5bn buyback closed six months early and a fresh $4bn was authorized. "This is Workday's moment, I have never felt better about where we are headed," chief executive Aneel Bhusri told investors on the August 27 call, pointing to roughly $600m of artificial-intelligence recurring revenue and more than $100m of new annual contract value from AI products. Only 200 customers signed paid AI credit contracts in the quarter.

Paycom is the exception worth naming. Revenue grew 9.8% to $531.2m, an acceleration from 7.8%, with recurring revenue up 11.0%. But management described client employment growth as stable, with no acceleration; the earnings came from adjusted EBITDA margin of 44.2%, up 3.2 points, after the company cut roughly 500 Oklahoma jobs it said AI had automated, and from retiring a fifth of its shares this year — diluted share count fell to 45.9m from 56.3m. "Our strong second-quarter results came in ahead of expectations, reflecting the strength of our automation strategy and disciplined execution," founder-chief executive Chad Richison said in the August 5 results release.

What the shares did

All three bottomed on the same session, 10 April, and have since risen 83%, 112% and 50% respectively — a common trough rather than three company turns. The advance was no grind: Paycom gapped 23.8% on 6 August on roughly five times normal volume, and Workday gapped 12.5% on 14 August on a report that Silver Lake was in talks to take it private, before its own numbers. Across the wider back-office software group, the largest thirty-day gainer is Atlassian at 69%, a developer-tools vendor, while BILL and monday.com are flat.

The verdict

Margin expansion, float interest and share retirement are real earnings, and Paycom's 11% recurring growth is real demand. What none of the three has produced is evidence that the headcount they invoice is turning. ADP now carries the highest forward multiple of the three, 23.1x against 25.8x trailing, on the slowest guided growth; Workday trades at 7.02x trailing gross profit against 4.31x in early May; Paycom, at 19.9x forward versus 25.5x trailing, is the cheapest of the three on cash flow. The likelier reading of August is a rotation out of AI hardware into beaten-down software, with a takeover report doing the rest.

The uncomfortable symmetry is that all three are expanding margins the same way their customers are: by employing fewer people. Workday is holding headcount flat with its own AI; Paycom automated 7% of its workforce away. Every dollar that strategy saves them is a dollar off somebody's pays per control.
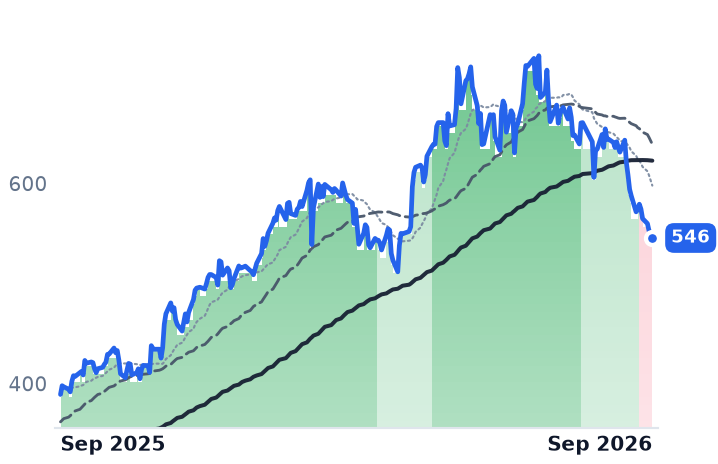
Containerboard's Third 2026 Price Increase Hit Mills Paying 70% More for Recycled Fiber

Hypothesis Opus 5 · Research Opus 5 · Writing Opus 5 · Prompt v1.6

Containerboard producers have spent eighteen months manufacturing their own price: roughly 3.9m tons, about a tenth of US capacity, has been permanently retired since February 2025, lifting the second-quarter operating rate to about 95% even as production fell 2%. Three price rounds followed, the latest effective September 1.

The money has not arrived. Old corrugated containers — the fiber those same mills now buy more of — are up about 70% since January, and International Paper's second-quarter operating margin fell to 0.7% from 3.0% while it cut its North American profit guidance. Packaging Corp grew revenue 14.7% on the Greif mills it bought and earned flat operating income on it.

Both companies date the payoff to 2027. The shares have already been asked to pay for it.

IPPKGSWContainerboard Price RoundsMill Capacity ClosuresOCC Recycled Fiber CostsCorrugated Box DemandFreight & Energy InflationPackaging Consolidation
TickerCompanySegmentTrend · 13mo30D1Y
The subject · what this brief is about
IPInternational PaperCorrugated & Containerboard🌱 Emerging Bull−14.5%−23.2%
PKGPackaging Corporation of AmericaCorrugated & Containerboard🟢 Cont. Bull−8.4%+11.9%
Compared against · context, not the story
SWSmurfit WestrockCorrugated & Containerboard🌱 Emerging Bull−6.5%−2.5%

12-month price & trend

IP
International Paper
36.17
−0.13 (−0.37%)
vs. prior close
Price20d50d150d
IP 12-month price
Corrugated & Containerboard
PKG
Packaging Corporation of America
234
+0.50 (+0.21%)
vs. prior close
Price20d50d150d
PKG 12-month price
Corrugated & Containerboard
SW
Smurfit Westrock
45.36
−0.95 (−2.05%)
vs. prior close
Price20d50d150d
SW 12-month price
Corrugated & Containerboard
TickerMkt capP/EP/E fwdP/SP/S fwdP/GPP/GP fwdEV/EBITDAFCF yld
IP$19.1Bn/m26.4x0.8x0.8x2.9x2.8xn/m2.6%
PKG$20.9B30.3x22.3x2.2x2.1x10.9x10.3x13.4x3.6%
SW$23.8B48.4x20.2x0.8x0.7x4.2x4.1x8.7x4.3%

Consensus projections

TickerFY2026EFY2027EFY2028E
IPRevenue+0.3%+5.6%+1.1%
EPS+470.4%+119.1%+16.1%
PKGRevenue+10.9%+7.1%+3.1%
EPS+5.8%+27.6%+6.1%
SWRevenue+3.2%+5.6%+2.1%
EPS−6.7%+54.2%+14.3%

Forward fiscal years only. Blank means no analyst coverage for that year.
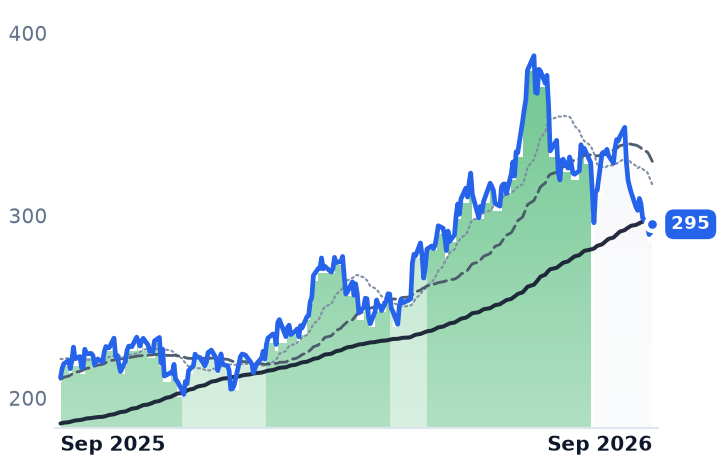
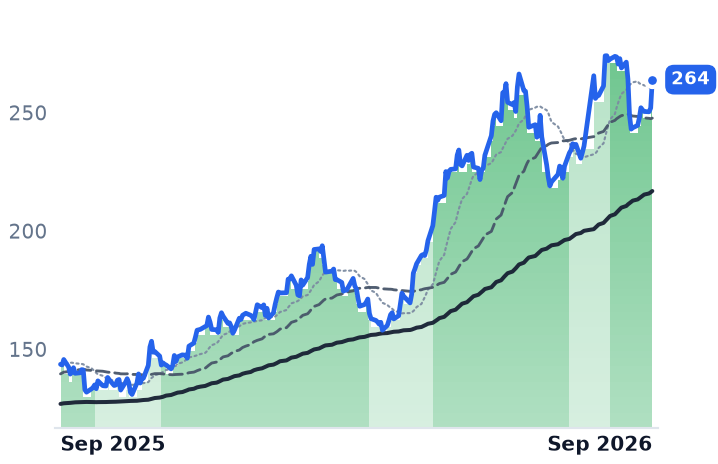
Packaging Corporation of America, which makes containerboard and converts it into boxes, opened a third price round of 2026 on July 24: $140 a ton on containerboard, effective September 1. International Paper followed at $80, Smurfit Westrock at $100 and Cascades at $110 to $140, within days. Three increases in seven months would add $240 a ton to linerboard if fully implemented.

That sequence is the whole business model stated plainly. A containerboard producer's revenue is tons multiplied by a published index price, and the industry has been manufacturing the index by taking mills out permanently. Fastmarkets counts roughly 3.9m tons — about 10% of US capacity — retired between February 2025 and March 2026, with International Paper's Red River, Riceboro and Savannah mills a large share of it. It worked mechanically: the American Forest & Paper Association's second-quarter data has the operating rate near 95%, up from about 93%, on production down 2% year over year, domestic demand up 1% and exports down nearly 19%. Supply left faster than demand did.

The input the closures tightened

The closures concentrated on older virgin-fiber sites while the surviving mills shift toward recycled furnish — which raises demand for old corrugated containers, the input those mills buy. Packaging Corp told investors recycled fiber now runs 30% to 35% of its mix against roughly 20% historically, and that prices for it are up about 70% since the start of 2026. Measured against history that is still cheap: reporting puts old corrugated containers near $100 a ton at mid-year against a five-year average around $140. Measured against last year's cost base, it is a bill.

"The pricing up to now has really been eaten by inflation," International Paper chief executive Andrew Silvernail told investors on July 30. "If you look at what's happened with OCC, energy, diesel, freight, you name it, right, it's unfortunately really eaten every bit of that pricing up until today." The numbers behind that sentence: second-quarter revenue of $6.0bn, down 11.3%, operating income of $45m, and an operating margin of 0.7% against 3.0% a year earlier. IP raised its estimated macro headwind to about $150m from $50m, trimmed the top of its North American adjusted earnings guidance to $2.35–2.45bn, and cut its second-half volume assumption to flat from up 1%. It expects the September publication to show up mainly in the first half of 2027.

Packaging Corp's quarter reads differently and lands in the same place. Revenue rose 14.7% to $2.49bn — corrugated shipments up more than 24% in total, but up 4.1% at the legacy plants, the rest arriving with Greif's containerboard business, bought for $1.8bn and closed on September 2, 2025. Operating income was flat, net income fell 20.5%, and packaging segment margin slipped to 21.1% from 22.6%. Freight alone cost 26 cents a share year over year. "At some point in time, you gotta back that up with price also," chairman and chief executive Mark Kowlzan said on July 23 of the $10bn the company has spent on its mills. It guides third-quarter earnings of $2.91 a share against $2.15 reported.

Smurfit Westrock, the third large North American containerboard producer, cut full-year adjusted earnings guidance to $4.9–5.1bn as its freight headwind ballooned to $300m from a $50m April estimate, with operating income down 44% and North American corrugated volumes deliberately 4.5% lower. Its chief executive Anthony Smurfit called global paper markets "as strong as I have seen in my lifetime within this industry" on July 29 — a market that strong and a guidance cut in the same call is the tension in one sentence.

Who pays, and when

The buyers are objecting. The Association of Independent Corrugated Converters came out against the third round on August 10, saying three increases in five months are not justified by raw material costs and reflect "a small group of producers having market dominance," while conceding the first two were input-driven. The published index has not settled the argument: North American containerboard prices were flat in August for a second straight month, with $100 a ton of net increase recognized so far this year.

So the capacity discipline is real and the price rounds are real, and neither has yet reached the profit line — 2026's announced increases were consumed by fiber, freight and energy on the way through. What the shares carry is 2027. International Paper trades at 26.4 times consensus earnings for this year and 12.0 times next year's $3.00, a figure that requires earnings to more than double; Packaging Corp at 30.3 times trailing profit against 25.2 times at the end of 2024 and 24.0 times at the end of 2025, on lower earnings, and 17.5 times the 2027 estimate — the most expensive of the three on the year the pricing is meant to be fully banked. Smurfit Westrock sits at 13.1 times 2027. The last month took all three down together, International Paper hardest at 14%, in a slide with no day worse than about 4% and no company-specific news beyond the July guidance cut.

International Paper also has a structural event in between: it said on January 29 it will split into two listed companies, spinning off the European packaging business within 12 to 15 months. The 2027 recovery consensus underwrites has to survive that.

Which leaves one monthly publication doing the work of a thesis. If September's index recognizes the third round, the closures paid for themselves and the equities are early. If it prints flat a third time, the industry will have removed a tenth of its capacity and discovered that the customer still sets the price.