

A 5.27% Long Bond Repriced Brookfield Renewable; Brookfield Corp's Fee Capital Grew 19%
Hypothesis Opus 5 · Research Opus 5 · Writing Opus 5 · Prompt v1.6
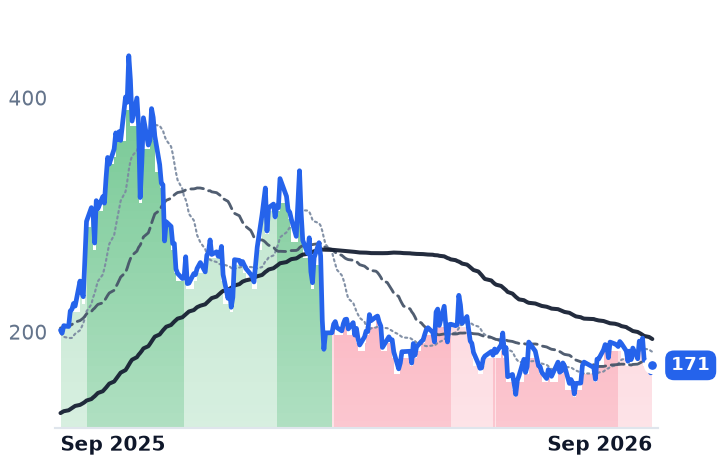
Brookfield Renewable's units were paying a 5.04% distribution — less than the US government pays for thirty-year money — before the latest leg down. That inversion, not the operating results, is the mechanism behind a 14.8% fall over ninety days at a business whose chief executive called the quarter a record.
The record is genuine but mixed. Funds from operations rose 11% per unit and the payout is 73% of the trailing figure, inside the stated 70–80% band; reported revenue fell 1.8% and roughly $175m of the $421m quarter came from selling assets rather than selling power.
Parent Brookfield Corporation is the harder case: fee-bearing capital grew to $672bn and fee-related earnings 20%, yet the shares are lower over twelve months and fell 4% on 1 September beside Blackstone, KKR and Apollo, with no company news to explain it.
| Ticker | Company | Segment | Trend · 13mo | 30D | 1Y |
|---|---|---|---|---|---|
| The subject · what this brief is about | |||||
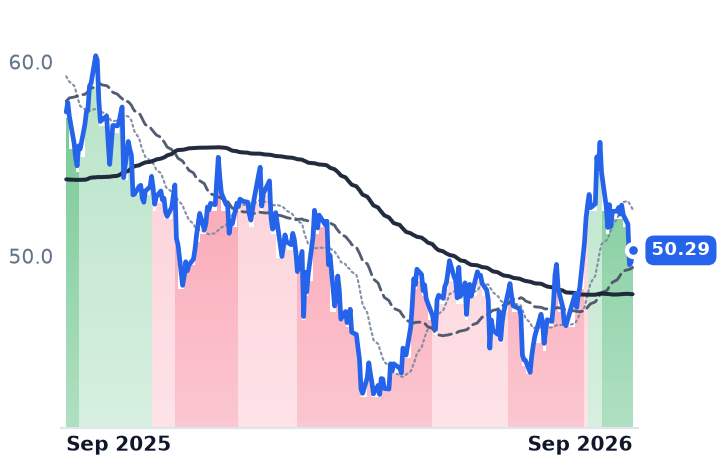
BEP | Brookfield Renewable Partners | Diversified Renewable Generators | 🟢 Cont. Bull | −5.9% | +27.7% |
BN | Brookfield | Real Estate & Infrastructure | ⚠️ Emerging Bear | −9.4% | −6.8% |
| Compared against · context, not the story | |||||
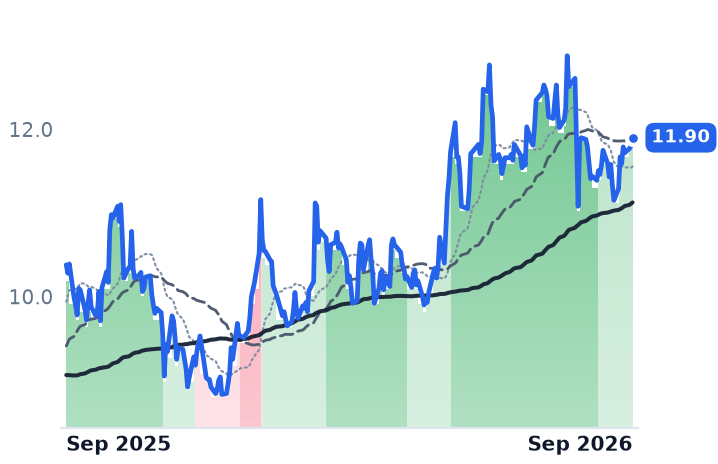
CWEN | Clearway Energy | Wind & Solar Developers | ⚠️ Emerging Bear | −0.8% | +12.5% |
BEPC | Brookfield Renewable | Diversified Renewable Generators | ⚠️ Emerging Bear | −6.1% | −2.7% |
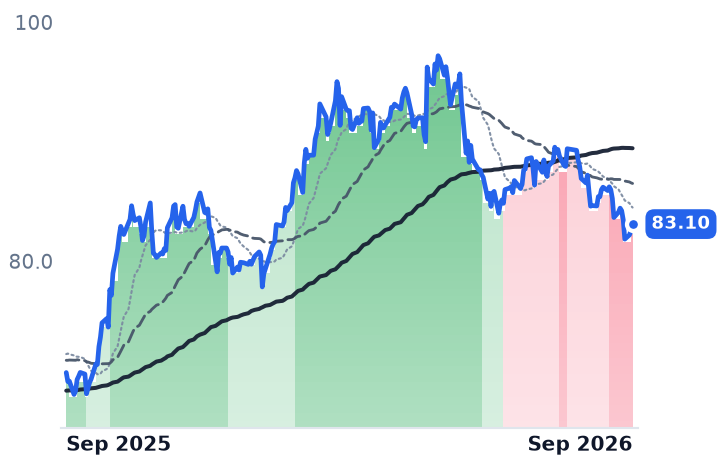
BAM | Brookfield Asset Management | Real Estate & Infrastructure | 🔴 Cont. Bear | −3.2% | −12.4% |
XIFR | XPLR Infrastructure | Renewable & Infrastructure Assets | 🟢 Cont. Bull | +1.9% | +15.7% |
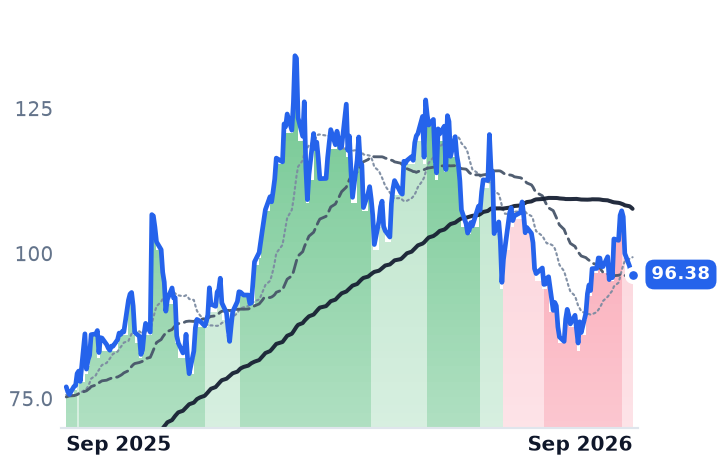
NEE | NextEra Energy | Vertically Integrated Utilities | ⚠️ Emerging Bear | −3.6% | +19.0% |
CCJ | Cameco | Uranium | ⚠️ Emerging Bear | +8.1% | +30.6% |
LEU | Centrus Energy | Uranium | ⚠️ Emerging Bear | −9.9% | −15.4% |
BX | Blackstone | Alternative & Private Capital | 🌱 Emerging Bull | +0.3% | −16.0% |
KKR | KKR | Alternative & Private Capital | 🔴 Cont. Bear | +1.4% | −18.3% |
APO | Apollo Global Management | Alternative & Private Capital | 🌱 Emerging Bull | +1.0% | +2.2% |
ARES | Ares Management | Alternative & Private Capital | 🌱 Emerging Bull | −1.0% | −17.8% |
SPY | State Street SPDR S&P 500 ETF Trust | Asset Management | 🟢 Cont. Bull | +0.2% | +21.1% |
12-month price & trend
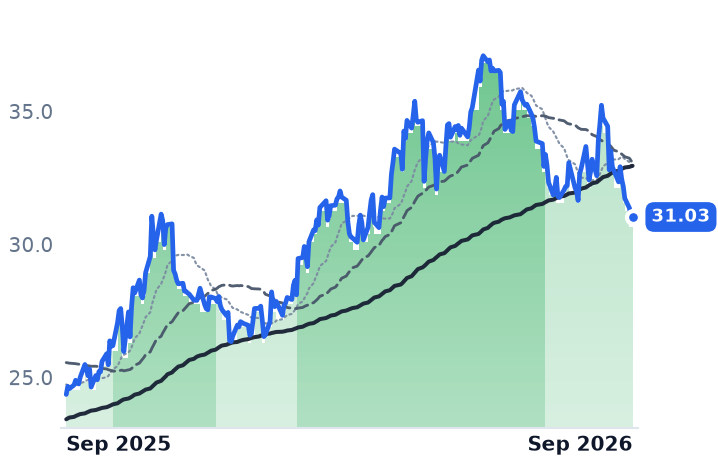
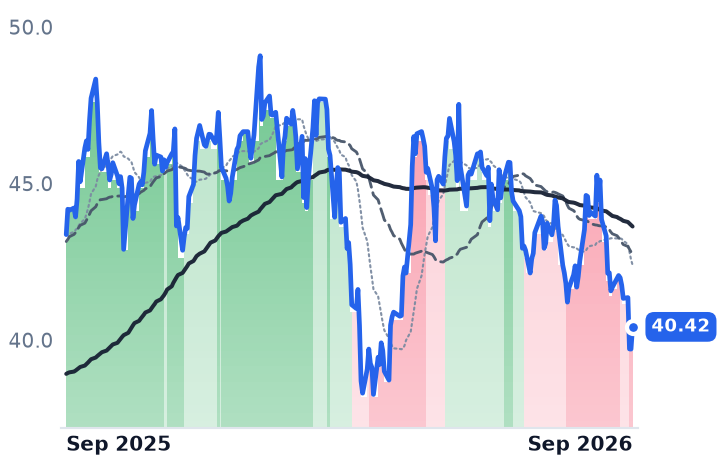
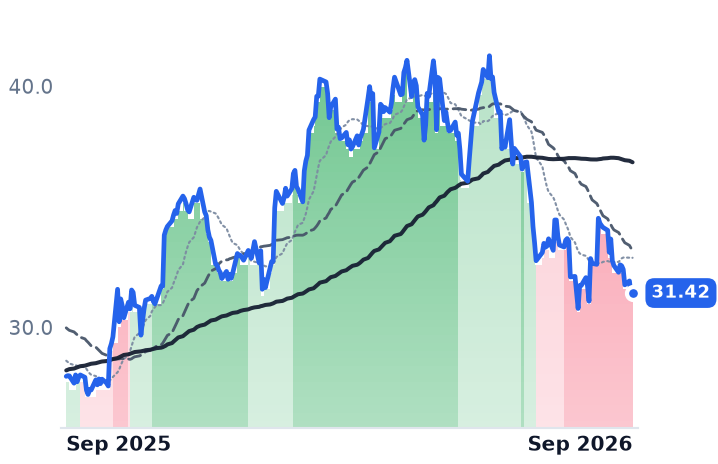
| Ticker | Mkt cap | P/E | P/E fwd | P/S | P/S fwd | P/GP | P/GP fwd | EV/EBITDA | FCF yld |
|---|---|---|---|---|---|---|---|---|---|
BEP | $9.5B | 67.6x | — | 1.5x | 1.4x | 6.1x | 5.8x | 9.7x | -49.6% |
BN | $90.3B | 72.0x | 14.6x | 1.2x | 11.9x | 4.0x | 41.5x | 10.2x | -9.2% |
CWEN | $6.5B | 41.4x | — | 4.1x | 3.9x | 7.8x | 7.4x | 14.4x | 10.4% |
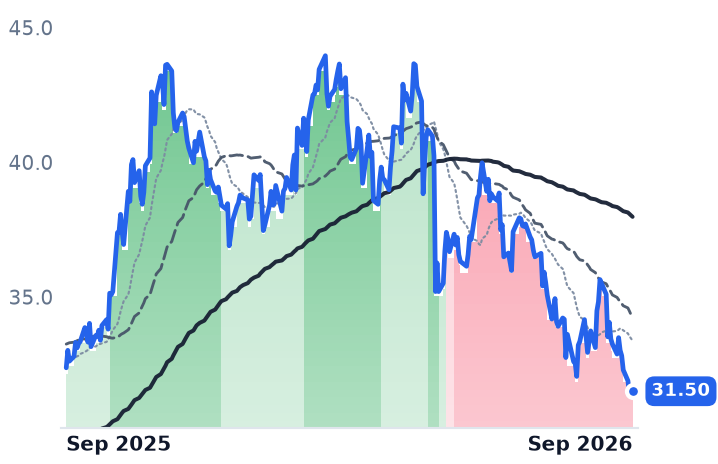
| Ticker | Mkt cap | P/E | P/E fwd | P/S | P/S fwd | P/GP | P/GP fwd | EV/EBITDA | FCF yld |
|---|---|---|---|---|---|---|---|---|---|
BEPC | $5.2B | n/m | — | 1.3x | 0.9x | 2.7x | 1.9x | n/m | -10.6% |
BAM | $86.7B | 31.2x | 29.5x | 16.0x | 14.2x | 20.0x | 17.8x | 90.0x | 2.5% |
XIFR | $1.1B | 17.9x | 10.6x | 0.9x | 0.8x | 5.4x | 4.8x | 9.0x | -56.0% |
| Ticker | Mkt cap | P/E | P/E fwd | P/S | P/S fwd | P/GP | P/GP fwd | EV/EBITDA | FCF yld |
|---|---|---|---|---|---|---|---|---|---|
NEE | $175.3B | 18.8x | 20.9x | 6.0x | 5.7x | 8.4x | 7.9x | 16.0x | -5.8% |
CCJ | $42.0B | 163.2x | 62.6x | 16.7x | 11.8x | 60.7x | 42.9x | 67.3x | 0.9% |
LEU | $3.2B | 67.1x | 68.4x | 6.7x | 6.8x | 28.9x | 29.2x | 34.4x | -7.0% |
| Ticker | Mkt cap | P/E | P/E fwd | P/S | P/S fwd | P/GP | P/GP fwd | EV/EBITDA | FCF yld |
|---|---|---|---|---|---|---|---|---|---|
BX | $173.2B | 31.9x | 24.0x | 10.8x | 11.8x | 12.2x | 13.3x | 21.9x | 2.5% |
KKR | $102.4B | 33.9x | 18.4x | 4.8x | 9.7x | 10.4x | 20.8x | 15.1x | 8.3% |
APO | $76.4B | 28.7x | 15.1x | 2.1x | 3.3x | 2.5x | 3.9x | 6.7x | 10.5% |
| Ticker | Mkt cap | P/E | P/E fwd | P/S | P/S fwd | P/GP | P/GP fwd | EV/EBITDA | FCF yld |
|---|---|---|---|---|---|---|---|---|---|
ARES | $46.4B | 61.7x | 24.1x | 7.3x | 8.7x | 11.6x | 13.9x | 23.9x | 1.8% |
SPY | $773.0B | — | — | — | — | — | — | — | — |
Consensus projections
| Ticker | FY2026E | FY2027E | FY2028E | |
|---|---|---|---|---|
BEP | Revenue | +3.8% | +9.0% | −3.4% |
| EPS | +14.0% | −11.7% | +9.4% | |
BN | Revenue | −7.6% | +23.6% | +22.3% |
| EPS | +13.9% | +23.1% | +12.0% | |
CWEN | Revenue | +14.8% | +10.8% | +13.4% |
| EPS | −133.6% | −152.5% | +132.7% | |
BEPC | Revenue | +2.4% | +18.4% | +2.5% |
| EPS | +283.7% | −94.0% | +510.2% | |
BAM | Revenue | +12.2% | +16.1% | +12.9% |
| EPS | +12.9% | +17.8% | +16.8% | |
XIFR | Revenue | +0.8% | +4.7% | +1.3% |
| EPS | −849.6% | −44.0% | −144.3% | |
NEE | Revenue | +9.4% | +9.7% | +8.9% |
| EPS | +9.0% | +9.0% | +8.5% | |
CCJ | Revenue | +3.6% | +10.9% | +7.7% |
| EPS | +7.3% | +69.4% | +25.2% | |
LEU | Revenue | +4.8% | −0.2% | −9.4% |
| EPS | −45.1% | +17.7% | −15.9% | |
BX | Revenue | +15.1% | +24.9% | +4.0% |
| EPS | +11.3% | +24.9% | +10.7% | |
KKR | Revenue | +33.9% | +17.8% | +32.9% |
| EPS | +26.0% | +18.0% | +15.7% | |
APO | Revenue | +26.8% | +16.1% | +14.3% |
| EPS | +10.4% | +22.4% | +15.6% | |
ARES | Revenue | +16.3% | +19.1% | +9.9% |
| EPS | +17.3% | +24.2% | +18.2% |
Forward fiscal years only. Blank means no analyst coverage for that year.
A levered owner of hydro, wind and solar plants is paying its unitholders less income than the US Treasury pays for thirty-year money. Brookfield Renewable's $0.392 quarterly distribution, an annualized $1.568, works out to 5.04% at $31.10 a unit; the 30-year Treasury yielded 5.27% on 1 September, its highest area since 2007 and the worst stretch for the long bond since 2006.
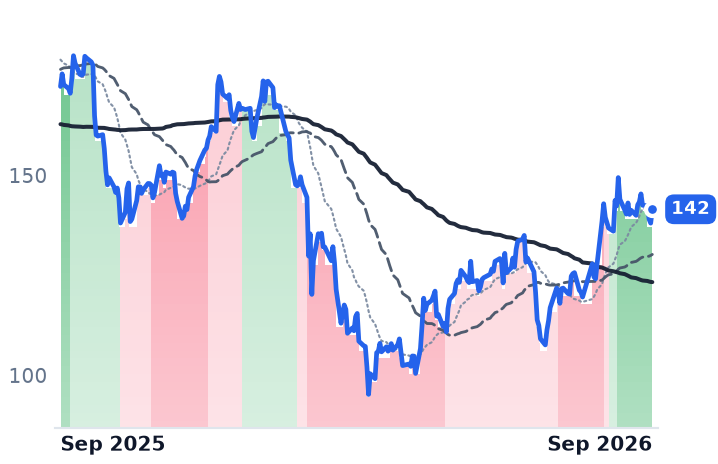
That inversion is the whole mechanism. A contracted-power vehicle is bought as a spread over the risk-free curve, and when the curve moves and the payout does not, the spread has to be rebuilt out of the unit price. It has been: the units are down 14.8% since early June and 16.6% from their 2026 high, having held above their long-term moving average from late January until this week, when the fifty-day average slipped beneath the two-hundred-day. Part of the final leg was arithmetic of a different kind — the units went ex-distribution on 31 August, and essentially the whole of that session's 1.15% decline was the payment coming out of the price.
The operating record is not what broke
"We delivered record financial results, robust capital deployment, and the highest levels of development and asset recycling in our history," chief executive Connor Teskey said on 31 July. The supporting facts are real: 1.3 gigawatts commissioned in the quarter, power purchase agreements signed for 2.6 gigawatts, roughly $12bn of financings executed including the largest private placement in the company's history against a Google-contracted hydro portfolio, and $2.2bn of asset sales agreed or closed at or above target returns. Funds from operations reached $421m, up 11% per unit, and the distribution absorbs 73% of the trailing-twelve-month figure of $2.14 — inside the 70–80% target the company sets itself.
Underneath, the composition is thinner than the headline. About $175m of that $421m was gains on developed-asset and non-core disposals, roughly two-fifths of the quarter. Reported revenue fell 1.8% year on year, the second consecutive quarterly decline, and gains from selling a further slice of a Maine hydro portfolio were needed to offset weak US hydrology. The units change hands at 9.7 times trailing enterprise value to earnings before interest, taxes, depreciation and amortization, and about 14.5 times trailing funds from operations per unit — hardly a distressed price after a 26.1% twelve-month advance.
The same wave, a different business
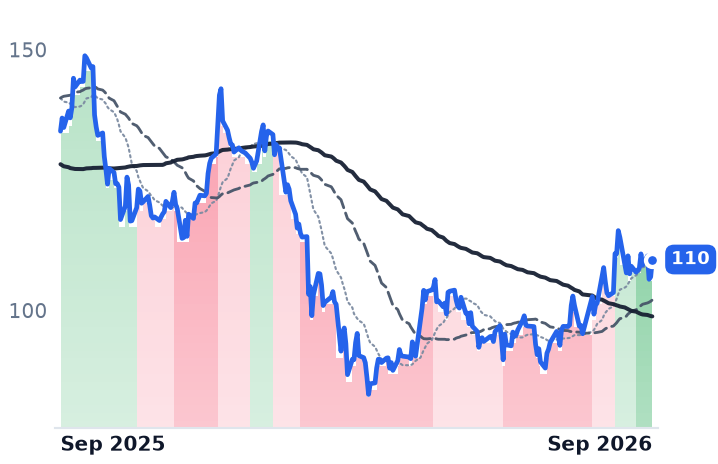
Brookfield Corporation, the Toronto manager that owns the renewable platform alongside real estate, infrastructure, credit and private equity, is not priced as a yield spread, and its numbers went the other way. Distributable earnings before realizations rose 15% to $1.4bn in the second quarter, fee-related earnings 20%, and fee-bearing capital 19% to $672bn on a record $77bn of quarterly fundraising, with Oaktree closing in July. The shares are down 7.2% over twelve months and 17.8% from their 2026 high, at 14.6 times forward earnings against roughly 16.9 times trailing distributable earnings before realizations — and about 41% below the $68 per share of long-term cash-flow value the company's own 2025 plan assigns itself.
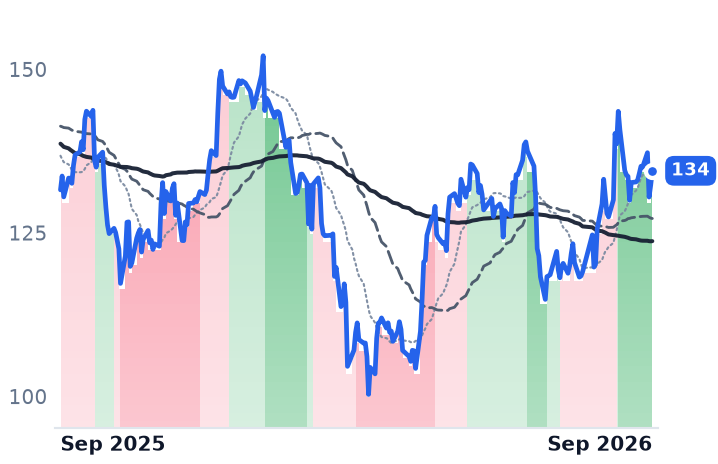
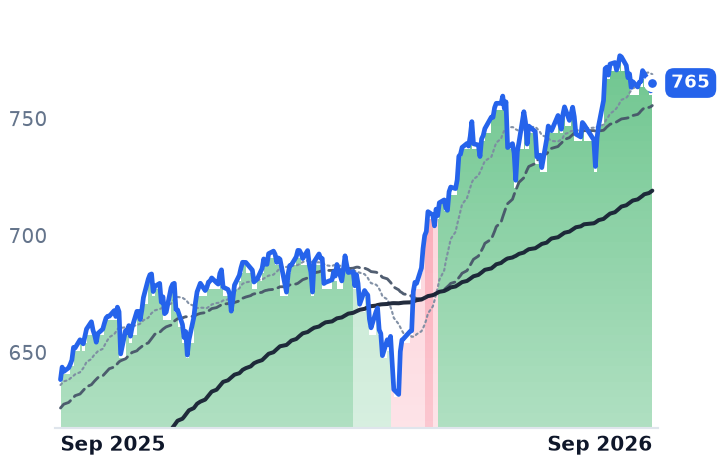
On 1 September the whole listed alternative-manager group fell together — Brookfield 4.0%, Blackstone 3.9%, KKR 4.1%, Apollo 4.9% — on a day the S&P 500 fund fell 0.5%, with no Brookfield-specific news discoverable. The group has gapped lower repeatedly this year on private-credit redemption fears rather than on earnings, and the likelier reading of that session is rates and sector rather than anything about the funding model.
The verdict the arithmetic supports
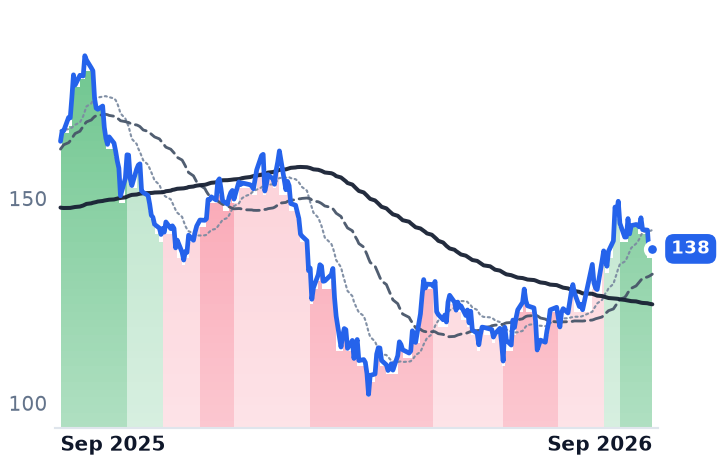
Brookfield Renewable's de-rating is earned, and the earning is mechanical: a 5.04% payout could not survive beside a 5.27% long bond, and an operating base where two-fifths of the quarter's cash earnings came from disposals gives a buyer little reason to pay up for the difference. Clearway Energy, the Princeton owner of about 5,000 net megawatts of wind and solar, fell harder still, 21.9% over ninety days, on 22.7% revenue growth — after cutting 2026 cash available for distribution guidance to $430–470m from $470–510m on weak wind. Rates are doing most of the work across the group, weather the rest.
Brookfield Corporation's decline is the one nothing in the reported numbers explains. Higher discount rates compress the present value of carried interest and balance-sheet marks, a genuine channel, but fee-bearing capital growing at 19% is the opposite of the private-credit stress the sector's worst sessions are pricing.
Two dated events sit ahead of both. Unitholders vote on 14 October on collapsing the renewable partnership and its corporate twin into a single company, one for one. And Westinghouse — 51% Brookfield-owned, its contribution up more than 60% year on year — filed a confidential draft registration statement on 3 August for a listing it is compelled to hold once it reaches a $30bn valuation. Nothing in the current price of either security depends on a number the market has yet been allowed to see.