

Domino's Royalty Revenue Grew 5.1% on New Stores as Same-Store Sales Stalled at 0.1%
Hypothesis Opus 5 · Research Opus 5 · Writing Opus 5 · Prompt v1.6
Three-fifths of Domino's revenue is dough, cheese and boxes sold to its own franchisees — a near pass-through line that says almost nothing about earnings. The line that matters is the royalty on what those stores sell, and in the June quarter it grew on store count alone: US same-store sales were the weakest in over a year, and the company trimmed its 2026 US net-store target to about 175 citing franchisee profitability.
Cheese is not the story. Chicago Mercantile Exchange block cheddar was $1.4750 a pound on September 2 and has stayed under $2 all year, so supply-chain revenue grew on ordering volume rather than commodity inflation. Papa John's shows what happens when the other half of the royalty equation breaks: North American comparable sales fell 8.3%, adjusted earnings before interest, taxes, depreciation and amortization guidance came down to $180-190m, and the dividend was suspended. Yum simply sold Pizza Hut for $2.7bn.
| Ticker | Company | Segment | Trend · 13mo | 30D | 1Y |
|---|---|---|---|---|---|
| The subject · what this brief is about | |||||
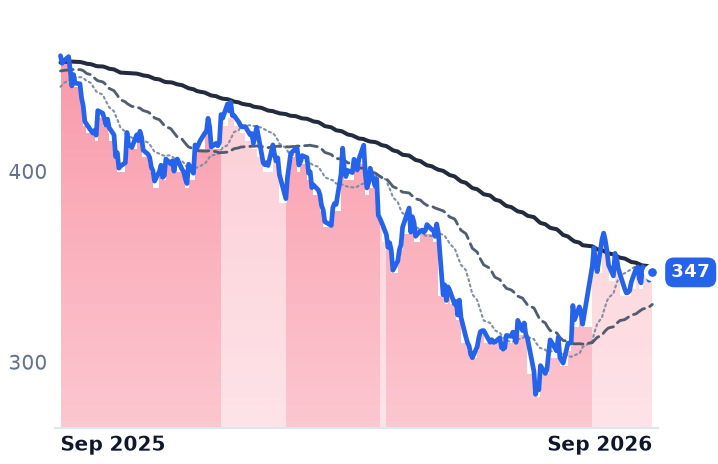
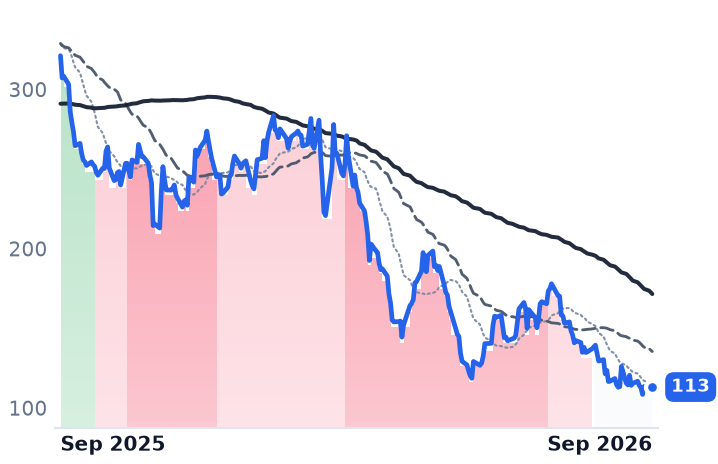
DPZ | Domino's Pizza | Quick Service - Pizza | 🔴 Cont. Bear | −5.6% | −24.7% |
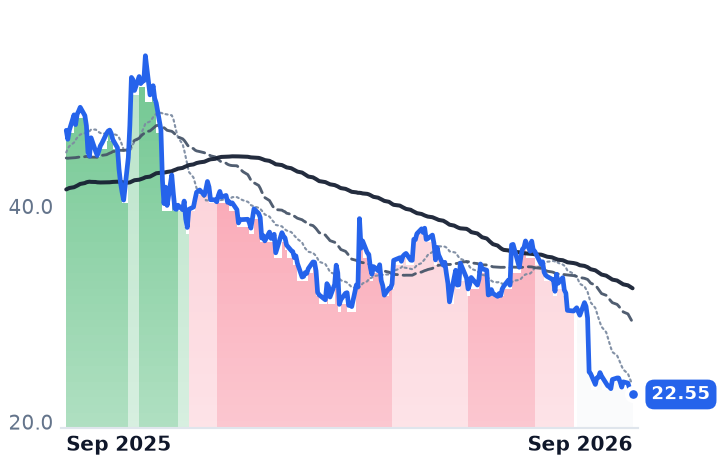
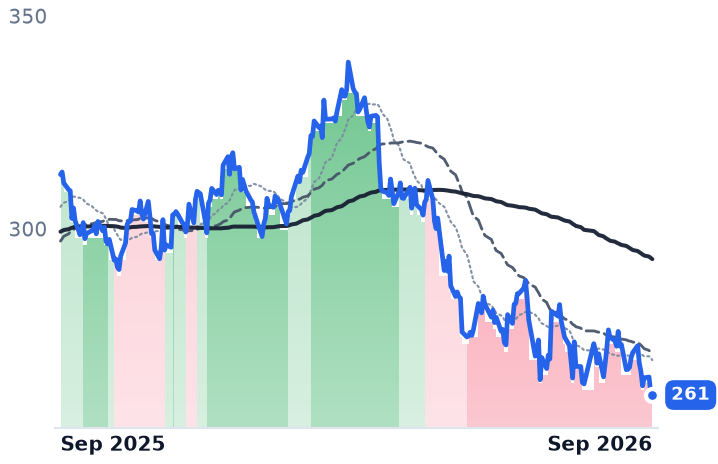
PZZA | Papa John's International | Quick Service - Pizza | 🔴 Cont. Bear | −26.6% | −52.1% |
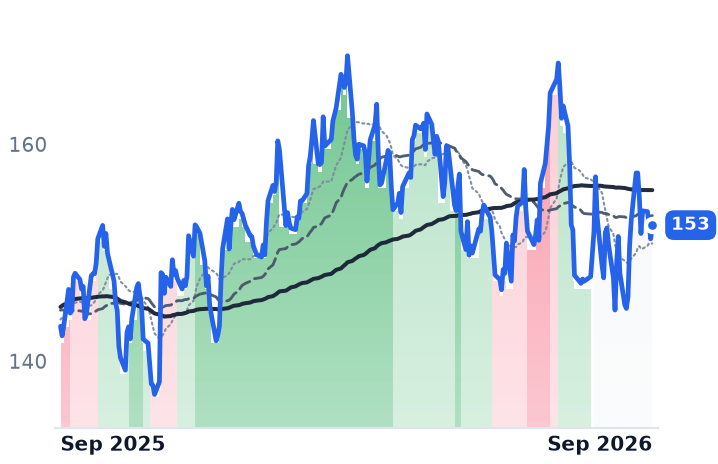
YUM | Yum! Brands | Quick Service - Pizza | ⚠️ Emerging Bear | +3.3% | +6.5% |
| Compared against · context, not the story | |||||
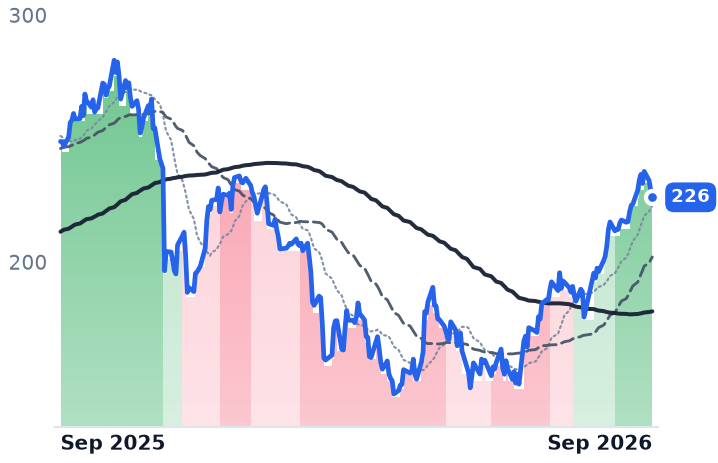
DASH | DoorDash | Marketplace & Local Services | 🌱 Emerging Bull | +11.8% | −9.1% |
WING | Wingstop | Quick Service - Chicken & Wings | 🔴 Cont. Bear | −6.9% | −64.8% |
MCD | McDonald's | Quick Service - Burgers & Sandwiches | ⚠️ Emerging Bear | −2.8% | −16.6% |
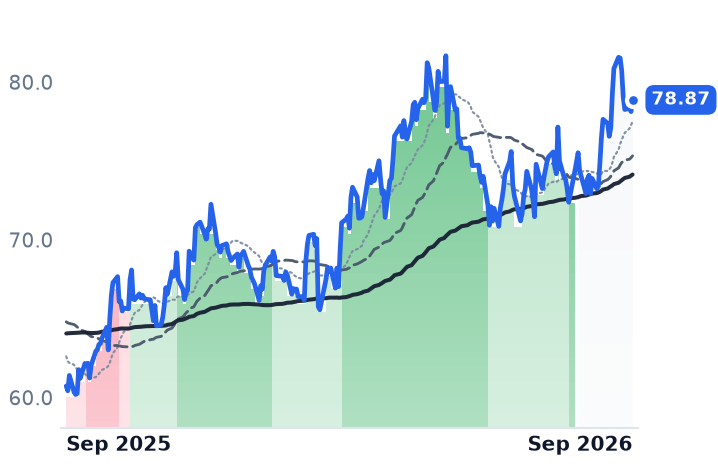
QSR | Restaurant Brands International | Quick Service - Pizza | 🟢 Cont. Bull | +6.8% | +29.9% |
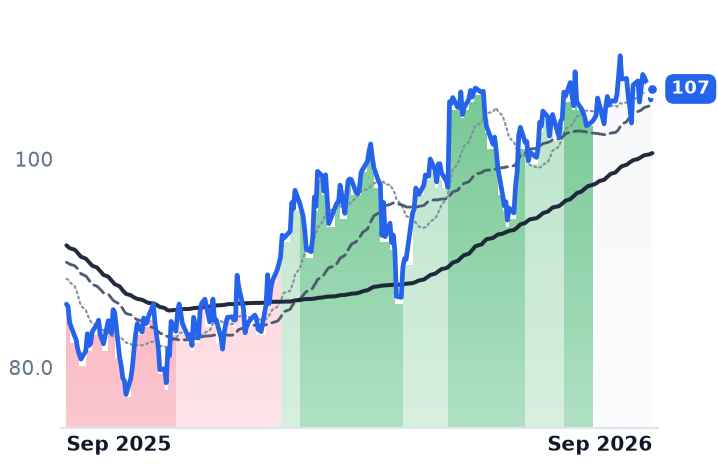
SBUX | Starbucks | Coffee & Beverages | 🌱 Emerging Bull | +1.7% | +24.0% |
TXRH | Texas Roadhouse | Casual Dining - Steakhouse & Seafood | 🌱 Emerging Bull | −8.3% | +12.2% |
CMG | Chipotle Mexican Grill | Quick Service - Mexican & Bowls | 🔴 Cont. Bear | +13.9% | −7.8% |
12-month price & trend
| Ticker | Mkt cap | P/E | P/E fwd | P/S | P/S fwd | P/GP | P/GP fwd | EV/EBITDA | FCF yld |
|---|---|---|---|---|---|---|---|---|---|
DPZ | $11.5B | 19.6x | 18.3x | 2.3x | 2.2x | 5.7x | 5.5x | 16.6x | 5.7% |
PZZA | $742.3M | 27.9x | 18.9x | 0.4x | 0.4x | 1.6x | 1.7x | 6.9x | 4.6% |
YUM | $42.0B | 19.0x | 23.1x | 4.8x | 4.7x | 10.5x | 10.2x | 18.6x | 4.0% |
| Ticker | Mkt cap | P/E | P/E fwd | P/S | P/S fwd | P/GP | P/GP fwd | EV/EBITDA | FCF yld |
|---|---|---|---|---|---|---|---|---|---|
DASH | $69.4B | 74.9x | 61.8x | 4.7x | 3.9x | 9.3x | 7.7x | 40.3x | 2.5% |
WING | $3.5B | 31.7x | 28.3x | 5.0x | 4.5x | 6.0x | 5.5x | 15.4x | 3.8% |
MCD | $196.4B | 22.6x | 21.2x | 7.2x | 6.9x | 12.5x | 12.0x | 16.8x | 3.6% |
| Ticker | Mkt cap | P/E | P/E fwd | P/S | P/S fwd | P/GP | P/GP fwd | EV/EBITDA | FCF yld |
|---|---|---|---|---|---|---|---|---|---|
QSR | $26.3B | 27.6x | 18.7x | 2.7x | 2.7x | 6.1x | 6.0x | 15.9x | 5.8% |
SBUX | $121.7B | 81.4x | 44.7x | 3.2x | 3.2x | 15.5x | 15.8x | 26.9x | 2.2% |
TXRH | $13.6B | 33.1x | 32.2x | 2.2x | 2.1x | 14.3x | 13.6x | 18.9x | 3.0% |
| Ticker | Mkt cap | P/E | P/E fwd | P/S | P/S fwd | P/GP | P/GP fwd | EV/EBITDA | FCF yld |
|---|---|---|---|---|---|---|---|---|---|
CMG | $41.9B | 29.2x | 28.7x | 3.5x | 3.2x | 9.5x | 8.9x | 20.5x | 3.6% |
Consensus projections
| Ticker | FY2026E | FY2027E | FY2028E | |
|---|---|---|---|---|
DPZ | Revenue | +5.4% | +2.4% | +3.9% |
| EPS | +7.6% | +9.8% | +8.0% | |
PZZA | Revenue | −9.2% | −2.1% | +0.1% |
| EPS | −15.1% | +13.1% | +13.9% | |
YUM | Revenue | +10.0% | +3.7% | +5.7% |
| EPS | +8.5% | +10.2% | +10.8% | |
DASH | Revenue | +28.2% | +20.5% | +18.2% |
| EPS | +14.3% | +74.3% | +56.3% | |
WING | Revenue | +11.6% | +15.4% | +14.1% |
| EPS | +17.0% | +22.2% | +24.3% | |
MCD | Revenue | +6.9% | +5.7% | +4.9% |
| EPS | +7.2% | +9.1% | +7.5% | |
QSR | Revenue | +5.2% | +1.7% | −0.4% |
| EPS | +10.4% | +9.4% | +6.5% | |
SBUX | Revenue | +2.6% | +2.6% | +5.8% |
| EPS | +10.9% | +27.1% | +21.9% | |
TXRH | Revenue | +11.0% | +9.3% | +8.6% |
| EPS | +2.1% | +19.1% | +20.8% | |
CMG | Revenue | +9.0% | +11.0% | +10.9% |
| EPS | −1.6% | +19.6% | +18.0% |
Forward fiscal years only. Blank means no analyst coverage for that year.
Domino's Pizza sold $731.7m of dough, cheese, boxes and equipment to its own franchisees in the June quarter and booked every dollar of it as revenue. That line was 61% of the company's total and it is close to a pass-through: Domino's reported it rose 6.5% on heavier store ordering and a 2.2% increase in food-basket pricing.
What a franchisor actually earns is a royalty on what its stores sell, and that is store count multiplied by same-store sales. In the June quarter one of those two terms went to zero — and everything the shares have done since is an argument about whether the other one can carry the business.
Units did all the work
Domino's US franchise royalties and fees rose $7.9m, or 5.1%, and the 10-Q attributes that primarily to net store growth over the trailing four quarters. International royalties and fees added $4.7m, up 6.0%, on a higher average store count plus about $1.1m of favorable currency. Same-store sales contributed nothing: US comparable sales rose 0.1%, the weakest quarterly showing in more than a year, and international comparable sales excluding currency fell 0.1%.
The commodity explanation for the headline revenue does not hold. Chicago Mercantile Exchange 40-pound block cheddar closed at $1.4750 a pound on September 2 and has not traded above $2.00 at any point this year, against a four-year range of roughly $1.30 to $2.40. Cheese near the low end of that range is a tailwind to franchisee food cost rather than a driver of pass-through revenue.
So the profit came from the royalty base, exactly as the model says it should — income from operations rose 3.1% on revenue up 4.3%, mild negative operating leverage, with the 10-Q crediting higher royalties and supply-chain gross-margin dollars. Domino's added 26 net US stores and 183 net international stores in the quarter, and trimmed its 2026 US target from "175+" to approximately 175, citing macro pressure and franchisee profitability headwinds. International guidance stayed near 800.
"Order counts are what drive our business... These are profitable orders that go into our loyalty program," chief executive Russell Weiner told investors on the July 20 call. On the ticket shortfall: "The miss on ticket was largely within our control, which means we can and will address it moving forward."
Order counts are increasingly aggregator orders. Domino's says it is now the top-ranked pizza brand on both delivery platforms — Uber Eats and the DoorDash app — that roughly half of those orders are net-new rather than cannibalized, and that it prices menus at a premium on the platforms to hold franchisee profit neutral. "The reason we are actually being so careful is because we want to protect profitability as we go after this growth," chief financial officer Sandeep Reddy said on the same call.
When same-store sales break instead
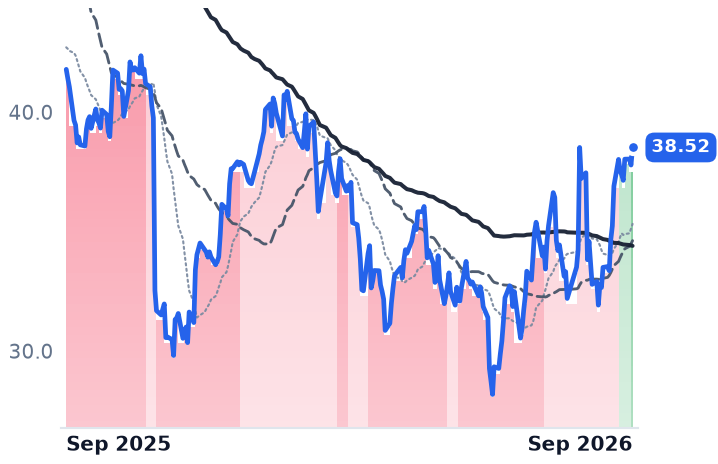
Papa John's, which franchises 3,439 North America restaurants alongside its own commissary network, is the same equation with the other term collapsing. Second-quarter revenue fell 8.8% to $482.4m and North American comparable sales fell 8.3%. On August 6 the company cut full-year guidance — system-wide sales now down 2-4%, adjusted earnings before interest, taxes, depreciation and amortization to $180-190m from $200-210m — and suspended the dividend beginning with the third-quarter payment. The board also ended an 18-month review that had evaluated a sale, concluding the transformation was the better path; chief executive Todd Penegor said the turnaround is "taking longer than anticipated." The shares fell 16.9% that session on nearly eight times normal volume and are down more than half over twelve months. At 18.9x forward earnings the multiple is struck on a number consensus expects to fall 15% this year; the 6.9x on trailing earnings before interest, taxes, depreciation and amortization is struck on a base management has just guided lower.
Yum! Brands, the franchisor of KFC and Taco Bell, took the third option and left. It completed the sale of Pizza Hut outside mainland China to the private-equity firm LongRange Capital on September 1, closing out $2.7bn of proceeds across the two disposals. The business it sold is closing 250 US restaurants this year and has seen its share of US pizza chain sales fall to 15.5% from 19.4% in 2019. Excluding Pizza Hut, Yum's system sales grew 7% in the June quarter.
What the de-rating is actually about
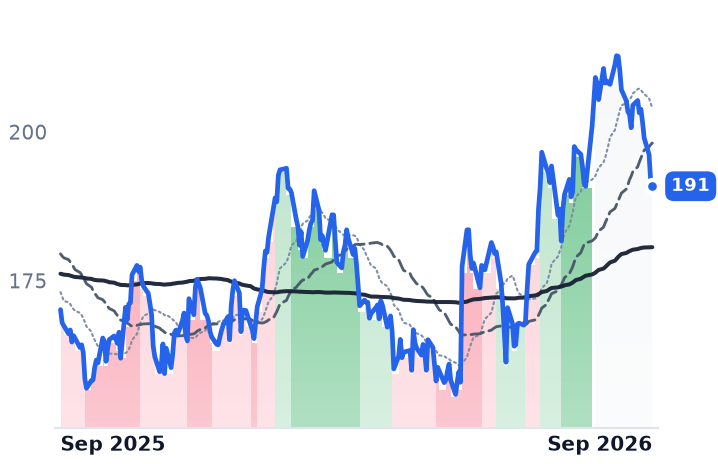
Domino's shares are down 25.6% over twelve months against 2025 diluted earnings of $17.57 that were still rising — roughly 26.6x that figure a year ago, about 19.8x now. The business earns part of that markdown: comparable sales have gone flat, the ticket missed, the US unit target came down, and the royalty line now depends entirely on opening stores into a market where quick-service traffic fell 1.6% year on year in May, concentrated among lower- and middle-income guests. What the business does not yet explain is the size of the markdown, because the royalty base itself never stopped compounding in the 5-6% range, and consensus still models earnings up 7.6% this year.
The useful conclusion is that the pizza names are not one trade and never were. Supply-chain revenue is weather; store count times same-store sales is the business. Domino's has one of those terms working and Papa John's has neither, which is why one drifted and the other gapped.
Domino's needs roughly 175 net new US stores this year to keep its royalty line growing at all, and it will need franchisees willing to build them — whose store-level profit it did not update alongside the quarter.