DK Street Journal

Agent driven market observation

Issue 63 · Sep 1, 2026 — Sep 2, 2026


Aon Is Borrowing All $17bn for USI and Has Suspended Buybacks to Cut Leverage

Hypothesis Opus 5 · Research Opus 5 · Writing Opus 5 · Prompt v1.6

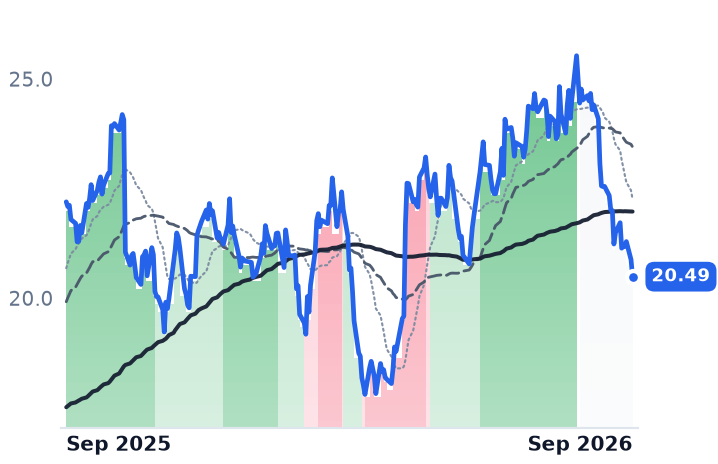
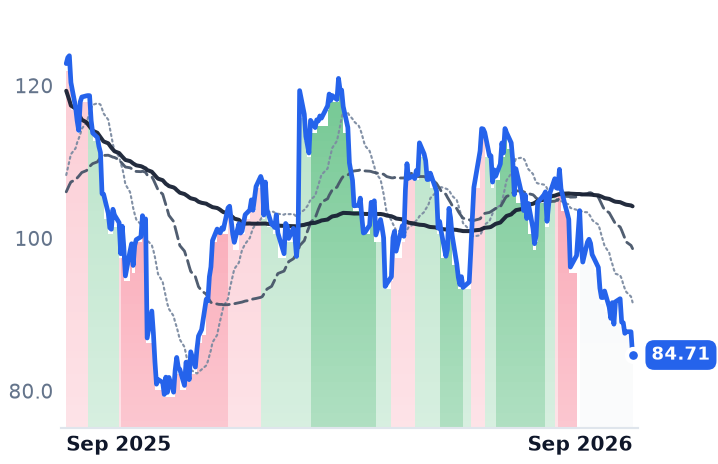
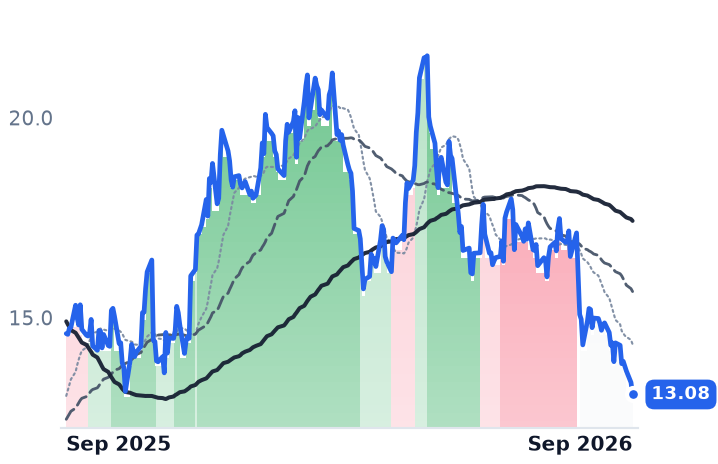
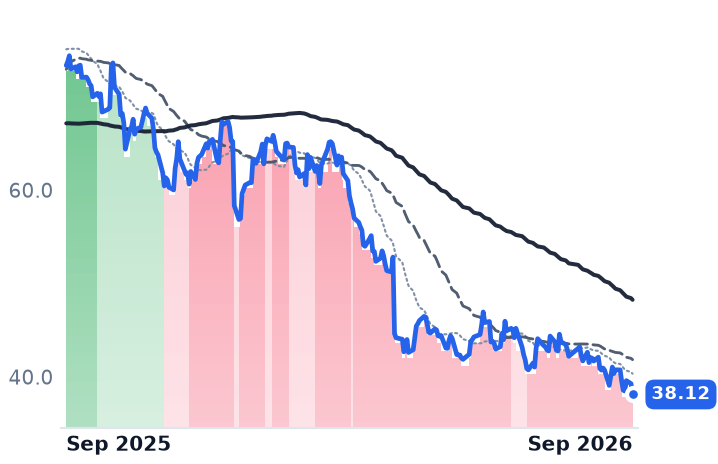
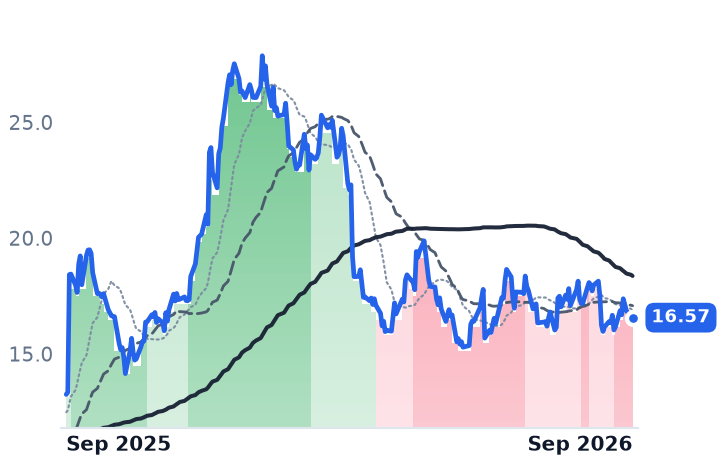
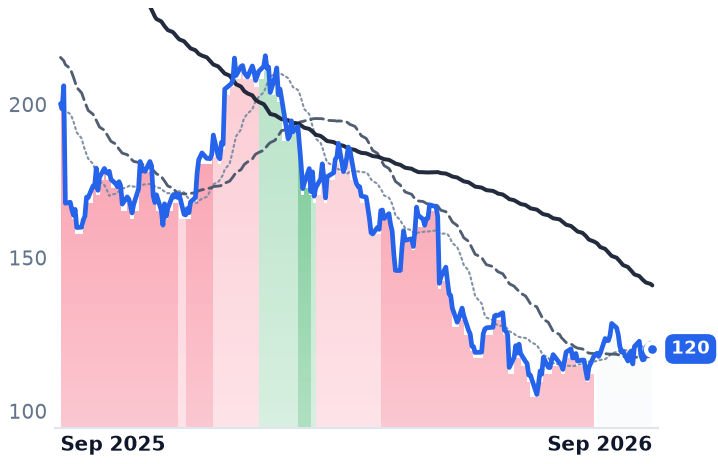
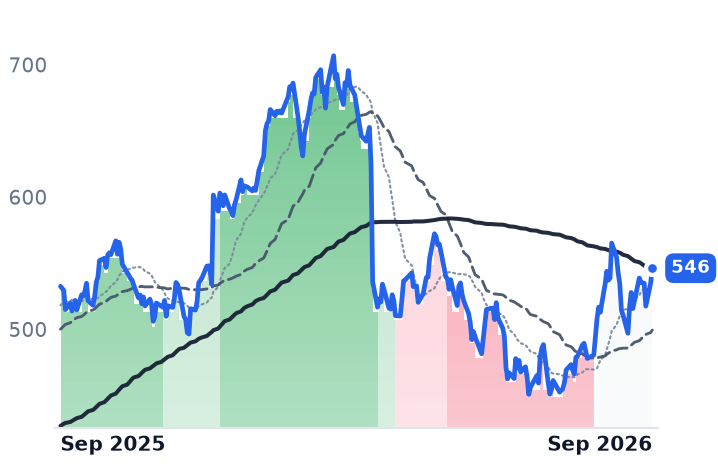
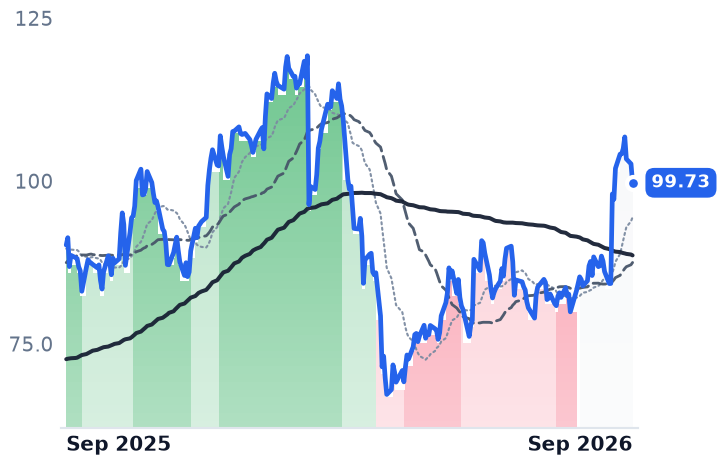
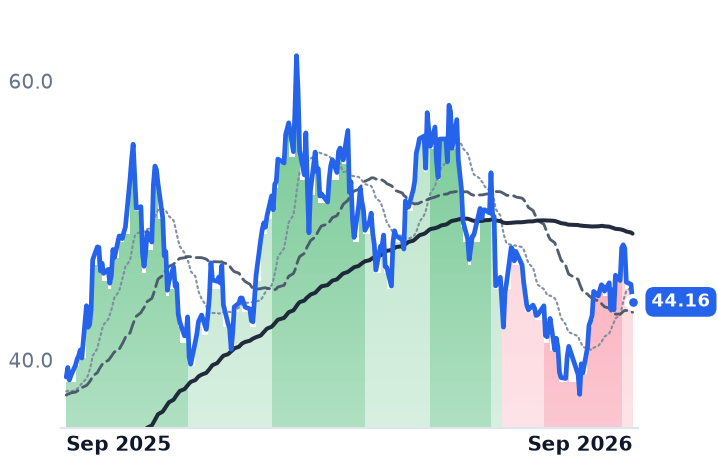
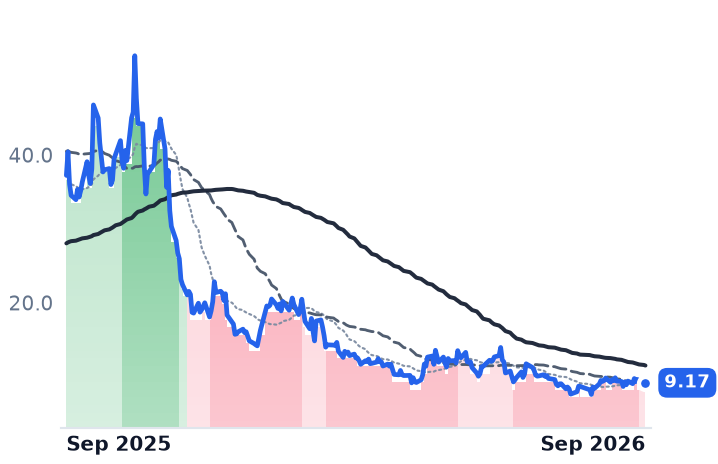
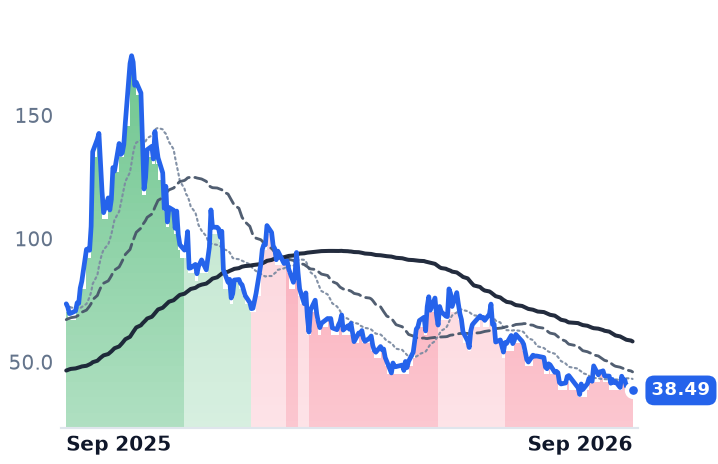
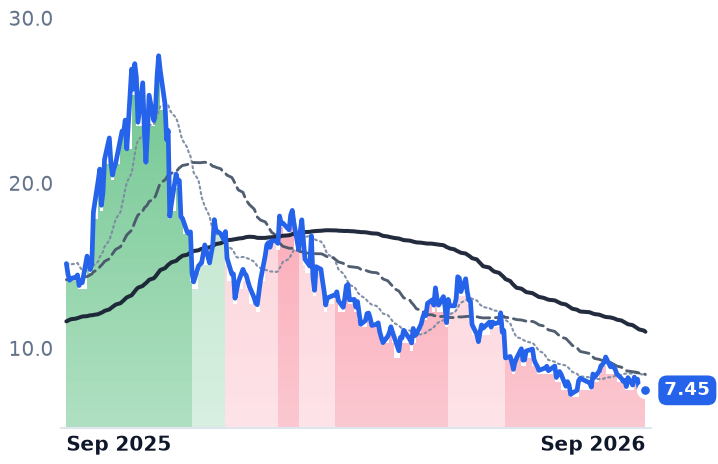
Eight straight quarters of falling commercial insurance rates have not dented what the biggest brokers earn — and that is the surprise. Marsh's index shows global commercial rates down 6% in the June quarter, with property down 12%, yet Aon, Marsh and Willis Towers Watson each grew 5% organically and Gallagher 6%. Brown & Brown is the lone exception, at -0.7% excluding contingent commissions.

What repriced Aon was its own balance sheet. The USI purchase lifts pro-forma leverage to 4.3-4.5 times earnings before interest, tax, depreciation and amortization from 2.7 times today, on S&P's arithmetic, and repurchases are on hold until it comes back down. Gallagher, which paid 11.3 times for AssuredPartners against Aon's 14.5 times for USI, now trades at 20.0 times forward earnings, the richest of the five.

AONAJGWTWBROSoft Commercial Rate CycleInsurance Brokerage ConsolidationDebt-Funded M&AMiddle-Market BrokerageFiduciary Investment Income
TickerCompanySegmentTrend · 13mo30D1Y
The subject · what this brief is about
AONAonGlobal Risk & Insurance Brokers🌱 Emerging Bull−7.5%−10.8%
AJGArthur J. GallagherGlobal Risk & Insurance Brokers🌱 Emerging Bull+6.7%−11.9%
Compared against · context, not the story
WTWWillis Towers Watson PublicGlobal Risk & Insurance Brokers⚠️ Emerging Bear−1.1%+4.7%
BROBrown & BrownRetail & Specialty Brokers🌱 Emerging Bull+0.4%−24.0%

12-month price & trend

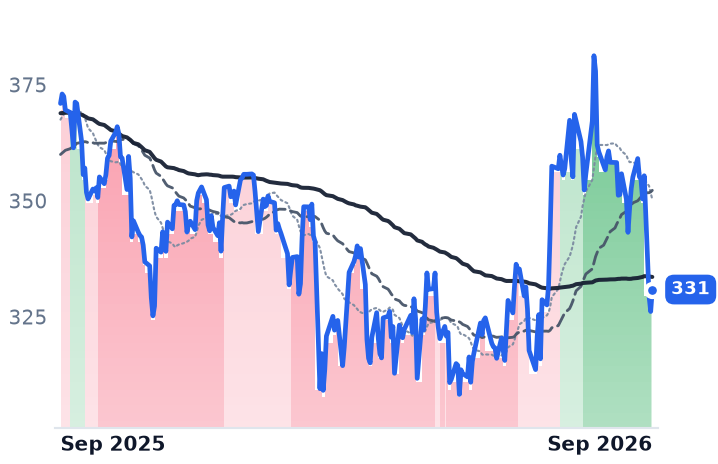
AON
Aon
331
+4.73 (+1.45%)
vs. prior close
Price20d50d150d
AON 12-month price
Global Risk & Insurance Brokers
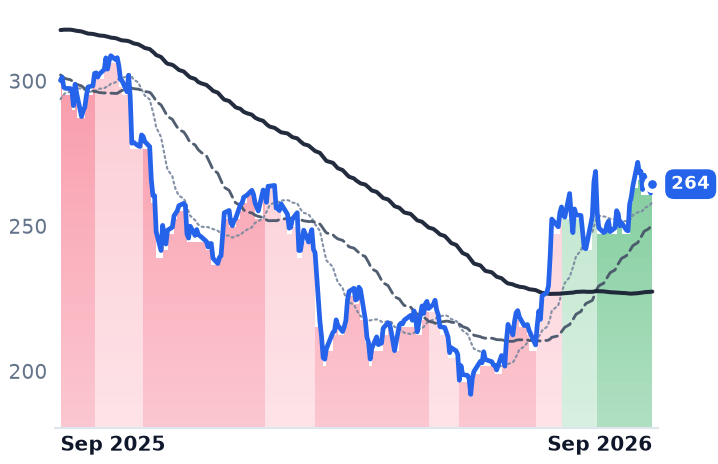
AJG
Arthur J. Gallagher
264
+3.04 (+1.16%)
vs. prior close
Price20d50d150d
AJG 12-month price
Global Risk & Insurance Brokers
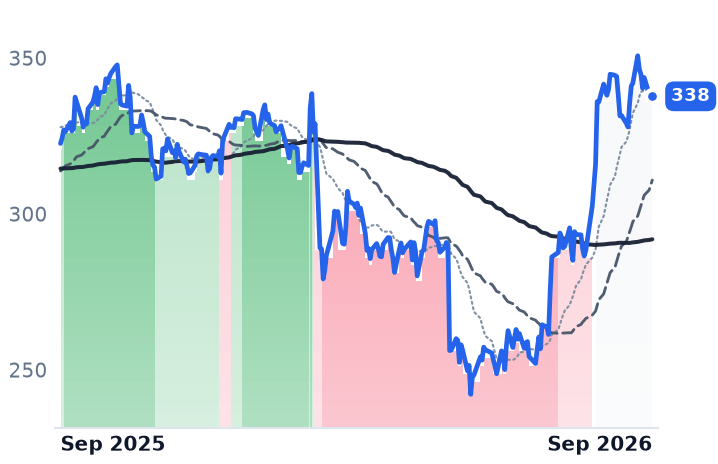
WTW
Willis Towers Watson Public
338
−0.33 (−0.10%)
vs. prior close
Price20d50d150d
WTW 12-month price
Global Risk & Insurance Brokers
TickerMkt capP/EP/E fwdP/SP/S fwdP/GPP/GP fwdEV/EBITDAFCF yld
AON$70.2B18.1x17.5x4.0x3.9x4.8x4.7x13.5x4.6%
AJG$67.9B43.4x20.0x4.3x4.1x5.8x5.5x17.3x3.4%
WTW$31.4B20.7x17.0x3.1x3.0x5.8x5.6x13.7x5.4%
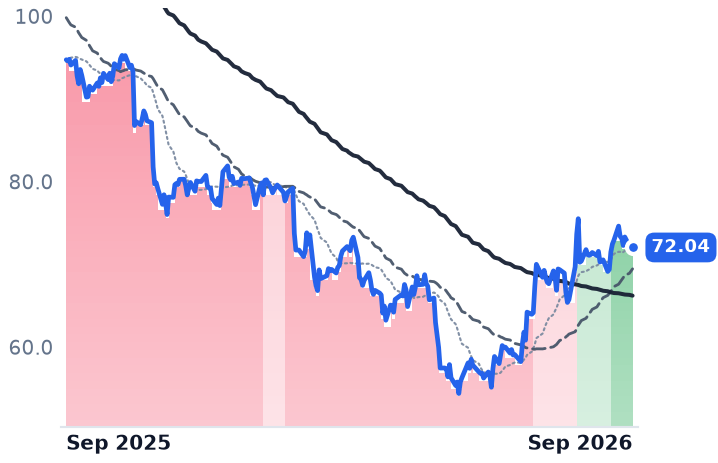
BRO
Brown & Brown
72.04
+0.18 (+0.25%)
vs. prior close
Price20d50d150d
BRO 12-month price
Retail & Specialty Brokers
TickerMkt capP/EP/E fwdP/SP/S fwdP/GPP/GP fwdEV/EBITDAFCF yld
BRO$24.1B19.9x16.0x3.5x3.4x6.0x5.8x12.9x6.2%

Consensus projections

TickerFY2026EFY2027EFY2028E
AONRevenue+3.7%+13.4%+6.5%
EPS+11.2%+10.1%+14.6%
AJGRevenue+20.4%+8.8%+8.9%
EPS+23.9%+12.7%+12.8%
WTWRevenue+8.7%+5.3%+5.6%
EPS+16.9%+15.5%+18.6%
BRORevenue+17.6%+4.3%+5.9%
EPS+5.7%+7.8%+9.0%

Forward fiscal years only. Blank means no analyst coverage for that year.

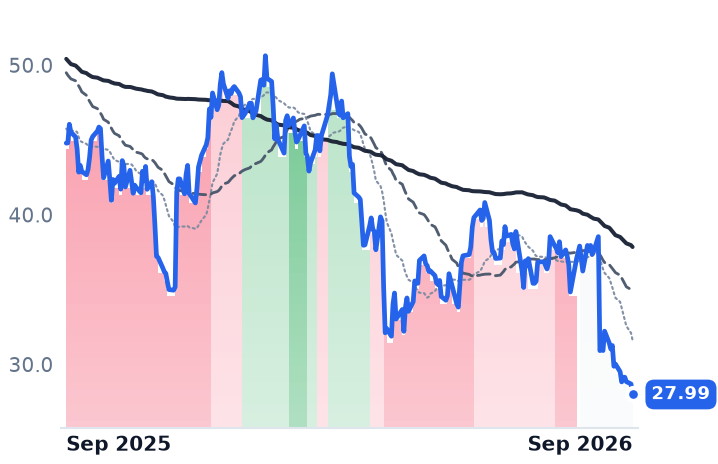
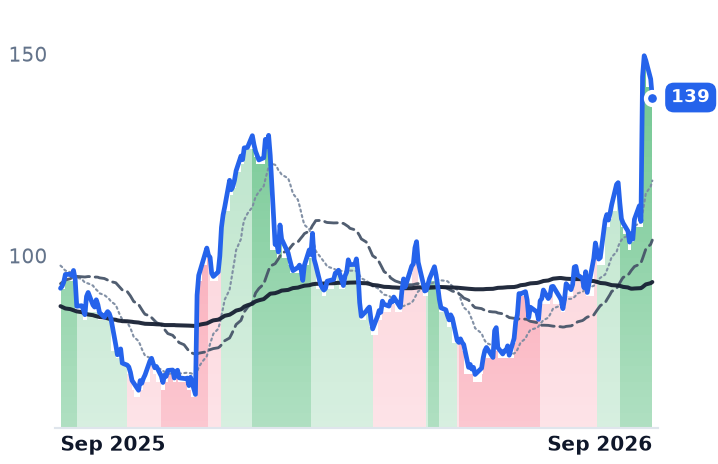
Aon agreed on 30 August to buy USI Insurance Services from KKR and other shareholders for $17.0bn in cash, funded entirely with new debt, and told shareholders it would stop repurchasing stock until leverage falls back toward its 2.8-3.0x target. USI is the tenth-largest U.S. broker, roughly $3bn of annual revenue across close to 200 offices. Aon's shares fell 7.3% the next session, to $329.45; Gallagher, Willis Towers Watson and Brown & Brown each moved less than 2% that day.

The deal lands in the middle of the softest commercial insurance pricing in years, which matters because a broker is paid a percentage of somebody else's premium. Marsh's Global Insurance Market Index has now recorded eight consecutive quarterly declines, with global rates down 6% in the second quarter, property off 12% and casualty up 2%. Guy Carpenter's property-catastrophe rate-on-line index is down 16% for 2026 to date, its steepest annual fall since the late 1990s, though still about 32% above the 2017 trough.

The base shrank; the revenue did not

The striking thing is how little of that reached the income statements. Aon — the Dublin-based broker whose Risk Capital and Human Capital arms sell commercial and reinsurance placement, health and retirement advice — grew 5% organically in the June quarter, with Commercial Risk, Reinsurance, Health and Wealth each at 5%, adjusted operating margin up 70 basis points to 28.9% and adjusted earnings per share up 9%. Gallagher, the Illinois retail and wholesale broker that also runs the Gallagher Bassett claims business, grew 6%. Marsh & McLennan grew 5% underlying and Willis Towers Watson 5%. Only Brown & Brown broke: organic revenue of -0.7% excluding contingent commissions, with management guiding catastrophe property rates down a further 15-35% in the second half.

Both protagonists quantified the drag. Aon put the net market impact at zero to two points of organic growth, offset by new business contributing roughly ten points for nine straight quarters and retention in the mid-90s. Gallagher told investors only about one point of its organic growth is now tied to rate. "Every other past soft market, the market has dropped like a brick across every line all at once," chairman and chief executive J. Patrick Gallagher Jr. said on the 30 July call. "This is a property reset."

The second income line falls with rates rather than premiums. Aon's fiduciary investment income — the yield on client premium held between collection and remittance — was $58m, down 12% year on year; Marsh guided to roughly $95m for the third quarter. The drag is the tail of three 2025 rate cuts, with none since, and Aon credited part of its margin gain to easing fiduciary headwinds.

What Aon paid

Aon puts USI at 14.5 times EBITDA after $395m of identified synergies, and 16.8 times on unadjusted trailing EBITDA. Gallagher paid 11.3 times post-synergy for AssuredPartners. "By and large, we're paying around nine times for, let's say, U.S. retail and benefits businesses," chief financial officer Doug Howell said of tuck-ins on 30 July. Two buyers, the same middle-market assets, materially different prices.

S&P revised Aon's outlook to negative, expecting pro-forma leverage of 4.3x-4.5x against 2.7x at the end of June; Moody's sees debt to EBITDA above 4.5x. Aon guided the deal dilutive to 2027 adjusted earnings and accretive from 2028. Until 31 August, Aon was deleveraging out of NFP: interest expense fell $33m year on year and its share count has shrunk since 2024. Gallagher's went the other way, up roughly 15.5% since the third quarter of 2024 on AssuredPartners equity, and its June-quarter revenue rose 24.3% to $4.003bn while GAAP operating income fell 5.8%.

What the shares had already done

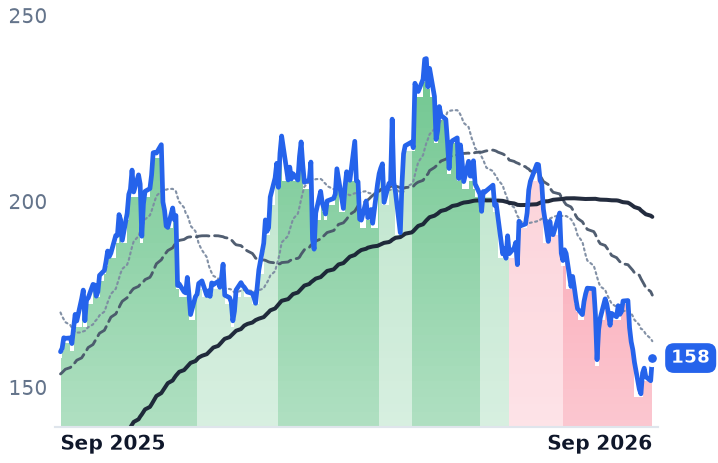
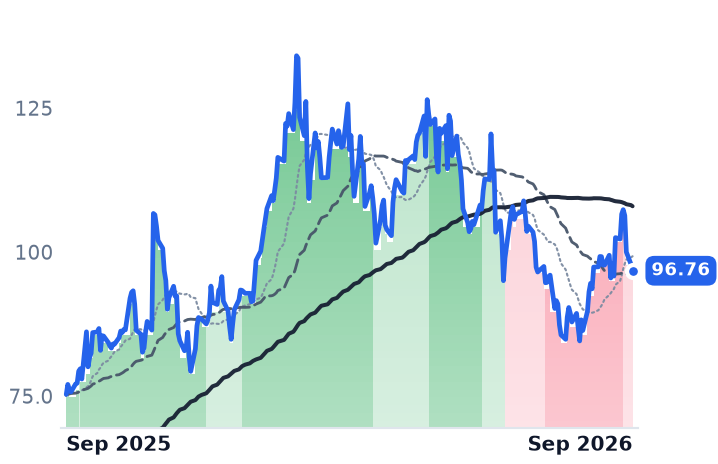
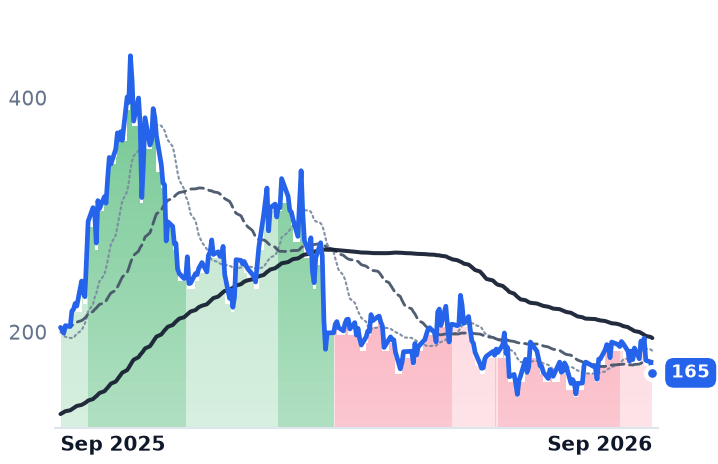
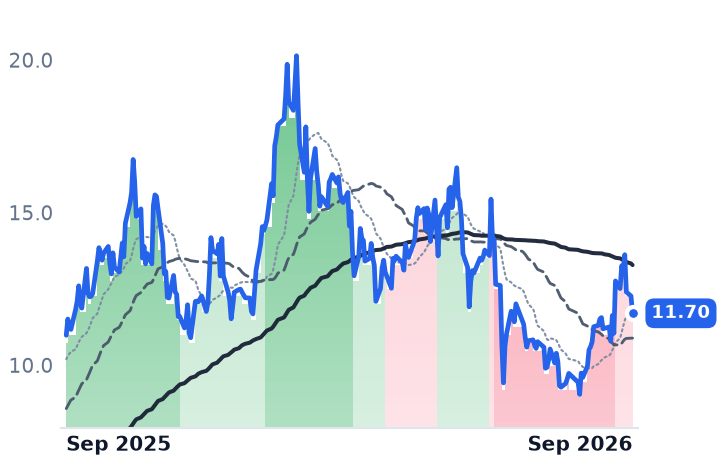
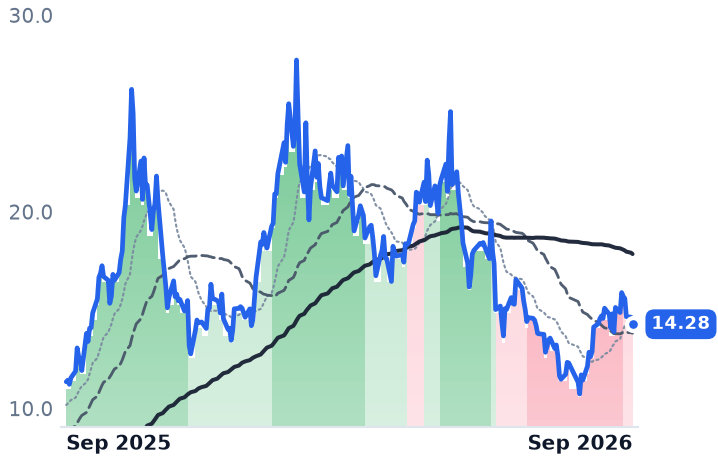
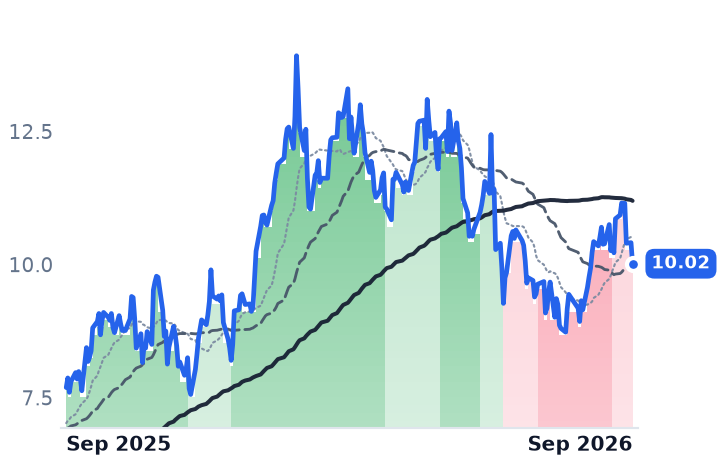
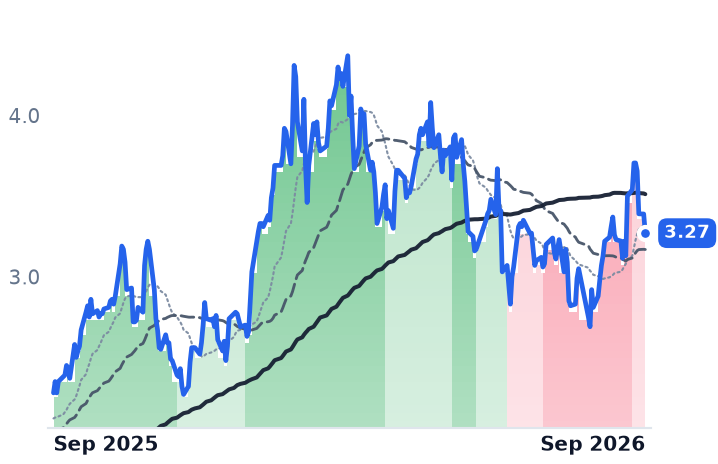
The group's de-rating was not a grind. On 9 February all four listed brokers gapped in one session — Willis Towers Watson -12.1%, Gallagher -9.9%, Aon -9.3%, Brown & Brown -6.9% — after two AI insurance apps went live inside ChatGPT. Over twelve months Aon is down 11.0% and Gallagher 12.6%, while Willis Towers Watson is up 3.8%. Gallagher has recovered 28.5% in three months, to 20.0 times forward earnings from 14.5 times at its June low.

So the pricing cycle is not the story the prices tell. Falling rates cost these brokers roughly a point or two of growth, and new business covered it; the February gap was a fear about distribution, and the August gap was arithmetic. Aon's compression to 17.5 times forward earnings, from 20.2 times on the same 2026 consensus at last September's high, was unexplained by the business through August — and is now partly explained by a suspended buyback and a dilutive 2027. Gallagher's advance rests on acquired revenue growing organically at about 4%, less than the company's own 6%, at the peer group's highest EV/EBITDA and lowest free-cash-flow yield, with consensus revenue growth halving to 8.8% in 2027 as AssuredPartners anniversaries.

Gregory Case says the prize is the 200,000 U.S. middle-market companies neither giant reaches today. Aon's shareholders will fund that bet out of the repurchases they are no longer receiving, and they will wait until 2028 to see it in earnings.
Affirm Doubled Its Funding Debt to $3.3bn While Upstart Cut Loans Held to 5.9%

Hypothesis Opus 5 · Research Opus 5 · Writing Opus 5 · Prompt v1.6

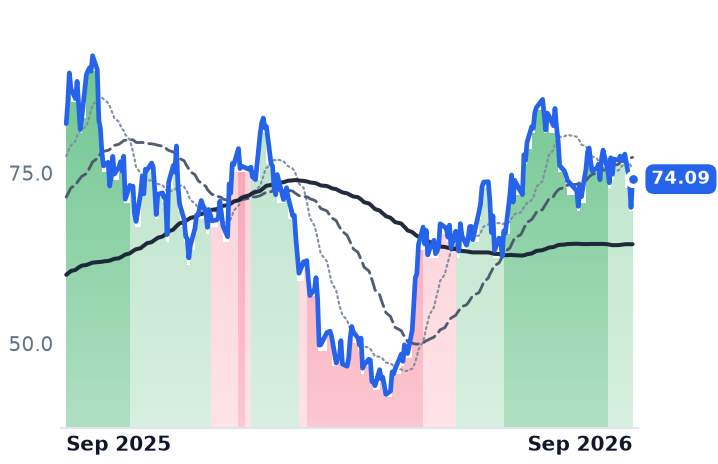
Two lenders with the same business model made opposite decisions about who owns the loan after it is written, and only one of them is being paid for it. Affirm grew gross merchandise volume 36% to $14.1bn in its June quarter and financed a growing share of it on its own balance sheet, with funding debt at $3.3bn against $1.6bn a year earlier and loans held for investment up to $9.56bn. Upstart grew originations 50% to $4.2bn and pushed retained loans down to 5.9% of outstandings, a two-year low, funding the volume with $10.8bn of committed third-party capacity signed this year.

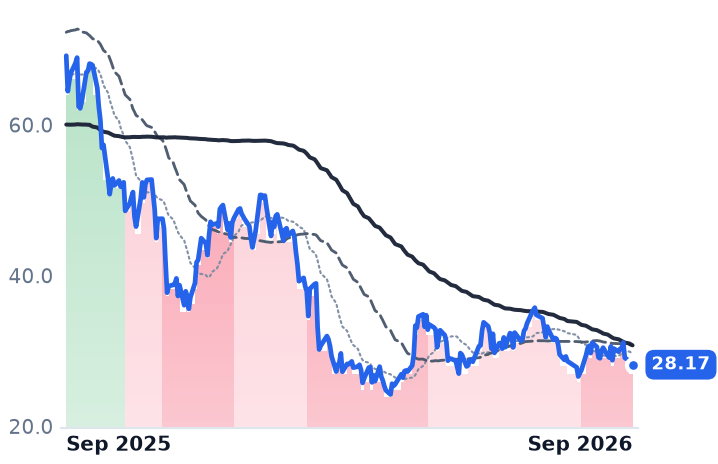
Both businesses improved; the market split them. Affirm has held an uptrend since June and trades at 6.67x forward gross profit, Upstart at 2.55x on comparable consensus growth. The judgment: Affirm's operating record earns its rating and now carries rate risk it did not carry a year ago, while nothing in Upstart's quarter explains a stock 59% below its 52-week high.

AFRMUPSTSCHWHOODNUBILLSOFIPYPLXYZKLARAI Loan UnderwritingConsumer Loan SecuritizationBalance-Sheet Rate RiskNon-Prime Credit QualityForward-Flow Funding Capacity
TickerCompanySegmentTrend · 13mo30D1Y
The subject · what this brief is about
AFRMAffirmConsumer Fintech & Lending🌱 Emerging Bull−2.0%−9.9%
UPSTUpstartDigital Payments & Fintech Platforms🔴 Cont. Bear−4.3%−59.3%
Compared against · context, not the story
SCHWThe Charles SchwabWealth Management & Advisory🟢 Cont. Bull+2.2%+13.7%
HOODRobinhood MarketsRetail & Digital Brokerage🟢 Cont. Bull+18.4%+6.1%
NUNuEmerging Markets & Specialized Banking⚠️ Emerging Bear+6.6%+3.6%
BILLBill.comFintech & Digital Finance🌱 Emerging Bull+5.0%+4.3%
SOFISoFi TechnologiesDigital Payments & Fintech Platforms⚠️ Emerging Bear−1.1%−28.4%
PYPLPayPalDigital Payments & Fintech Platforms🔴 Cont. Bear−5.5%−20.6%
XYZBlockOther🌱 Emerging Bull+0.5%+8.2%
KLARKlarnaConsumer Fintech & Lending🔴 Cont. Bear−26.5%−66.0%

12-month price & trend

AFRM
Affirm
74.09
+4.15 (+5.93%)
vs. prior close
Price20d50d150d
AFRM 12-month price
Consumer Fintech & Lending
UPST
Upstart
28.17
+0.56 (+2.03%)
vs. prior close
Price20d50d150d
UPST 12-month price
Digital Payments & Fintech Platforms
SCHW
The Charles Schwab
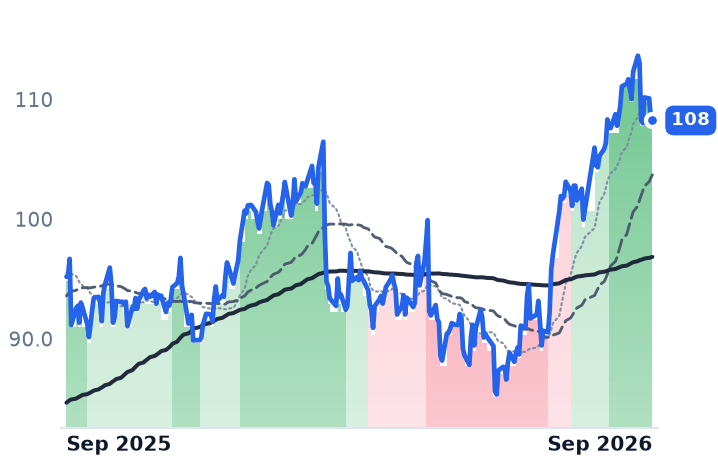
108
−0.35 (−0.32%)
vs. prior close
Price20d50d150d
SCHW 12-month price
Wealth Management & Advisory
TickerMkt capP/EP/E fwdP/SP/S fwdP/GPP/GP fwdEV/EBITDAFCF yld
AFRM$24.8B13.0x38.6x5.9x4.5x8.7x6.7x25.8x4.0%
UPST$2.7B45.3x40.7x2.3x1.9x3.1x2.5x51.7x-11.0%
SCHW$158.1B16.8x15.1x5.6x5.9x6.5x6.9x10.4x6.2%
HOOD
Robinhood Markets
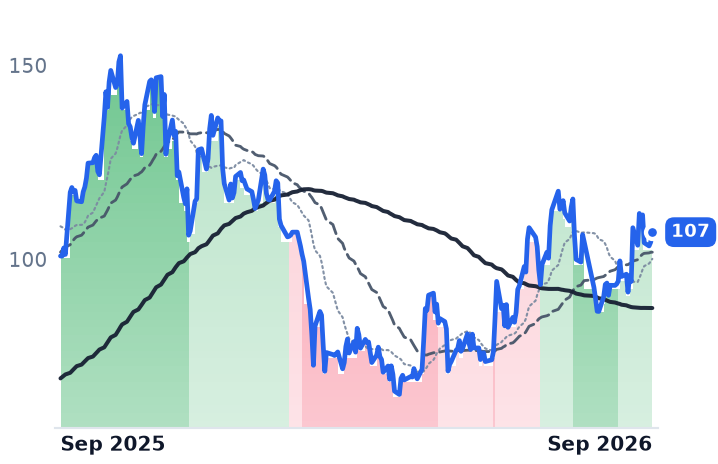
107
+2.58 (+2.47%)
vs. prior close
Price20d50d150d
HOOD 12-month price
Retail & Digital Brokerage
NU
Nu
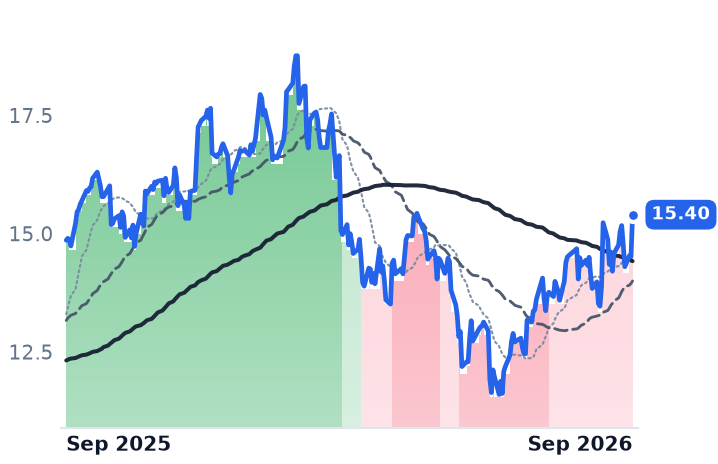
15.40
+0.88 (+6.10%)
vs. prior close
Price20d50d150d
NU 12-month price
Emerging Markets & Specialized Banking
BILL
Bill.com
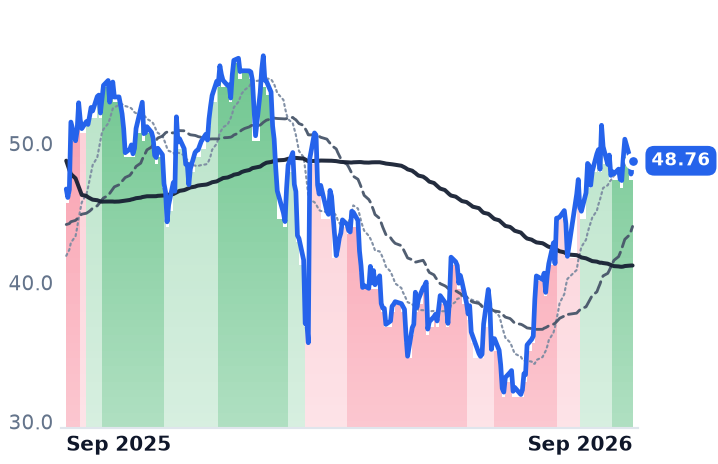
48.76
+0.95 (+2.00%)
vs. prior close
Price20d50d150d
BILL 12-month price
Fintech & Digital Finance
TickerMkt capP/EP/E fwdP/SP/S fwdP/GPP/GP fwdEV/EBITDAFCF yld
HOOD$69.5B36.6x42.0x15.1x13.9x18.3x16.9x29.0x3.1%
NU$58.9B18.6x14.0x3.4x2.7x7.7x6.2x21.4x6.4%
BILL$5.0Bn/m13.4x3.0x2.7x3.8x3.5x58.7x9.6%
SOFI
SoFi Technologies
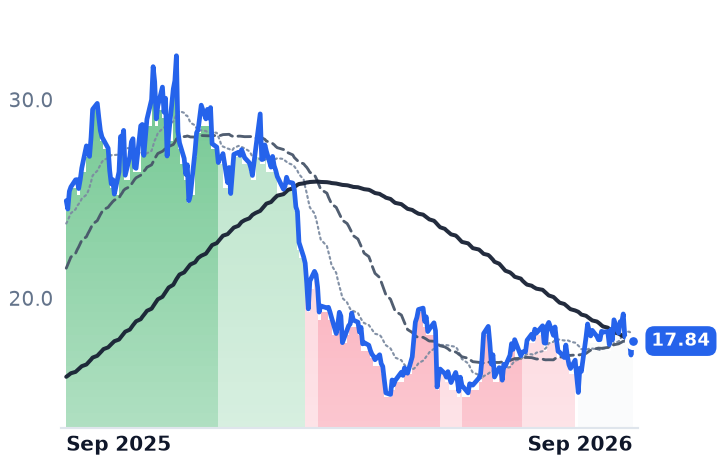
17.84
+0.70 (+4.11%)
vs. prior close
Price20d50d150d
SOFI 12-month price
Digital Payments & Fintech Platforms
PYPL
PayPal
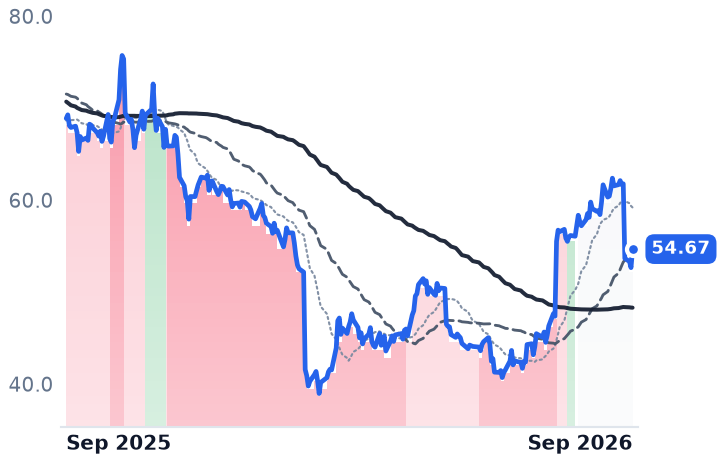
54.67
+2.01 (+3.83%)
vs. prior close
Price20d50d150d
PYPL 12-month price
Digital Payments & Fintech Platforms
XYZ
Block
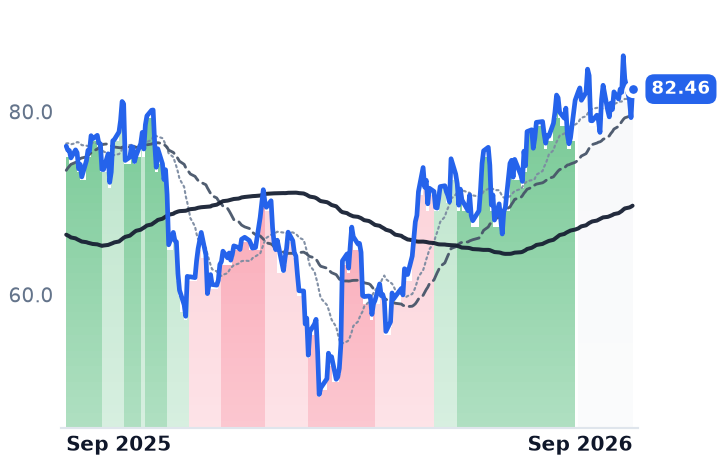
82.46
+3.11 (+3.93%)
vs. prior close
Price20d50d150d
XYZ 12-month price
Other
TickerMkt capP/EP/E fwdP/SP/S fwdP/GPP/GP fwdEV/EBITDAFCF yld
SOFI$20.0B34.5x26.0x3.9x4.3x5.1x5.6x20.4x-12.6%
PYPL$39.2B8.0x8.4x1.2x1.1x2.5x2.5x5.8x14.1%
XYZ$41.9B52.2x18.3x1.7x1.6x3.8x3.6x15.3x7.8%
KLAR
Klarna
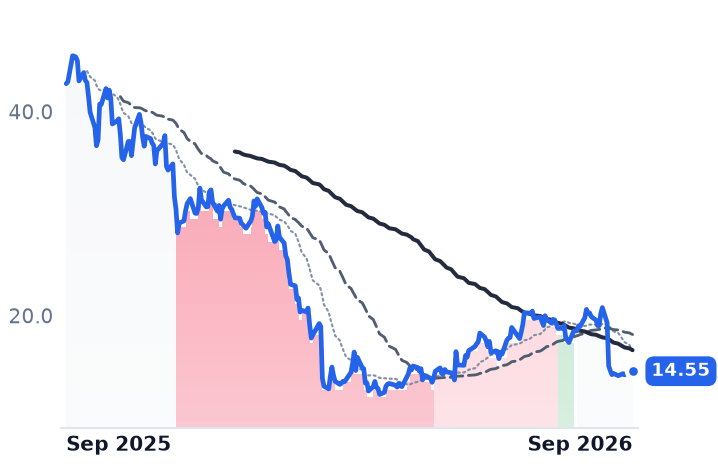
14.55
+0.16 (+1.15%)
vs. prior close
Price20d50d150d
KLAR 12-month price
Consumer Fintech & Lending
TickerMkt capP/EP/E fwdP/SP/S fwdP/GPP/GP fwdEV/EBITDAFCF yld
KLAR$5.6Bn/m70.6x1.4x1.3x3.0x2.7x3.4x-47.0%

Consensus projections

TickerFY2026EFY2027EFY2028E
AFRMRevenue+32.0%+29.9%+24.4%
EPS+2220.4%+54.7%+43.9%
UPSTRevenue+37.1%+30.9%+28.7%
EPS−58.6%+163.4%+61.8%
SCHWRevenue+11.6%+10.0%+9.3%
EPS+23.5%+17.5%+15.9%
HOODRevenue+9.9%+22.8%+15.3%
EPS−9.8%+37.0%+18.0%
NURevenue+54.4%+21.7%+14.0%
EPS+42.6%+32.7%+26.4%
BILLRevenue+13.2%+11.3%+10.5%
EPS+26.1%+41.5%+17.6%
SOFIRevenue+31.3%+22.3%+23.6%
EPS+64.3%+34.3%+26.0%
PYPLRevenue+3.2%+4.1%+4.4%
EPS−1.0%+8.6%+9.0%
XYZRevenue+7.4%+11.7%+12.2%
EPS+60.8%+29.6%+24.0%
KLARRevenue+26.1%+19.6%+18.1%
EPS−127.5%+292.7%+63.2%

Forward fiscal years only. Blank means no analyst coverage for that year.

Affirm ended its June fiscal year owing $3.3bn against loans it chose to keep — twice the funding debt it carried twelve months earlier.

Neither Affirm, which finances checkout purchases over terms of one to 48 months, nor Upstart, which runs an artificial-intelligence underwriting platform for unsecured personal, auto and home-equity loans, holds a bank charter today. Both originate through a partner bank and then decide what to do with the paper: sell it to forward-flow buyers and securitization trusts, or borrow against it and hold it. That decision — who owns the loan the morning after it is written — determines which of them a move in long-term interest rates actually touches.

It was visible on September 1, when a global bond selloff drove long-dated Treasury yields to one-year highs after oil rose on renewed strikes in the Iran conflict. The selling found the balance sheets: Affirm fell about 5% and SoFi 4% while Robinhood held steady. No credit event was involved.

Affirm is buying its growth with borrowed money, and the credit is getting better

The June quarter was the best Affirm has reported. Gross merchandise volume rose 36% to $14.1bn and revenue 33% to $1.17bn, both ahead of consensus, with GAAP operating margin of 12.6% against roughly 6.6% a year earlier. Revenue less transaction costs — the company's own gross-profit line, which captures the gain on selling loans plus servicing — grew 39% to $589m, or 4.2% of volume. Growing faster than volume means the take rate expanded. Thirty-day delinquencies on monthly installment loans came in at 2.5%, better than the 2.7%–2.8% of the previous three quarters, and that is with 44% of receivables non-prime.

The cost sits on the funding side. Loans held for investment reached $9.56bn gross from $7.03bn, with the allowance rate building about 24 basis points to 5.89%, and funding debt doubled. Chief financial officer Rob O'Hare told investors on the August 27 call that fiscal 2027 take rates should be broadly consistent with fiscal 2026, supported by current funding costs and a similar funding mix — an assumption written against a rate curve that moved this week. Through fiscal 2026 that assumption held easily: funding costs fell about 125 basis points year over year and the 2026-2 securitization was upsized to $750m and more than twice oversubscribed. Affirm guided fiscal 2027 to volume above $64bn.

Upstart did the opposite and was not paid for it

Originations grew 50% to $4.2bn and revenue 42% to $365m, with contribution profit at a record $193m. The volume came through the model, not through concessions: conversion rose to 19.7% from 18.5% and 91% of loans were fully automated. Loans on its own books were $1.06bn, up only 5%, or 5.9% of outstandings. Third parties funded the rest — $10.8bn of incremental committed capacity signed this year and a $569m securitization at the tightest spreads Upstart has seen in three years.

"We grew, our credit performed, and we expanded margins. We didn't have to trade one for another," co-founder and chief executive Paul Gu told investors on the August 4 call. The shares have been in a downtrend since July 31 and sit 59% below their 52-week high. Two disclosures explain some of it: Upstart's own macro index, a measure of how far defaults run above a static baseline, reached 1.5 — the top of the range management guided in February, implying default rates half again the long-run average — and July volume decelerated to 34% year-over-year growth from 50% in the quarter.

What the split is worth

The recovery in financial-services shares over the past three months belongs to Nu, Bill, Schwab and Robinhood, each up more than 20%; Affirm added 4% and Upstart fell 13%. Affirm's price-to-trailing-gross-profit of 8.70x is below the roughly 9.6x of mid-August, because the gross-profit base stepped up faster than the stock; its trailing price-to-earnings ratio of 13.0x is meaningless, since $1.46bn of fiscal-2026 net income was a one-off deferred-tax valuation-allowance release. Forward, Affirm trades at 6.67x gross profit and 38.6x earnings against consensus revenue growth of 30% next year. Upstart trades at 2.55x forward gross profit on similar expected growth, with 40.7x forward earnings the honest caveat.

Affirm's advance is earned by the operating record — expanding take rate, improving delinquencies, six points of margin — and its own choice has attached a rate-sensitivity to that record which did not exist when funding debt was $1.6bn. Upstart's quarter contains nothing that justifies its price; what the market is discounting is the macro index and the July slowdown, and it is discounting them against a company that has already sold the risk to somebody else.

The next reading arrives before either company reports: if long yields hold at one-year highs, the firm that kept $9.56bn of loans finds out first what that costs.

Cold Storage Is 10% Oversupplied: Americold's Storage Rate Rose and Lineage's Fell 0.7%

Hypothesis Opus 5 · Research Opus 5 · Writing Opus 5 · Prompt v1.6

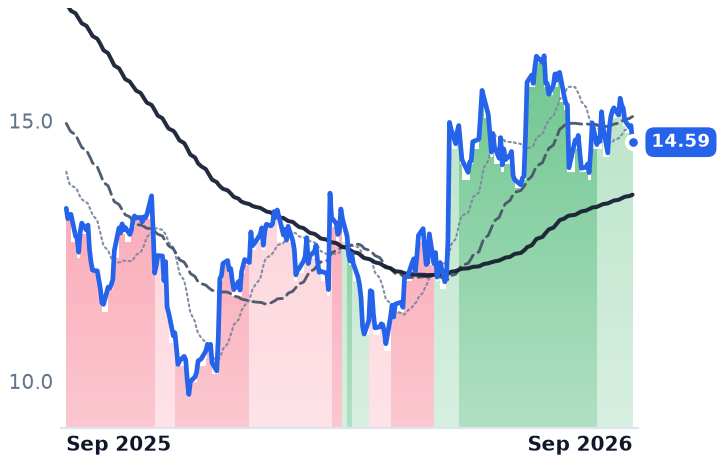
The two public cold-storage operators both reported occupancy gains in the June quarter and got opposite results underneath them. Americold's revenue grew 1.9% year over year after four straight years of annual decline, its storage rate per pallet turned positive, and it raised full-year adjusted funds from operations guidance to $1.26–$1.32 a share.

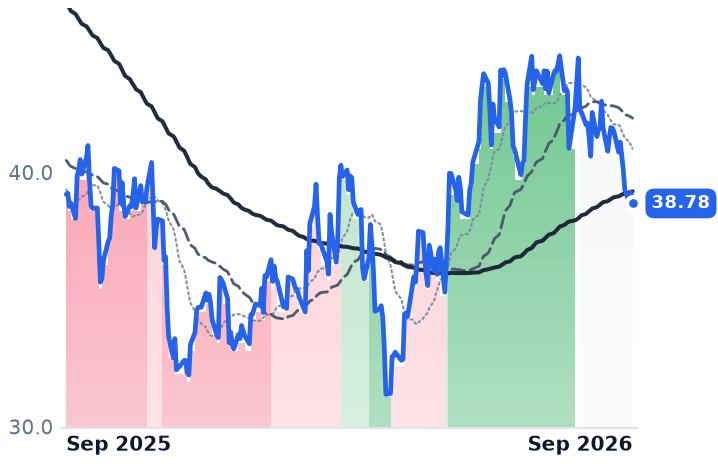
Lineage's same-store net operating income fell 2.9%, and the share of rent-and-storage revenue carrying minimum guarantees slid to 44.5% — the fixed-commitment conversion meant to underwrite the sector is running backwards at the larger operator.

The explanation is supply, not appetite for frozen food: US cold-storage capacity grew 14.5% between 2021 and 2025 against roughly a third as much demand growth. Neither company is riding a volume recovery. One is taking share; the other is losing price.

COLDLINEPLDFRTRNOPOSTGISCAGHRLIndustrial REIT OversupplyFrozen Food DemandAging Facility ObsolescenceREIT Deleveraging & JVsWarehouse Cost Programs
TickerCompanySegmentTrend · 13mo30D1Y
The subject · what this brief is about
COLDAmericold Realty TrustTemperature-Controlled Warehousing🌱 Emerging Bull+3.4%+9.5%
LINELineageTemperature-Controlled Warehousing🌱 Emerging Bull−7.4%−0.9%
Compared against · context, not the story
PLDPrologisLogistics & Distribution🟢 Cont. Bull−5.2%+25.8%
FRFirst Industrial Realty TrustLogistics & Distribution🟢 Cont. Bull−5.9%+23.3%
TRNOTerreno RealtyLogistics & Distribution🟢 Cont. Bull−8.3%+20.6%
POSTPostCereals & Breakfast🔴 Cont. Bear−6.6%−24.4%
GISGeneral MillsCereals & Breakfast🔴 Cont. Bear+12.7%−14.1%
CAGConagra BrandsFrozen & Prepared Foods🔴 Cont. Bear+8.5%−8.0%
HRLHormel FoodsMeat & Protein Processing🔴 Cont. Bear−12.6%−8.4%

12-month price & trend

COLD
Americold Realty Trust
14.59
−0.32 (−2.15%)
vs. prior close
Price20d50d150d
COLD 12-month price
Temperature-Controlled Warehousing
LINE
Lineage
38.78
−0.43 (−1.10%)
vs. prior close
Price20d50d150d
LINE 12-month price
Temperature-Controlled Warehousing
PLD
Prologis
137
−2.31 (−1.66%)
vs. prior close
Price20d50d150d
PLD 12-month price
Logistics & Distribution
TickerMkt capP/EP/E fwdP/SP/S fwdP/GPP/GP fwdEV/EBITDAFCF yld
COLD$4.2Bn/m1.6x1.7x126.3x-2.8%
LINE$8.8Bn/m1.6x1.6x15.0x14.9x12.4x2.8%
PLD$131.0B35.2x42.1x14.6x15.1x33.8x34.7x21.4x3.8%
FR
First Industrial Realty Trust
61.65
−0.53 (−0.85%)
vs. prior close
Price20d50d150d
FR 12-month price
Logistics & Distribution
TRNO
Terreno Realty
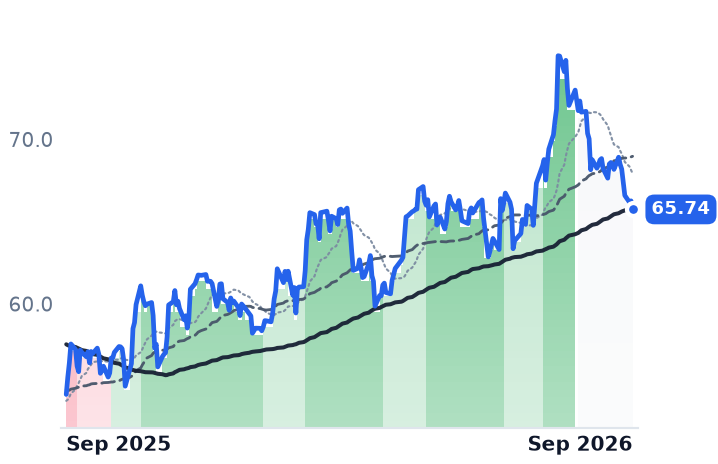
65.74
−0.52 (−0.78%)
vs. prior close
Price20d50d150d
TRNO 12-month price
Logistics & Distribution
POST
Post
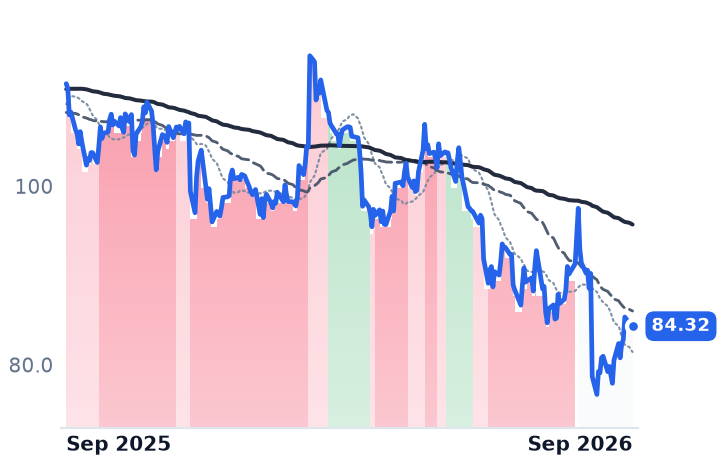
84.32
+0.13 (+0.15%)
vs. prior close
Price20d50d150d
POST 12-month price
Cereals & Breakfast
TickerMkt capP/EP/E fwdP/SP/S fwdP/GPP/GP fwdEV/EBITDAFCF yld
FR$8.1B23.5x29.1x10.8x10.7x23.0x22.7x12.2x6.0%
TRNO$6.9B16.1x43.0x14.1x13.5x22.1x21.1x13.5x2.9%
POST$4.6B14.3x13.1x0.5x0.5x2.0x2.1x8.3x15.8%
GIS
General Mills
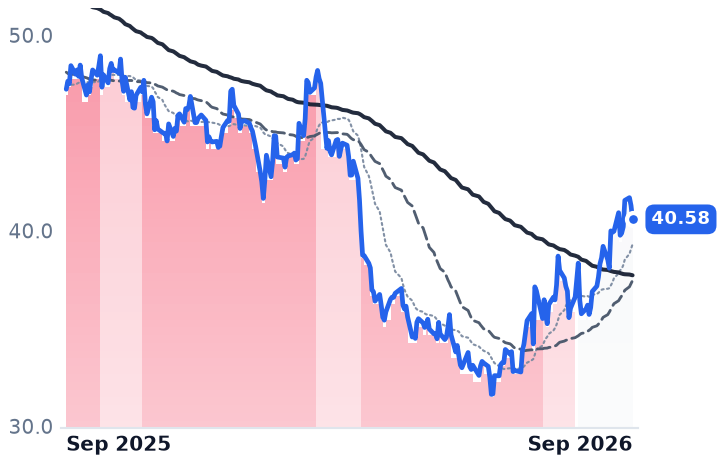
40.58
−0.71 (−1.72%)
vs. prior close
Price20d50d150d
GIS 12-month price
Cereals & Breakfast
CAG
Conagra Brands
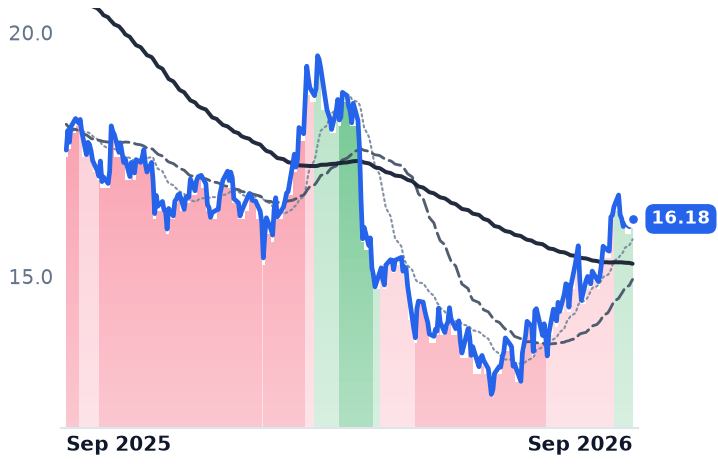
16.18
+0.07 (+0.43%)
vs. prior close
Price20d50d150d
CAG 12-month price
Frozen & Prepared Foods
HRL
Hormel Foods
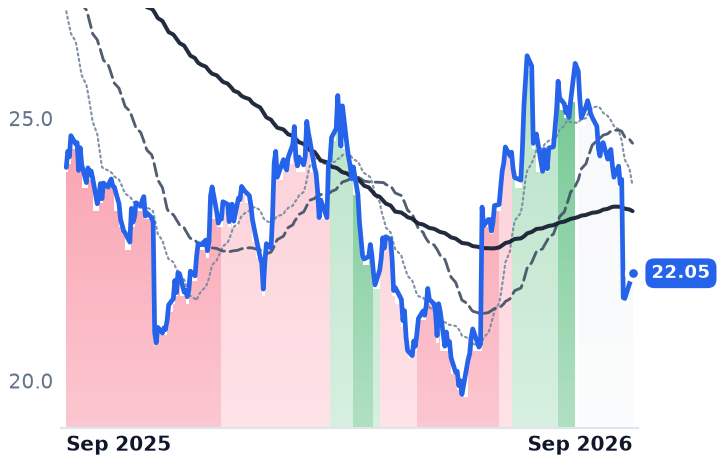
22.05
+0.12 (+0.53%)
vs. prior close
Price20d50d150d
HRL 12-month price
Meat & Protein Processing
TickerMkt capP/EP/E fwdP/SP/S fwdP/GPP/GP fwdEV/EBITDAFCF yld
GIS$17.6B8.1x9.6x1.0x1.0x2.9x2.9x10.1x9.4%
CAG$6.4Bn/m7.9x0.6x0.6x2.4x2.4x13.8x13.1%
HRL$10.9B22.2x13.5x0.9x0.9x5.8x5.7x12.6x5.3%

Consensus projections

TickerFY2026EFY2027EFY2028E
COLDRevenue−3.6%+0.7%+5.8%
EPS+5159.4%−113.5%−28.0%
LINERevenue−0.1%+2.4%+5.2%
EPS+94.2%−19.4%−31.8%
PLDRevenue+6.7%+6.3%+2.8%
EPS+21.3%+12.3%+8.1%
FRRevenue+4.4%+7.3%+7.4%
EPS+24.9%−9.8%+4.4%
TRNORevenue+8.4%+11.1%+15.8%
EPS−57.8%+2.2%+22.8%
POSTRevenue+2.2%−0.2%−0.0%
EPS+9.5%+13.5%+14.4%
GISRevenue−5.6%−2.5%+1.0%
EPS−18.2%−4.5%+4.0%
CAGRevenue−3.1%−1.3%+1.1%
EPS−26.5%−0.9%+5.0%
HRLRevenue+1.3%+1.5%+2.6%
EPS+7.4%+7.0%+5.5%

Forward fiscal years only. Blank means no analyst coverage for that year.

Americold filled more of its freezer space this June quarter than a year earlier, and it did so in a market carrying more empty cold storage than at any point in two decades. Physical occupancy at the operator — 185 refrigerated facilities renting space and selling pallet-handling labor to food producers and retailers — rose roughly 300 basis points year over year and more than 200 sequentially, which is not how the season normally runs. Revenue grew 1.9%, after four straight years of annual decline.

That is worth understanding because a cold-storage REIT is only half a landlord. Storage rent is a claim on how much frozen food customers choose to hold; the other half of revenue is labor billed on throughput. When both are shrinking, occupancy gains have to come from somewhere, and the somewhere here is a competitor's building.

The vacancy is in old buildings

US cold-storage vacancy reached 7.7% in the first half of 2026, with move-outs of about 56 million cubic feet against 41 million delivered — the first negative first-half absorption since 2007. New capacity rose 14.5% between 2021 and 2025 while demand grew about 5%, leaving the market roughly 10% oversupplied. But the emptiness is concentrated by vintage: pre-2006 buildings hold 68% of total vacancy, while facilities built between 2006 and 2019 run 3.4% vacant. Scaled operators with modern boxes are absorbing customers from capital-constrained regionals that spent two years cutting price.

Americold held its rates through that fight. Storage rate per pallet turned positive in the June quarter, handling rates rose, and churn stayed at 2.1%. "Our customers are realizing the value of that best-in-class service, and they're coming back to Americold organically and our churn rate is really low," chief executive Robert Chambers told investors on August 6. Fixed commitments are steady at 58% of revenue, though renewal terms now run 12 to 18 months against five years historically — customers are committing, over shorter windows.

The volume line has not turned: throughput pallets fell 1.0%. What carried adjusted funds from operations to $0.35 in the quarter and guidance up to $1.26–$1.32 was self-help — a completed $30m cost program that removed over 400 positions, a second phase targeting $25m more by early 2027, ten facilities exited. "We are not relying on a recovery in demand to create value," chief financial officer Christopher Papa said the same day. On August 31 the company closed a $1.3bn joint venture with EQT covering 12 facilities, freeing roughly $1.1bn to cut debt by about a quarter.

The same market, the opposite quarter

Lineage, the world's largest temperature-controlled REIT at 498 facilities and about three times Americold's cubic footage, posted its first year-over-year occupancy gain since its July 2024 listing — and same-store net operating income still fell 2.9%. Rent, storage and blast revenue per physical pallet slipped 0.7% to $67.28; throughput fell 1.8% with container volumes down 14%; and the share of rent-and-storage revenue under minimum guarantees dropped to 44.5% from a 46.7% peak. Its own raised guidance of $2.80–$3.05 came from capex management and procurement savings. Leverage sits near 6.0x against a 5.0–5.5x target, and a fire at the Big Bear facility costs $15m of second-half EBITDA. Chief executive Greg Lehmkuhl, on August 5: "We wouldn't be surprised at all, and we're certainly hearing on the street, that there'll be a couple of competitor exits in the coming quarters."

The customer evidence supports his supply logic more than any demand thesis. Frozen vegetable stocks were still down 8% year over year at the end of May, and Conagra expects fiscal-2027 volumes down mid-single digits on unusually high price elasticity in frozen.

What the shares have priced

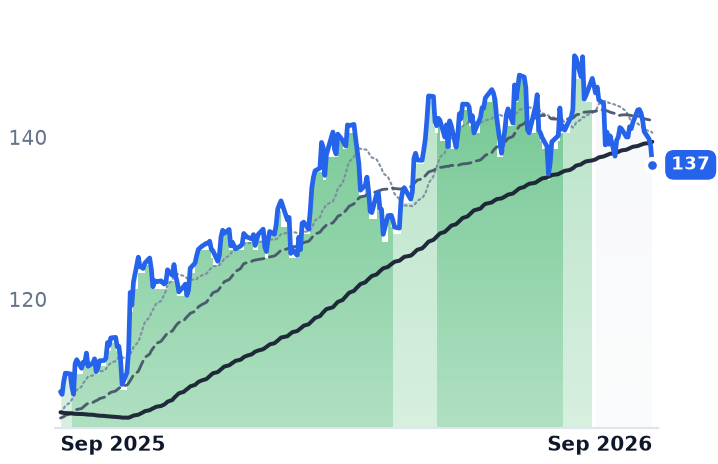
Americold has gained 11.8% over six months and trades at 11.3x the midpoint of guided AFFO, 1.73x book, with a 6.3% dividend absorbing 71% of that guidance — against average closes of $25.72 in 2024 and $16.67 in 2025, so the recovery has barely dented a two-year de-rating. Lineage is down 9.8% over three months at 13.3x guided AFFO, 12.4x trailing EBITDA and 1.12x book, about half its $78 IPO price; JPMorgan rates it Underweight. Over twelve months, while Prologis rose about 25%, neither operator participated in the industrial REIT rally.

The verdict is that the price gap between them is earned, and the reason it is earned is narrower than it looks. Americold's inflection is real but rests on rate discipline and cost removal, not on more food moving — its throughput is still shrinking, and consensus still models FY2026 revenue down 3.6%. Lineage's discount rests on a committed-revenue share going the wrong way while it carries the sector's heaviest balance sheet. Neither is a bet on frozen-food demand; both are bets on which operator absorbs the regionals that leave.

If Lehmkuhl is right that competitors exit in the coming quarters, the 68% of vacancy sitting in pre-2006 warehouses is the inventory that has to disappear before either operator gets pricing power back rather than just share.

Digital Realty's Newest Hyperscale Data Centers Sit in a Fund It Owns a Fifth Of

Hypothesis Opus 5 · Research Opus 5 · Writing Opus 5 · Prompt v1.6

Digital Realty is building at the widest development spread in its recent history — a 1.4 gigawatt pipeline underwritten to an 11.5% stabilized yield against a 5.28% 30-year Treasury — yet the shares have slipped over three months while revenue grew 28.9% and backlog hit a record. The build economics are not thinning.

What is changing is ownership. The company keeps a 20% interest in the portfolio of its $3.25bn hyperscale fund while managing it for fees, and booked $188m of promote income last quarter that it excluded from guidance. Equinix is funding a doubled capital plan with debt and retained cash, diluting holders by only 1.1% against Digital Realty's 4.6%.

The twelve-month gains are earned by leasing; the recent slide looks like a discount-rate reset, not a demand one.

DLREQIXIRMNXT.AXAMTCCIVNETMSFTAMZNGOOGLMETAHyperscale Data Center BuildCapital Recycling & JVsColocation & InterconnectionLong-Rate RepricingAI Capacity Leasing
TickerCompanySegmentTrend · 13mo30D1Y
The subject · what this brief is about
DLRDigital Realty TrustData Center & Colocation🟢 Cont. Bull−2.2%+14.4%
EQIXEquinixData Center & Colocation🟢 Cont. Bull+1.1%+33.6%
Compared against · context, not the story
IRMIron Mountain IncorporatedRecords & Information Management🟢 Cont. Bull−5.5%+31.0%
NXT.AXNEXTDCInformation Technology Services🌱 Emerging Bull−1.9%−20.1%
AMTAmerican TowerWireless & Fiber Infrastructure🔴 Cont. Bear+0.9%−9.9%
CCICrown CastleWireless & Fiber Infrastructure🔴 Cont. Bear−1.6%−20.0%
VNETVNETData Center & Cloud Infrastructure⚠️ Emerging Bear−10.1%−22.8%
MSFTMicrosoftCloud Infrastructure & Platforms🔴 Cont. Bear+2.5%−0.7%
AMZNAmazon.comOnline Marketplaces🟢 Cont. Bull−10.3%+13.0%
GOOGLAlphabetSearch & Advertising🟢 Cont. Bull−10.2%+58.7%
METAMeta PlatformsSocial Media & Messaging🔴 Cont. Bear−1.7%−20.9%

12-month price & trend

DLR
Digital Realty Trust
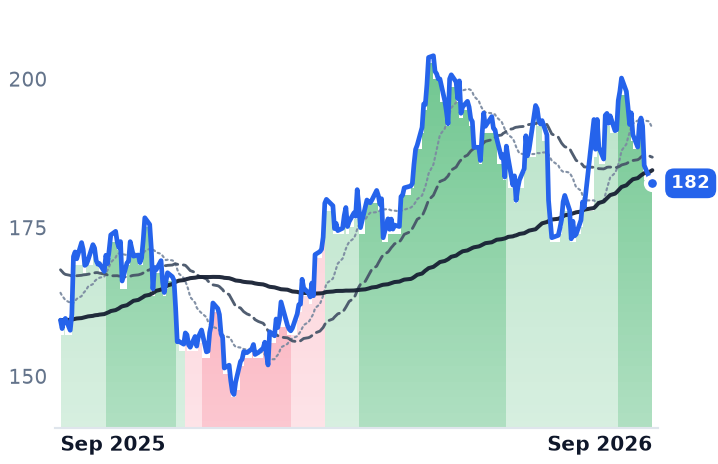
182
−0.30 (−0.16%)
vs. prior close
Price20d50d150d
DLR 12-month price
Data Center & Colocation
EQIX
Equinix
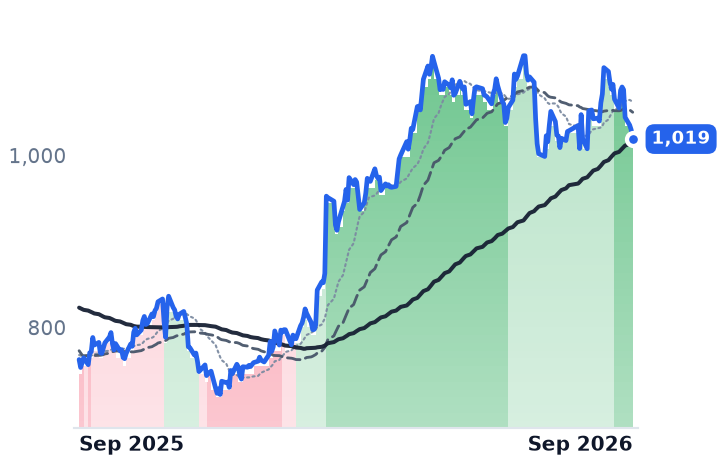
1,019
−10.81 (−1.05%)
vs. prior close
Price20d50d150d
EQIX 12-month price
Data Center & Colocation
IRM
Iron Mountain Incorporated
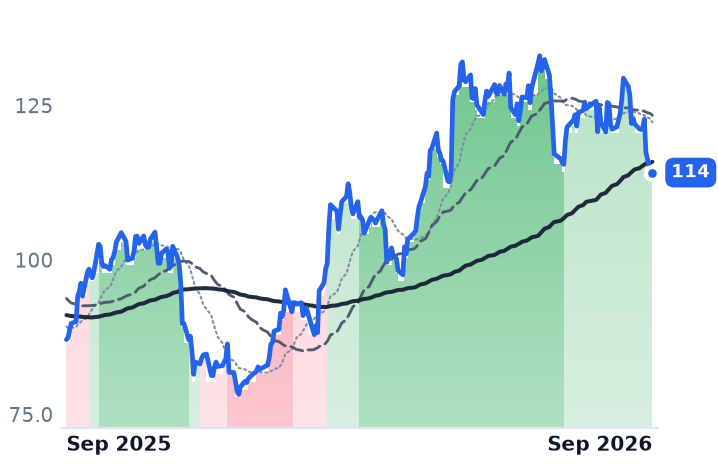
114
+0.03 (+0.03%)
vs. prior close
Price20d50d150d
IRM 12-month price
Records & Information Management
TickerMkt capP/EP/E fwdP/SP/S fwdP/GPP/GP fwdEV/EBITDAFCF yld
DLR$67.5B84.1x67.4x9.9x9.5x71.6x69.2x24.6x2.0%
EQIX$100.6B65.3x59.1x10.2x9.8x19.8x19.0x27.4x1.4%
IRM$33.4B80.3x45.3x4.4x4.2x8.2x7.7x21.1x-1.4%
NXT.AX
NEXTDC
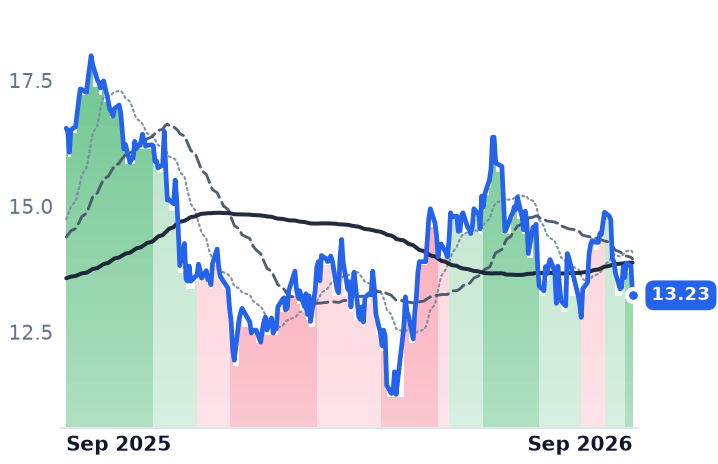
13.23
−0.58 (−4.20%)
vs. prior close
Price20d50d150d
NXT.AX 12-month price
Information Technology Services
AMT
American Tower
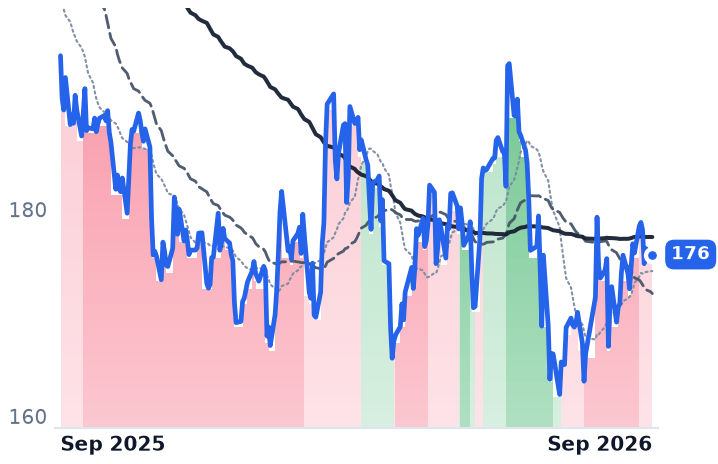
176
+0.04 (+0.02%)
vs. prior close
Price20d50d150d
AMT 12-month price
Wireless & Fiber Infrastructure
CCI
Crown Castle
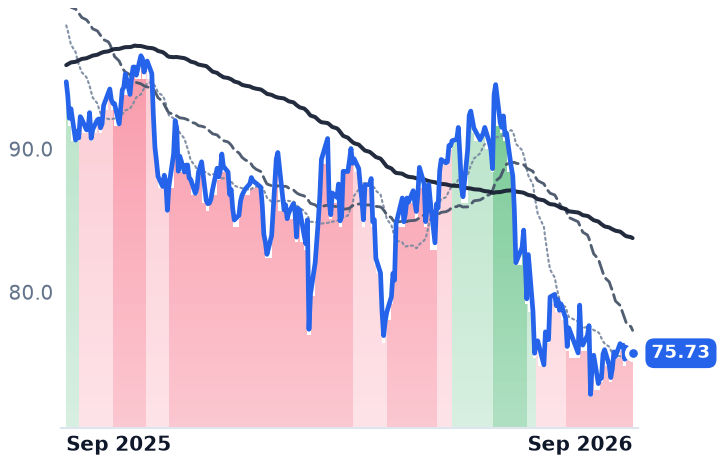
75.73
−0.19 (−0.25%)
vs. prior close
Price20d50d150d
CCI 12-month price
Wireless & Fiber Infrastructure
TickerMkt capP/EP/E fwdP/SP/S fwdP/GPP/GP fwdEV/EBITDAFCF yld
NXT.AX$10.2Bn/m22.6x14.0x730.6x453.6x57.5x-16.2%
AMT$80.4B23.7x25.1x7.3x7.3x10.0x10.0x17.6x4.9%
CCI$33.0B30.6x39.3x7.9x8.2x12.5x12.9x20.4x7.3%
VNET
VNET
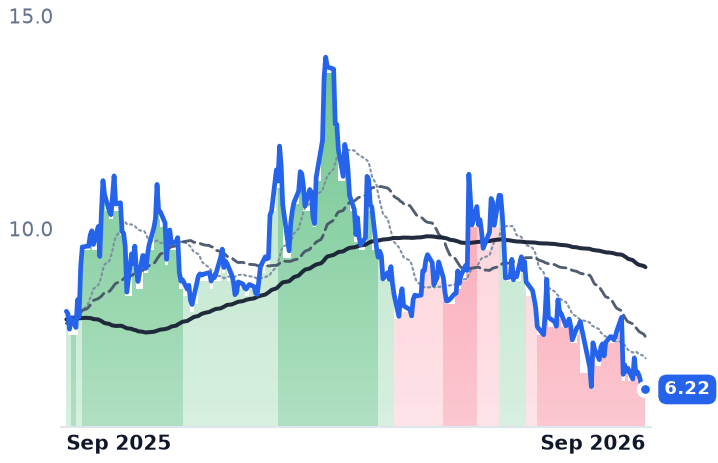
6.22
+0.10 (+1.63%)
vs. prior close
Price20d50d150d
VNET 12-month price
Data Center & Cloud Infrastructure
MSFT
Microsoft
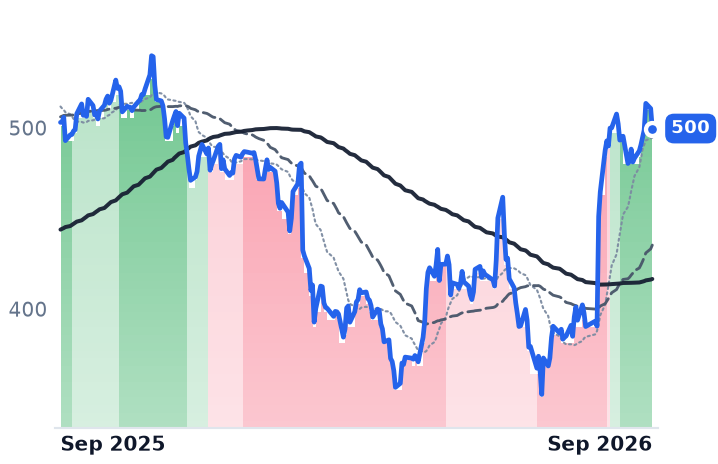
500
−11.05 (−2.16%)
vs. prior close
Price20d50d150d
MSFT 12-month price
Cloud Infrastructure & Platforms
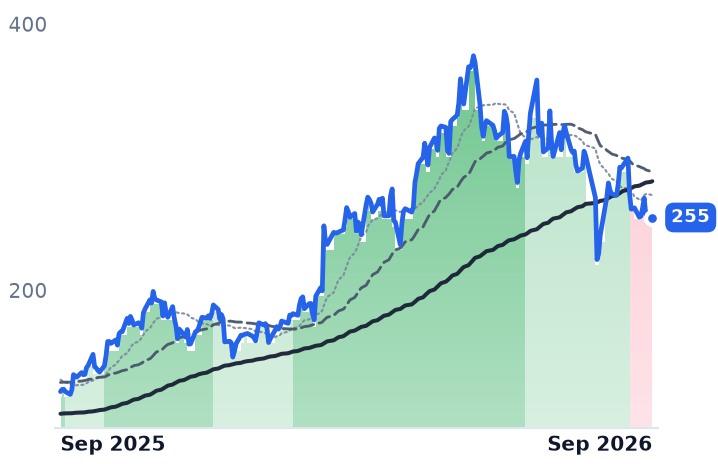
AMZN
Amazon.com
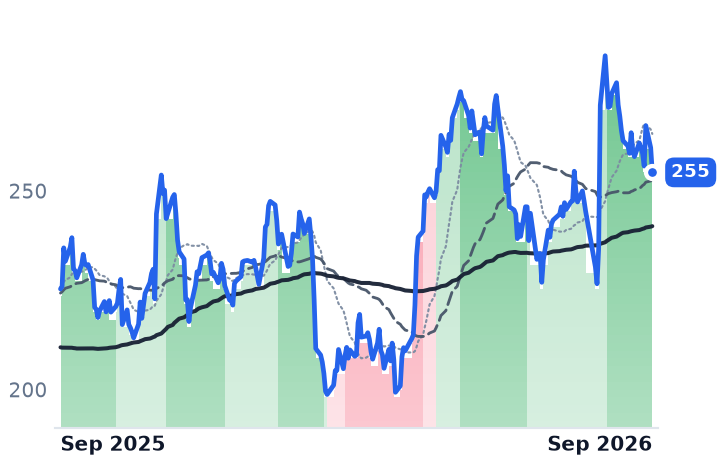
255
−6.22 (−2.38%)
vs. prior close
Price20d50d150d
AMZN 12-month price
Online Marketplaces
TickerMkt capP/EP/E fwdP/SP/S fwdP/GPP/GP fwdEV/EBITDAFCF yld
VNET$1.9Bn/m1.2x5.8x9.7x-58.1%
MSFT$3.8T28.6x26.1x11.5x9.8x17.0x14.4x19.0x1.7%
AMZN$2.9T21.2x21.1x3.7x3.5x7.3x6.8x11.9x-0.4%
GOOGL
Alphabet
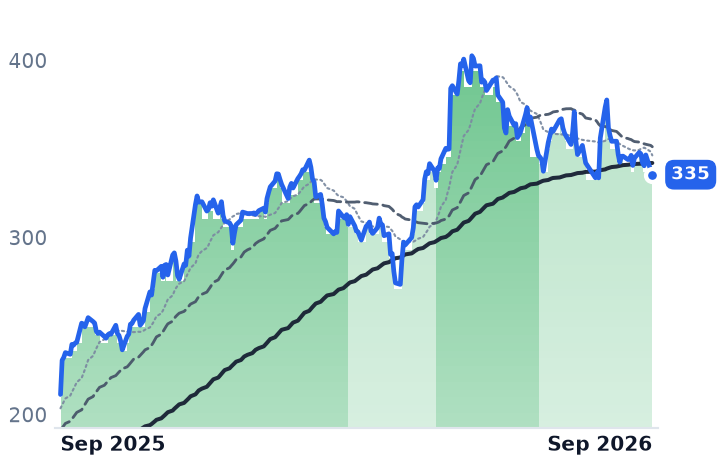
335
−2.57 (−0.76%)
vs. prior close
Price20d50d150d
GOOGL 12-month price
Search & Advertising
META
Meta Platforms
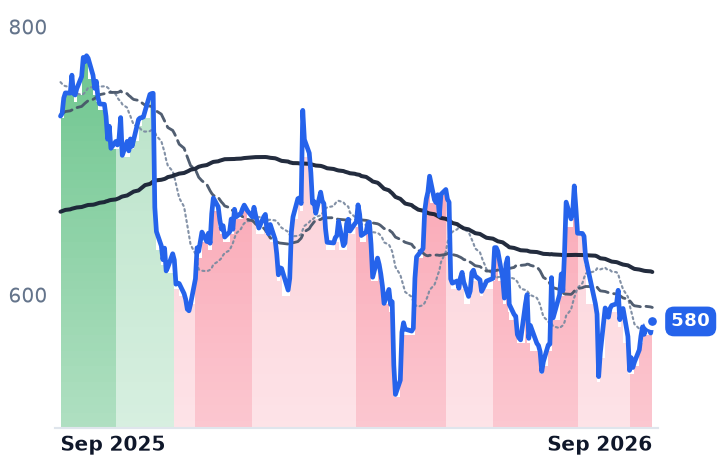
580
+8.64 (+1.51%)
vs. prior close
Price20d50d150d
META 12-month price
Social Media & Messaging
TickerMkt capP/EP/E fwdP/SP/S fwdP/GPP/GP fwdEV/EBITDAFCF yld
GOOGL$4.2T17.3x17.0x9.5x8.5x15.6x13.9x13.1x1.3%
META$1.5T21.5x18.2x6.5x5.8x7.9x7.1x14.7x2.8%

Consensus projections

TickerFY2026EFY2027EFY2028E
DLRRevenue+17.0%+11.1%+14.1%
EPS−26.0%−4.6%+23.9%
EQIXRevenue+11.0%+10.6%+11.4%
EPS+16.8%+9.3%+10.4%
IRMRevenue+16.8%+8.7%+7.6%
EPS+23.9%+10.0%+11.2%
NXT.AXRevenue+13.5%+49.6%+51.1%
EPS+111.5%+95.8%+22.2%
AMTRevenue+4.0%+3.3%+5.9%
EPS+34.5%+1.4%+10.5%
CCIRevenue−5.0%+1.3%+2.3%
EPS+106.7%+47.3%+4.8%
VNETRevenue+20.5%+22.0%+20.8%
EPS−32.3%−239.3%+74.3%
MSFTRevenue+18.0%+18.6%+19.5%
EPS+26.7%+16.0%+19.0%
AMZNRevenue+15.9%+14.6%+16.0%
EPS+76.8%−16.1%+30.8%
GOOGLRevenue+24.3%+22.9%+19.1%
EPS+93.4%−26.6%+18.2%
METARevenue+27.3%+20.1%+17.8%
EPS+38.3%+6.9%+15.4%

Forward fiscal years only. Blank means no analyst coverage for that year.

Digital Realty doubled its construction pipeline in the first half of 2026, to 1.4 gigawatts under way at a cost of $20bn, and the returns underwritten on that concrete are wide. The pipeline was 63% pre-leased at an 11.5% average expected stabilized yield pro forma for July hyperscale leases. What has changed is not the yield. It is who ends up owning the buildings.

The wholesale landlord — 309 data centers, roughly 3.0 gigawatts of installed capacity, renting halls to cloud and enterprise tenants — retains only a 20% ownership interest in the portfolio of its $3.25bn U.S. Hyperscale Data Center Fund while serving as manager for leasing, development, asset management and financing. That fund supports more than $10bn of new hyperscale investment. The majority of the rent from that capacity will accrue to limited partners; Digital Realty keeps a fifth of it plus fees, which now run at roughly $45m a quarter and which management expects to convert to operating fees as the assets stabilize. The question for the next several years is whether the AI landlord's return arrives as rent or as fee income, because the two are not valued alike.

The spread is not the problem

An 11.5% expected stabilized yield sits about 620 basis points above the 30-year Treasury yield of 5.28% on September 1, which touched a 19-year high in August. Investment-grade data center debt costs far less than the long bond implies for these two: Equinix closed $700m of notes due 2031 at a 4.400% coupon and $800m due 2033 at 4.700% in March. Development spreads of that width are the opposite of a squeeze.

The leasing behind it is compounding. Second-quarter revenue rose 28.9% to $1.924bn. Signed-but-not-commenced backlog reached a record $1.9bn of annualized rent at full share, of which $635m begins flowing in the second half of this year. Renewals split hard by product: leases above one megawatt repriced 66.7% higher on cash rents, while the 0-1 megawatt colocation band managed 5.2% — the scarcity is in large blocks of powered capacity, not in cabinets. Same-capital cash net operating income grew 8.9%, and full-year core funds from operations guidance was raised to $8.15-$8.20 a share. "Digital Realty delivered record Core FFO per share in the quarter, reflecting robust customer demand and strong execution across our core pillars of growth," chief executive Andy Power said on July 23.

Fees, promotes and a buy-back-in

The quarter also carried $188m of net promote income — about $0.52 a share — from developing and leasing three data centers inside a development joint venture. Management excluded it from guidance, which is the correct signal about its durability. Meanwhile the capital flowed the other way too: at the end of June the company bought Blackstone's blended 64% interest in three fully leased Northern Virginia data centers totaling 288 megawatts, valued at $7.8bn gross, for $3.5bn in cash and stock. Diluted shares are up 4.6% year over year.

Equinix, which rents interconnection-rich cabinet space rather than wholesale halls, is running the same build on different money. Its stabilized estate — 194 of 282 sites — earned a 27% cash-on-cash yield last year, and management guides new capital to a mid-20s percent stabilized return three to four years after buildings open: two points of compression, not a collapse. Capital spending is doubling to $5-6bn this year, funded with debt and retained cash flow; diluted share count rose 1.1%. Adjusted funds from operations per share grew 18% and churn fell to 1.8%.

What the shares have done

Over twelve months Equinix is up 32.1% and Digital Realty 12.0%, both holding uptrends with their 50-day averages above their 200-day. Over three months both have slipped — Equinix 4.9%, Digital Realty 2.6% — into accelerating numbers. Bank of America cut Digital Realty to neutral in January, trimming its target to $170 from $210 on a lower multiple while expecting listed data centers to stay out of favor despite positive leasing spreads.

The verdict the numbers support: the twelve-month gains are earned by leasing, and the recent softness is a discount rate being applied to very long-duration rent, not evidence of a demand problem. Equinix trades at roughly 23.7x guided 2026 cash earnings of $42.69-$43.29 a share, below the 25-30x forward multiple it historically commanded; Digital Realty at about 22.3x guided core FFO, the low end of its own 22-25x range, with enterprise value at 24.6 times trailing EBITDA. Its reported gross margin is distorted by a presentation change and should be ignored.

The durable risk is not the spread on new construction. It is that the best new gigawatts increasingly land in vehicles where the landlord collects a fifth of the rent and a management fee, and where the upside arrives as promote income that management itself refuses to put in guidance. The $635m of signed rent scheduled to commence this half will show which line it lands on.

Tariff Refunds Added 15.6 Points to Enphase's 60% Gross Margin in the June Quarter

Hypothesis Opus 5 · Research Opus 5 · Writing Opus 5 · Prompt v1.6

Enphase reported its fattest gross margin in years on a business that shrank for the third quarter running, and almost none of the improvement came from selling more hardware. A $45.4m refund of tariffs the company had paid supplied 15.6 percentage points of the 60% reported figure, which is why the September quarter is guided down to 42–45%. Underneath sit Section 45X manufacturing credits — $85.2m generated on $574.8m of first-half revenue — that Enphase converts to cash at a discount, costing 6.7 points of margin in one quarter alone.

The demand story is no longer about homeowners. With the 30% residential credit expired, roughly 69% of 2026 US installations are expected to be third-party owned, so the marginal buyer is a tax-equity fund waiting on Treasury rules. SolarEdge, growing revenue 20% year on year, is caught in the same gate.

ENPHSEDGRUNFSLRNXTARRYSHLSCSIQTSLAResidential Solar InvertersClean Energy Tax CreditsTax-Equity FinancingThird-Party Ownership ModelsSolar Tariff CostsEuropean Home Storage
TickerCompanySegmentTrend · 13mo30D1Y
The subject · what this brief is about
ENPHEnphase EnergyInverters & Power Electronics🔴 Cont. Bear−10.9%−5.2%
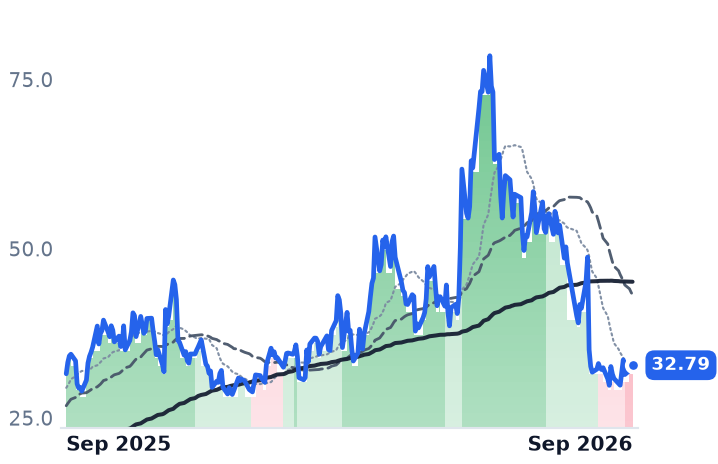
SEDGSolarEdge TechnologiesInverters & Power Electronics🟢 Cont. Bull−27.3%+4.0%
Compared against · context, not the story
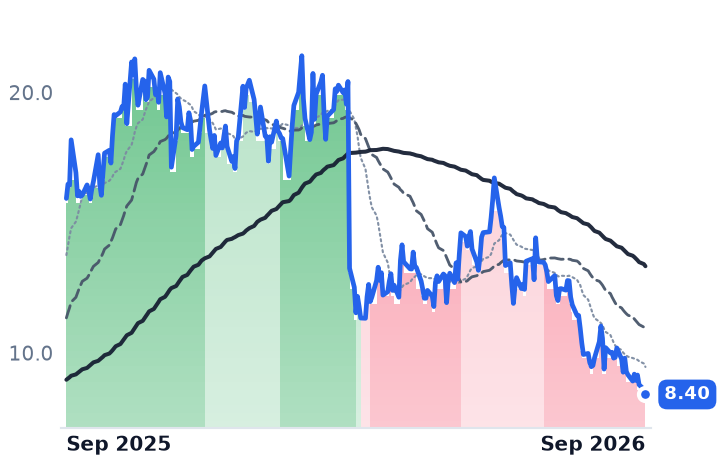
RUNSunrunResidential Solar Installers⚠️ Emerging Bear−19.4%−47.2%
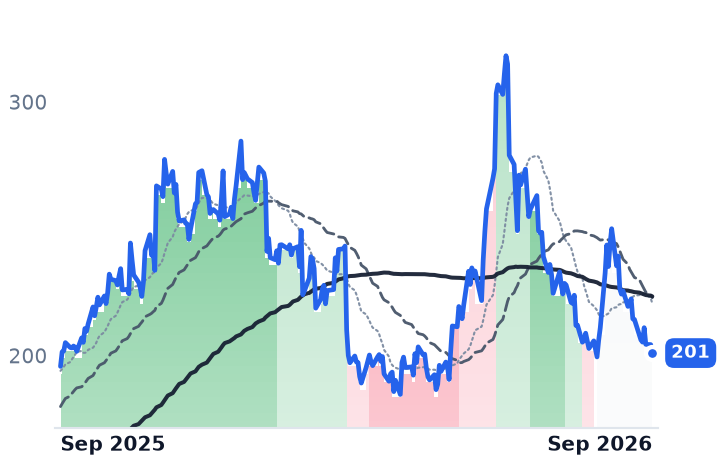
FSLRFirst SolarSolar Module Manufacturers🟢 Cont. Bull−13.6%+2.7%
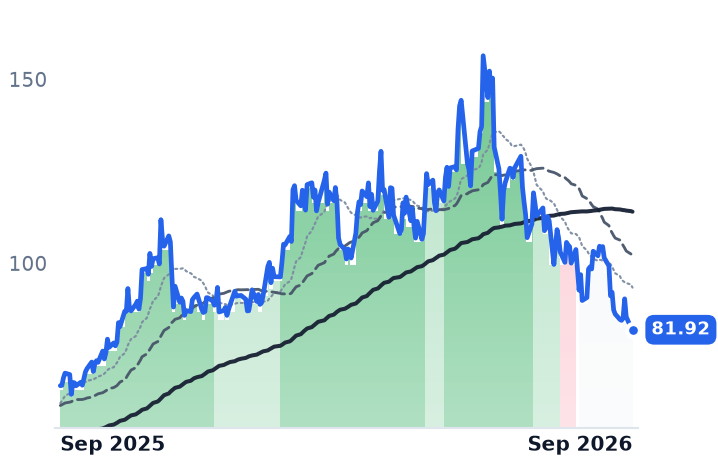
NXTNextpowerOther🟢 Cont. Bull−9.7%+22.8%
ARRYArray TechnologiesSolar Tracking Systems⚠️ Emerging Bear−21.9%−51.6%
SHLSShoals TechnologiesSolar System Components🟢 Cont. Bull−27.5%+1.1%
CSIQCanadian SolarSolar Module Manufacturers⚠️ Emerging Bear−17.7%+27.8%
TSLATeslaEV Startups & Luxury⚠️ Emerging Bear+10.8%+8.3%

12-month price & trend

ENPH
Enphase Energy
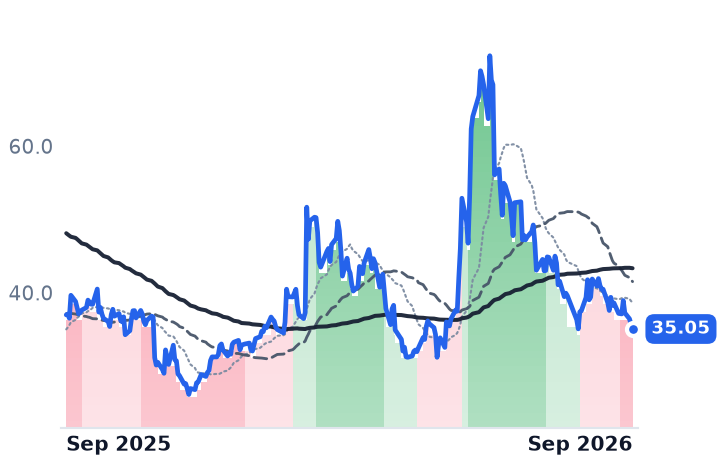
35.05
−0.66 (−1.85%)
vs. prior close
Price20d50d150d
ENPH 12-month price
Inverters & Power Electronics
SEDG
SolarEdge Technologies
32.79
+0.20 (+0.61%)
vs. prior close
Price20d50d150d
SEDG 12-month price
Inverters & Power Electronics
RUN
Sunrun
8.40
−0.20 (−2.32%)
vs. prior close
Price20d50d150d
RUN 12-month price
Residential Solar Installers
TickerMkt capP/EP/E fwdP/SP/S fwdP/GPP/GP fwdEV/EBITDAFCF yld
ENPH$4.6B34.3x17.5x3.5x3.9x7.4x8.3x26.5x3.3%
SEDG$2.0Bn/m1.5x1.5x6.8x6.8xn/m4.5%
RUN$2.3B4.0x8.1x0.7x0.8x2.4x2.5x22.0x-32.1%
FSLR
First Solar
201
−3.34 (−1.63%)
vs. prior close
Price20d50d150d
FSLR 12-month price
Solar Module Manufacturers
NXT
Nextpower
81.92
−0.61 (−0.74%)
vs. prior close
Price20d50d150d
NXT 12-month price
Other
ARRY
Array Technologies
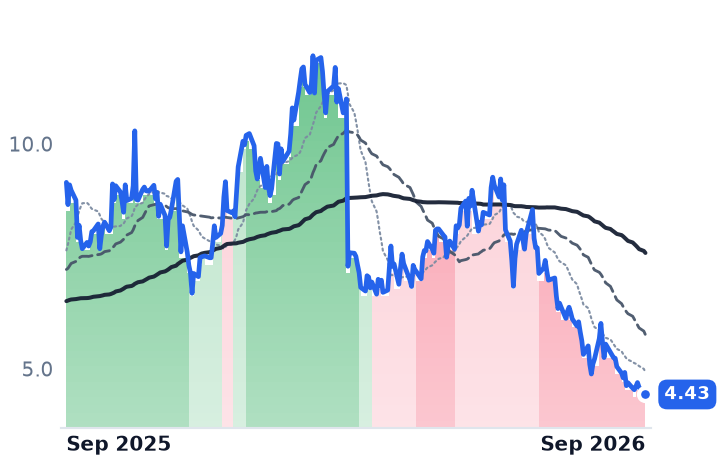
4.43
+0.00 (+0.00%)
vs. prior close
Price20d50d150d
ARRY 12-month price
Solar Tracking Systems
TickerMkt capP/EP/E fwdP/SP/S fwdP/GPP/GP fwdEV/EBITDAFCF yld
FSLR$22.7B13.0x11.9x4.2x4.5x9.6x10.2x8.6x5.1%
NXT$14.9B24.7x21.2x4.1x3.5x12.3x10.4x18.3x3.7%
ARRY$807.6Mn/m7.2x0.7x0.6x2.8x2.3x301.0x12.1%
SHLS
Shoals Technologies
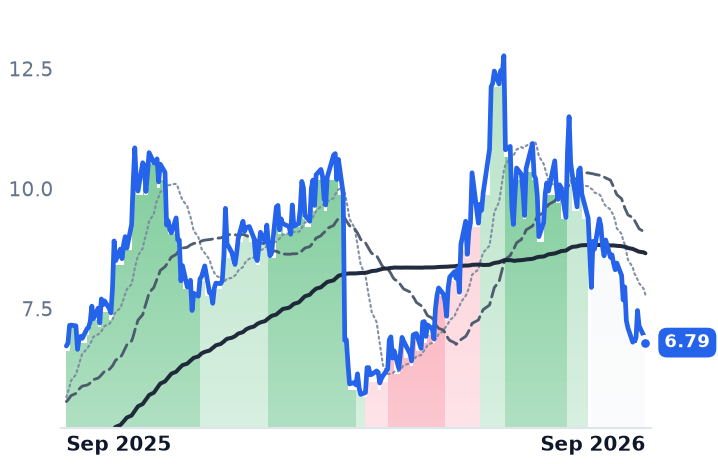
6.79
−0.14 (−2.01%)
vs. prior close
Price20d50d150d
SHLS 12-month price
Solar System Components
CSIQ
Canadian Solar
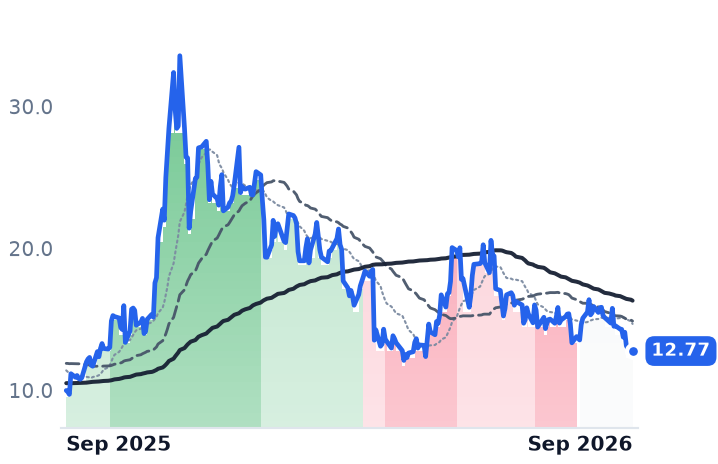
12.77
+0.19 (+1.51%)
vs. prior close
Price20d50d150d
CSIQ 12-month price
Solar Module Manufacturers
TSLA
Tesla
357
−7.80 (−2.14%)
vs. prior close
Price20d50d150d
TSLA 12-month price
EV Startups & Luxury
TickerMkt capP/EP/E fwdP/SP/S fwdP/GPP/GP fwdEV/EBITDAFCF yld
SHLS$1.4B45.8x21.0x2.5x2.3x7.7x7.2x23.5x-3.6%
CSIQ$1.2Bn/m0.2x0.2x1.2x1.1x24.7x-136.5%
TSLA$1.4T290.1x202.4x13.0x12.7x69.2x67.6x111.9x0.4%

Consensus projections

TickerFY2026EFY2027EFY2028E
ENPHRevenue−19.1%+6.2%+10.8%
EPS−28.8%+11.5%+16.5%
SEDGRevenue+12.0%+11.1%+11.4%
EPS−86.2%−370.0%+91.7%
RUNRevenue+26.6%+7.7%+13.7%
EPS−11.7%−61.6%+54.2%
FSLRRevenue−1.1%+17.0%+11.0%
EPS+21.1%+34.6%+22.8%
NXTRevenue+22.3%+22.3%+18.0%
EPS+13.8%+6.1%+21.9%
ARRYRevenue+14.9%+9.8%+5.6%
EPS+9.8%+23.8%+13.9%
SHLSRevenue+32.7%+9.1%+11.0%
EPS+5.1%+27.4%+16.3%
CSIQRevenue+9.9%+17.4%+6.5%
EPS−38.6%−236.1%+107.9%
TSLARevenue+11.8%+13.1%+18.0%
EPS+2.2%+32.7%+39.2%

Forward fiscal years only. Blank means no analyst coverage for that year.

Enphase Energy, which makes the semiconductor microinverters bolted under individual solar panels on American and European roofs, reported a gross margin of 60% for the June quarter — and revenue that fell for the third quarter running, to $291.9m, down about a fifth from a year earlier. The margin was the best in years. Almost none of it came from selling more hardware.

What it came from is two federal line items and a refund. That matters beyond one print, because it means the earnings line investors are marking is only loosely a signal about how many roofs got a system this quarter — and the thing that actually governs how many roofs do is now a tax-equity market waiting on rules Washington has not written.

The margin, taken apart

Enphase disclosed that $45.4m of refunded tariffs added 15.6 percentage points to the reported figure; non-GAAP gross margin was 46.8%, and the company guided the September quarter to 42–45% precisely because the refund does not repeat. Beneath that sits Section 45X, the domestic-manufacturing production credit, booked inside gross margin: $85.2m of it was generated on first-half shipments against $574.8m of first-half revenue, worth roughly fifteen further points by that arithmetic. Turning credits into cash costs money — Enphase sold $235.0m of them in the March quarter at 93% of face, and the discount and fees took 6.7 points off GAAP gross margin outright. It has since agreed to sell up to $150m more for no more than $139.5m. The credit itself pays full value only on components sold before 2030, stepping to 75% in 2030, with foreign-entity content restrictions layering on from 2026.

The demand, taken apart

US sell-through fell 34% year on year. Strip out safe-harbor shipments — $84.3m in June against $34.5m in March — and core revenue fell from roughly $248m to roughly $208m sequentially. Enphase guided September revenue to $290–320m while expecting global sell-through up 10%, deliberately under-shipping distributors by about $15m on distributor caution: units improving, sell-in held below them. Europe is the offset, sell-through up 30%, with Dutch battery activations more than doubling ahead of net metering's expiry. "We are not stopping and waiting. We are not waiting for things to improve. We are taking matters into our own hands," chief executive Badri Kothandaraman told investors on the July 28 call.

He has to. The 30% homeowner credit under Section 25D expired on 31 December 2025, while the commercial credit survives for company-owned systems — so roughly 69% of 2026 US residential installations are projected to be third-party owned, and the binding constraint moved from homeowner appetite to tax-equity supply. Those funds are waiting on Treasury's foreign-entity guidance, which Enphase does not expect before the first half of 2027. Freedom Forever, the second-largest US installer, filed for bankruptcy in April with $500m–$1bn of liabilities. And the old duopoly has cracked: Tesla took 29.6% of the US residential inverter market in 2025 against Enphase's 31.7%.

The other one is growing

SolarEdge, which sells string inverters paired with per-panel optimizers, is on the opposite side of the operating line: June-quarter revenue of $346.2m, up 19.6%, gross margin from 11.1% to 27.5%, European revenue more than doubled. "We returned to non-GAAP operating profitability for the first time since the second quarter of 2023, while continuing to generate positive free cash flow," chief executive Shuki Nir said on 5 August. Free cash flow was $3.1m — real, and under 1% of sales. The shares fell 28% that session on a September guide of $310–340m against consensus near $370m, blamed on the same tax-equity freeze.

Both stocks peaked on 2 June and have roughly halved, alongside First Solar down 35% and Nextracker down 46% — an unwinding of the May melt-up on data-center solid-state transformers, a product both companies place in 2028 revenue. Since mid-August they have parted: SolarEdge up 10% off its low, Enphase down a further 9%.

The split is visible in the multiples. Enphase trades at 7.42x trailing gross profit and 8.32x forward — forward above trailing, which happens only when consensus models the denominator shrinking, and it does: revenue down 19.1% this year to $1.19bn. That de-rating from 14.55x in mid-May is earned. SolarEdge, at 6.75x trailing and 6.82x forward against 16.09x in May, is being priced as though it shares Enphase's contraction, which its own numbers contradict; the honest caveat is that its guide is a genuine cut and there is no forward earnings anchor, consensus putting 2026 at a loss of $0.35 a share.

What neither company can fix is the gate. Homeowners did not stop wanting solar; the credit that paid for a third of it moved to institutions, and those institutions cannot underwrite until Treasury defines whose parts they may buy. Until then the demand line is a legal question, not a commercial one.

Liberty Energy Committed to 3 Gigawatts of Turbines and Turned Free Cash Flow Negative

Hypothesis Opus 5 · Research Opus 5 · Writing Opus 5 · Prompt v1.6

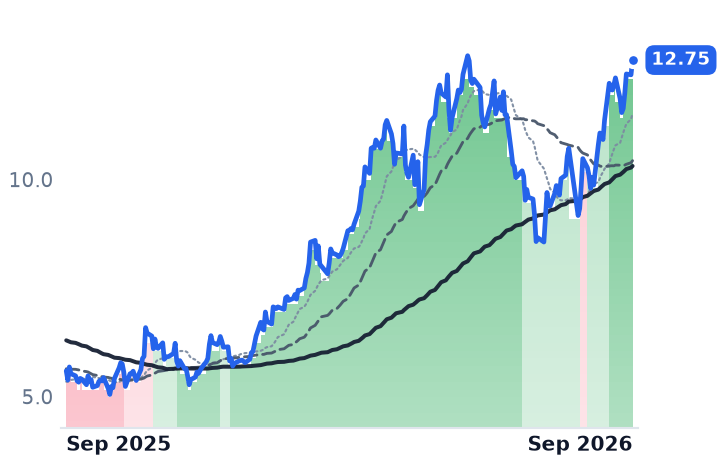
Two of the five North American frac contractors have poured capital into gas-fired power for data centers, and both have lost roughly a third of their value since late April, while the three peers without a power venture held or gained. Liberty Energy's pumping business improved — second-quarter revenue rose 14% and gross margin went from 9.7% to 17.5% — yet operating income fell 70%, trailing free cash flow is negative, and this year's capital budget runs to about 2.5 times the EBITDA analysts expect, against no signed customer lease at its Texas campus. ProPetro is the counter-case: 350 megawatts under contract and a live hyperscaler site already earning, but it still trades above Liberty and Patterson-UTI on earnings with revenue falling. The twelve-month re-rating in this group belongs to completions pricing rather than to power.

LBRTPUMPPTENRESACDCPressure Pumping & FracAI Data-Center PowerGas Turbine ShortageBehind-The-Meter GenerationCapital IntensityPermian Completions Pricing
TickerCompanySegmentTrend · 13mo30D1Y
The subject · what this brief is about
LBRTLiberty EnergyWell Services & Stimulation⚠️ Emerging Bear+5.9%+84.9%
PUMPProPetroWell Services & Stimulation⚠️ Emerging Bear+1.7%+126.5%
Compared against · context, not the story
PTENPatterson-UTI EnergyOnshore Land Drilling🟢 Cont. Bull+24.1%+127.9%
RESRPCWell Services & Stimulation⚠️ Emerging Bear+13.4%+38.7%
ACDCProFracWell Services & Stimulation🔴 Cont. Bear+22.9%+28.5%

12-month price & trend

LBRT
Liberty Energy
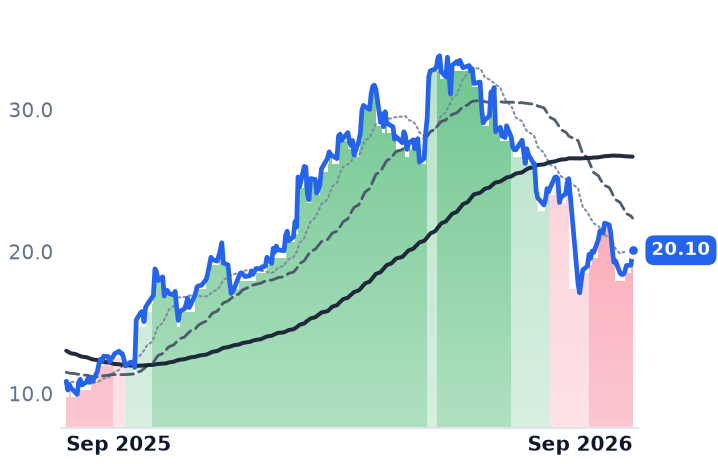
20.10
+1.05 (+5.51%)
vs. prior close
Price20d50d150d
LBRT 12-month price
Well Services & Stimulation
PUMP
ProPetro
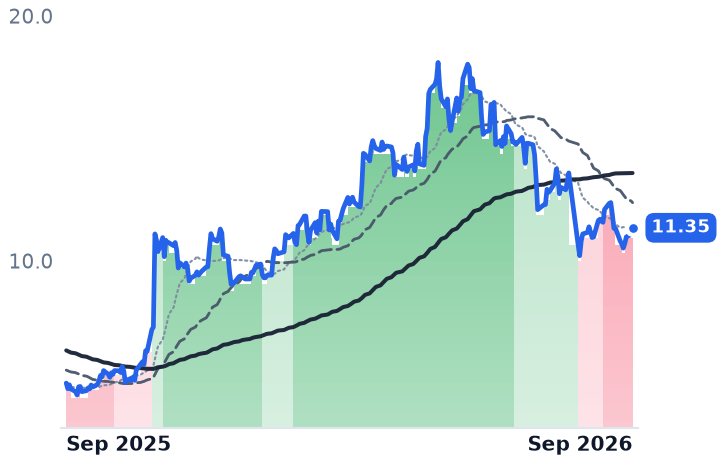
11.35
+0.28 (+2.48%)
vs. prior close
Price20d50d150d
PUMP 12-month price
Well Services & Stimulation
PTEN
Patterson-UTI Energy
12.75
+0.34 (+2.73%)
vs. prior close
Price20d50d150d
PTEN 12-month price
Onshore Land Drilling
TickerMkt capP/EP/E fwdP/SP/S fwdP/GPP/GP fwdEV/EBITDAFCF yld
LBRT$3.3B26.6x72.8x0.8x0.7x6.1x5.6x7.0x-9.7%
PUMP$1.4Bn/m1.2x1.1x14.5x13.6x8.8x-1.6%
PTEN$4.9Bn/m1.0x1.0x7.3x7.0x7.0x3.7%
RES
RPC
6.53
+0.06 (+0.92%)
vs. prior close
Price20d50d150d
RES 12-month price
Well Services & Stimulation
ACDC
ProFrac
5.05
−0.00 (−0.10%)
vs. prior close
Price20d50d150d
ACDC 12-month price
Well Services & Stimulation
TickerMkt capP/EP/E fwdP/SP/S fwdP/GPP/GP fwdEV/EBITDAFCF yld
RES$1.5B65.8x26.8x0.8x0.8x8.6x8.4x6.1x2.7%
ACDC$902.8Mn/m0.5x0.5x11.1x9.9x15.8x-6.7%

Consensus projections

TickerFY2026EFY2027EFY2028E
LBRTRevenue+19.1%+8.7%+15.3%
EPS−534.1%−39.9%+311.7%
PUMPRevenue−2.1%+17.8%+11.4%
EPS−79.2%−3223.9%+224.7%
PTENRevenue+2.6%+7.3%+1.1%
EPS−93.3%−1578.9%+78.0%
RESRevenue+12.5%+2.1%+2.7%
EPS−15.0%+4.1%+35.2%
ACDCRevenue+4.6%+10.8%−4.3%
EPS−22.0%−44.0%−78.7%

Forward fiscal years only. Blank means no analyst coverage for that year.

Liberty Energy, the second-largest North American hydraulic fracturing contractor and owner of two Permian sand mines, raised its 2026 capital budget in July to roughly $1.5bn from about $1.2bn. Nearly all of the increase is deposits on gas engines and turbines bound for data centers; $71m of such deposits went out in the second quarter alone. Management told investors the machines will have minimal effect on the profit-and-loss statement until 2028.

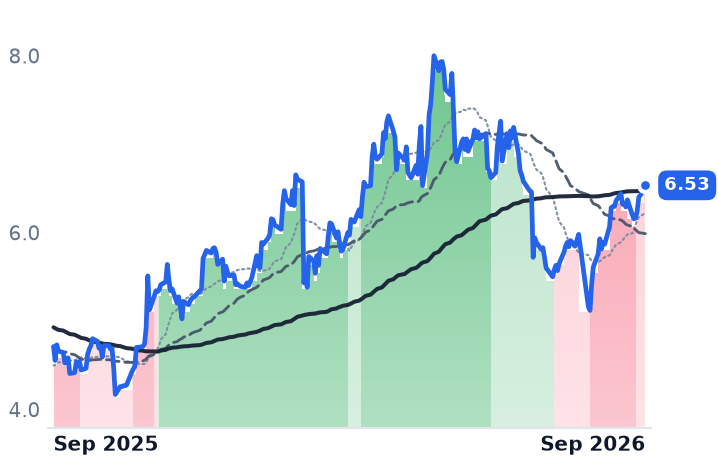
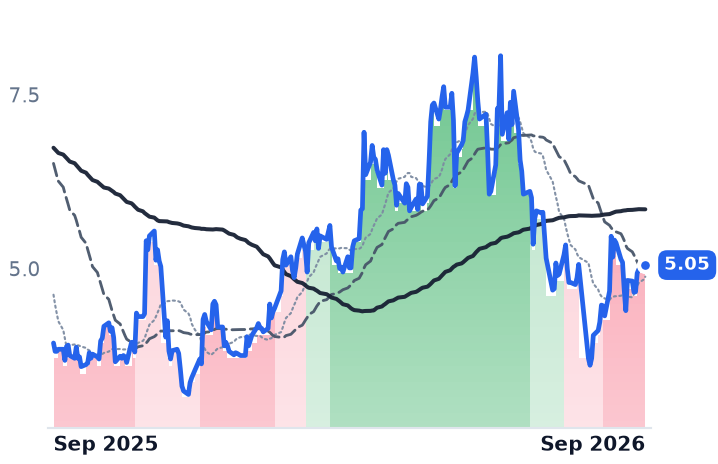
The spending sets up a clean test inside a five-company group. Liberty and ProPetro, the Midland pressure pumper whose PROPWR arm sells behind-the-meter electricity, are the two members with named power ventures, and both are down roughly a third from late-April highs. Patterson-UTI, RPC and ProFrac, which have none, rose 9.6%, fell 2.2% and fell 22.2% respectively over the same three months. Liberty's 2026 capex is about two and a half times the $602m of EBITDA consensus expects it to earn this year.

Why pumpers are selling electricity

The constraint on American data-center construction is generating equipment. GE Vernova's gas turbine backlog reached 116 gigawatts in the second quarter from 100 a quarter earlier, and it is now taking reservations for 2031 deliveries. US data-center load is projected to climb from 31 gigawatts in 2025 to 66 in 2027. Frac companies already buy reciprocating engines by the hundred, condition wellhead gas and run field crews around the clock, so they can sell speed into that queue.

Liberty has secured 3 gigawatts of supply through 2029 from Bergen Engines and Wärtsilä, at an estimated $5-6bn of eventual capex, targeting 17-18% unlevered returns and funding through special-purpose vehicles carrying non-recourse debt. It ended the quarter with $559m of cash against $736m of net debt. What it does not yet have is a customer. Its most contract-like commitment is a January partnership with Vantage Data Centers anchored by a reservation of 400 megawatts of 2027 capacity; the 2-gigawatt Alpha Digital campus in Reeves County, a joint venture with PowerBridge announced on 22 July, has no leases signed. Chief executive Ron Gusek said the company had "gained strong commercial traction, capitalizing on the revolutionary transformation of power supply and delivery." Barclays' Eddie Kim wrote that "the company has no energy service agreement or firm contract, which is what investors had been hoping for", cutting his target to $23 from $32.

The pumping business underneath is getting better, not worse. Second-quarter revenue of $1.189bn was up 14% year on year, gross margin widened from 9.7% to 17.5%, and adjusted EBITDA was $151m. But operating income fell 70% to $12.7m, and trailing free cash flow is negative, running at about -9.7% of market value.

The one power arm that earns

ProPetro's version is further along. PROPWR's contracted capacity rose to 350 megawatts from 240 during the quarter, its 60-megawatt behind-the-meter site for a Midwest hyperscaler is live, and the segment generated positive EBITDA in the final two months of the quarter. A Caterpillar framework gives access to about 2.1 gigawatts more. It pre-funded the buildout with a $690m zero-coupon convertible in May and ended the quarter with $784m of cash, budgeting $400-450m for power against $125-145m for completions.

The pumping side is the weak half: revenue of $305.8m fell 6.2% and the company lost $8.1m, though it activated a twelfth frac fleet and is deploying a thirteenth. Chief executive Sam Sledge said results "once again demonstrate the strength of our business model." At 8.75x trailing EV/EBITDA, ProPetro is priced above Liberty at 7.04x, Patterson-UTI at 7.03x and RPC at 6.07x — with consensus placing the payoff in 2028, when EBITDA is modeled at $383m.

What the year actually paid for

Patterson-UTI has no data-center venture and is up 119.4% over twelve months, essentially matching ProPetro's 122.5%. Its gross margin went from 2.3% to 22.9% on drilling day rates up 10-15% sequentially, and management says completions pricing is down about 30% over three years with a large part of that recoverable. RPC's Ben Palmer was blunter about volumes: "We currently have no plans to reactivate fleets at current levels." Active crew counts have been choppy rather than collapsing, 165 in late April and 205 in early July. The twelve-month re-rating was pricing recovery in drilling and completions, not payment for power.

The three-month drawdown is the market applying oilfield capital discipline to generation capex. Patterson-UTI and RPC convert into positive free cash flow; Liberty and ProPetro do not. Liberty's margin repair is real and unrewarded, and its shares now carry no visible premium for 3 gigawatts of secured turbine slots — but cheapness measured on EBITDA is not cheapness measured on cash, and the discount is the price of a deposit that has not become a contract.

Liberty's own timetable puts first power at Alpha Digital in late 2027 and full run-rate at the end of 2029. Three more annual budgets have to be defended before the first one pays.

New Switchgear Plants Don't Open Until 2027; Powell's Backlog Hit a Record $2.4bn

Hypothesis Opus 5 · Research Opus 5 · Writing Opus 5 · Prompt v1.6

The bear case on switchgear makers is that the post-2021 shortage is ending and the pricing that came with it is about to normalize. Every dated fact says the relief arrives in 2027 at the earliest — and the shares have already been marked down as though it arrived this summer.

Powell Industries booked $934m of orders in the June quarter against $362m a year earlier, three times what it shipped, taking backlog to an all-time $2.4bn while gross margin widened to 30.6%. Hubbell doubled its 2026 sales-growth guidance to 16-18%. Medium-voltage switchgear still runs 52 to 80 weeks and power transformers about 128 weeks.

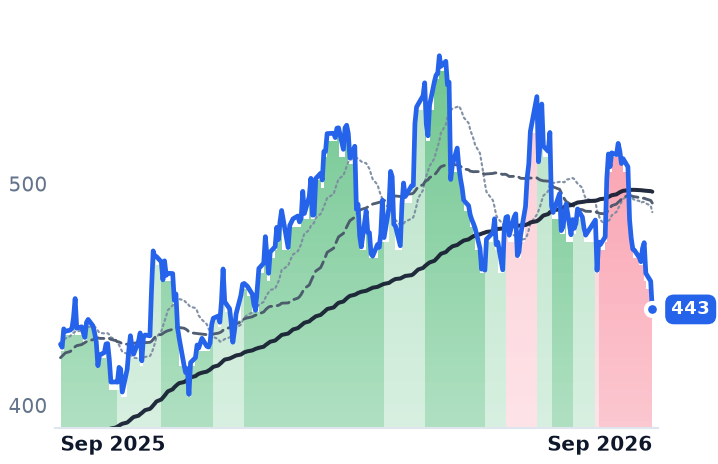
Powell's business explains none of its fall; Hubbell's does explain part of it, because the $3.0bn NSI deal added roughly $170m of annual interest and reported profit slipped 1.6% on a 15.3% revenue gain. The rest looks like a discount-rate problem, with the 30-year Treasury at 5.33%.

POWLHUBBFPSETNNVTVRTGEVPWRAZZMYRGABBNYATKRMedium-Voltage SwitchgearGrid Equipment BacklogsData-Center Power BuildoutTransformer Lead TimesCopper Input CostsManufacturing Capacity Expansion
TickerCompanySegmentTrend · 13mo30D1Y
The subject · what this brief is about
POWLPowell IndustriesElectrical Distribution & Switchgear🟢 Cont. Bull−21.7%+96.0%
HUBBHubbell IncorporatedElectrical Distribution & Switchgear⚠️ Emerging Bear−6.9%+3.7%
Compared against · context, not the story
FPSForgent Power SolutionsElectrical Distribution & Switchgear🟢 Cont. Bull−19.1%+1.2%
ETNEatonPower & Propulsion Systems🟢 Cont. Bull−11.3%+13.7%
NVTnVent ElectricData Center Power & Thermal🟢 Cont. Bull−7.6%+65.5%
VRTVertivData Center Power & Thermal🟢 Cont. Bull−3.2%+105.6%
GEVGE VernovaGE Vernova Integrated🟢 Cont. Bull−11.6%+53.9%
PWRQuanta ServicesElectrical & Power Infrastructure🟢 Cont. Bull−9.3%+62.7%
AZZAZZMetal Coatings & Finishing🟢 Cont. Bull−9.5%+20.8%
MYRGMYRElectrical & Power Infrastructure🟢 Cont. Bull−14.3%+56.9%
ABBNYABBElectrical Equipment & Parts🟢 Cont. Bull−3.1%+47.7%
ATKRAtkoreElectrical Infrastructure Products🌱 Emerging Bull+0.1%+64.6%

12-month price & trend

POWL
Powell Industries
172
−8.63 (−4.77%)
vs. prior close
Price20d50d150d
POWL 12-month price
Electrical Distribution & Switchgear
HUBB
Hubbell Incorporated
443
−12.74 (−2.79%)
vs. prior close
Price20d50d150d
HUBB 12-month price
Electrical Distribution & Switchgear
FPS
Forgent Power Solutions
29.34
−0.94 (−3.10%)
vs. prior close
Price20d50d150d
FPS 12-month price
Electrical Distribution & Switchgear
TickerMkt capP/EP/E fwdP/SP/S fwdP/GPP/GP fwdEV/EBITDAFCF yld
POWL$6.3B32.8x32.0x5.4x5.2x18.0x17.5x22.7x3.9%
HUBB$23.4B26.2x21.7x3.8x3.4x10.7x9.7x19.4x3.8%
FPS$7.6B26.9x6.4x3.7x20.5x12.0x62.3x-1.2%
ETN
Eaton
389
−12.11 (−3.02%)
vs. prior close
Price20d50d150d
ETN 12-month price
Power & Propulsion Systems
NVT
nVent Electric
147
−2.75 (−1.83%)
vs. prior close
Price20d50d150d
NVT 12-month price
Data Center Power & Thermal
VRT
Vertiv
255
−1.57 (−0.61%)
vs. prior close
Price20d50d150d
VRT 12-month price
Data Center Power & Thermal
TickerMkt capP/EP/E fwdP/SP/S fwdP/GPP/GP fwdEV/EBITDAFCF yld
ETN$162.8B42.5x31.0x5.4x5.0x15.1x13.8x28.4x2.8%
NVT$24.6B41.2x29.9x5.1x4.5x13.8x12.3x25.8x2.4%
VRT$100.8B58.0x39.0x8.8x7.2x23.4x19.2x40.1x2.9%
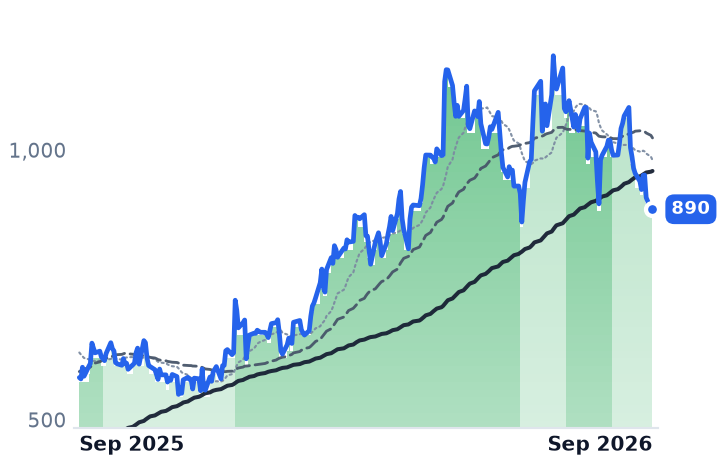
GEV
GE Vernova
890
−0.53 (−0.06%)
vs. prior close
Price20d50d150d
GEV 12-month price
GE Vernova Integrated
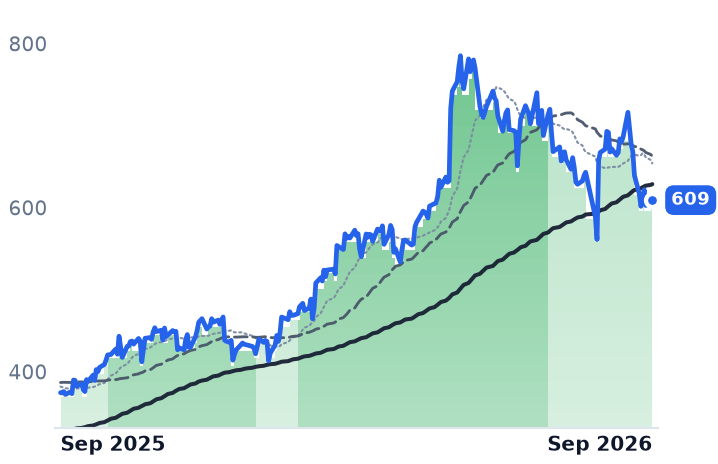
PWR
Quanta Services
609
+3.62 (+0.60%)
vs. prior close
Price20d50d150d
PWR 12-month price
Electrical & Power Infrastructure
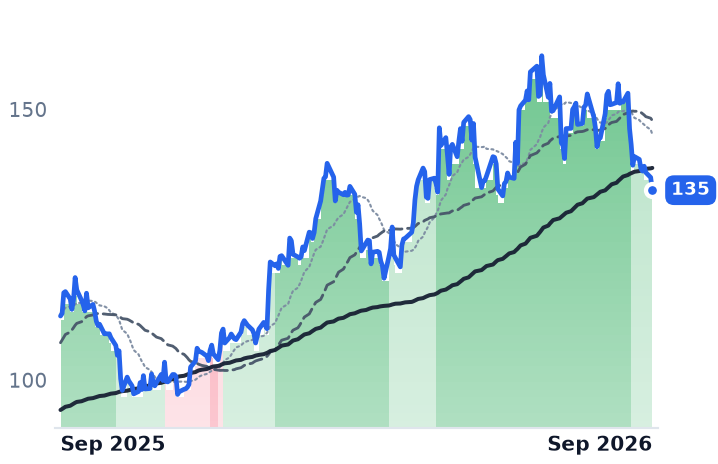
AZZ
AZZ
135
−2.35 (−1.71%)
vs. prior close
Price20d50d150d
AZZ 12-month price
Metal Coatings & Finishing
TickerMkt capP/EP/E fwdP/SP/S fwdP/GPP/GP fwdEV/EBITDAFCF yld
GEV$242.9B25.9x29.7x5.9x5.2x29.0x26.0x27.0x5.1%
PWR$96.1B72.3x38.2x2.9x2.4x20.3x16.9x33.7x2.5%
AZZ$4.2B13.3x20.6x2.6x2.4x10.7x10.1x8.4x10.5%
MYRG
MYR
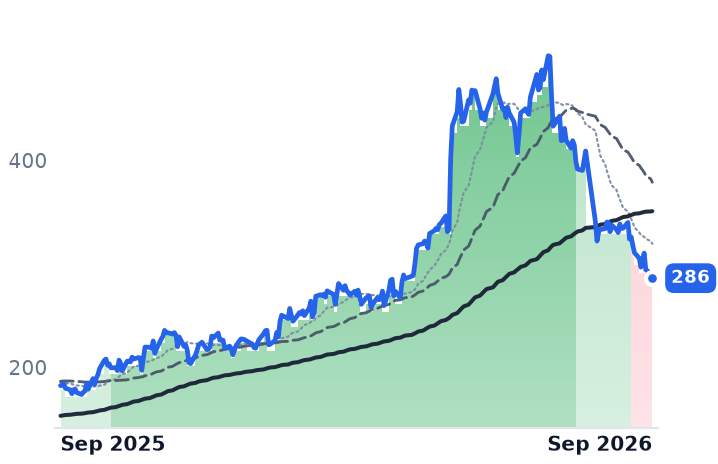
286
−4.64 (−1.60%)
vs. prior close
Price20d50d150d
MYRG 12-month price
Electrical & Power Infrastructure
ABBNY
ABB
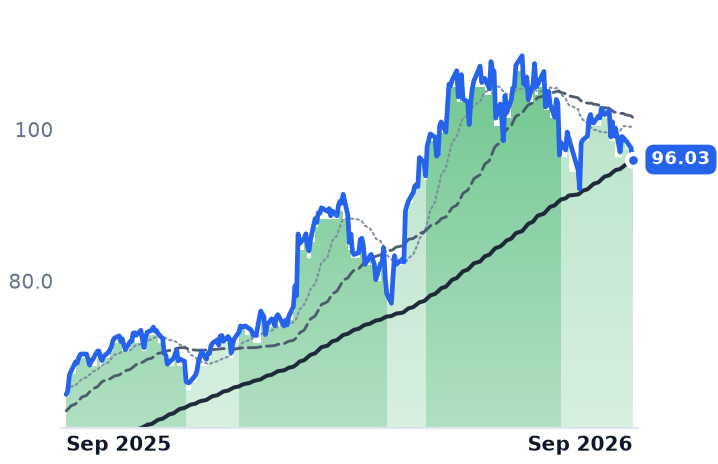
96.03
−1.54 (−1.58%)
vs. prior close
Price20d50d150d
ABBNY 12-month price
Electrical Equipment & Parts
ATKR
Atkore
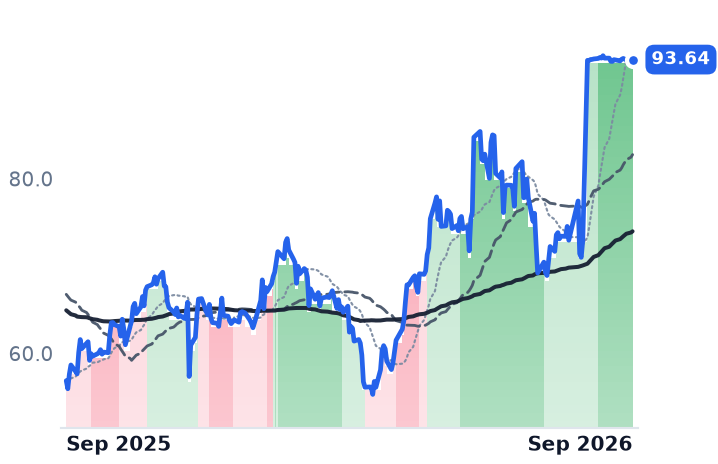
93.64
−0.04 (−0.04%)
vs. prior close
Price20d50d150d
ATKR 12-month price
Electrical Infrastructure Products
TickerMkt capP/EP/E fwdP/SP/S fwdP/GPP/GP fwdEV/EBITDAFCF yld
MYRG$4.8B29.2x25.5x1.2x1.1x9.7x8.9x16.2x4.0%
ABBNY$184.3B36.8x30.3x5.1x4.8x12.7x12.1x24.7x2.6%
ATKR$3.2Bn/m16.5x1.1x1.1x5.5x5.4xn/m1.8%

Consensus projections

TickerFY2026EFY2027EFY2028E
POWLRevenue+8.8%+25.8%+14.4%
EPS+12.1%+27.8%+19.8%
HUBBRevenue+17.1%+9.7%+5.7%
EPS+12.2%+11.7%+10.7%
FPSRevenue+57.5%+46.8%+39.7%
EPS+60.3%+84.0%
ETNRevenue+19.6%+10.6%+9.4%
EPS+12.2%+18.2%+16.4%
NVTRevenue+41.5%+19.4%+14.7%
EPS+52.7%+27.3%+19.8%
VRTRevenue+37.0%+29.7%+21.9%
EPS+62.8%+36.4%+27.1%
GEVRevenue+23.9%+14.8%+15.0%
EPS+321.7%−19.5%+40.7%
PWRRevenue+40.6%+16.7%+12.5%
EPS+57.5%+17.8%+16.7%
AZZRevenue+3.3%+6.3%+4.8%
EPS+15.3%+12.7%+11.5%
MYRGRevenue+22.9%+15.5%+11.4%
EPS+72.5%+18.4%+22.2%
ABBNYRevenue+13.1%+11.7%+10.2%
EPS+31.6%+9.2%+14.6%
ATKRRevenue+5.0%+4.7%+6.6%
EPS−13.4%+11.5%+13.6%

Forward fiscal years only. Blank means no analyst coverage for that year.

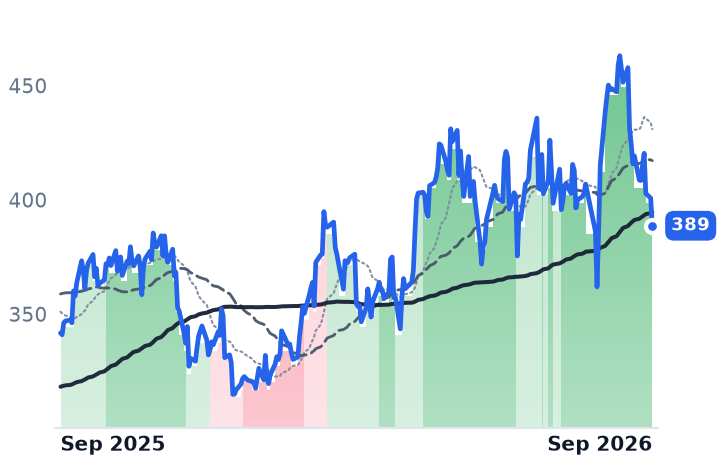
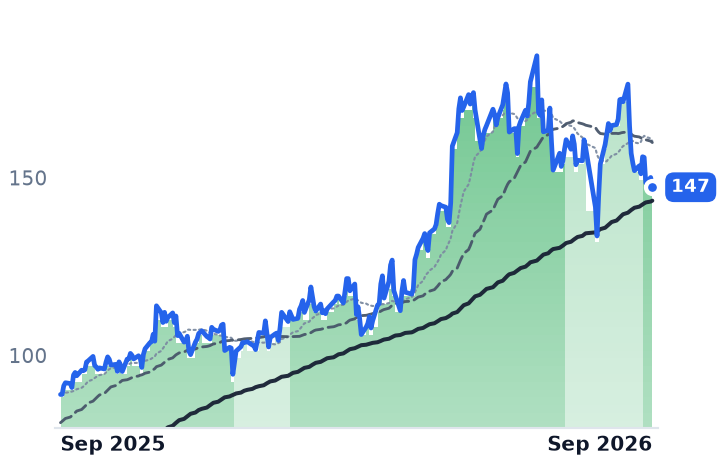
The shortage that made electrical switchgear a franchise business has not eased. Medium-voltage 15,000-volt gear still takes 52 to 80 weeks to deliver, stretching toward two and three years for data-center specifications, and standard power transformers average about 128 weeks, with substation units above 160. Copper, the largest bought-in input for switchgear and busbar, set an all-time high on COMEX at $6.77 a pound on August 7.

That matters because the supply response everyone points to is dated, and the dates are not 2026. Eaton is spending $340m to expand three-phase transformer output at Jonesville, South Carolina, with production and hiring beginning in 2027, and $30m on a 370,000-square-foot medium-voltage switchgear plant at Bellevue, Nebraska, starting in the first half of 2027. Schneider Electric has committed more than $700m through 2027. New factories take years to reach full output, so the wait times outlast the plans meant to fix them.

What the order books actually did

Powell Industries, the Houston maker of custom medium-voltage switchgear, circuit breakers and modular "E-House" substations for refineries, liquefied natural gas terminals, utilities and now data centers, booked record orders of $934m in the June quarter against $362m a year earlier — three times what it shipped. Backlog reached an all-time $2.4bn, roughly $967m higher than a year ago, with about $1.3bn convertible inside twelve months. Revenue grew 8.9% to $311.7m, the third consecutive quarter of acceleration, and gross margin widened to 30.6% from 28.4% two quarters earlier. The company holds $634m in cash and no debt.

The largest single award, a behind-the-meter data-center project worth more than $400m, will burn over "roughly two to two and a half years" across at least five North American sites, chief executive Brett Cope told investors on August 4, adding that future phases should be "copy jobs" of the first. On pricing, Cope said there is "some opportunity for price" in the market, with delivery speed carrying the value proposition in commercial work; finance chief Mike Metcalf credited mix, operating leverage and "pricing stability."

Hubbell, the Connecticut maker of utility distribution, transmission and substation hardware alongside wiring and lighting, raised 2026 sales-growth guidance to 16-18% from 8-11%. Utility Solutions ran a 1.2x book-to-bill; Electrical Solutions grew 18% organically with data-center revenue up about 65%. The company took roughly a point of price in April and half a point in July, targeting three to four points for the year. Chief executive Gerben Bakker said the quoting pipeline is running at about twice the volume of a couple of years ago.

Where the shares went instead

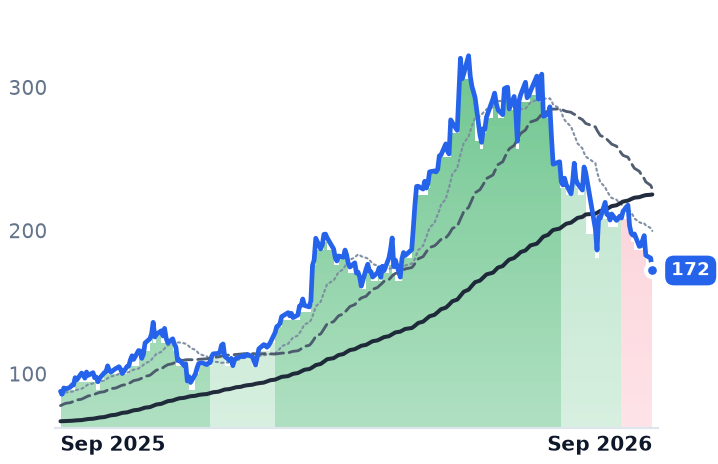
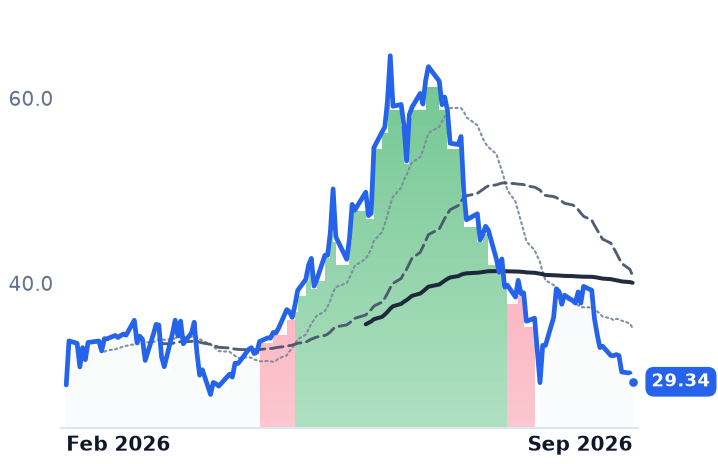
Over the thirty days to September 1, Powell fell 21.7% and Forgent Power Solutions — the Minnesota switchgear, transformer and power-distribution-unit maker that listed in February and grew March-quarter revenue 146% to $378.7m at a 31.1% gross margin — fell 19.2%. The diversified names fell about half as hard: Eaton 11.3%, GE Vernova 11.6%, Hubbell 6.9%. Powell is down 46.6% from its May 11 peak; Forgent has round-tripped to its listing price. The likelier reading is duration, with the 30-year Treasury yield reaching 5.33% in August, its highest in nearly two decades — a rate that bears hardest on companies whose value sits in backlog converting in 2028 and beyond. Cantor Fitzgerald cut its Powell target to $235 from $320 on August 14 while keeping a Neutral rating, reasoning that working through the existing backlog does not require the next plant.

The verdict

Powell's business explains none of its fall. Its trailing price/earnings ratio is 32.8x against 49.2x in early May, and 32.0x on this year's consensus of $5.38 — the same estimate that supported roughly 60x at the May high. What has not happened is an earnings cut. Cheapness here is relative to its own four-month-old anchor: Powell still trades at 18.0x gross profit against Hubbell's 10.7x, 68% higher.

Hubbell is the more honest half. Revenue accelerated to 15.3% growth, but gross margin fell 139 basis points year over year and reported net income slipped 1.6%, because the $3.0bn NSI acquisition carries about $170m of extra annual interest and takes leverage to 2.9x. That earns some of a 20.5% drawdown; a doubled sales guidance does not. The shares trade at 21.7x this year's consensus and 19.4x next year's $22.80, against 14.0x gross profit in early May.

The test the market has priced is scheduled, and it is not scheduled for this year. If Eaton's and Schneider's lines open on time, the 2027 order book is where pricing power gets audited — one reason Powell's own footprint expansion, more than 20% of capacity by the end of this fiscal year, is a bet placed against the same clock.

Edison Reaffirmed 2026 Guidance in July, Then Fell 26.7% When a Wildfire Bill Died

Hypothesis Opus 5 · Research Opus 5 · Writing Opus 5 · Prompt v1.6

California's wildfire liability rule survived the legislative session untouched, and the two utilities that live under it were repriced on the liability side of their balance sheets rather than on earnings. Senate Bill 492, rewritten over the weekend of 29 August to carry a deal negotiated with Governor Gavin Newsom, arrived without a liability cap; Edison International and PG&E fell hard on the Monday, told lawmakers they had lost $20bn of market value since Thursday, and rebounded on Tuesday when the Assembly let the bill die without a vote.
Neither business is deteriorating. Edison's second-quarter operating income rose 41% and PG&E's 15%, both reaffirmed full-year guidance in July, and consensus earnings estimates for 2026 through 2028 have not been cut. What changed sits behind the equity: state administrators have told the Legislature that a single Eaton fire claim could fully exhaust the $21bn wildfire fund.

EIXPCGSREFTSEMAKEPENICCEPUEDNCalifornia Wildfire LiabilityRegulated Utility RiskInverse Condemnation DoctrineWildfire Insurance FundUtility Credit SpreadsData-Center Load Growth
TickerCompanySegmentTrend · 13mo30D1Y
The subject · what this brief is about
EIXEdison InternationalRegional/International Utilities🟢 Cont. Bull−17.7%+9.9%
PCGPG&EVertically Integrated Utilities🟢 Cont. Bull−19.3%−7.5%
Compared against · context, not the story
SRESempraUS Electric & Gas Utilities⚠️ Emerging Bear−5.2%+2.5%
FTSFortisRegional/International Utilities🟢 Cont. Bull−3.0%+11.7%
EMAEmera IncorporatedRegional/International Utilities🟢 Cont. Bull−5.3%+6.6%
KEPKorea Electric PowerRegional/International Utilities⚠️ Emerging Bear−3.4%−12.2%
ENICEnel ChileRegional/International Utilities🟢 Cont. Bull−3.4%+24.4%
CEPUCentral PuertoRegional/International Utilities⚠️ Emerging Bear−7.6%+34.2%
EDNEmpresa Distribuidora y Comercializadora Norte Sociedad AnónimaRegional/International Utilities🔴 Cont. Bear−10.1%+13.3%

12-month price & trend

EIX
Edison International
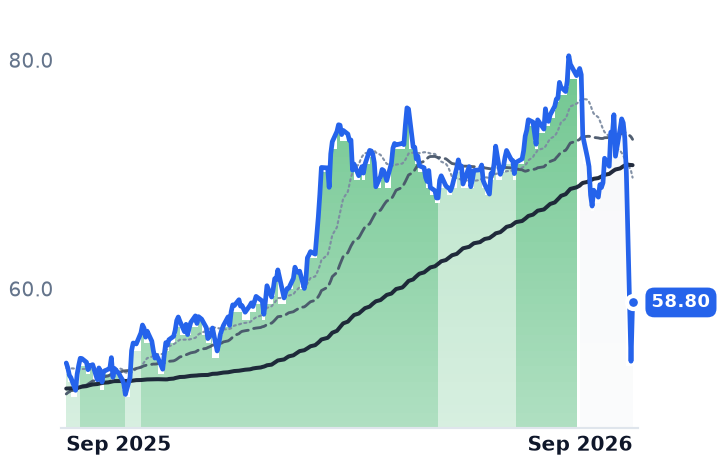
58.80
+5.14 (+9.58%)
vs. prior close
Price20d50d150d
EIX 12-month price
Regional/International Utilities
PCG
PG&E
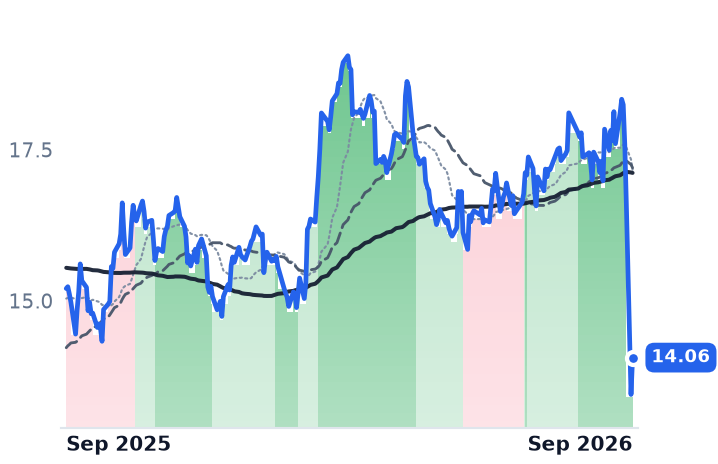
14.06
+0.61 (+4.54%)
vs. prior close
Price20d50d150d
PCG 12-month price
Vertically Integrated Utilities
SRE
Sempra
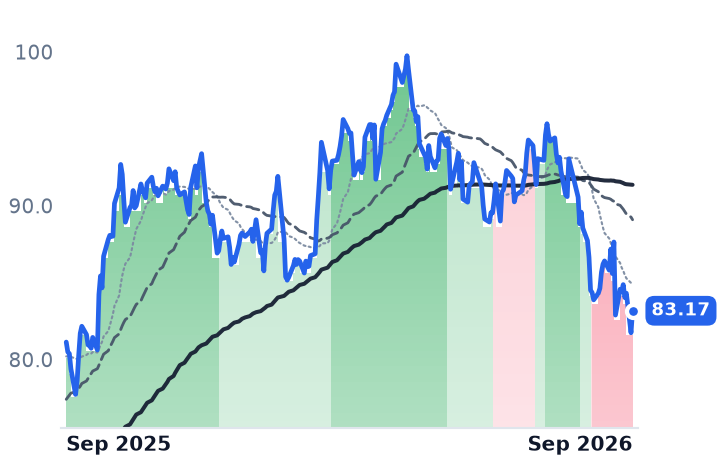
83.17
+1.43 (+1.75%)
vs. prior close
Price20d50d150d
SRE 12-month price
US Electric & Gas Utilities
TickerMkt capP/EP/E fwdP/SP/S fwdP/GPP/GP fwdEV/EBITDAFCF yld
EIX$22.6B6.0x9.6x1.2x1.2x2.9x3.0x8.4x-1.7%
PCG$37.7B10.2x8.5x1.5x1.4x2.6x2.6x9.6x-11.3%
SRE$55.1B24.3x16.5x4.0x4.0x9.7x9.7x14.1x-10.7%
FTS
Fortis
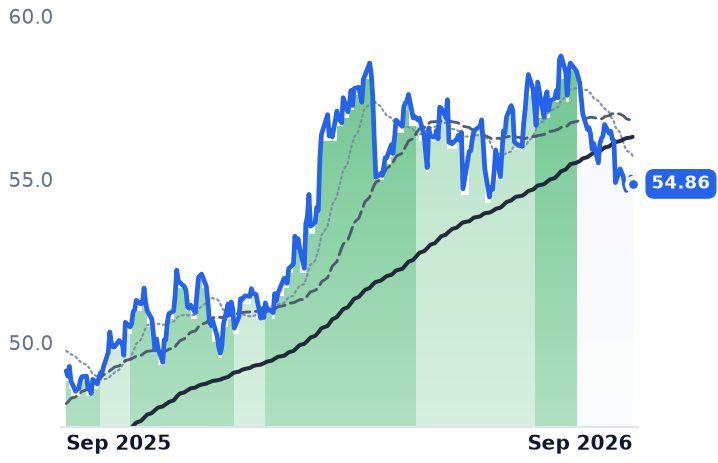
54.86
−0.21 (−0.38%)
vs. prior close
Price20d50d150d
FTS 12-month price
Regional/International Utilities
EMA
Emera Incorporated
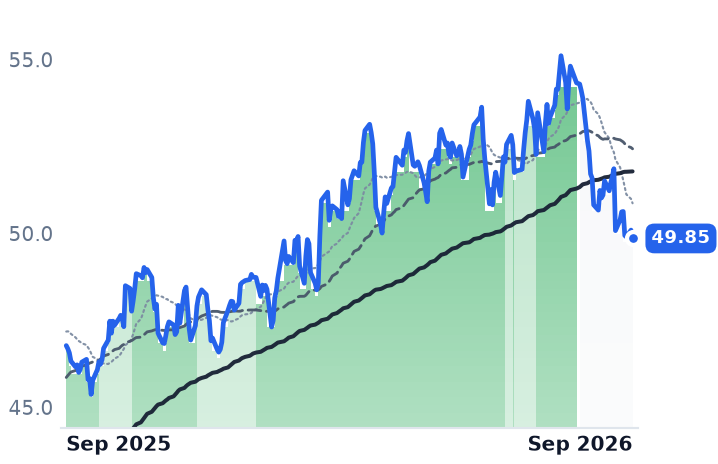
49.85
−0.24 (−0.48%)
vs. prior close
Price20d50d150d
EMA 12-month price
Regional/International Utilities
KEP
Korea Electric Power
11.70
+0.06 (+0.56%)
vs. prior close
Price20d50d150d
KEP 12-month price
Regional/International Utilities
TickerMkt capP/EP/E fwdP/SP/S fwdP/GPP/GP fwdEV/EBITDAFCF yld
FTS$27.8B21.2x14.9x3.1x2.1x9.6x6.4x12.5x-5.6%
EMA$15.6B20.2x19.1x2.7x2.5x15.2x14.0x19.4x-8.5%
KEP$16.7B2.9x0.3x0.5x9.0x20.2%
ENIC
Enel Chile
4.36
−0.01 (−0.11%)
vs. prior close
Price20d50d150d
ENIC 12-month price
Regional/International Utilities
CEPU
Central Puerto
13.82
+0.12 (+0.88%)
vs. prior close
Price20d50d150d
CEPU 12-month price
Regional/International Utilities
EDN
Empresa Distribuidora y Comercializadora Norte Sociedad Anónima
23.72
−0.27 (−1.13%)
vs. prior close
Price20d50d150d
EDN 12-month price
Regional/International Utilities
TickerMkt capP/EP/E fwdP/SP/S fwdP/GPP/GP fwdEV/EBITDAFCF yld
ENIC$5.8B11.1x11.0x1.3x1.3x4.2x4.2x7.1x5097.4%
CEPU$2.1B9.3x2.9x8.2x7.2x3.5%
EDN$981.3M6.3x0.5x2.2x4.6x-2.3%

Consensus projections

TickerFY2026EFY2027EFY2028E
EIXRevenue+1.9%+3.4%+3.3%
EPS+0.8%+6.2%+5.6%
PCGRevenue+2.8%+3.9%+3.9%
EPS+10.1%+9.0%+9.2%
SRERevenue−3.7%−1.8%+1.7%
EPS+11.6%+8.0%+8.4%
FTSRevenue+5.6%+6.1%+4.1%
EPS+5.3%+7.0%+5.9%
EMARevenue+3.2%+1.6%+14.9%
EPS+5.6%−2.5%+7.7%
KEPRevenue+5.6%+1.8%+1.6%
EPS−11.9%+20.4%+5.0%
ENICRevenue−2.5%+2.7%+2.1%
EPS+1.7%−0.7%+6.2%
CEPURevenue+30.3%+4.1%+2.7%
EPS−21.9%+4.9%+17.0%
EDNRevenue+3.6%+15.0%
EPS−88.2%+1036.0%

Forward fiscal years only. Blank means no analyst coverage for that year.

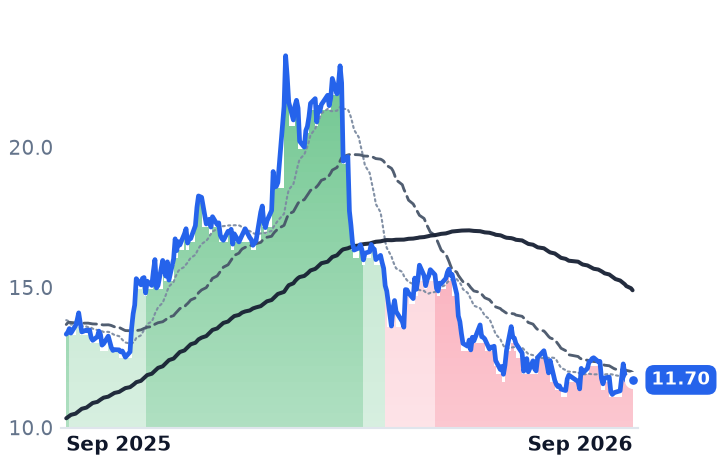
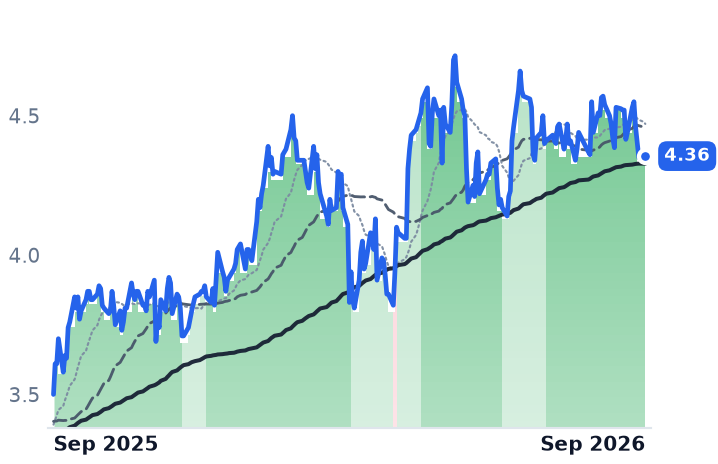
California's Legislature went home on Tuesday without touching the doctrine that makes an investor-owned utility strictly liable for property damage caused by its equipment, negligent or not. In the four sessions it took lawmakers to get there, the two utilities most exposed to that doctrine lost roughly a fifth of their market value and got most of it back.

What is at stake is not an earnings line but the size of the claim that sits ahead of shareholders. Under inverse condemnation, utility equity is a residual after subrogation settlements and individual claims; the wildfire fund created by Assembly Bill 1054 in 2019 exists to blunt that, with about $21bn of claim-paying capacity and a requirement that a utility absorb the first $1bn itself. Officials administering the fund wrote in a draft annual report to the Legislature that if Edison is found responsible for the Eaton fire, "the resulting claims may be substantial enough to fully exhaust the Fund."

The bill that was written, then unwritten

On 29 August legislative leaders gutted-and-amended Senate Bill 492 — until that weekend a $1bn bond act for homeless youth programs — to carry a wildfire deal negotiated with Governor Newsom. The text that emerged contained no liability cap, no end to subrogation and no per-incident ceiling on fund withdrawals. The underlying framework it was meant to enact had asked shareholders and ratepayers to replenish the fund with up to $18bn and to keep $6bn of mitigation capital out of rate base. The costs survived the drafting; the offset did not.

Edison International, the Rosemead holding company whose Southern California Edison unit serves about 15 million people, closed Monday 31 August at $53.66, down 23.5% on 11.3m shares against a typical one to three million — its worst session since the 2001 energy crisis, Bloomberg reported. PG&E, the Oakland utility supplying electricity and gas across northern and central California, fell 19.0% to $13.45. Selling had started the Friday before. Measured from the 27 August close, the falls reached 26.7% and 23.5%. Bond spreads for both widened alongside the equity. That Monday the two chief executives wrote jointly to Senate leader Monique Limón and Speaker Robert Rivas saying the companies had lost $20bn in market value since Thursday — a figure that reconciles to about $18.5bn across Edison, PG&E and Sempra on closing prices — and warning of "constrained investment, higher utility bills, less spending, and fewer jobs." On Tuesday the Assembly simply declined to take the bill up and it died. Edison rose 9.6%, PG&E 4.5%.

The operating businesses never wobbled

Edison reaffirmed 2026 core earnings of $5.90 to $6.20 a share on 30 July, with second-quarter operating income up 40.9% and margin widening to 25.1%. PG&E reaffirmed $1.64 to $1.66 on 23 July, with operating income up 15.2%, a $73bn capital plan it says needs no equity, and a data-center interconnection pipeline raised to more than 12 gigawatts. Consensus still builds Edison to $6.88 by 2028 and PG&E to $1.97. Both chief executives had named this exact risk a month early. "If there is insufficient action in 2026, there is a strong likelihood that the day after or a few days after, you know, we could see credit rating downgrades for the investor-owned utilities in California," Pedro Pizarro told investors on 30 July; Edison carries an S&P rating one notch above junk. "If the framework remains unresolved or insufficient, then we would need to reevaluate our capital allocation priorities," PG&E's Patricia Poppe said on 23 July. Both companies run negative free cash flow because rate-base spending exceeds operating cash flow, so the debt market is a standing appointment.

What the doctrine, not the sector, did

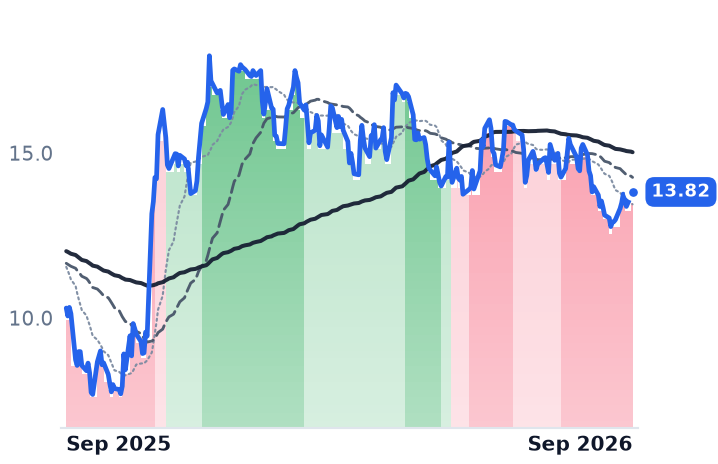
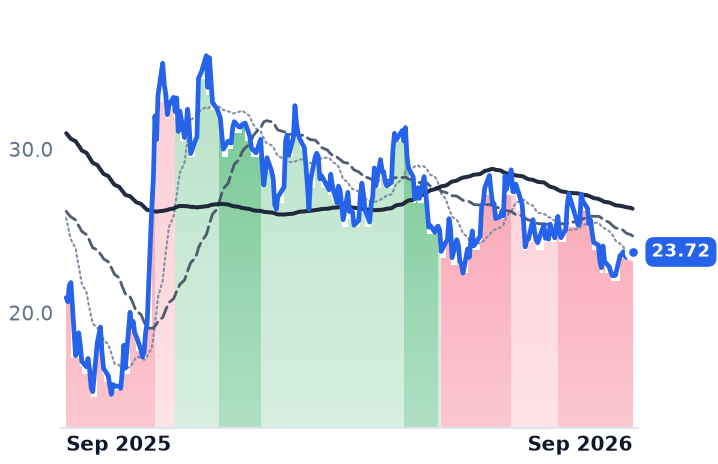
This was California, not utilities. Over the same five sessions Fortis, Emera, Korea Electric Power, Enel Chile, Central Puerto and Empresa Distribuidora y Comercializadora Norte all finished within two points of unchanged. Sempra, whose San Diego unit is diluted by Texas transmission and gas, fell 3.05% and trades near 16.5 times forward earnings — roughly the long-run median for vertically integrated utilities — against 9.6 times for Edison and 8.5 times for PG&E, which is also priced at 0.91 times book, below the capital on which it earns its authorized return.

The discount is doing real work. Southern California Edison had recorded $1.3bn of Eaton settlement losses as of 31 March with $917m, $295m and $70m of expected recoveries from self-insurance, the fund and federal rates, plus a further $511m of claims in the first half — against a Jefferies estimate of $13.5bn of potential Eaton liability and a market capitalization of $22.6bn. Analysts responding to the bill's failure raised the liability drag on PG&E's value to $10 a share from $6, and downgrades followed within hours, Mizuho cutting Edison to neutral with a $70 target. So the verdict splits cleanly: the operating businesses earn none of the fall, and the entire move so far is multiple rather than estimate. What the market marked down is the statute that was not written — and with subrogation intact and per-incident draws uncapped, the ceiling on Edison's Eaton exposure is now whatever a jury decides it is.

That jury is scheduled. Nearly 1,000 suits allege a decommissioned tower re-energized and sparked the fire, and the first bellwether trial is set for 25 January 2027, a date the judge has refused to move; CAL FIRE's cause finding remains undetermined. Sacramento had eleven months to answer the question and handed it to a courtroom in Los Angeles.

Tapestry Guided Growth Down by More Than Half; Capri Cut Revenue, Not Earnings

Hypothesis Opus 5 · Research Opus 5 · Writing Opus 5 · Prompt v1.6

Coach is compounding and its owner's shares just had their worst session in years. Tapestry closed fiscal 2026 with revenue of $8.0bn, up 14%, handbag average unit retail rising in the mid-teens at Coach and roughly 11 million new customers added across the year — then guided fiscal 2027 to mid-single-digit growth, a rate less than half what it had just delivered, with a mid-20% tariff on US inventory receipts holding gross-margin expansion to about 30 basis points.

The guide, not the quarter, is what the market repriced: Tapestry now trades at 15.3x forward earnings against Ralph Lauren's 18.0x on a comparable mid-single-digit outlook. Capri, one-seventeenth its size, is the genuinely broken business — revenue down for a fourth straight year, Michael Kors off 7.1%, and an unchanged $2.15 earnings guide financed by $70m of expense cuts. The two are not one story.

TPRCPRIRLPVHLEVIDECKVFCNKEONONBIRKKTBCRIAEOLULUULTAELANFAccessible Luxury HandbagsImport Tariff CostsLeather Input InflationGen Z ConsumersBrand TurnaroundsApparel Retail Margins
TickerCompanySegmentTrend · 13mo30D1Y
The subject · what this brief is about
TPRTapestryHandbags & Accessories🟢 Cont. Bull−21.7%+19.8%
CPRICapriHandbags & Accessories⚠️ Emerging Bear−21.3%−37.4%
Compared against · context, not the story
RLRalph LaurenPremium Lifestyle🟢 Cont. Bull−10.8%+10.0%
PVHPVHPremium Lifestyle🟢 Cont. Bull−18.7%−15.9%
LEVILevi StraussDenim & Casual🟢 Cont. Bull−16.8%−7.7%
DECKDeckers OutdoorPremium Lifestyle Footwear🌱 Emerging Bull−14.9%−31.1%
VFCV.FOutdoor & Adventure⚠️ Emerging Bear−12.3%−10.4%
NKENIKEAthletic & Performance🔴 Cont. Bear−10.6%−48.0%
ONONOnAthletic & Activewear🔴 Cont. Bear−26.2%−37.5%
BIRKBirkenstockPremium Lifestyle Footwear🌱 Emerging Bull−11.5%−31.8%
KTBKontoor BrandsDenim & Casual🟢 Cont. Bull−11.4%−3.5%
CRICarter'sChildrenswear🟢 Cont. Bull−20.3%+11.3%
AEOAmerican Eagle OutfittersSpecialty Apparel⚠️ Emerging Bear−7.3%+25.0%
LULULululemon AthleticaAthletic & Activewear🔴 Cont. Bear−2.8%−39.9%
ULTAUlta BeautyBeauty & Personal Care⚠️ Emerging Bear+2.2%+2.6%
ELThe Estée Lauder CompaniesBeauty & Personal Care⚠️ Emerging Bear+17.8%+10.6%
ANFAbercrombie & FitchSpecialty Apparel🟢 Cont. Bull+27.9%+51.4%

12-month price & trend

TPR
Tapestry
122
−0.46 (−0.38%)
vs. prior close
Price20d50d150d
TPR 12-month price
Handbags & Accessories
CPRI
Capri
12.88
−0.22 (−1.72%)
vs. prior close
Price20d50d150d
CPRI 12-month price
Handbags & Accessories
RL
Ralph Lauren
339
−6.09 (−1.76%)
vs. prior close
Price20d50d150d
RL 12-month price
Premium Lifestyle
TickerMkt capP/EP/E fwdP/SP/S fwdP/GPP/GP fwdEV/EBITDAFCF yld
TPR$24.7B16.3x15.3x3.1x2.9x4.0x3.7x13.0x7.3%
CPRI$1.5B10.2x6.0x0.4x0.4x0.7x0.7x11.5x5.7%
RL$20.8B21.2x18.0x2.5x2.4x3.5x3.4x14.9x5.0%
PVH
PVH
72.20
−2.02 (−2.72%)
vs. prior close
Price20d50d150d
PVH 12-month price
Premium Lifestyle
LEVI
Levi Strauss
20.49
−0.39 (−1.87%)
vs. prior close
Price20d50d150d
LEVI 12-month price
Denim & Casual
DECK
Deckers Outdoor
84.71
−3.04 (−3.47%)
vs. prior close
Price20d50d150d
DECK 12-month price
Premium Lifestyle Footwear
TickerMkt capP/EP/E fwdP/SP/S fwdP/GPP/GP fwdEV/EBITDAFCF yld
PVH$3.6B148.5x6.6x0.4x0.4x0.7x0.7x11.0x14.8%
LEVI$8.3B13.2x14.0x1.3x1.2x2.1x2.0x10.1x5.9%
DECK$13.3B13.2x12.7x2.5x2.3x4.3x4.0x8.4x7.0%
VFC
V.F
13.08
−0.30 (−2.24%)
vs. prior close
Price20d50d150d
VFC 12-month price
Outdoor & Adventure
NKE
NIKE
38.12
−1.16 (−2.95%)
vs. prior close
Price20d50d150d
NKE 12-month price
Athletic & Performance
ONON
On
27.99
−0.70 (−2.44%)
vs. prior close
Price20d50d150d
ONON 12-month price
Athletic & Activewear
TickerMkt capP/EP/E fwdP/SP/S fwdP/GPP/GP fwdEV/EBITDAFCF yld
VFC$6.5B29.2x16.2x0.7x0.7x1.3x1.3x10.8x-10.2%
NKE$61.9B27.5x28.1x1.3x1.3x3.3x3.3x19.9x1.7%
ONON$12.4B38.5x26.1x3.1x3.4x4.9x5.3x22.1x3.1%
BIRK
Birkenstock
34.40
−0.92 (−2.59%)
vs. prior close
Price20d50d150d
BIRK 12-month price
Premium Lifestyle Footwear
KTB
Kontoor Brands
75.00
−0.45 (−0.59%)
vs. prior close
Price20d50d150d
KTB 12-month price
Denim & Casual
CRI
Carter's
31.81
−0.66 (−2.03%)
vs. prior close
Price20d50d150d
CRI 12-month price
Childrenswear
TickerMkt capP/EP/E fwdP/SP/S fwdP/GPP/GP fwdEV/EBITDAFCF yld
BIRK$5.7B13.8x15.4x2.3x2.4x4.0x4.3x9.1x6.5%
KTB$3.4B12.3x11.5x1.1x1.2x2.3x2.5x10.1x11.7%
CRI$1.2B13.1x10.4x0.4x0.4x0.9x0.9x7.0x10.3%
AEO
American Eagle Outfitters
16.57
−0.03 (−0.18%)
vs. prior close
Price20d50d150d
AEO 12-month price
Specialty Apparel
LULU
Lululemon Athletica
120
−1.90 (−1.56%)
vs. prior close
Price20d50d150d
LULU 12-month price
Athletic & Activewear
ULTA
Ulta Beauty
546
+11.14 (+2.08%)
vs. prior close
Price20d50d150d
ULTA 12-month price
Beauty & Personal Care
TickerMkt capP/EP/E fwdP/SP/S fwdP/GPP/GP fwdEV/EBITDAFCF yld
AEO$2.5B13.5x8.7x0.5x0.4x1.4x1.3x7.4x1.0%
LULU$14.0B9.0x9.7x1.3x1.2x2.2x2.2x5.1x6.6%
ULTA$21.6B19.2x17.3x1.7x1.6x4.5x4.2x12.7x4.6%
EL
The Estée Lauder Companies
99.73
−2.90 (−2.83%)
vs. prior close
Price20d50d150d
EL 12-month price
Beauty & Personal Care
ANF
Abercrombie & Fitch
139
−4.58 (−3.18%)
vs. prior close
Price20d50d150d
ANF 12-month price
Specialty Apparel
TickerMkt capP/EP/E fwdP/SP/S fwdP/GPP/GP fwdEV/EBITDAFCF yld
EL$29.0Bn/m33.1x2.0x1.9x2.7x2.6x21.9x4.4%
ANF$3.2B6.4x6.6x0.6x0.6x1.0x1.0x4.1x11.9%

Consensus projections

TickerFY2026EFY2027EFY2028E
TPRRevenue+14.7%+7.1%+5.4%
EPS+37.4%+14.1%+11.7%
CPRIRevenue−20.8%−2.2%+2.5%
EPS+38.9%+51.2%+18.4%
RLRevenue+13.6%+8.8%+5.3%
EPS+35.1%+15.9%+11.0%
PVHRevenue+3.0%+1.6%+1.8%
EPS−6.6%+10.9%+12.1%
LEVIRevenue+7.5%+4.9%+6.0%
EPS+13.0%+12.0%+15.6%
DECKRevenue+9.4%+7.0%+6.8%
EPS+16.0%+6.6%+10.4%
VFCRevenue−2.4%+2.4%+3.0%
EPS+12.1%+24.5%+23.2%
NKERevenue+0.7%+0.6%+4.4%
EPS−30.5%+22.1%+28.6%
ONONRevenue+21.3%+20.3%+23.9%
EPS+101.7%+23.3%+26.4%
BIRKRevenue+12.8%+14.1%+14.1%
EPS+17.8%+21.0%+17.5%
KTBRevenue+19.4%−9.7%+4.2%
EPS+13.2%−2.7%+21.4%
CRIRevenue+2.6%+4.4%+1.3%
EPS−37.8%−2.7%+12.1%
AEORevenue+2.8%+5.6%+3.4%
EPS−19.0%+28.1%+12.0%
LULURevenue+4.7%+3.9%+4.5%
EPS−9.1%−5.7%+7.7%
ULTARevenue+9.4%+7.3%+5.6%
EPS+7.0%+11.4%+10.9%
ELRevenue+4.5%+4.1%+4.4%
EPS+63.1%+30.8%+21.9%
ANFRevenue+6.8%+3.9%+3.8%
EPS−7.7%+8.9%+9.6%

Forward fiscal years only. Blank means no analyst coverage for that year.

Tapestry told investors on August 13 that its Coach brand had grown 14% in constant currency in the fiscal fourth quarter, driven by mid-teens growth in handbag average unit retail, and that the year ahead would bring mid-single-digit revenue growth. The shares fell 15.2% in that session, from $153.66 to $130.29 — one day that accounts for most of a 21.7% decline over the past month.

What the market marked down was the growth rate, not the brand. Fiscal 2026 revenue reached $8.0bn, up 14%; the fiscal 2027 guide of $8.4bn to $8.5bn implies about 5.6%. The mechanism sits in the company's own outlook: the guide embeds a mid-20% tariff rate on US inventory receipts, net-neutral for the year but back-half weighted, which caps gross-margin expansion at roughly 30 basis points against the 180 points Tapestry delivered in the quarter it had just reported. Leather is the other squeeze: analysts expect prices for leather footwear and accessories to rise about 22% over the next year or two as tariffs, freight and scarce premium hides pass through.

Coach's meter is still running

Coach revenue was $1.64bn in the quarter, and Tapestry welcomed more than 2.5 million new consumers, roughly 11.0 million across the year, about 35% of them Gen Z. Coach has overtaken Michael Kors as the second-largest luxury handbag brand in the United States and ranks first in brand preference among 18-to-27-year-olds. Quarterly reported revenue growth did decelerate — from 21.2% year on year in the third quarter to 8.9% in the fourth — but operating margin in the fourth quarter was 23.6% and net margin 18.5%.

The fault line inside Tapestry is the second brand. Kate Spade revenue of $235m fell 7% in constant currency. Chief executive Joanne Crevoiserat conceded on August 13 that Kate Spade's "top-line progress was more gradual than we planned", even as she called the quarter one that "capped a year of strong growth."

Capri is a different business, not a peer

Capri Holdings, which owns Michael Kors and Jimmy Choo after selling Versace, carries a market value of $1.47bn against Tapestry's $24.68bn. Its June-quarter revenue fell 3.5% to $769m, Michael Kors down 7.1% and Jimmy Choo up 10.5%, and the fiscal 2027 revenue outlook came down to about $3.4bn — some $135m of cuts split between delayed inventory receipts, softer European trade and currency. The earnings guide held. "Based on our revised revenue expectations, we are taking actions to reduce operating expenses, which are enabling us to maintain our fiscal '27 earnings per share outlook of approximately $2.15," chairman and chief executive John Idol said on the August 5 call — a 40% increase financed by $70m of spending cuts rather than by demand. Gross margin did expand 200 basis points to 65.0%, inventory is down 20% year on year, and net debt has fallen to $224m from about $1.5bn. TD Cowen still cut the stock to Hold with a $17 target, citing second-quarter guidance implying an 11% Michael Kors decline.

The price paths say the same thing. Over twelve months Tapestry is up 18.6% and Capri down 37.4%; Capri's shares have fallen 33.5% since late June, with its moving averages turning negative in mid-July, three weeks before it reported. Tapestry's fall is one gap and a drift; Capri's is a slide that began before the news.

What the businesses earn and what they don't

Tapestry's de-rating is partly deserved: the growth rate being capitalised genuinely halved, and the forward multiple fell from about 20.6x in early August to 15.3x on consensus earnings of $7.98. But consensus still sits above the company's own $7.80-to-$7.90 guide, so the cut to expectations is a couple of percent against a share-price fall of more than a fifth. Ralph Lauren, guiding to 5-6% constant-currency growth on the same average-unit-retail playbook, trades at 18.0x forward. The rest of Tapestry's move belongs to the group: over the same month PVH fell 18.7%, Levi Strauss 16.8% and Ralph Lauren 10.8%, against US retail sales down 0.6% in July and sentiment sliding to a preliminary 51. Capri's 0.43x forward sales, versus Tapestry's 2.88x, is not a dislocation on the same evidence — consensus sees revenue up 2.5% in fiscal 2028 on a base that has shrunk from $5.62bn in fiscal 2023.

Europe offers the awkward counterpoint: LVMH's fashion and leather goods division returned to growth in the June quarter, ending seven quarters of decline, and Kering turned positive for the first time in three years — the leather-goods cycle turning up while the American accessible-luxury names were sold. Tapestry plans to return about $1.7bn to holders again this year, near 7% of its market value, buying shares from a customer file that added eleven million names. Whether that is a franchise on sale or a growth rate correctly re-rated will be settled in November, when the first quarter tests a guide the company set in the worst week of the year to set one.

US Army Picked BWXT's BANR Microreactor for the $2.2bn Janus Program

Hypothesis Opus 5 · Research Opus 5 · Writing Opus 5 · Prompt v1.6

Three weeks after chief executive Rex Geveden declined to discuss the economics of a pending Army competition, BWX Technologies won a place in it — and the shares had set a 52-week low the day before the award.

The decision lands on the one nuclear business in this group already being paid: backlog of $8.4bn, up 40% year over year, on a 1.7x book-to-bill, with every 2026 guidance line raised in August. Its forward earnings multiple has compressed from roughly 47x in May to 34x while consensus revenue growth accelerated.

The fuel-cycle names it gets traded alongside are a different case. Term uranium rose to $96 a pound and Cameco calls conversion and enrichment pricing elevated, so the meter is not softening; Centrus's earnings are, with operating income down 69% on a 14% revenue gain.

BWXTCCJLEUUECUUUUNXEDNNURASMROKLOLTBRMilitary MicroreactorsNaval Nuclear PropulsionDefense Nuclear ContractingSMR & Advanced NuclearUranium Fuel Cycle
TickerCompanySegmentTrend · 13mo30D1Y
The subject · what this brief is about
BWXTBWX TechnologiesNaval & Shipbuilding⚠️ Emerging Bear−9.2%−1.1%
CCJCamecoUranium⚠️ Emerging Bear+7.8%+28.5%
LEUCentrus EnergyUranium⚠️ Emerging Bear−10.7%−19.0%
Compared against · context, not the story
UECUranium EnergyUranium⚠️ Emerging Bear+17.4%+6.6%
UUUUEnergy FuelsUranium⚠️ Emerging Bear+17.6%+25.7%
NXENexGen EnergyUranium⚠️ Emerging Bear+4.6%+30.2%
DNNDenison MinesUranium⚠️ Emerging Bear+13.5%+43.4%
URAGlobal X - Uranium ETFAsset Management⚠️ Emerging Bear+8.0%+13.9%
SMRNuScale PowerAdvanced Nuclear🔴 Cont. Bear+1.8%−75.4%
OKLOOkloEmerging & Specialized Energy🔴 Cont. Bear−6.6%−47.7%
LTBRLightbridgeElectrical Equipment & Parts🔴 Cont. Bear−13.6%−50.8%

12-month price & trend

BWXT
BWX Technologies
158
+6.10 (+4.02%)
vs. prior close
Price20d50d150d
BWXT 12-month price
Naval & Shipbuilding
CCJ
Cameco
96.76
−1.11 (−1.14%)
vs. prior close
Price20d50d150d
CCJ 12-month price
Uranium
LEU
Centrus Energy
165
−9.21 (−5.28%)
vs. prior close
Price20d50d150d
LEU 12-month price
Uranium
TickerMkt capP/EP/E fwdP/SP/S fwdP/GPP/GP fwdEV/EBITDAFCF yld
BWXT$14.8B41.6x34.1x4.2x3.9x19.1x17.6x29.3x2.1%
CCJ$41.9B163.6x62.3x16.8x11.8x60.8x42.7x67.4x0.9%
LEU$3.2B67.1x68.4x6.7x6.8x28.9x29.2x34.4x-7.0%
UEC
Uranium Energy
11.70
−0.57 (−4.61%)
vs. prior close
Price20d50d150d
UEC 12-month price
Uranium
UUUU
Energy Fuels
14.28
−0.36 (−2.46%)
vs. prior close
Price20d50d150d
UUUU 12-month price
Uranium
NXE
NexGen Energy
10.02
−0.39 (−3.79%)
vs. prior close
Price20d50d150d
NXE 12-month price
Uranium
TickerMkt capP/EP/E fwdP/SP/S fwdP/GPP/GP fwdEV/EBITDAFCF yld
UEC$6.5Bn/m321.7x64.7x760.1x152.9xn/m-1.9%
UUUU$3.7Bn/m35.0x25.0x80.8x57.9xn/m-3.0%
NXE$7.2Bn/mn/mn/m-2.4%
DNN
Denison Mines
3.27
−0.12 (−3.51%)
vs. prior close
Price20d50d150d
DNN 12-month price
Uranium
URA
Global X - Uranium ETF
44.16
−1.26 (−2.77%)
vs. prior close
Price20d50d150d
URA 12-month price
Asset Management
SMR
NuScale Power
9.17
−0.10 (−1.13%)
vs. prior close
Price20d50d150d
SMR 12-month price
Advanced Nuclear
TickerMkt capP/EP/E fwdP/SP/S fwdP/GPP/GP fwdEV/EBITDAFCF yld
DNN$2.9Bn/m988.4x120.1xn/m-4.1%
URA$3.9B
SMR$2.8Bn/m261.9x91.1x432.7xn/m-27.7%
OKLO
Oklo
38.49
−2.03 (−5.01%)
vs. prior close
Price20d50d150d
OKLO 12-month price
Emerging & Specialized Energy
LTBR
Lightbridge
7.45
−0.14 (−1.84%)
vs. prior close
Price20d50d150d
LTBR 12-month price
Electrical Equipment & Parts
TickerMkt capP/EP/E fwdP/SP/S fwdP/GPP/GP fwdEV/EBITDAFCF yld
OKLO$7.3Bn/mn/m-3.8%
LTBR$297.0Mn/mn/mn/m-5.7%

Consensus projections

TickerFY2026EFY2027EFY2028E
BWXTRevenue+20.6%+9.8%+7.1%
EPS+24.1%+11.4%+11.6%
CCJRevenue+4.0%+10.9%+7.7%
EPS+7.7%+69.4%+25.2%
LEURevenue+4.8%−0.2%−9.4%
EPS−45.1%+17.7%−15.9%
UECRevenue−59.3%+272.6%+157.9%
EPS+56.8%−79.8%−647.6%
UUUURevenue+152.8%+63.3%+59.0%
EPS−52.3%−188.4%+252.4%
NXERevenue−68.7%+131.4%+32282.1%
EPS−38.6%−10.8%+37.8%
DNNRevenue+394.2%−27.3%+1699.7%
EPS−30.5%−73.1%−363.0%
SMRRevenue−26.7%+434.9%+101.2%
EPS−74.7%+33.4%−18.3%
OKLORevenue+241.0%+577.4%
EPS+50.0%+10.3%+16.5%

Forward fiscal years only. Blank means no analyst coverage for that year.

On 26 August the US Army selected BWX Technologies' BANR reactor for Project Janus, a $2.2bn program to build and operate microreactors on military bases, with a 20-megawatt unit destined for Fort Campbell, Kentucky. Five companies were named — Antares, Radiant, General Atomics, Westinghouse and BWXT. Three weeks earlier, on the company's second-quarter call, chief executive Rex Geveden had said he was optimistic about the competition but deferred detail on economics until after negotiation and a possible award.

That resolution matters beyond one base in Kentucky, because BWXT is the only name in the nuclear complex whose orders are already cash. It builds naval reactors and fuel for the US Navy's Naval Nuclear Propulsion Program on a sole-source basis — more than 420 reactors delivered over half a century — alongside commercial reactor components and medical isotopes, and it holds a $1.5bn sole-source defense fuels award and a $1.6bn ten-year high-purity depleted uranium contract from the National Nuclear Security Administration. It competes with heavy-forging suppliers, not with uranium miners.

The order book against the share price

Second-quarter revenue rose 18% to $901.6m, with Commercial Operations up 72%. Backlog reached $8.4bn, up 40%, on a trailing-twelve-month book-to-bill of 1.7x. On 3 August the company raised every 2026 guidance line: revenue to about $3.8bn, adjusted earnings before interest, taxes, depreciation and amortization to $662m-$672m, adjusted earnings per share to $4.70-$4.80 from $4.55-$4.70, and free cash flow to $345m-$360m. Gross margin fell 2.6 percentage points, and the Commercial Operations margin was guided down about a point on hiring and capacity expansion — the cost of building the plant that fills the backlog.

The shares nonetheless closed at a 52-week low of $148.26 on 25 August, down 27% over six months. Forward earnings have gone from roughly 47x in May to 34.1x, and price to gross profit from 24.7x to 19.1x, while consensus 2026 revenue growth accelerated to more than 20%.

The fuel cycle is not the problem

The premise that BWXT is being sold with a softening enrichment market does not survive the price series. Spot uranium finished August near $89.75 a pound, an 18-month high, with the term price adding $2 to $96, up nearly 11% this year. Cameco, the largest listed uranium producer and owner of 49% of Westinghouse, told investors on 31 July that conversion and enrichment pricing "remains elevated despite new supply announcements," left production guidance at 19.5-21.5 million pounds and pointed to contracts covering more than 28 million pounds of average annual deliveries. Centrus, one of two licensed US enrichers, said on 6 August that enriched-fuel prices "had very strong run-up" this year.

What is soft is Centrus's income statement. Second-quarter revenue grew 14% to $176.1m, but separative work unit volumes fell 23% while low-margin resold uranium filled the gap; operating income fell 69% and consensus 2026 earnings per share sit 45% lower year over year. Its forward multiple of 68.4x sits above its trailing 67.1x — the market expects less, not more. Cameco's six-month drawdown is a different failure: second-quarter profit slipped largely on an 18% fall in delivery volumes and a Westinghouse comparison against a one-off Czech payment, and trailing earnings fell faster than the price, so the shares are dearer than in May at 163.6x, not cheaper.

Five sessions that split the group

From 25 August to 1 September the pattern inverted: BWXT rose 6.5% off its low while Cameco fell 9.2% and Centrus 14.1%. No company news is discoverable behind the uranium leg's reversal; coverage attributed the weakness to investors trimming after a rally and to reports of renewed US-Canada trade friction. Given that August's spot move was driven substantially by trust and hedge-fund buying rather than utility contracting, the likelier reading is a squeeze unwinding.

So the ledger divides cleanly. Centrus has earned its de-rating: the enrichment price rose and its enrichment volumes did not. Cameco's is a valuation question the 2027 consensus must answer. BWXT's is the one nothing in the business explains — raised guidance, a 40% larger backlog and now a named Army program, against a multiple a quarter lower than in spring.

BWXT has told investors to expect at least one new-build nuclear equipment order before the year is out. Janus is not that order; it is a reactor the company would build and operate on a base, priced in appropriations rather than in dollars a pound.