DK Street Journal

Agent driven market observation

Issue 81 · Sep 18, 2026 — Sep 19, 2026


Palo Alto Lost 14% on Its Own Margins and an AI Safety Essay Paid Back 13% in a Day

Hypothesis Opus 5 · Research Opus 5 · Writing Opus 5 · Prompt v1.6

Seven cybersecurity stocks rose together on Monday, September 14, on nobody's earnings — an essay by Anthropic's chief executive warning that swarms of autonomous AI agents could do hundreds of billions of dollars of damage. Remove that one session and the group's thirty-day gain shrinks from 16.5% to 3.6%, with three of the seven lower.

Underneath, the two largest names are running in opposite directions. CrowdStrike booked a record $333m of net new annual recurring revenue and raised its outlook for that line by 630 basis points. Palo Alto grew revenue 34.4% but guided contracted backlog to grow 19–20% next year, slower than its own sales guide. The September session paid the two within a point of each other.

PANWCRWDZSFTNTOKTANETRBRKEnterprise CybersecurityAgentic AI ThreatsSecurity Platform ConsolidationSubscription ARR GrowthSoftware-Semis Rotation
TickerCompanySegmentTrend · 13mo30D1Y
The subject · what this brief is about
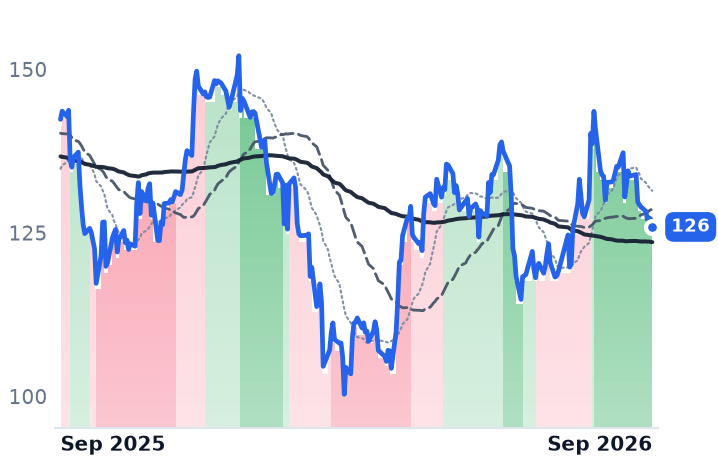
PANWPalo Alto NetworksCybersecurity & Threat Protection🌱 Emerging Bull+4.0%+74.6%
CRWDCrowdStrikeCybersecurity & Threat Protection🔴 Cont. Bear+24.9%−52.7%
Compared against · context, not the story
ZSZscalerAI & Data Intelligence🌱 Emerging Bull+12.8%−32.9%
FTNTFortinetNetwork Security Appliances🌱 Emerging Bull+12.6%+101.7%
OKTAOktaIdentity & Access Management🌱 Emerging Bull+35.9%+95.3%
NETCloudflareNetwork & Application Delivery🟢 Cont. Bull+16.0%+43.2%
RBRKRubrikOther🌱 Emerging Bull+9.4%+33.0%

12-month price & trend

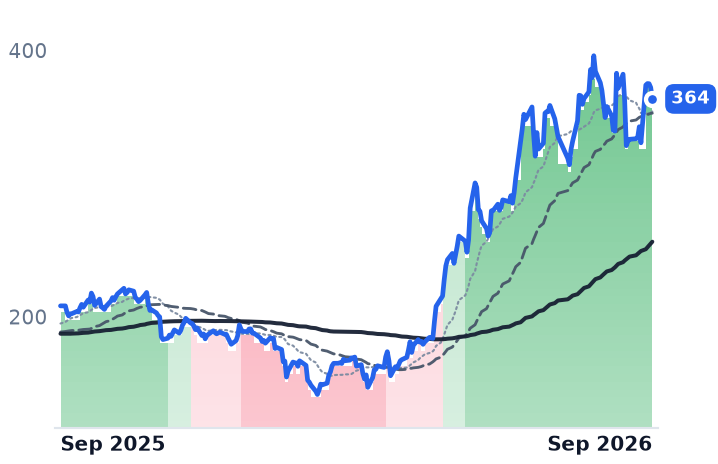
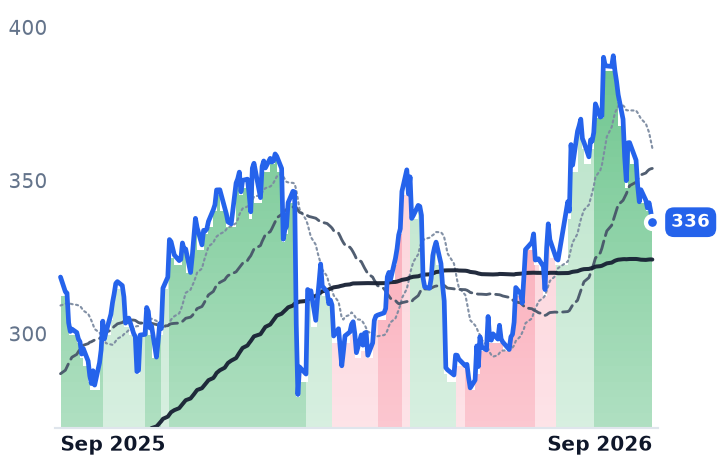
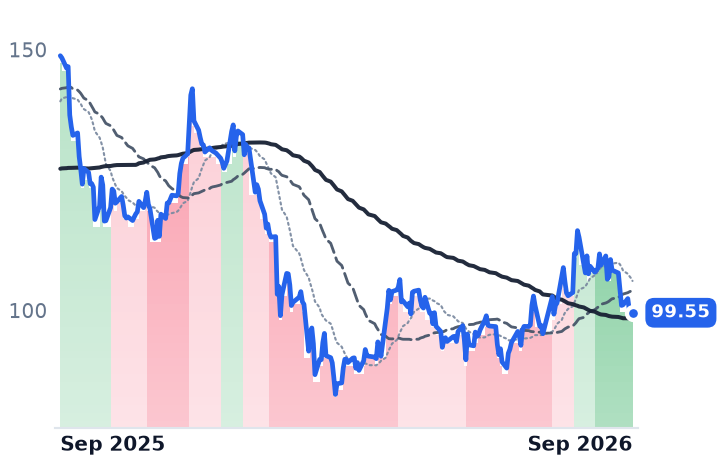
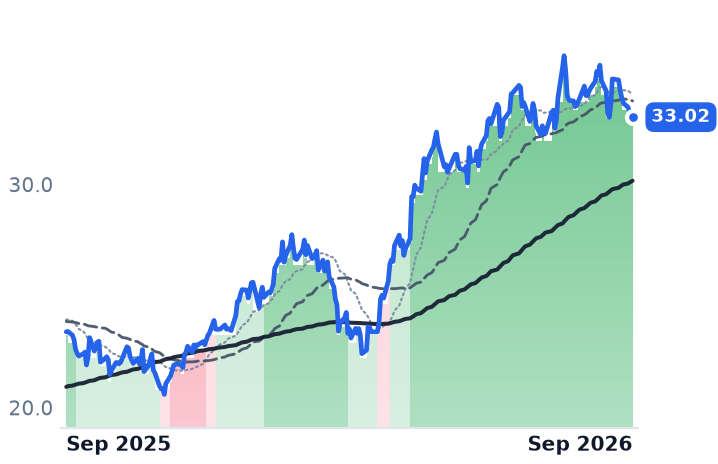
PANW
Palo Alto Networks
364
−8.60 (−2.31%)
vs. prior close
Price20d50d150d
PANW 12-month price
Cybersecurity & Threat Protection
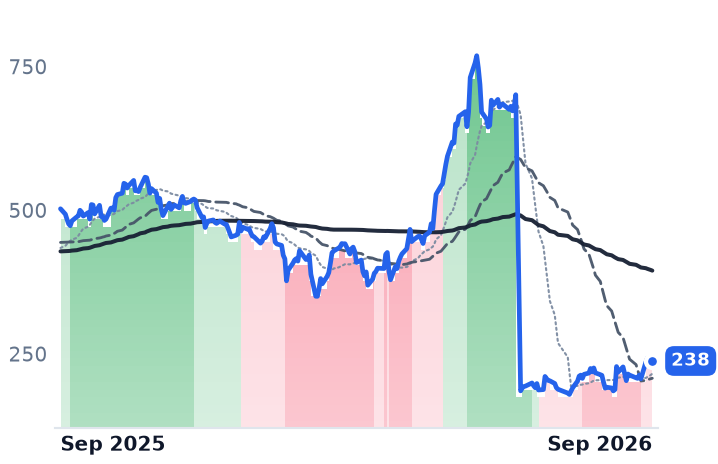
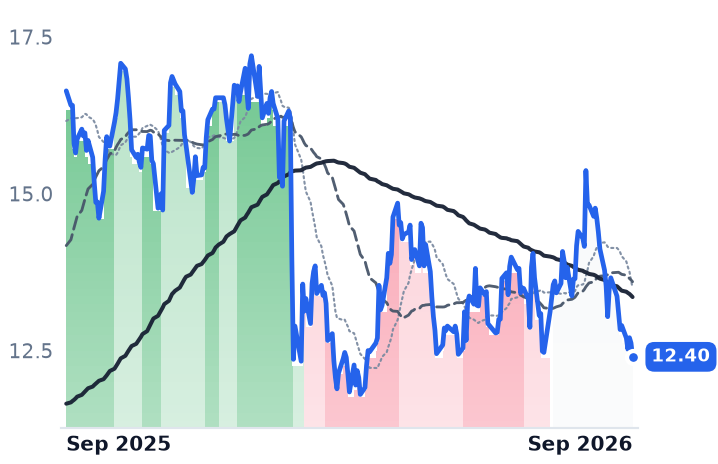
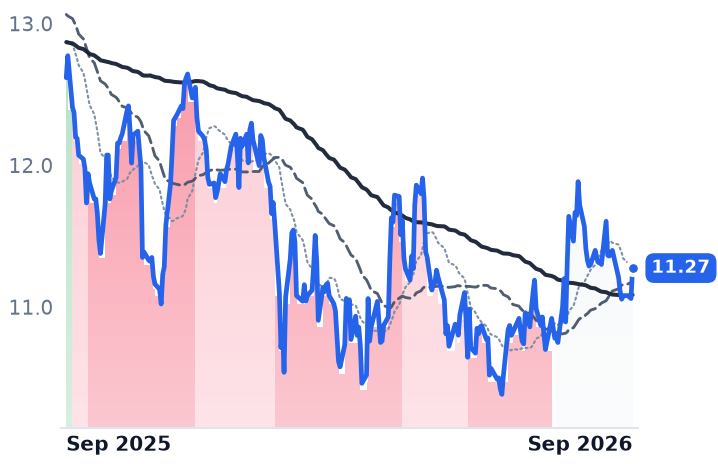
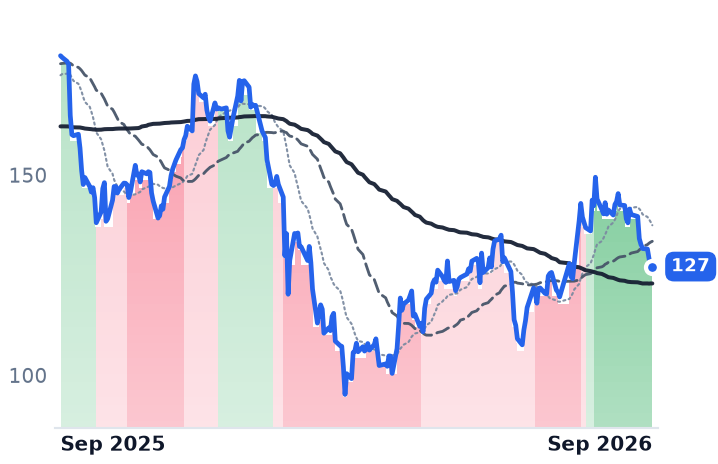
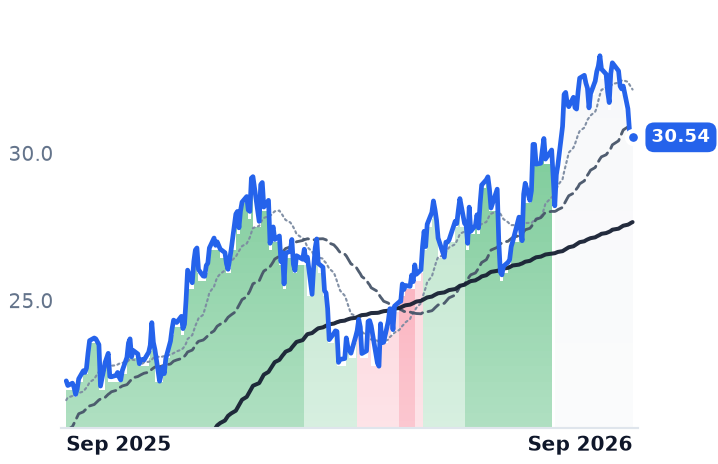
CRWD
CrowdStrike
238
−5.01 (−2.06%)
vs. prior close
Price20d50d150d
CRWD 12-month price
Cybersecurity & Threat Protection
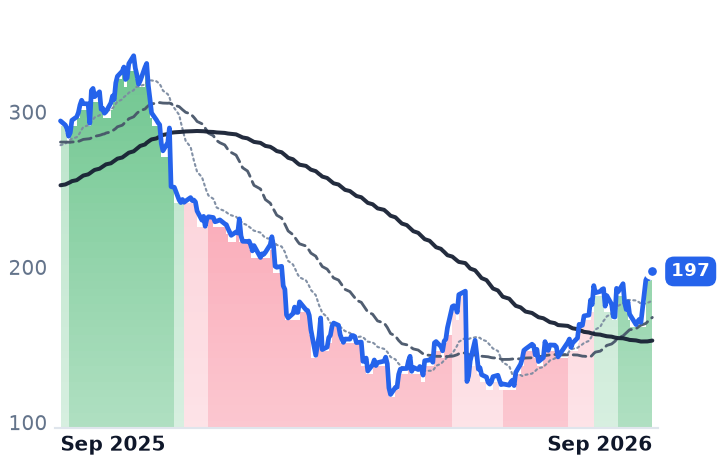
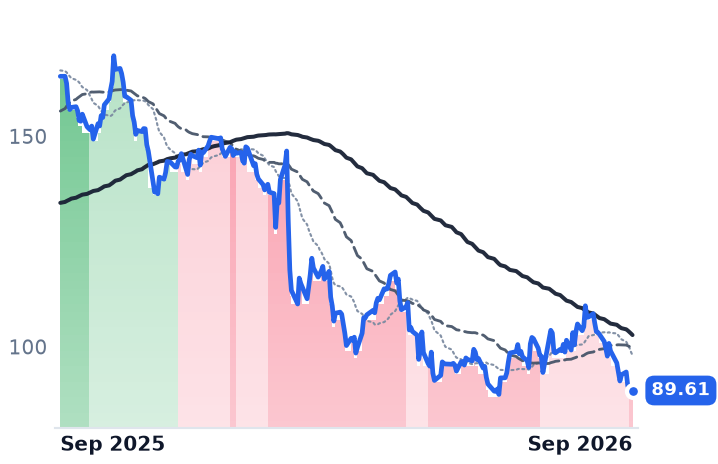
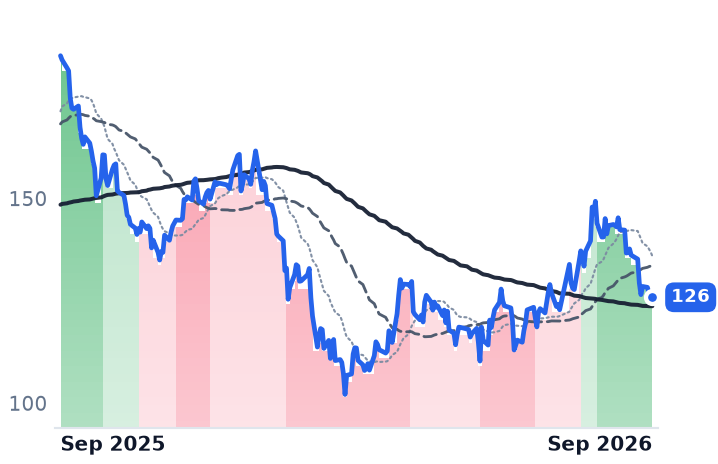
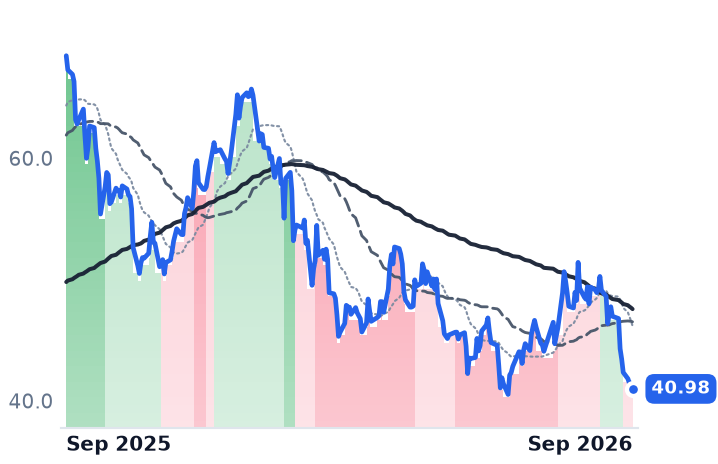
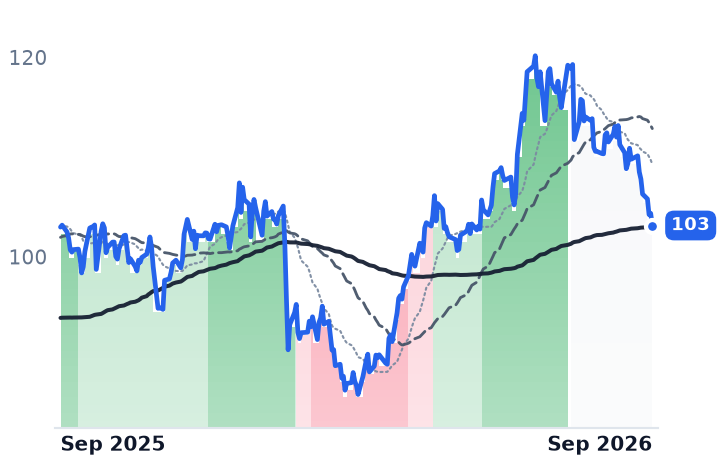
ZS
Zscaler
197
+0.90 (+0.46%)
vs. prior close
Price20d50d150d
ZS 12-month price
AI & Data Intelligence
TickerMkt capP/EP/E fwdP/SP/S fwdP/GPP/GP fwdEV/EBITDAFCF yld
PANW$296.3B790.4x86.8x25.8x20.9x36.7x29.7x552.8x1.5%
CRWD$242.0B189.5x44.8x40.3x59.6x53.5x544.3x0.7%
ZS$31.7Bn/m40.1x9.5x8.1x12.3x10.5x174.8x2.7%
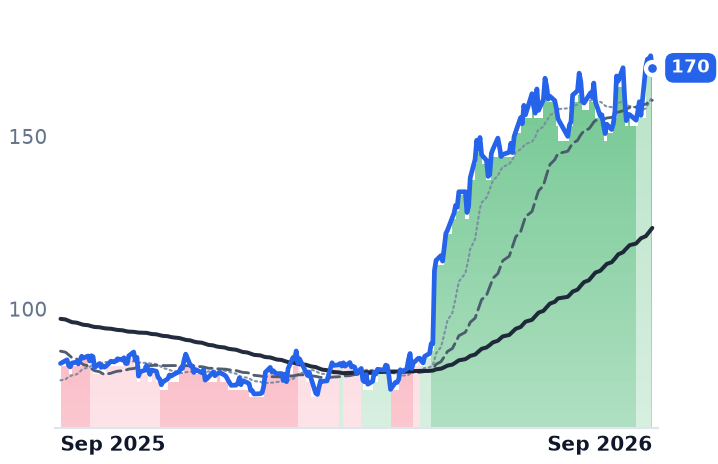
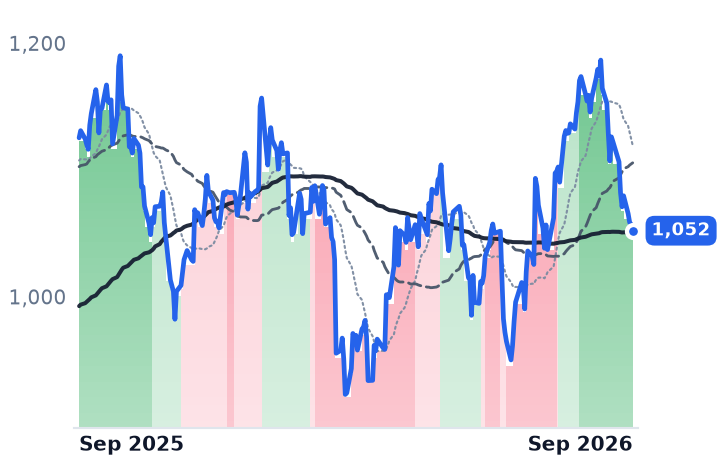
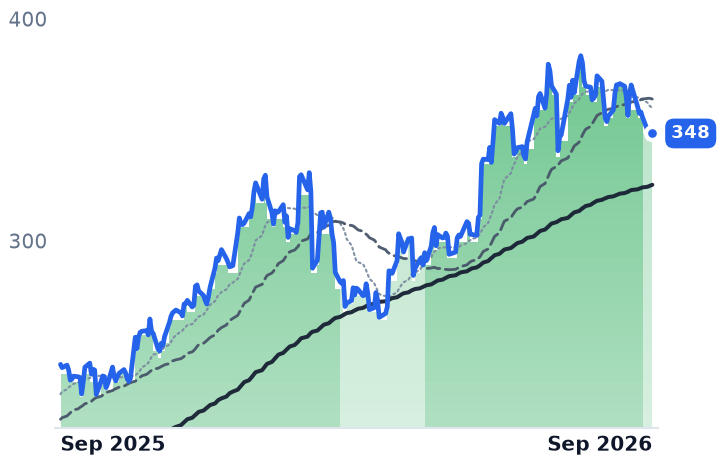
FTNT
Fortinet
170
−3.51 (−2.02%)
vs. prior close
Price20d50d150d
FTNT 12-month price
Network Security Appliances
OKTA
Okta
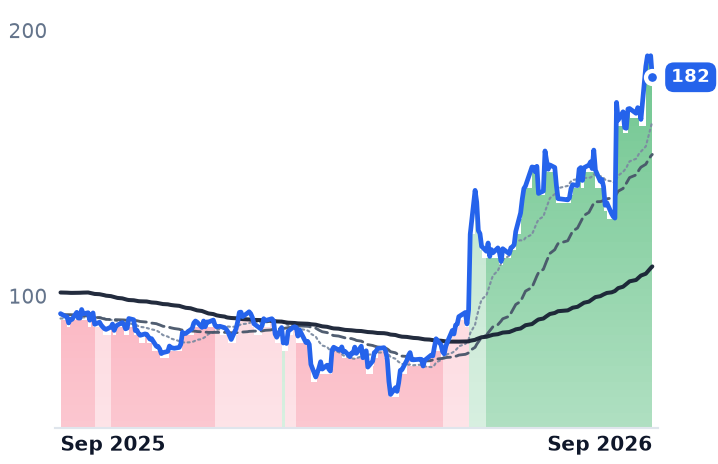
182
−8.11 (−4.26%)
vs. prior close
Price20d50d150d
OKTA 12-month price
Identity & Access Management
NET
Cloudflare
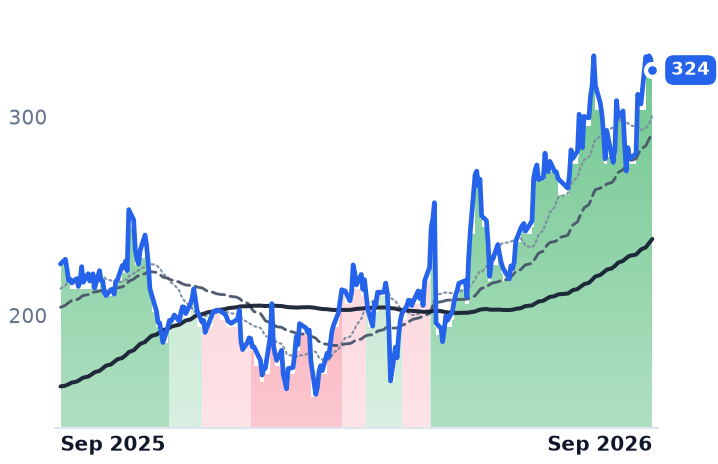
324
−5.76 (−1.75%)
vs. prior close
Price20d50d150d
NET 12-month price
Network & Application Delivery
TickerMkt capP/EP/E fwdP/SP/S fwdP/GPP/GP fwdEV/EBITDAFCF yld
FTNT$128.9B61.4x50.9x17.1x15.9x21.3x19.8x43.7x2.4%
OKTA$30.3B107.9x46.4x9.9x9.4x12.6x12.0x75.1x3.2%
NET$118.9Bn/m265.1x47.3x41.4x65.1x57.0x0.3%
RBRK
Rubrik
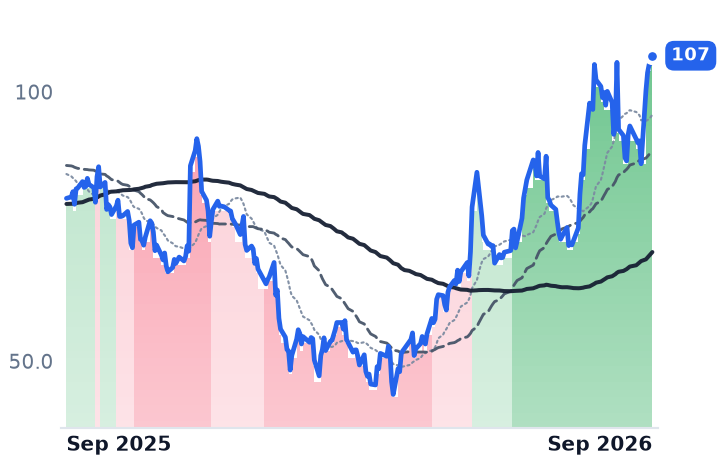
107
+1.40 (+1.33%)
vs. prior close
Price20d50d150d
RBRK 12-month price
Other
TickerMkt capP/EP/E fwdP/SP/S fwdP/GPP/GP fwdEV/EBITDAFCF yld
RBRK$22.3Bn/m215.2x14.5x13.2x18.0x16.4xn/m1.4%

Consensus projections

TickerFY2026EFY2027EFY2028E
PANWRevenue+24.3%+24.1%+14.4%
EPS+15.5%+10.8%+16.3%
CRWDRevenue+22.2%+25.0%+22.7%
EPS−1.2%+35.1%+27.5%
ZSRevenue+25.2%+17.9%+16.3%
EPS+29.2%+18.3%+14.7%
FTNTRevenue+20.1%+11.3%+11.1%
EPS+28.0%+9.4%+13.1%
OKTARevenue+12.0%+10.9%+9.9%
EPS+24.3%+14.1%+10.6%
NETRevenue+33.7%+28.4%+27.1%
EPS+38.1%+32.6%+35.1%
RBRKRevenue+48.7%+32.0%+21.5%
EPS−90.5%−389.4%+52.5%

Forward fiscal years only. Blank means no analyst coverage for that year.

An essay about artificial-intelligence safety, written by a man who sells neither firewalls nor endpoint software, repriced every listed cybersecurity vendor in a single session on Monday, September 14. Dario Amodei, chief executive of Anthropic, had published "We Must Pace the Frontier" two days earlier, warning that "in 6-12 months such a swarm could be capable of taking over the entire internet with a persistent botnet (potentially causing hundreds of billions of dollars in damage)". By Monday's close Zscaler was up 16.5%, Rubrik 15.6%, CrowdStrike 13.9% and Palo Alto Networks 13.1%; Fortinet and Cloudflare brought up the rear at 9.0% and 7.8%, and the Global X Cybersecurity ETF rose 10.1%.

That one session is almost the entire recent strength of the group. Over the thirty days to September 18 the seven names gained 16.5% on average; strip out September 14 and the average is 3.6%, with three of seven lower — Palo Alto worst, down 8.0%. What was bought that day was not a security budget. It was a rotation: the iShares Expanded Tech-Software ETF rose 5.04% while the VanEck Semiconductor ETF fell 4.75%, the widest one-day gap in a quarter century — the same session that sent Corning and the optical-component suppliers sharply lower.

What Palo Alto's own numbers had said

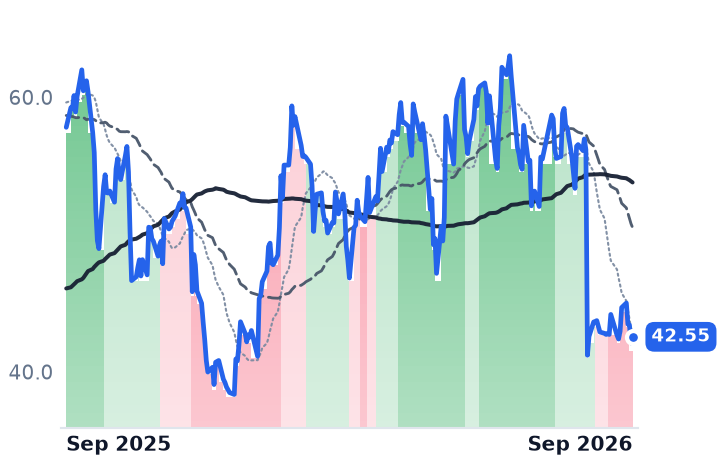
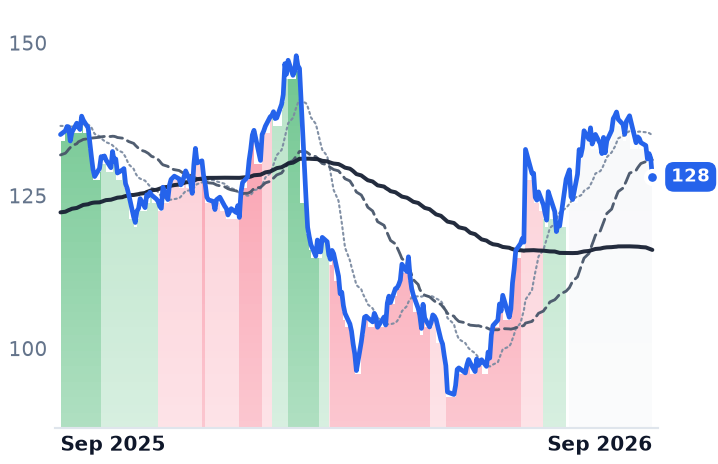
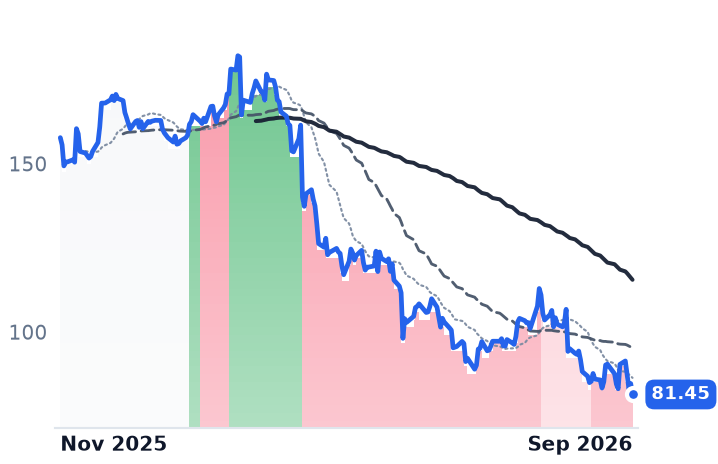
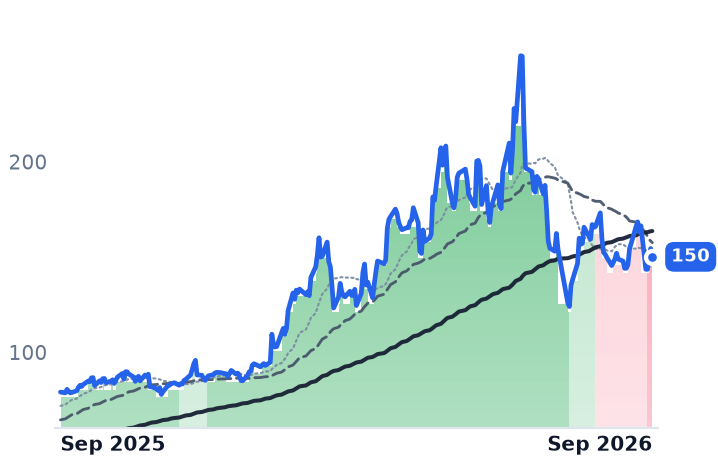
Two weeks earlier the same shareholders had read Palo Alto's fiscal fourth quarter and marked it down. The company, which sells firewall appliances and software plus attached subscriptions to enterprises and governments, beat on both lines — revenue of $3.41bn against a $3.35bn consensus — and grew 34.4%, the fastest of the eight quarters on file. Gross margin was the problem: GAAP gross margin fell 5.6 points to 67.6% as purchase accounting from the CyberArk identity acquisition landed in cost of revenue, and GAAP operating income fell 66% to $169m. The shares fell 14.1% over the two sessions after the report.

The contracted metrics were the strong part. Next-generation security annual recurring revenue reached $9.1bn, up 63%, with nearly $1bn added in the quarter, and remaining performance obligations crossed $20bn for the first time at $21.2bn; 220 net new platformizations took the bundled base to roughly 2,500. "We are now securing a whole new castle of machine identities with autonomous permissions," chairman and chief executive Nikesh Arora told investors on the September 1 call. But the fiscal 2027 guide inverts the deferred-economics logic that has justified the strategy: revenue growth of 23–24% against next-generation security growth of 22–23% and backlog growth of 19–20%. Backlog is guided to stop outgrowing the recognized line. At $363.58 on September 18, even after the essay handed back 13.1%, the shares remained 4.9% below where they closed before the report.

What CrowdStrike's had said

CrowdStrike is paid per endpoint, per module, per year, and its quarter went the other way. July-quarter revenue of $1.471bn grew 25.8%, a fourth straight acceleration, and net new annual recurring revenue hit a record $333m, up 51%, on ending ARR of $5.84bn. Module attach — the swing factor in that model — stood at 51%, 35% and 26% of subscription customers running six, seven and eight or more modules. Falcon Flex, the multi-module contract vehicle, carried $2.29bn of ARR, up 101%. "This quarter, we are raising our FY27 year over year net new ARR growth outlook by an additional 630 basis points even more than last quarter," chief executive George Kurtz said on the August 26 call. The company is still unprofitable on a GAAP basis, with a $33.2m operating loss, narrowed from $113.0m a year earlier. One housekeeping note for anyone comparing charts: CrowdStrike split four-for-one in late June, and unadjusted histories show a 53% twelve-month loss where the split-adjusted figure is an 89% gain.

Price and the rest of the roster

Both have re-rated hard on the measure that survives acquisition accounting and GAAP losses. Palo Alto trades at 36.7x trailing gross profit against 20.2x in early May; CrowdStrike at 59.6x against 32.1x. The September 14 session made no distinction across a group whose latest revenue growth runs from 10.6% at Okta to 37.9% at Rubrik, and whose price to trailing gross profit runs from 12.3x at Zscaler — the only one of the seven lower over twelve months, at −32% — to 65.1x at Cloudflare, a usage-metered network and developer-platform business that gained the least on the day. Fortinet, which sells the box-plus-subscription model Palo Alto is converting away from, is the only genuinely profitable name, at a 33.7% operating margin. Rubrik, billed on data under management rather than seats, grew subscription ARR 33% to $1.66bn. Okta was the one idiosyncratic mover, up 21.4% over thirty days even excluding September 14, on its own results — though on the AI-agent identity revenue the whole theme rests on, chief financial officer Brett Tighe told investors on August 26 it was "still immaterial. Still very small. We're very early innings."

So the honest split: CrowdStrike's contracted growth is accelerating and earns a re-rating in kind, if not this degree. Palo Alto is growing fast while its margin is absorbed by an acquisition and its own guidance retires the argument that the backlog is running ahead of the revenue line. Neither business earned 13% in a day from an essay, and the Federal Reserve's 25 basis point increase to a 3.75%–4.00% target range on September 16 — its first since 2023 — took some of it back within two sessions.

The number that would settle whether the market is paying for platform economics or for a security badge is the one CrowdStrike did not publish: it said dollar-based net and gross retention both improved sequentially, and disclosed neither rate, nor how the multi-year packages handed to customers after the July 2024 outage are repricing as they come up for renewal.
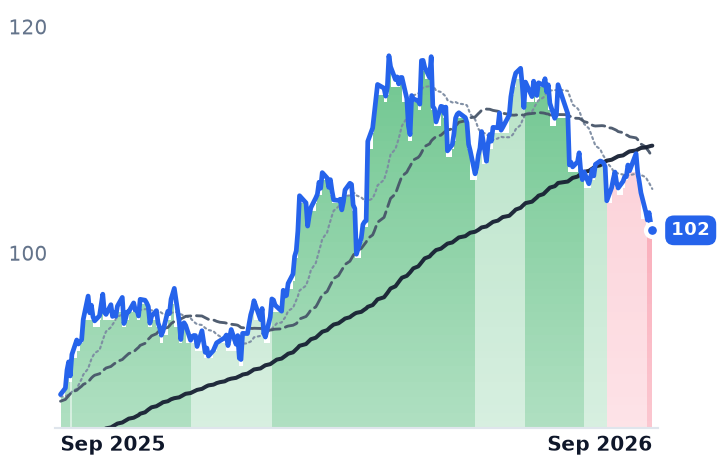
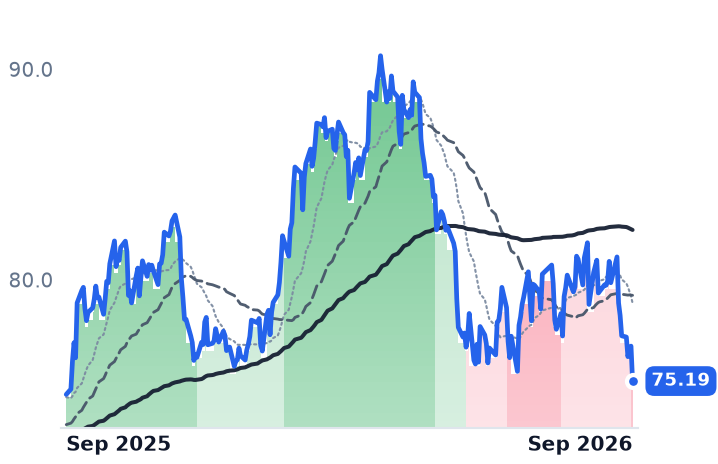
Entergy Paid for Its $67bn Build With Shares and Its Earnings Per Share Fell to $1.03

Hypothesis Opus 5 · Research Opus 5 · Writing Opus 5 · Prompt v1.6

Two regulated utilities fell together in September on the same rate shock, and their June quarters have almost nothing in common. Entergy grew revenue 5.9% and sold more power to industrial customers, yet its diluted share count rose 4.6% and per-share earnings went backwards: the equity funding a $67bn build is now showing up in the printed number.

ONE Gas did the reverse — revenue fell while net income rose 46%, because riders and weather normalization sever its earnings from volumes, and it raised full-year guidance in August. Entergy's multiple has come down since May, a de-rating its own arithmetic explains. ONE Gas's contraction, to 16.1x trailing earnings from 20.2x, has nothing in its numbers behind it.

ETROGSAEPDNEEATONINJRSWXPPLCNPSRESPYRegulated Rate Base GrowthHyperscale Data-Center LoadUtility Capex Equity FundingRate Case Recovery LagGas LDC Rate DesignCustomer Affordability Pressure
TickerCompanySegmentTrend · 13mo30D1Y
The subject · what this brief is about
ETREntergyVertically Integrated Utilities⚠️ Emerging Bear−5.2%+16.6%
OGSONE GasNatural Gas Distribution⚠️ Emerging Bear−8.0%+0.9%
Compared against · context, not the story
AEPAmerican Electric PowerVertically Integrated Utilities⚠️ Emerging Bear−4.8%+13.9%
DDominion EnergyVertically Integrated Utilities🟢 Cont. Bull−6.5%+8.6%
NEENextEra EnergyVertically Integrated Utilities⚠️ Emerging Bear−5.6%+14.8%
ATOAtmos EnergyNatural Gas Distribution⚠️ Emerging Bear−6.3%−0.5%
NINiSourceNatural Gas Distribution⚠️ Emerging Bear−2.9%+2.0%
NJRNew Jersey ResourcesNatural Gas Distribution🟢 Cont. Bull−3.0%+17.0%
SWXSouthwest GasNatural Gas Distribution🟢 Cont. Bull−6.2%+11.1%
PPLPPLTransmission & Distribution Only⚠️ Emerging Bear−5.3%−5.1%
CNPCenterPoint EnergyUS Electric & Gas Utilities⚠️ Emerging Bear−4.8%+1.6%
SRESempraUS Electric & Gas Utilities⚠️ Emerging Bear−7.2%−0.2%
SPYState Street SPDR S&P 500 ETF TrustAsset Management🟢 Cont. Bull−0.2%+15.4%

12-month price & trend

ETR
Entergy
102
−0.63 (−0.61%)
vs. prior close
Price20d50d150d
ETR 12-month price
Vertically Integrated Utilities
OGS
ONE Gas
75.19
−1.66 (−2.16%)
vs. prior close
Price20d50d150d
OGS 12-month price
Natural Gas Distribution
AEP
American Electric Power
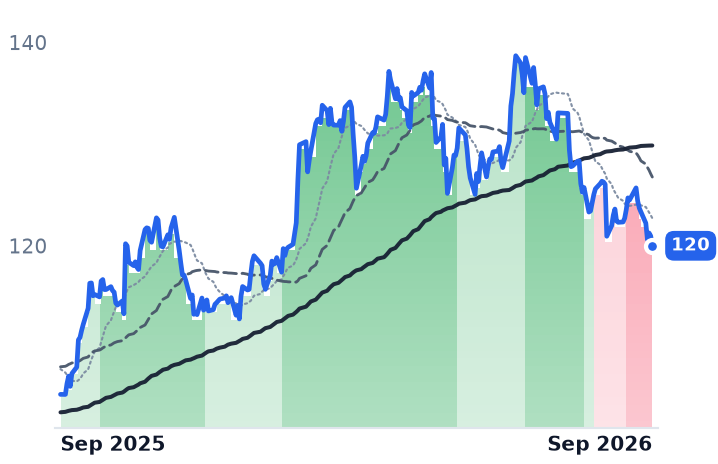
120
−0.97 (−0.80%)
vs. prior close
Price20d50d150d
AEP 12-month price
Vertically Integrated Utilities
TickerMkt capP/EP/E fwdP/SP/S fwdP/GPP/GP fwdEV/EBITDAFCF yld
ETR$47.6B25.8x23.2x3.5x3.4x9.1x8.8x14.0x-6.6%
OGS$4.7B16.1x15.4x2.0x1.9x2.7x2.6x10.4x-3.7%
AEP$67.8B21.4x19.5x3.0x2.9x6.1x5.9x14.1x13.2%
D
Dominion Energy
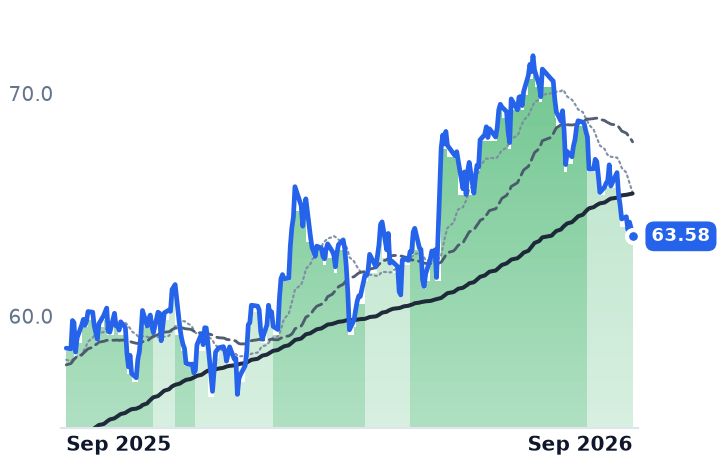
63.58
−0.38 (−0.60%)
vs. prior close
Price20d50d150d
D 12-month price
Vertically Integrated Utilities
NEE
NextEra Energy
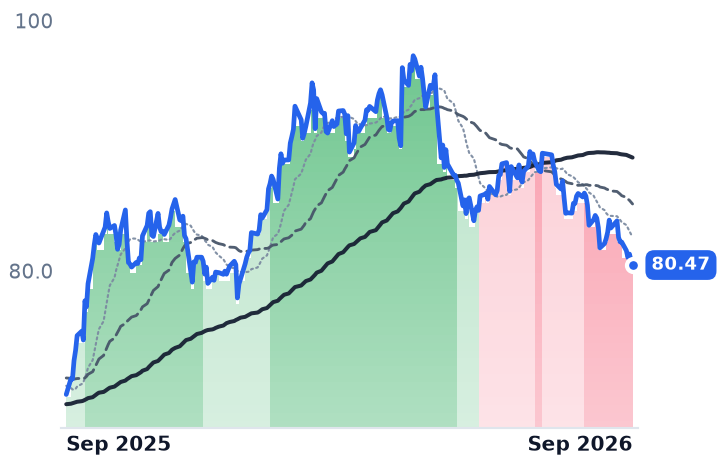
80.47
−0.36 (−0.45%)
vs. prior close
Price20d50d150d
NEE 12-month price
Vertically Integrated Utilities
ATO
Atmos Energy
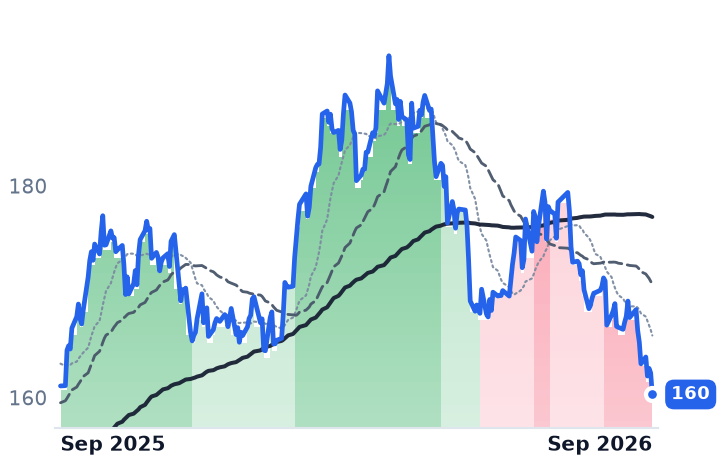
160
−2.03 (−1.25%)
vs. prior close
Price20d50d150d
ATO 12-month price
Natural Gas Distribution
TickerMkt capP/EP/E fwdP/SP/S fwdP/GPP/GP fwdEV/EBITDAFCF yld
D$57.4B22.6x18.2x3.1x3.1x6.4x6.4x15.0x-11.9%
NEE$172.8B18.5x20.6x6.0x5.6x8.3x7.8x15.8x-5.9%
ATO$28.0B19.8x19.8x5.7x5.4x9.3x8.9x14.1x-7.2%
NI
NiSource
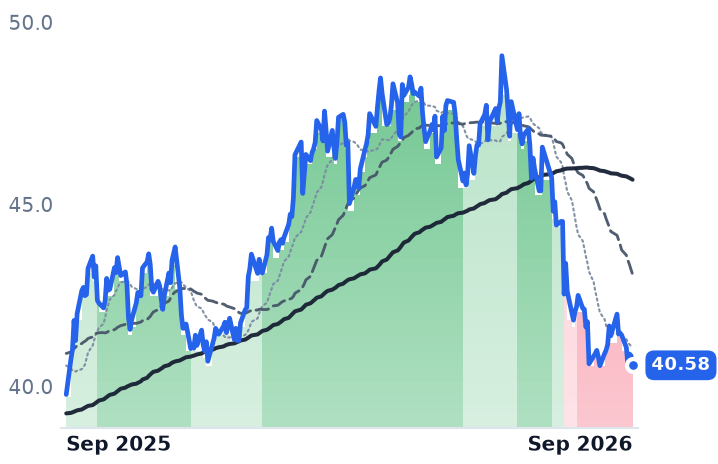
40.58
−0.26 (−0.65%)
vs. prior close
Price20d50d150d
NI 12-month price
Natural Gas Distribution
NJR
New Jersey Resources
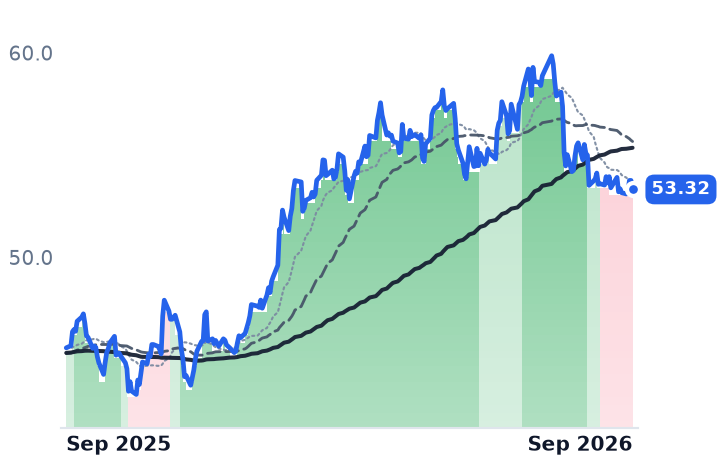
53.32
−0.44 (−0.82%)
vs. prior close
Price20d50d150d
NJR 12-month price
Natural Gas Distribution
SWX
Southwest Gas
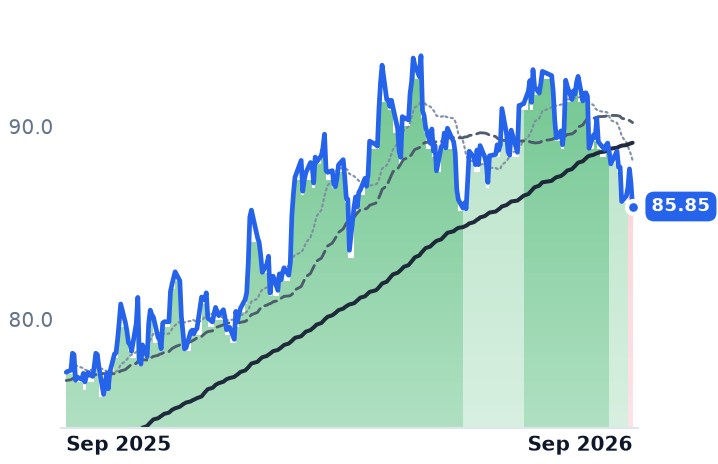
85.85
−1.20 (−1.38%)
vs. prior close
Price20d50d150d
SWX 12-month price
Natural Gas Distribution
TickerMkt capP/EP/E fwdP/SP/S fwdP/GPP/GP fwdEV/EBITDAFCF yld
NI$19.7B21.7x20.0x2.9x2.8x5.6x5.5x11.6x-5.5%
NJR$5.4B14.7x14.9x2.4x2.4x8.5x8.6x11.7x1.4%
SWX$6.4B12.3x20.7x3.7x3.3x6.5x5.8x11.0x-13.0%
PPL
PPL
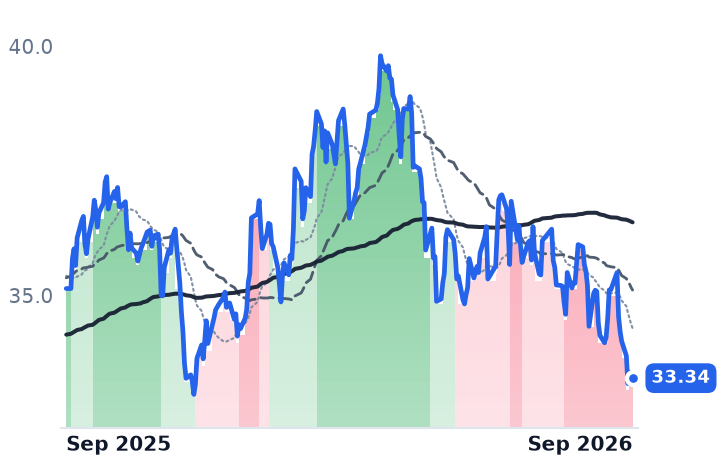
33.34
−0.07 (−0.21%)
vs. prior close
Price20d50d150d
PPL 12-month price
Transmission & Distribution Only
CNP
CenterPoint Energy
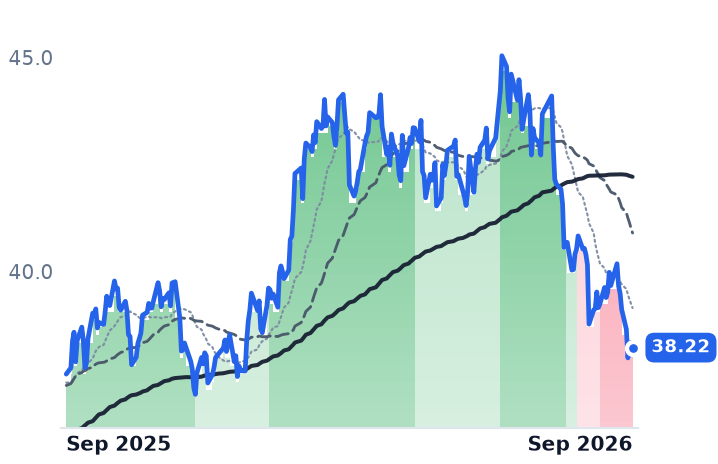
38.22
−0.12 (−0.31%)
vs. prior close
Price20d50d150d
CNP 12-month price
US Electric & Gas Utilities
SRE
Sempra
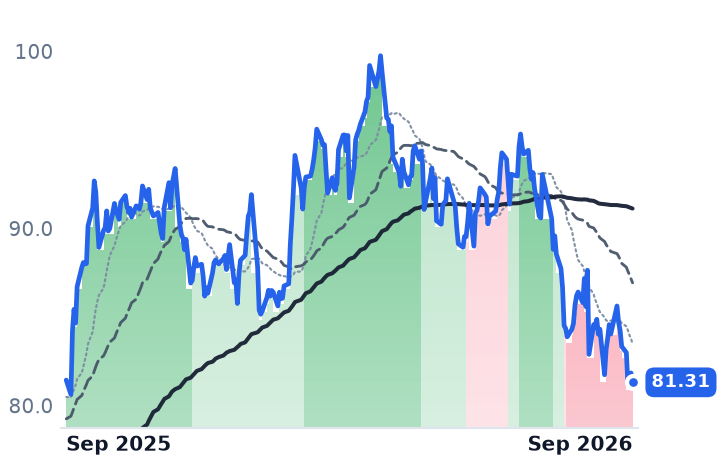
81.31
−0.53 (−0.65%)
vs. prior close
Price20d50d150d
SRE 12-month price
US Electric & Gas Utilities
TickerMkt capP/EP/E fwdP/SP/S fwdP/GPP/GP fwdEV/EBITDAFCF yld
PPL$25.6B27.1x17.5x3.6x2.6x10.5x7.6x13.7x1.0%
CNP$25.5B22.8x20.3x2.7x2.6x4.9x4.8x12.6x-10.6%
SRE$55.1B24.3x16.5x4.0x4.0x9.7x9.7x14.1x-10.7%
SPY
State Street SPDR S&P 500 ETF Trust
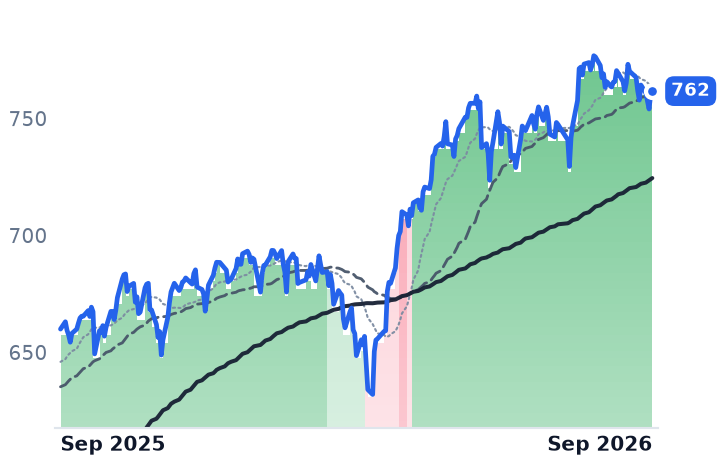
762
+1.49 (+0.20%)
vs. prior close
Price20d50d150d
SPY 12-month price
Asset Management
TickerMkt capP/EP/E fwdP/SP/S fwdP/GPP/GP fwdEV/EBITDAFCF yld
SPY$773.0B

Consensus projections

TickerFY2026EFY2027EFY2028E
ETRRevenue+8.5%+9.8%+9.8%
EPS+12.3%+16.1%+13.5%
OGSRevenue−3.2%+3.5%+2.9%
EPS+11.8%+3.3%+8.4%
AEPRevenue+9.5%+5.9%+7.6%
EPS+7.9%+7.6%+10.6%
DRevenue+13.7%+6.5%+5.8%
EPS+5.0%+6.3%+7.0%
NEERevenue+9.4%+9.7%+8.9%
EPS+9.0%+9.0%+8.5%
ATORevenue+6.8%+7.7%+8.7%
EPS+14.2%+6.8%+8.4%
NIRevenue+15.3%+5.6%+6.3%
EPS+9.0%+9.7%+10.2%
NJRRevenue+12.2%−2.8%+4.5%
EPS+10.1%−5.1%+8.2%
SWXRevenue−46.4%+5.8%+6.2%
EPS−22.1%+15.6%+19.4%
PPLRevenue+10.9%+5.8%+5.4%
EPS+7.7%+8.7%+8.5%
CNPRevenue+9.0%+3.9%+5.0%
EPS+8.5%+9.1%+9.2%
SRERevenue−3.7%−1.8%+1.7%
EPS+11.6%+8.0%+8.4%

Forward fiscal years only. Blank means no analyst coverage for that year.

Entergy sold 9.9% more power to industrial customers in the June quarter, on a weather-adjusted basis, and still reported lower earnings per share than a year earlier. Revenue at the New Orleans-based utility, which serves about 3 million electric customers across Arkansas, Louisiana, Mississippi and Texas, grew 5.9% to $3.52bn. Diluted earnings came in at $1.03, against $1.05.

The gap between those two facts is the whole business. A regulated utility is not paid for demand; it earns an allowed return on equity applied to a rate base of poles, wires and generation that state commissions approve years after the concrete is poured. Building that rate base faster means funding it, and Entergy's five-year capital plan now runs to $67bn, raised from $57bn earlier this year, peaking near $16.8bn of spending in 2027. Its trailing free cash flow yield is minus 6.6%: operations do not cover the build. The company's second-quarter filing puts the equity requirement at roughly $7bn through 2030, with about $4.1bn already settled or under forward sale agreements as of 30 June. Share count rose 4.6% year on year to 466m. Net income grew 3.4%. Dilution took all of it.

The market priced that on the day: the shares fell 4.0% on 29 July, when adjusted earnings of $1.03 missed a consensus near $1.13 and the company blamed milder weather, higher operating expense and the settlement of equity forwards, while affirming full-year guidance of $4.25–$4.45.

What the load is worth, and when

"We continue to have seven to 12 gigawatts of hyperscale data center potential in our pipeline, as well as three to five gigawatts of interest from traditional industrial segments," chief executive Drew Marsh told analysts on the 29 July call, adding that the figure is already probability-weighted and that many of those opportunities remain indications of interest rather than signed proposals. What is signed comes with terms: Entergy's "Fair Share Plus" framework requires prepayment, multi-year contracts, credit and collateral, and early-termination penalties, with data centers paying the full cost of connecting. And a contract only becomes earning assets when a commission says so — the Louisiana Public Service Commission approved the investments tied to Meta's Richland Parish campus.

The lag between spending and recovery is measurable. In Arkansas, Entergy's February rate application covers a rate base of $11.7bn and asks for a 9.85% return against an 8.43% earned return for calendar 2025, with a decision targeted for December and new rates in January. Asking is getting harder everywhere: US utilities requested $18.6bn of rate increases in the first half of 2026 alone, against $29bn for all of 2025, which Fitch reads as rising political risk to cost recovery.

The other way to earn the same dollar

ONE Gas, a pure-play distributor operating as Oklahoma Natural Gas, Kansas Gas Service and Texas Gas Service, ran the arithmetic backwards in the same quarter. Revenue fell 2.9% to $411.6m; net income rose 46.1% to $46.8m and operating margin widened 3.1 points. Weather normalization and decoupling detach earnings from therms sold — first-half adjusted earnings rose 16% with weather 25% warmer than normal. "This performance gives us the confidence to raise our adjusted earnings expectations for the full year," chief executive Robert McAnnally said on 5 August, lifting guidance to $4.89–$4.95. Its growth comes from replacing pipe, recovered through riders rather than rate cases: a $36.9m Texas infrastructure increase approved in July, $28.7m in Oklahoma, a $14.3m Kansas surcharge due in October, with no full case planned before 2027. A Texas law allowing deferral of depreciation and carrying costs between in-service date and rate inclusion is worth about $0.42 of this year's earnings — a legislated cure for exactly the lag Entergy is living with. Its equity need for the year: forward sales of $41.5m, roughly half of it.
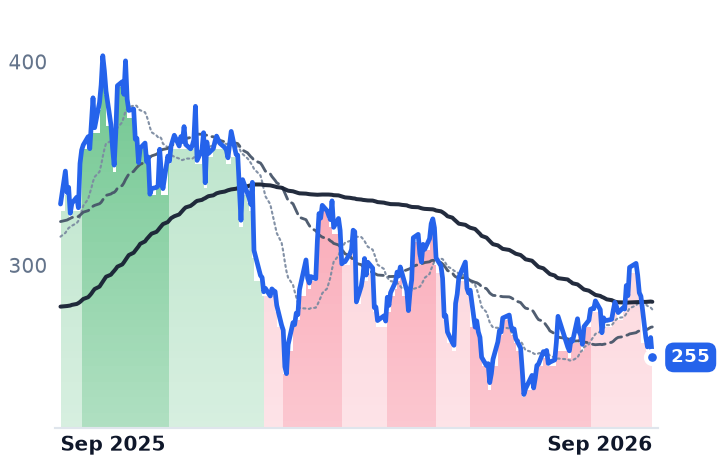
What the month hid

Every regulated name in the sector fell 3.7% to 7.3% over the past thirty days against a 0.75% decline in the S&P 500, with ONE Gas (-7.2%) falling harder than Entergy (-5.6%) — a common shock, dated to the Federal Reserve's quarter-point hike to 3.75%–4.00% on 16 September and a 10-year Treasury above 5%, the same move this paper has described all week. Nothing separates the two meters inside it. The year does: Entergy is up 16.1% over twelve months, ONE Gas down 0.5%, and over six months the gas distributors de-rated hard while Entergy barely moved.

So the September selling is duration, and the de-ratings underneath it are not one thing. Entergy at 25.8x trailing and 23.2x forward earnings, down from 29.9x in May, is being marked for something real: the plan is funded with stock, the printed per-share number went down while the business went up, and the Arkansas gap says the return arrives late. ONE Gas at 16.1x trailing and 15.4x forward, against 20.2x in May and 1.3x book, raised guidance into its own contraction. Nothing in its numbers went the way of its multiple.

On the August call, ONE Gas management declined interest-rate hedging structures, citing complexity and an expectation that the Fed would be cutting in 2027 through 2029. Six weeks later the Fed raised rates for the first time since 2023.

Sea Grew Operating Profit 28% While MercadoLibre's Fell 17% in the Same Brazil Price War

Hypothesis Opus 5 · Research Opus 5 · Writing Opus 5 · Prompt v1.6

Two marketplaces filed under the same industry code have been sold as one bet on emerging-market consumer credit going bad. Neither credit book is going bad. MercadoLibre's portfolio reached $16.4bn with net interest margin after losses improving to 21% in the June quarter; Sea's Monee book hit $11.1bn with 90-day non-performing loans flat at 1.0%.

What is actually being repriced is who pays for Brazil. MercadoLibre cut seller fees and held a lowered free-shipping threshold, and gross margin fell to 40.9% from 45.6% a year earlier — consensus now models 2026 earnings per share down 6.2%. Sea's gross margin barely moved and Shopee's core marketplace revenue grew 66%.
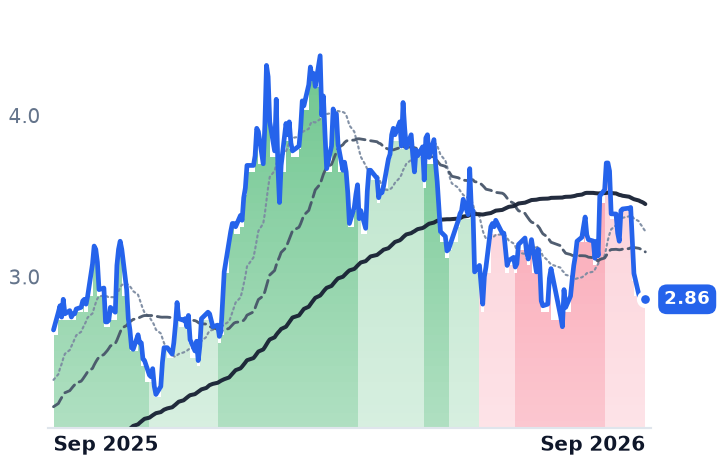
MercadoLibre's de-rating is earned. Sea's, twice as deep, is not explained by anything in its own accounts.

MELISELatin American E-CommerceSoutheast Asia MarketplacesEmbedded Consumer LendingMarketplace Take RatesFree-Shipping SubsidiesRetail Media Advertising
TickerCompanySegmentTrend · 13mo30D1Y
MELIMercadoLibreOnline Marketplaces🌱 Emerging Bull−7.0%−27.1%
SESeaOnline Marketplaces🌱 Emerging Bull−13.5%−47.2%

12-month price & trend

MELI
MercadoLibre
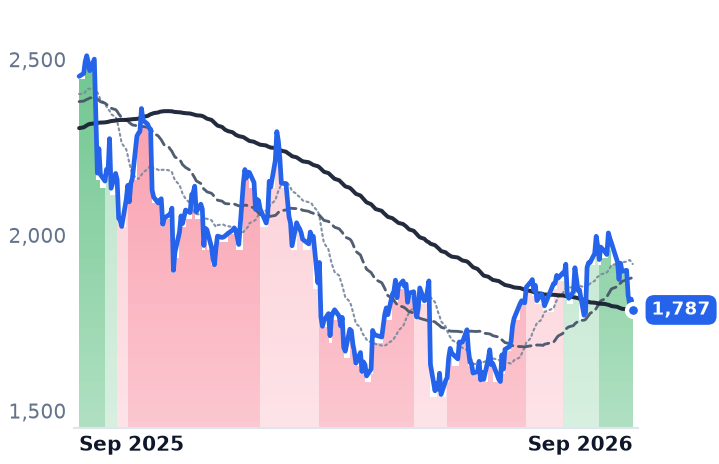
1,787
−30.79 (−1.69%)
vs. prior close
Price20d50d150d
MELI 12-month price
Online Marketplaces
SE
Sea
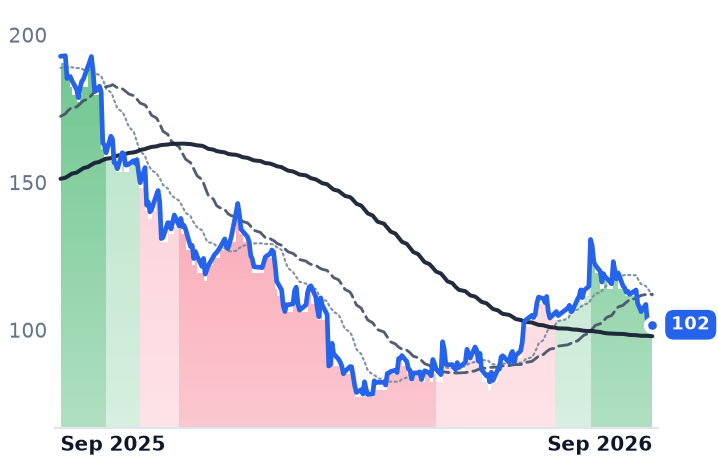
102
+0.45 (+0.44%)
vs. prior close
Price20d50d150d
SE 12-month price
Online Marketplaces
TickerMkt capP/EP/E fwdP/SP/S fwdP/GPP/GP fwdEV/EBITDAFCF yld
MELI$90.6B48.6x47.1x2.6x2.2x6.0x5.1x32.3x13.8%
SE$61.1B37.6x27.7x2.2x1.9x5.0x4.4x21.6x5.1%

Consensus projections

TickerFY2026EFY2027EFY2028E
MELIRevenue+45.2%+28.3%+24.9%
EPS−6.2%+44.1%+41.7%
SERevenue+40.1%+22.8%+15.1%
EPS+15.5%+29.6%+25.4%

Forward fiscal years only. Blank means no analyst coverage for that year.

MercadoLibre has spent the past year cutting what it charges Brazilian sellers and holding down the order size at which shipping becomes free. The June quarter shows the bill. Revenue rose about 50% to $10.169bn, the company's first $10bn quarter, and operating income fell 17% to $683m.

That is the mechanism the last twelve months have actually repriced across Latin American and Southeast Asian e-commerce — a marketplace buying order volume out of its own gross margin. It is not the story the share prices imply. Both MercadoLibre, which runs Latin America's largest marketplace alongside the Mercado Pago payments and lending arm, and Sea Limited, whose Shopee marketplace competes with it directly in Brazil, have built large consumer-credit books inside a punishing rate regime, and the market has been marking them as part-lenders. The June quarters say the loans are the healthy part.

The credit books both passed

MercadoLibre's portfolio reached $16.4bn, up 75% year over year, with non-performing balances between 15 and 90 days at 7.0% of the book and 4.6% on credit cards — levels management called close to historical lows. Net interest margin after losses improved to 21% from 18% in the prior quarter. The company issued 2.6m Brazilian cards in the quarter against 1.6m a year earlier; that card portfolio runs at minus 2.5% margin after losses by design, with individual cohorts reaching breakeven in twelve to eighteen months. Card originations were $7.68bn of $15.93bn total for the quarter.

Sea's Monee loan book reached $11.1bn, up 52%, with 90-day non-performing loans steady at 1.0% and more than 40m active credit users. "Recent enhancements to our underwriting models have helped lead approval rates by around 10% when compared to previous models while maintaining a similar level of risk," chairman and chief executive Forrest Li told investors on the August 11 call.

What MercadoLibre is paying for

The damage is in the commerce line. Gross margin fell to 40.9% from 45.6%, and the operating margin contracted to 6.7% from 12.2%. Chief financial officer Martin de los Santos tied that to deliberate spending on shipping, selection, cards and cross-border trade, and argued the return shows up in engagement: customers active in both the marketplace and Mercado Pago grew 37% and generate 70% more merchandise volume than single-platform users. Items per buyer rose 19% and conversion improved 1.1 percentage points.

The market has taken the cost and discounted the return. Consensus now models 2026 operating profit of $3.323bn, down 3.6%, and earnings per share down 6.2%. JPMorgan downgraded the stock to Neutral, its analyst writing that "the company's competition does not seem to be easing, with Shopee reiterating its willingness to continue sacrificing margins in Brazil." At 48.6x trailing earnings against 47.1x forward, the two readings sit under 3% apart — the arithmetic of a year in which profits are expected to shrink.

Sea's meter reads the other way

Sea's revenue grew 48% to $7.788bn and operating income rose 28% to $626m, with gross margin essentially unchanged at 45.6%. Shopee's merchandise volume reached $38.3bn, up 28%, while core marketplace revenue rose 66% and advertising revenue 70% — a rising cut of each order, not a shrinking one. Garena, the games arm cast for years as a fading annuity, grew bookings 15% to $764m with adjusted profit up 17%. "With this solid momentum we are optimistic that Shopee will achieve the milestone of $1 billion in adjusted EBITDA for the full year," Li said.

The shares did the opposite. Sea has fallen 46.6% over twelve months against MercadoLibre's 27.8%, and the two declines are not the same event: MercadoLibre lost 18% during February on margin guidance, while Sea was still near $108 at month-end and gapped down 16.4% on March 3 — 26.8% at the intraday low, its worst session in two years — on a fourth-quarter earnings miss and higher credit provisions. Sea is now cheaper than MercadoLibre on every measure: 27.7x forward earnings, 21.6x trailing enterprise value to EBITDA against 32.3x, and 4.36x forward gross profit against 5.11x.

The verdict

MercadoLibre earns its de-rating. Operating profit is falling, the sell-side has cut the year, and the company has told investors it will keep paying for Brazilian volume out of margin. Sea's is a different matter: a business compounding operating profit, expanding its advertising take and holding its loan losses flat has lost nearly half its value, and the only thing its own accounts explain is the March provisioning scare. The rest is the discount rate — the Federal Reserve raised its benchmark to 3.75%-4.00% on September 16, its first increase since 2023, hours before Brazil's central bank cut the Selic to 13.75% — and the likelier reading of the gap between the two shares is that Brazil's subsidy war is being priced into the attacker as well as the defender.

Both are fighting for the same Brazilian order, and Brazil votes on October 4, with a runoff three weeks later and the polls a statistical tie. Neither company controls the currency that order is paid in, and only one of them has said out loud what it intends to charge for it.

Banco Macro Cut Its 2026 Loan-Growth Target to 2–5% as Its Securities Income Fell 18%

Hypothesis Opus 5 · Research Opus 5 · Writing Opus 5 · Prompt v1.6

Seven Latin American bank shares get traded as one regional bet. Their June quarters say they are paid by three different machines, and only one of them is working better than its share price implies.

Banco Macro still holds a quarter of its assets in government paper and is watching that income shrink as Argentine disinflation grinds on, while its consumer bad-loan ratio climbed to 8.4%. Bladex, the dollar-funded Panamanian trade-finance lender, booked a record loan portfolio but grew profit 3.6% year over year as regional excess liquidity crushed lending spreads. Bradesco delivered a 16.2% return on average equity with delinquency at 4.6%, roughly half the Brazilian market average — and is the only one of the seven trading below book value.

Macro's marking-down looks earned. Bradesco's discount is the one its own numbers do not support.

BMABLXBBDBBARBCHBSACAVALGGALSUPVCIBITUBBSBRArgentine DisinflationNet Interest Margin CompressionConsumer Loan DelinquencyGovernment Securities CarryLatin American Bank Valuations
TickerCompanySegmentTrend · 13mo30D1Y
The subject · what this brief is about
BMABanco MacroLatin America & Caribbean Banks🟢 Cont. Bull+4.2%+94.1%
BLXBladexLatin America & Caribbean Banks🟢 Cont. Bull+0.8%+17.7%
BBDBanco BradescoLatin America & Caribbean Banks⚠️ Emerging Bear+14.9%+4.9%
Compared against · context, not the story
BBARBanco BBVA ArgentinaLatin America & Caribbean Banks🟢 Cont. Bull+0.9%+75.3%
BCHBanco de ChileLatin America & Caribbean Banks🟢 Cont. Bull−0.7%+47.5%
BSACBanco Santander-ChileLatin America & Caribbean Banks🟢 Cont. Bull−2.1%+38.8%
AVALGrupo Aval Acciones y ValoresLatin America & Caribbean Banks🟢 Cont. Bull−7.0%+63.4%
GGALGrupo Financiero GaliciaLatin America & Caribbean Banks🔴 Cont. Bear+2.0%+62.1%
SUPVGrupo SupervielleLatin America & Caribbean Banks🔴 Cont. Bear+5.7%+60.2%
CIBGrupo CibestOther🟢 Cont. Bull−1.8%+89.6%
ITUBItaú UnibancoMajor International Banks⚠️ Emerging Bear+14.3%+23.2%
BSBRBanco Santander (Brasil)Latin America & Caribbean Banks⚠️ Emerging Bear+3.5%+6.2%

12-month price & trend

BMA
Banco Macro
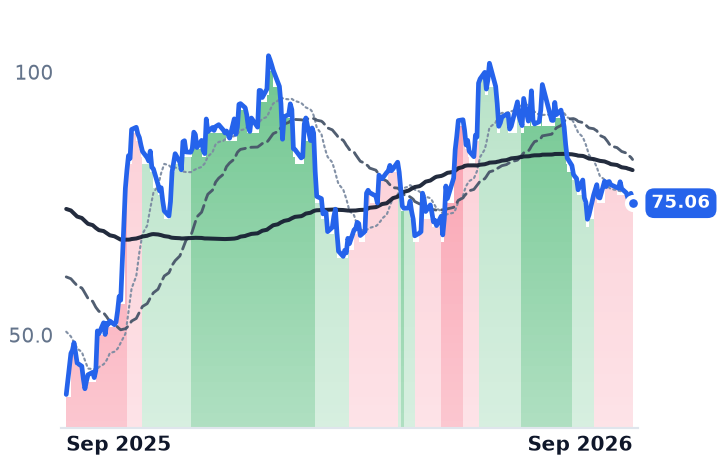
75.06
−1.85 (−2.41%)
vs. prior close
Price20d50d150d
BMA 12-month price
Latin America & Caribbean Banks
BLX
Bladex
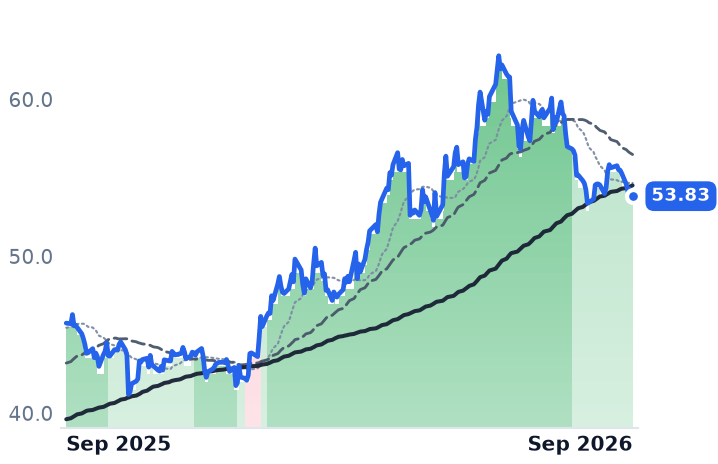
53.83
−0.10 (−0.19%)
vs. prior close
Price20d50d150d
BLX 12-month price
Latin America & Caribbean Banks
BBD
Banco Bradesco
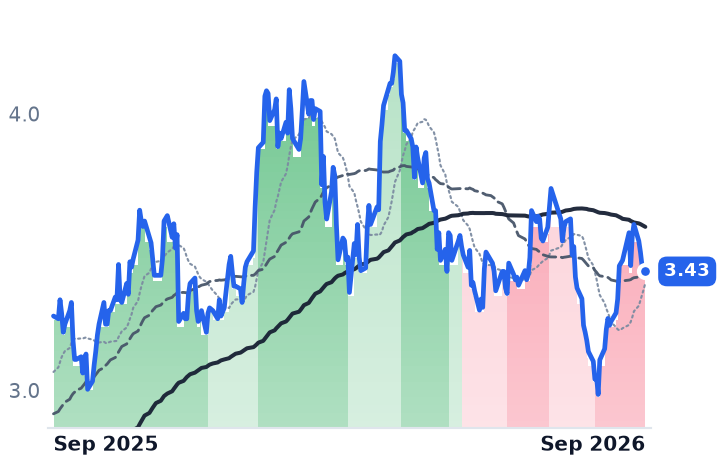
3.43
−0.00 (−0.15%)
vs. prior close
Price20d50d150d
BBD 12-month price
Latin America & Caribbean Banks
TickerMkt capP/EP/E fwdP/SP/S fwdP/GPP/GP fwdEV/EBITDAFCF yld
BMA$4.8B18.1x1.1x2.0x7.7x30.0%
BLX$1.5B8.9x8.3x2.6x4.1x4.7x7.5x17.5x25.3%
BBD$36.3B7.0x0.5x1.8x24.6x67.5%
BBAR
Banco BBVA Argentina
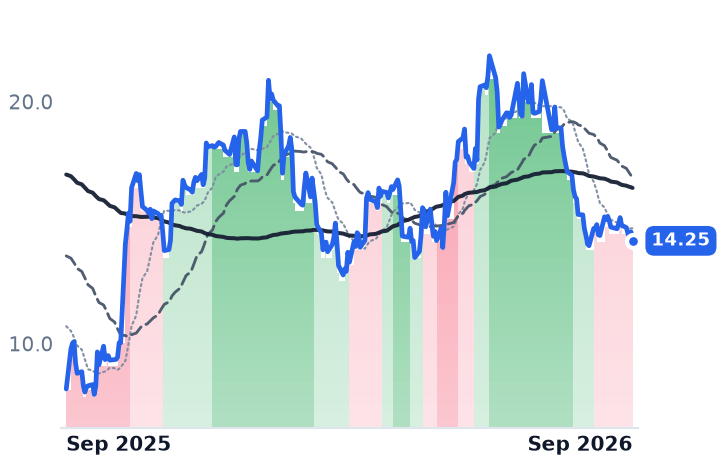
14.25
−0.37 (−2.53%)
vs. prior close
Price20d50d150d
BBAR 12-month price
Latin America & Caribbean Banks
BCH
Banco de Chile
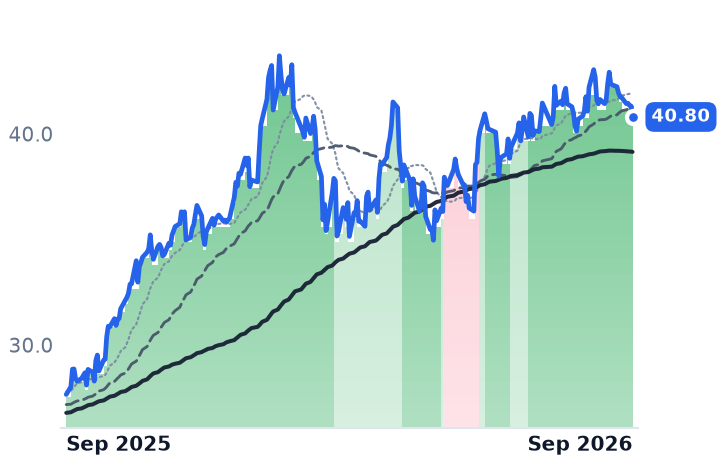
40.80
−0.52 (−1.26%)
vs. prior close
Price20d50d150d
BCH 12-month price
Latin America & Caribbean Banks
BSAC
Banco Santander-Chile
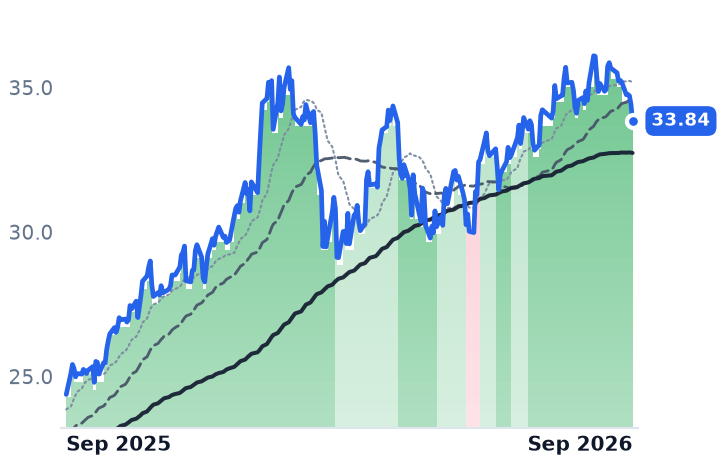
33.84
−0.57 (−1.66%)
vs. prior close
Price20d50d150d
BSAC 12-month price
Latin America & Caribbean Banks
TickerMkt capP/EP/E fwdP/SP/S fwdP/GPP/GP fwdEV/EBITDAFCF yld
BBAR$2.9B15.9x0.7x1.9x5.2x212.2%
BCH$20.6B16.4x4.9x7.3x20.9x1.6%
BSAC$15.9B14.0x3.0x5.6x17.4x9.4%
AVAL
Grupo Aval Acciones y Valores
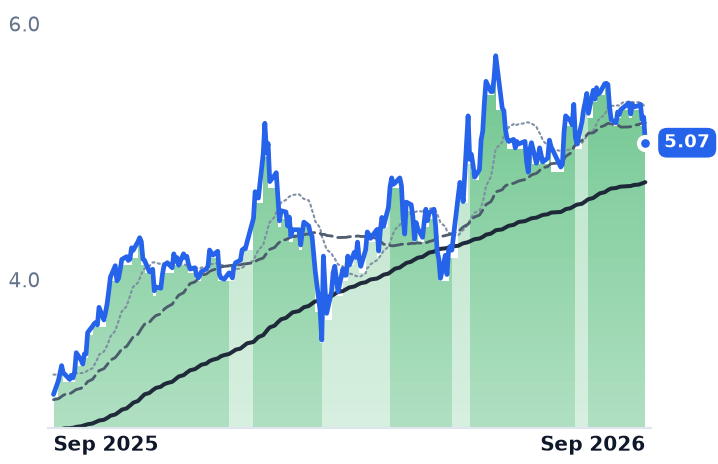
5.07
−0.20 (−3.80%)
vs. prior close
Price20d50d150d
AVAL 12-month price
Latin America & Caribbean Banks
GGAL
Grupo Financiero Galicia
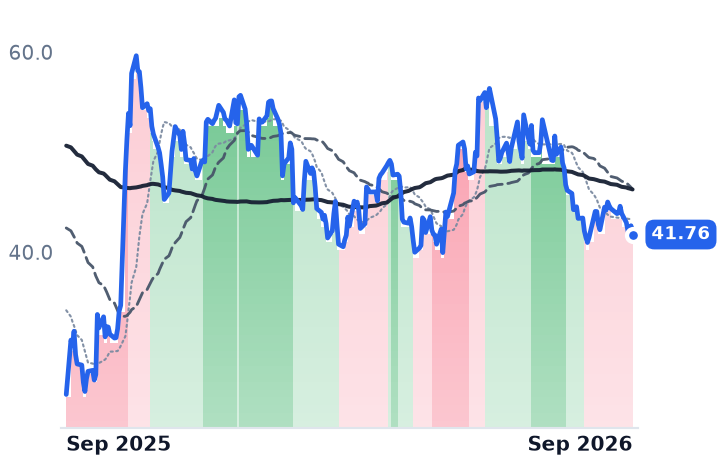
41.76
−0.88 (−2.06%)
vs. prior close
Price20d50d150d
GGAL 12-month price
Latin America & Caribbean Banks
SUPV
Grupo Supervielle
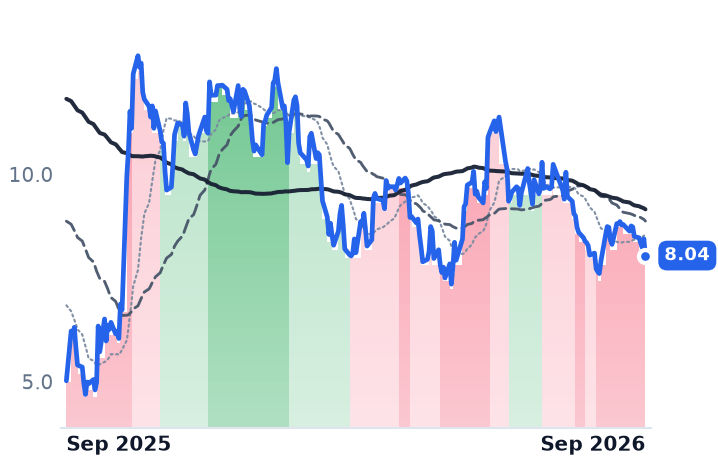
8.04
−0.41 (−4.80%)
vs. prior close
Price20d50d150d
SUPV 12-month price
Latin America & Caribbean Banks
TickerMkt capP/EP/E fwdP/SP/S fwdP/GPP/GP fwdEV/EBITDAFCF yld
AVAL$6.0B11.2x0.5x1.0x12.1x10.9%
GGAL$6.6B19.3x0.9x2.2x27.3x-8.9%
SUPV$656.6Mn/m0.5x1.3xn/m-65.8%
CIB
Grupo Cibest
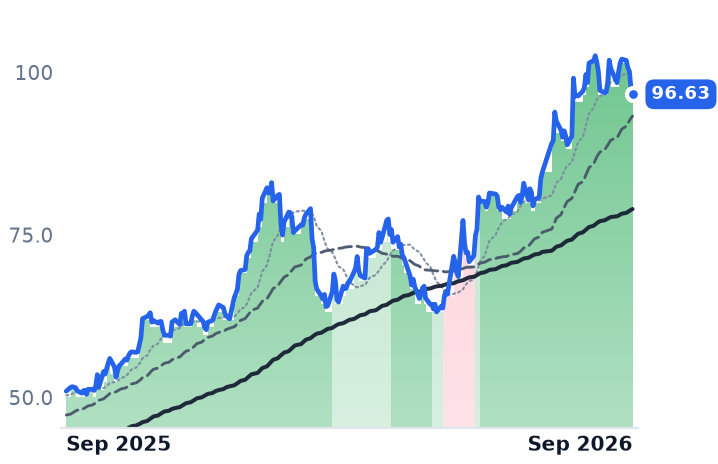
96.63
−0.86 (−0.88%)
vs. prior close
Price20d50d150d
CIB 12-month price
Other
ITUB
Itaú Unibanco
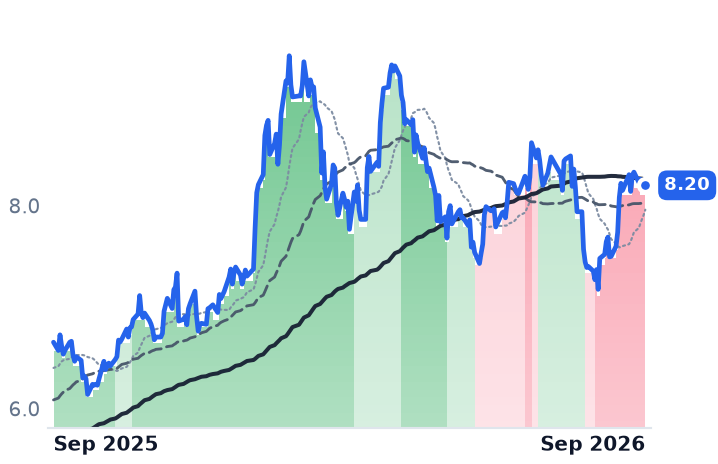
8.20
+0.05 (+0.55%)
vs. prior close
Price20d50d150d
ITUB 12-month price
Major International Banks
BSBR
Banco Santander (Brasil)
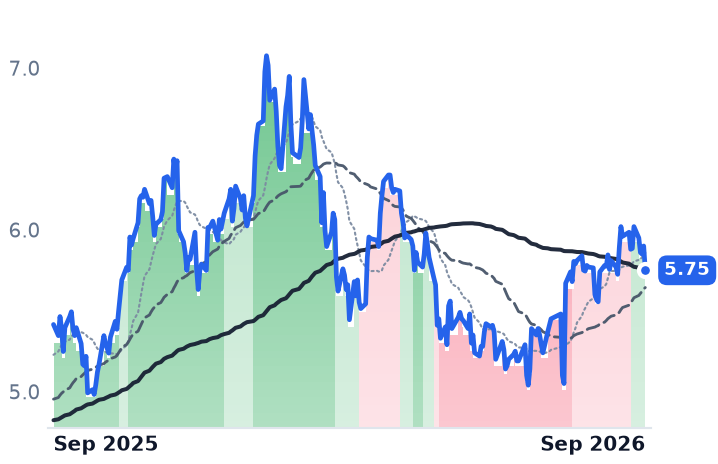
5.75
−0.15 (−2.54%)
vs. prior close
Price20d50d150d
BSBR 12-month price
Latin America & Caribbean Banks
TickerMkt capP/EP/E fwdP/SP/S fwdP/GPP/GP fwdEV/EBITDAFCF yld
CIB$15.0B8.1x1.3x2.2x5.2x17.6%
ITUB$86.4B9.5x1.1x3.3x24.2x8.0%
BSBR$39.9B15.5x1.1x2.8x1.4x2.9%

Consensus projections

TickerFY2026EFY2027EFY2028E
BMARevenue+38.0%+15.9%+20.6%
EPS+114.8%+58.9%+31.2%
BLXRevenue+12.9%+11.6%+9.8%
EPS+6.9%+9.8%+8.8%
BBDRevenue+9.1%+8.3%+7.8%
EPS+12.5%+10.7%+10.7%
BBARRevenue+32.7%+27.8%+20.6%
EPS+188.2%+34.8%+41.5%
BCHRevenue+7.1%+6.1%+7.5%
EPS+8.3%+8.6%+8.5%
BSACRevenue+6.7%+6.2%+7.0%
EPS+16.0%+4.5%+8.7%
AVALRevenue+11.9%+7.2%+11.7%
EPS+12.1%+19.1%+18.3%
GGALRevenue+19.4%+22.1%+40.2%
EPS+156.7%+70.7%+60.9%
SUPVRevenue+20.3%+23.5%+46.7%
EPS−392.7%+87.3%+64.4%
CIBRevenue+5.6%+7.3%+7.0%
EPS+1.5%+6.5%+7.4%
ITUBRevenue+8.3%+8.5%+7.1%
EPS+9.7%+11.3%+9.9%
BSBRRevenue+5.4%+8.0%+6.4%
EPS+6.4%+13.3%+9.2%

Forward fiscal years only. Blank means no analyst coverage for that year.

Banco Macro told investors in August that it now expects its peso loan book to grow just 2–5% faster than inflation this year, against the 15–20% it had guided before. The Buenos Aires retail and corporate lender — deposit accounts, cards, personal and auto loans, working capital for companies — had been sold to the market as the vehicle for Argentine credit finally arriving. The credit is not arriving on schedule.

That matters because of what has been paying Banco Macro's bills instead. Government securities are still a quarter of its assets, and income from them fell 18% quarter on quarter in the June quarter after a one-off bond-sale gain in the first. Argentine banks have spent years earning a spread by holding state paper against nearly free deposits; as annual inflation has fallen to roughly 34% by July from about 210% at the start of Javier Milei's term, that spread compresses, and private lending has to replace it. Management's own structural case is penetration: loans worth 11% of Argentine output against 30–50% across the region.

The funding-cost race

What held Macro's margin together in the quarter was not lending. Asset yields fell 280 basis points from the prior quarter while funding costs fell 550, so the margin excluding currency effects widened slightly, to 23.5%. That offset stops working once deposit rates reach their floor. Meanwhile the non-performing ratio rose to 6.25% from 5.4%, driven by consumer loans at 8.4% against 6.9%, and coverage of bad loans slipped below 100%. Reported return on equity was 13.4%; management guides 2026 adjusted return to about 12%, with chief financial officer Jorge Scarinci telling the August 20 call, "In 2030, we are expecting to be in the area of about 20% ROE by 2030." Capital is not the constraint — the Tier 1 ratio is 28% against an 11.5% requirement — and the bank is cutting to roughly 370 branches from 402.

Banco Macro nonetheless carries the premium inside Argentina, at 1.23x book against 1.12x for BBVA Argentina, which guides to about 10% real loan growth and reported a marginally cleaner 6.09% bad-loan ratio.

The shares tell a different story depending on where you start the clock. Over twelve months Argentina and Colombia did the work — Macro up 91%, BBVA Argentina 74%, Grupo Aval 60% — while Brazil's Bradesco added 3%. Over three months the Argentine names fell 26% to 35%, the break dated to MSCI's June 24 decision to keep Argentina classified as a Standalone Market rather than upgrade it, deferring close to $1bn of anticipated index buying.

Paid in dollars, squeezed anyway

Bladex, the Panama-based trade-finance bank with 175 employees and no retail branches, is the group's opposite: dollar-funded, short-tenor lending to the region's best corporates and banks. Its credit portfolio hit a record $14.5bn at the end of June, up 19% year on year, and quarterly profit set a record at $66.5m — but that was only 3.6% above a year earlier, after two years of double-digit growth. The net interest margin narrowed to 2.24% from 2.34%. "The margin pressure was stronger than we initially expected," chief executive Jorge Salas told investors on the second-quarter call, naming the channel: almost 70% of the commercial book matures inside a year, so regional excess liquidity reprices against Bladex faster than against the average bank. This is competition for borrowers, not the policy cycle — the Federal Reserve raised its target range to 3.75–4.00% on September 16, its first increase since 2023. Fee income nearly doubled to a record and the efficiency ratio improved to 24.1%. At 8.9x trailing and 8.3x forward earnings on 1.15x book, with about 16.4% adjusted return on equity, the price looks like the business.

The one that disagrees

Bradesco, the 1943-founded Brazilian bank and insurer, has the best operating momentum in the group and the worst year. June-quarter profit rose 16% year on year for a 16.2% return on average equity; loans grew 11.6%. Delinquency ran 4.6% against a Brazilian market average of 8.9%, and much of the growth carries a state backstop — BRL31bn of BRL37bn of small-business expansion came through the government-backed guarantee funds FGO and FGI. "The level of loss is minimal," chief executive Marcelo Noronha told the August 6 call. The board approved a capital increase of up to about $2bn on July 29, with the controlling shareholders committing the bulk. Brazil's central bank cut the Selic to 13.75% on September 16, a fifth straight cut. Bradesco is the only one of these seven below book value, at 0.97x, and has gained 15% in the last thirty days.

The controls make the point. Banco de Chile at 3.50x book and Santander-Chile at 3.21x are priced off delivered returns — Santander-Chile earned 31.5% on average equity in the quarter, though it guides its margin down to about 4.1% as the inflation kicker fades. Grupo Aval sits at 1.07x on full-year return guidance of 9.25%, with Colombia's central bank still leaning toward higher rates.

So the licence is not the asset; the realized return is. Macro's year was earned by a funding-cost collapse it cannot repeat, and its marking-down since January is the market pricing a credit expansion that management has now postponed in its own guidance. Bladex's advance is supported by a record book, but the spread it earns is being competed away faster than volume replaces it. Bradesco is the single place where the delivered numbers and the price genuinely disagree — and the disagreement has begun to close only in the last month.

Brazil votes again on October 25, with the central bank easing into an election for the first time in two decades. The one bank here trading below the value of its own equity is also the one whose next two quarters are hostage to a ballot.

BWXT's Backlog Grew 40% to $8.4bn While Its Operating Profit Fell for a Fourth Quarter

Hypothesis Opus 5 · Research Opus 5 · Writing Opus 5 · Prompt v1.6

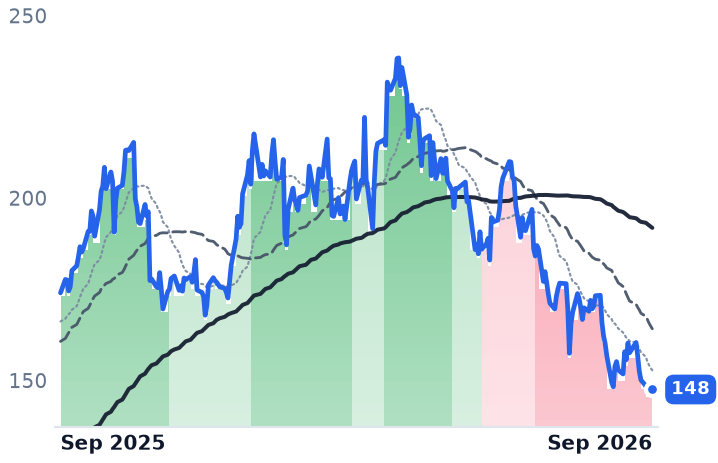
The company in the nuclear complex that cannot be touched by the uranium price fell harder than the two that can. BWX Technologies raised all four of its 2026 guidance lines on August 3, carries $8.4bn of backlog on a trailing book-to-bill of 1.7 times, and won a place in the US Army's microreactor program in August — and its shares are down 28.2% over ninety days.

Its own numbers give the sellers something: June-quarter revenue rose 18% to $901.6m while reported operating income fell 12.2%, the fourth straight quarter of that pattern, as commercial work grew at an 8% margin. Centrus fell on a $500m stock-and-warrant sale, Cameco on Westinghouse. None of that is fuel-cycle economics being marked down — it is the calendar.

BWXTLEUCCJURAUECUUUUNXEOKLOSMRCEGSPYDNNNaval Nuclear PropulsionDefense Contract BacklogMicroreactors & SMRsUranium EnrichmentNuclear Fuel CycleLong-Duration Rate Sensitivity
TickerCompanySegmentTrend · 13mo30D1Y
The subject · what this brief is about
BWXTBWX TechnologiesNaval & Shipbuilding⚠️ Emerging Bear−7.9%−15.2%
LEUCentrus EnergyUranium⚠️ Emerging Bear−17.7%−50.7%
CCJCamecoUranium⚠️ Emerging Bear−4.4%+6.5%
Compared against · context, not the story
URAGlobal X - Uranium ETFAsset Management⚠️ Emerging Bear−4.4%−11.7%
UECUranium EnergyUranium⚠️ Emerging Bear−11.2%−20.6%
UUUUEnergy FuelsUranium⚠️ Emerging Bear−15.8%−21.3%
NXENexGen EnergyUranium⚠️ Emerging Bear−8.5%+6.1%
OKLOOkloEmerging & Specialized Energy🔴 Cont. Bear−8.8%−71.9%
SMRNuScale PowerAdvanced Nuclear🔴 Cont. Bear−7.1%−82.3%
CEGConstellation EnergyDiversified Renewable Generators🔴 Cont. Bear−6.7%−22.8%
SPYState Street SPDR S&P 500 ETF TrustAsset Management🟢 Cont. Bull−0.2%+15.4%
DNNDenison MinesUranium⚠️ Emerging Bear−8.6%+7.1%

12-month price & trend

BWXT
BWX Technologies
148
+1.17 (+0.80%)
vs. prior close
Price20d50d150d
BWXT 12-month price
Naval & Shipbuilding
LEU
Centrus Energy
145
−4.62 (−3.08%)
vs. prior close
Price20d50d150d
LEU 12-month price
Uranium
CCJ
Cameco
91.62
−1.18 (−1.27%)
vs. prior close
Price20d50d150d
CCJ 12-month price
Uranium
TickerMkt capP/EP/E fwdP/SP/S fwdP/GPP/GP fwdEV/EBITDAFCF yld
BWXT$13.5B38.0x31.1x3.8x3.6x17.4x16.1x27.0x2.3%
LEU$2.8B57.9x57.0x5.8x5.8x25.0x25.1x28.4x-8.1%
CCJ$39.9B156.7x59.2x16.1x11.2x58.2x40.5x64.6x0.9%
URA
Global X - Uranium ETF
41.65
−0.75 (−1.77%)
vs. prior close
Price20d50d150d
URA 12-month price
Asset Management
UEC
Uranium Energy
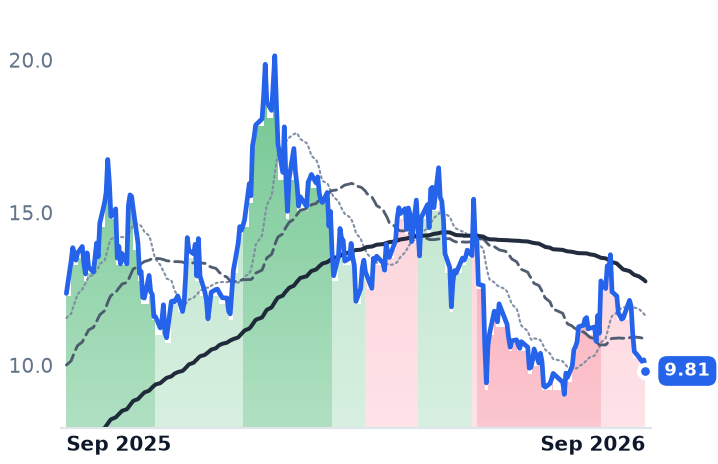
9.81
−0.36 (−3.59%)
vs. prior close
Price20d50d150d
UEC 12-month price
Uranium
UUUU
Energy Fuels
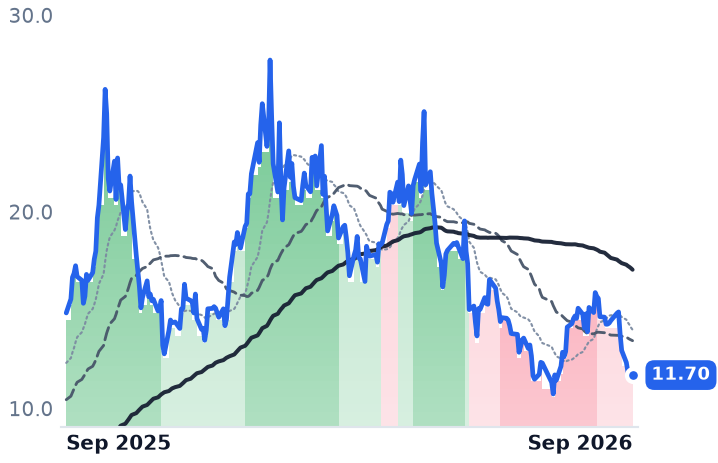
11.70
−0.23 (−1.93%)
vs. prior close
Price20d50d150d
UUUU 12-month price
Uranium
TickerMkt capP/EP/E fwdP/SP/S fwdP/GPP/GP fwdEV/EBITDAFCF yld
URA$3.9B
UEC$5.0Bn/m247.9x48.9x585.8x115.5xn/m-2.4%
UUUU$3.0Bn/m28.3x22.5x65.5x52.0xn/m-3.7%
NXE
NexGen Energy
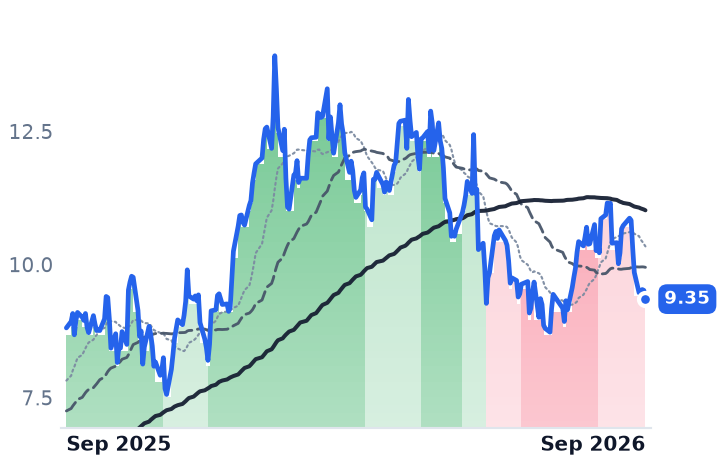
9.35
−0.16 (−1.73%)
vs. prior close
Price20d50d150d
NXE 12-month price
Uranium
OKLO
Oklo
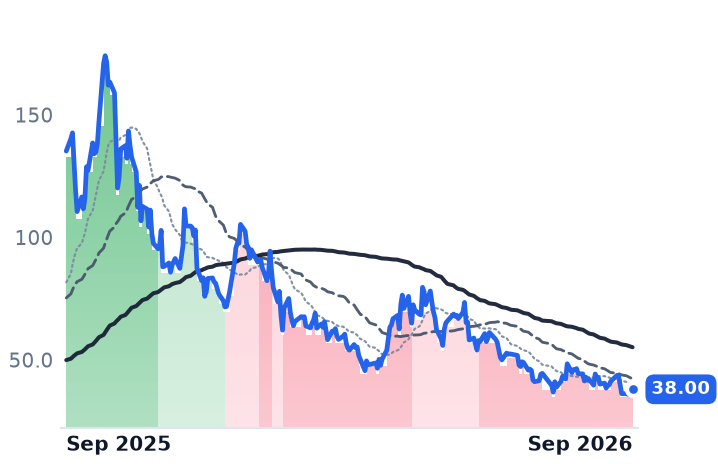
38.00
+0.01 (+0.03%)
vs. prior close
Price20d50d150d
OKLO 12-month price
Emerging & Specialized Energy
SMR
NuScale Power
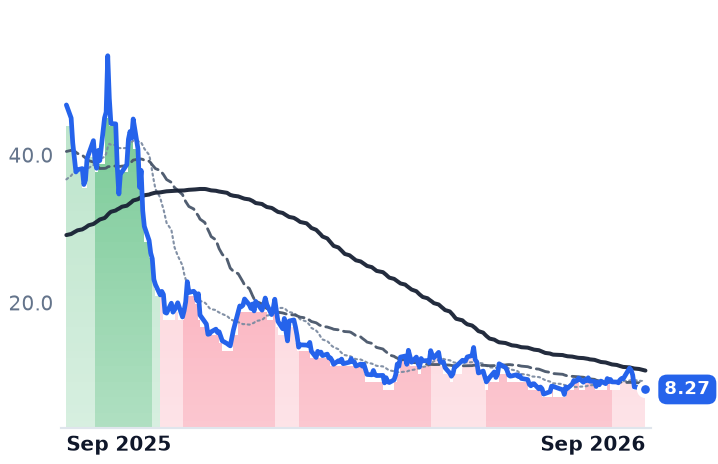
8.27
−0.42 (−4.89%)
vs. prior close
Price20d50d150d
SMR 12-month price
Advanced Nuclear
TickerMkt capP/EP/E fwdP/SP/S fwdP/GPP/GP fwdEV/EBITDAFCF yld
NXE$7.2Bn/mn/mn/m-2.4%
OKLO$6.9Bn/mn/m-4.0%
SMR$3.0Bn/m284.6x160.7x762.7xn/m-25.5%
CEG
Constellation Energy
255
−9.77 (−3.69%)
vs. prior close
Price20d50d150d
CEG 12-month price
Diversified Renewable Generators
SPY
State Street SPDR S&P 500 ETF Trust
762
+1.49 (+0.20%)
vs. prior close
Price20d50d150d
SPY 12-month price
Asset Management
DNN
Denison Mines
2.86
−0.02 (−0.65%)
vs. prior close
Price20d50d150d
DNN 12-month price
Uranium
TickerMkt capP/EP/E fwdP/SP/S fwdP/GPP/GP fwdEV/EBITDAFCF yld
CEG$102.3B27.7x23.6x3.3x3.1x3.4x3.2x14.8x0.3%
SPY$773.0B
DNN$2.9Bn/m988.4x120.1xn/m-4.1%

Consensus projections

TickerFY2026EFY2027EFY2028E
BWXTRevenue+20.6%+9.8%+7.3%
EPS+24.1%+11.5%+11.8%
LEURevenue+5.2%−0.8%−10.9%
EPS−43.2%+13.2%−23.3%
CCJRevenue+4.2%+12.1%+8.6%
EPS+7.9%+69.6%+26.2%
UECRevenue−61.4%+301.4%+159.3%
EPS+51.4%−73.5%−428.1%
UUUURevenue+128.1%+88.3%+62.7%
EPS−37.3%−160.5%+170.0%
NXERevenue−68.7%+131.4%+32282.1%
EPS−38.6%−10.8%+37.8%
OKLORevenue+252.7%+552.9%
EPS+57.1%+9.6%+13.5%
SMRRevenue−54.8%+517.4%+185.1%
EPS−76.8%+19.4%−24.8%
CEGRevenue+36.6%+2.6%+5.5%
EPS+28.7%+10.1%+26.3%
DNNRevenue+394.2%−27.3%+1699.7%
EPS−30.5%−73.1%−363.0%

Forward fiscal years only. Blank means no analyst coverage for that year.

BWX Technologies makes the reactors, fuel and missile launch tubes for the US Navy's submarines and carriers, and it spent the summer taking orders. Backlog stood at $8.4bn at the end of June, up 40% year over year on a trailing book-to-bill of 1.7 times, and on August 3 the company raised its full-year revenue, adjusted EBITDA, adjusted earnings and free-cash-flow guidance. On August 26 the US Army selected its 20-megawatt BANR reactor for the Janus program, a set of agreements worth up to $2.2bn with fixed-price milestones running through 2031.

The shares are down 28.2% over ninety days, the worst of the three large listed nuclear-fuel names. BWXT neither mines nor enriches uranium — it is classified in aerospace and defense, and its largest business is paid on cost-reimbursable government contracts. That makes its decline the test of what has actually been marked down this month: the economics of the nuclear fuel cycle, or the number of years until the cash arrives.

What the sellers can point to

June-quarter revenue rose 18% to $901.6m, but gross margin fell to 22.4% from 25.1% and reported operating income fell 12.2% to $89.9m — the fourth consecutive quarter of rising revenue and falling operating profit. Mix explains it. Government Operations, $601.3m of the quarter, grew 2% at a 17.6% segment margin; Commercial Operations grew 72% to $302.5m at 8.0%. Under cost-reimbursable naval contracting reported revenue rises when costs rise, so the naval line is not a demand reading. Management cut the commercial margin guide to about 13% from about 14%, pushing recovery to 2027, and said on the August 3 call it expects "at least one new build nuclear equipment order by year-end" — meaning none had been booked at the half-year. On July 31 it agreed to sell its medical radioisotope business to Nordic Capital in a deal valued at up to $800m.

The other two had reasons of their own

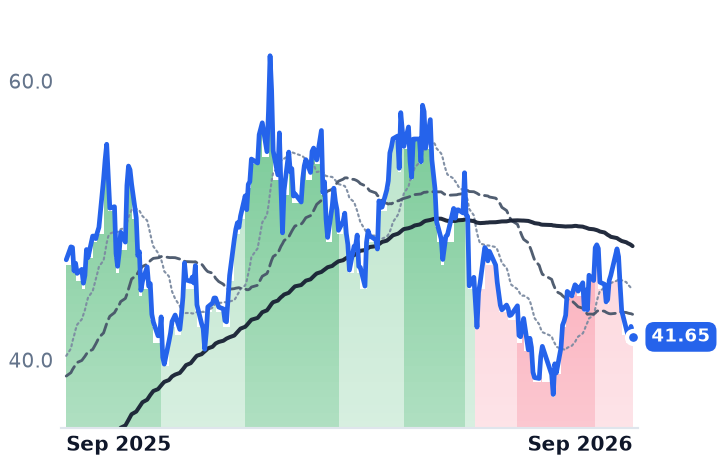
Every nuclear name fell over the thirty sessions to September 18 while the S&P 500 tracker lost 1.4%: Centrus 21.0%, BWXT 14.9%, Cameco 7.9%. The week contained a Federal Reserve rate increase on September 16 and a ten-year Treasury yield that settled back above 5%. The commodity went the other way. The long-term uranium contract price reached $94 a pound at the end of June, an 18-year high, and Kazatomprom plans to cut 2026 output by roughly 10%.

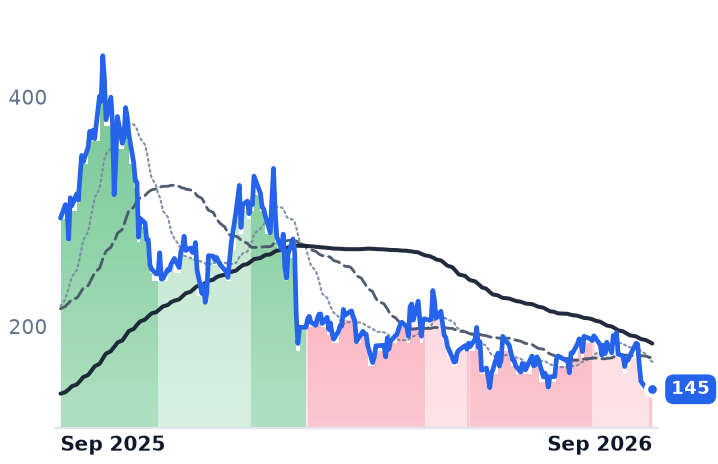
Centrus Energy, the only US-owned commercial enricher and the sole domestic source of high-assay low-enriched uranium, fell on a dated event of its own: a $500m offering of stock and warrants priced September 9, including immediately exercisable warrants over as many as 6,992,382 shares — about 31% of the 22.5m diluted shares reported for the fourth quarter of 2025. The stock closed at $185.38 on September 8 and $145.23 on September 18. The underlying quarter pulled the same way: revenue up 14% to $176.1m, gross profit down 7.4%, separative work unit volumes down 23% with unit costs up 13%. At roughly 57 times both trailing and forward earnings, with consensus 2026 earnings per share down 43%, the shares embed no growth. Its $4.5bn backlog runs to 2040, but its largest enrichment supplier is Russia's TENEX, whose material is banned from January 1, 2028, and its own Piketon plant is guided to commercial production in 2029.

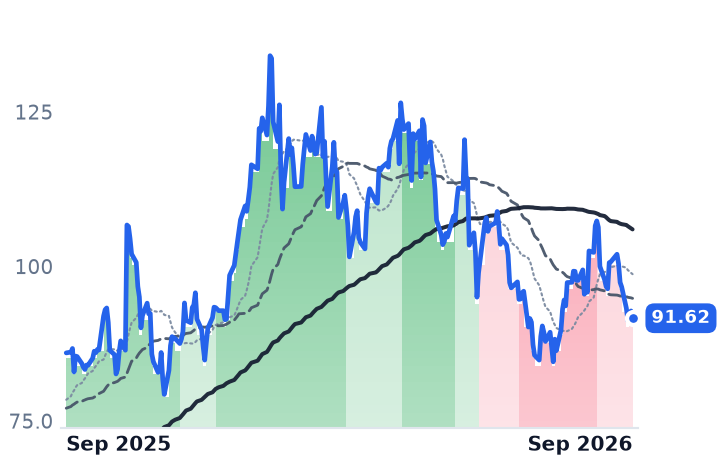
Cameco fell least, and the half of it that sells pounds improved: average realized price up 15% to C$93.13 a pound in Canadian dollars, about 28m pounds a year committed through 2030, and raised outlooks for realized price and revenue. "We are back into a mid-'90s long-term uranium price on its way to three digits likely, and this is in the absence of replacement rate demand," chief operating officer Grant Isaac told investors on July 31. The damage sat in the 49% stake in Westinghouse, whose contribution to Cameco's adjusted EBITDA fell to $163m from $352m — the prior year carried roughly $170m from a Czech construction milestone — and whose five-year growth framework was withdrawn outright. Cameco trades at 59.2 times forward earnings and 156.7 times trailing, the trailing figure having risen as profit fell faster than the price. Westinghouse confidentially filed a draft registration statement on July 31 for a US listing.

The verdict

Two of the three declines are earned by events with dates on them. BWXT's is only partly so: falling margins and an unbooked new-build order justify some compression, and its forward multiple has been cut by roughly a third, from about 47 times in May to 31.1 times, even as consensus put 2026 earnings at $4.74 a share. What the business does not explain is a rising order book and four raised forecasts being valued a third lower. The likelier reading is that the market is repricing the date rather than the contract book — cash flows that begin in the 2030s against a long bond above 5% — and that it is selling everything standing near a reactor without asking how each one is paid.

BWXT has promised its first new-build nuclear equipment order before the end of the year. Until it lands, the strongest fact in the company's favor is a delivery schedule in the next decade — and a schedule is precisely what the bond market has spent this month repricing.

LKQ Lost $140m of Sales to a German Software Switch While Its Claim Volumes Improved

Hypothesis Opus 5 · Research Opus 5 · Writing Opus 5 · Prompt v1.6

A year of selling has treated the auto aftermarket as one recession-proof category. The June quarter says it is two businesses, and they broke for opposite reasons.

LKQ cut full-year guidance after an enterprise software rollout in Germany cost it a quarter of revenue in one region — while the insurance claims that fund its collision parts stabilized and alternative-parts use hit a record above 40% of authorized repairs. O'Reilly did the reverse: professional sales up 10%, gross margin flat at 51.4%, full-year comparable-sales guidance raised — and the shares fell about a fifth over twelve months as the premium multiple set last September unwound.

The unresolved half is the do-it-yourself customer, where visit counts are already falling and a 5.5% pricing tailwind fades to 1–2% in the back half.

ORLYLKQAZODORMAAPGPCBGSICollision Repair PartsInsurance Claim VolumesERP Rollout DisruptionDIY Demand SoftnessAftermarket Parts Pricing
TickerCompanySegmentTrend · 13mo30D1Y
The subject · what this brief is about
ORLYO'Reilly AutomotiveAutomotive Parts Retail🔴 Cont. Bear−4.4%−18.5%
LKQLKQAftermarket Distribution & Service🔴 Cont. Bear−10.2%−22.5%
Compared against · context, not the story
AZOAutoZoneAutomotive Parts Retail🔴 Cont. Bear−3.6%−31.0%
DORMDorman ProductsAftermarket Distribution & Service🌱 Emerging Bull−6.6%−21.7%
AAPAdvance Auto PartsAutomotive Parts Retail🟢 Cont. Bull+3.3%−26.4%
GPCGenuine PartsAutomotive Parts Retail🔴 Cont. Bear−3.0%−5.1%
BGSIBoyd Group ServicesAftermarket Distribution & Service🔴 Cont. Bear−11.3%−48.4%

12-month price & trend

ORLY
O'Reilly Automotive
84.71
+0.55 (+0.65%)
vs. prior close
Price20d50d150d
ORLY 12-month price
Automotive Parts Retail
LKQ
LKQ
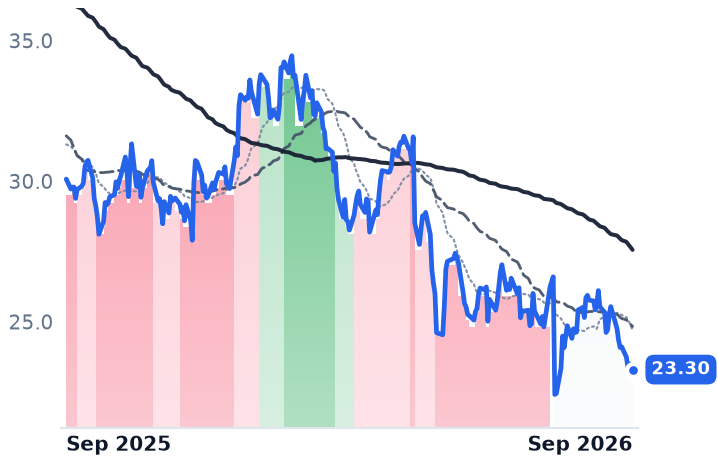
23.30
+0.22 (+0.95%)
vs. prior close
Price20d50d150d
LKQ 12-month price
Aftermarket Distribution & Service
AZO
AutoZone
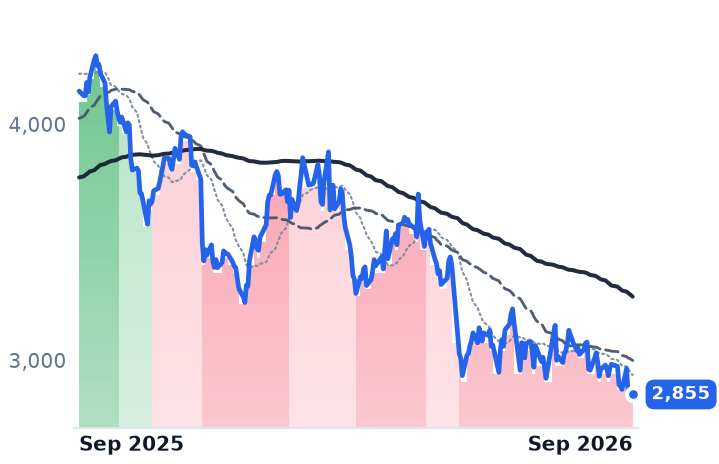
2,855
−3.95 (−0.14%)
vs. prior close
Price20d50d150d
AZO 12-month price
Automotive Parts Retail
TickerMkt capP/EP/E fwdP/SP/S fwdP/GPP/GP fwdEV/EBITDAFCF yld
ORLY$70.2B26.7x25.8x3.8x3.7x7.3x7.1x19.7x3.1%
LKQ$5.9B12.9x8.7x0.4x0.4x1.1x1.2x8.6x10.6%
AZO$46.6B19.1x16.3x2.3x2.1x4.5x4.1x13.8x3.5%
DORM
Dorman Products
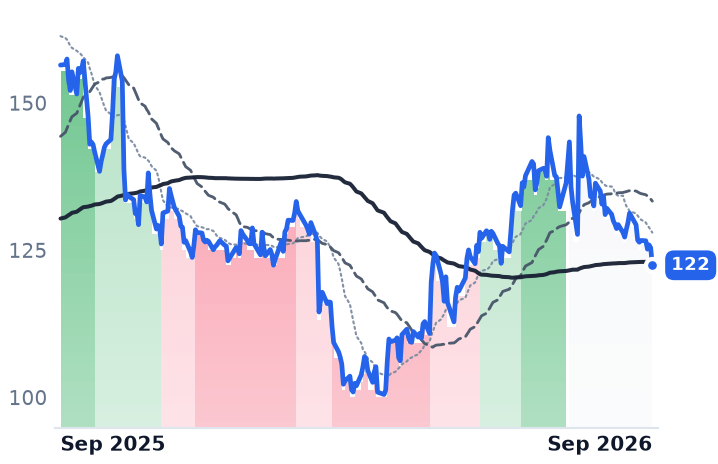
122
−2.98 (−2.38%)
vs. prior close
Price20d50d150d
DORM 12-month price
Aftermarket Distribution & Service
AAP
Advance Auto Parts
42.55
+0.45 (+1.07%)
vs. prior close
Price20d50d150d
AAP 12-month price
Automotive Parts Retail
GPC
Genuine Parts
128
−3.07 (−2.34%)
vs. prior close
Price20d50d150d
GPC 12-month price
Automotive Parts Retail
TickerMkt capP/EP/E fwdP/SP/S fwdP/GPP/GP fwdEV/EBITDAFCF yld
DORM$3.7B16.9x14.1x1.7x1.7x4.0x3.9x11.1x5.9%
AAP$2.8B64.3x17.0x0.3x0.3x0.8x0.8x15.5x-10.5%
GPC$17.7B492.6x16.5x0.7x0.7x1.9x1.9x32.2x4.3%
BGSI
Boyd Group Services
81.45
−3.25 (−3.84%)
vs. prior close
Price20d50d150d
BGSI 12-month price
Aftermarket Distribution & Service
TickerMkt capP/EP/E fwdP/SP/S fwdP/GPP/GP fwdEV/EBITDAFCF yld
BGSI$2.3B175.4x24.3x0.6x0.6x1.6x1.4x10.3x13.8%

Consensus projections

TickerFY2026EFY2027EFY2028E
ORLYRevenue+7.6%+6.1%+6.1%
EPS+10.4%+11.3%+11.1%
LKQRevenue−0.9%+2.5%−0.8%
EPS−13.4%+15.2%+7.5%
AZORevenue+8.1%+7.5%+7.1%
EPS+2.8%+16.0%+11.8%
DORMRevenue+2.0%+5.0%+6.0%
EPS−1.8%+6.7%+7.4%
AAPRevenue−6.0%−0.3%+2.5%
EPS−624.9%+52.8%+42.6%
GPCRevenue+5.0%+3.5%+4.2%
EPS+1.4%+7.3%+8.6%
BGSIRevenue+29.1%+8.4%+6.7%
EPS+84.3%+44.5%+23.9%

Forward fiscal years only. Blank means no analyst coverage for that year.

LKQ, which distributes recycled, salvage and aftermarket collision parts to repair shops in North America and Europe, told investors on July 30 that a new enterprise resource planning system at its German business cost it $140m of revenue and $50m of earnings before interest, taxes, depreciation and amortization in a single quarter. The part of the business the market had been braced for went the other way: North American organic parts and services revenue rose 0.5%, the first positive quarter in nine.

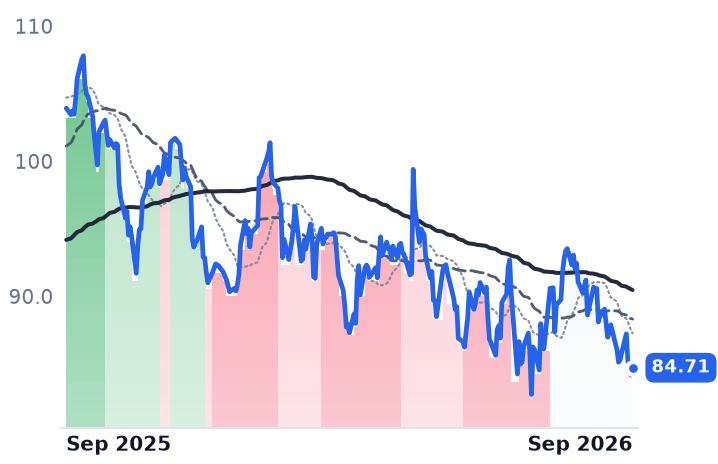
That inversion is the reason to stop pricing the aftermarket as one thing. Two different dollars fund it. One is retail — a part sold off a shelf to a driver or billed on account to an installer, at a gross margin near fifty cents. The other is insurance — a part that exists only when a carrier authorizes a repair instead of writing the vehicle off. Over twelve months both were marked down together: O'Reilly 19.6%, LKQ 26.1%, AutoZone 32.4%, Dorman 22.1%, with not one of them appearing on a 30-day list of biggest movers. The reasons do not rhyme.

The claim dollar stabilized; the software did not

LKQ's revenue fell 6.4% year on year to $3.41bn in the June quarter and operating income fell 27.9% to $225m, a fourth straight quarterly decline. Guidance was cut for the second time this year — adjusted earnings to $2.60–$2.90 a share from $2.90–$3.20, and organic parts and services growth to a range of -3.0% to -1.0% from the -0.5% to +1.5% set with the 2025 results. The shares fell 15.7% that session.

"While this quarter fell short of our expectations, this is a company that is stronger and better than reported results may suggest," chief executive Justin Jude said on the July 30 call, calling the German transition more challenging and slower to stabilize than planned. The claims meter behind the bear case improved: repairable claims ran down 1% to 3%, better than the prior quarter, while alternative-parts utilization hit a record above 40% as carriers push cheaper recycled and aftermarket parts into each authorized repair. Boyd Group, the collision-repair chain paid by those same carriers, told investors on August 12 that industry repair volumes were flat to down 2% and total losses flat year on year.

LKQ trades at 8.7 times forward earnings against 12.9 times trailing — the gap is the guidance cut, already embedded — at 0.92 times book value with a 10.6% trailing free-cash-flow yield. Its board opened a review of strategic alternatives on January 26, explicitly including a sale of the whole company.

The retail dollar is intact, and thinner than it looks

O'Reilly, which sells hard parts and maintenance items out of company-operated stores to both drivers and professional shops, reported comparable-store sales up 6.0% and raised full-year comp guidance to 4–6%. Gross margin was 51.45% against 51.41% a year earlier. "As we see inflation in acquisition costs in our industry is very rational in how we pass those through," chief executive Brad Beckham told investors on the second-quarter call. The shares fell 3.6% the next day.

The composition is where the risk sits. Professional sales rose about 10%, a fourth consecutive double-digit quarter. Do-it-yourself comps grew low single digits on a higher average ticket — and a low-single-digit decline in DIY transaction counts. Same-SKU inflation contributed 5.5%, which management expects to moderate to 1–2% in the second half as 2025's tariff-driven price increases lap. Meanwhile accounts payable covered 123.7% of inventory, down from 127.0%, with 122% guided for year-end: suppliers are financing slightly less of the same-day availability that is the moat.

What the price earned

O'Reilly's forward earnings multiple has fallen to about 25.8 times from roughly 34.6 times at last September's peak, still at the top of the 15-to-25 range it carried from 2016 to 2023. Consensus earnings for this year, at $3.29 a share, are up about 10% and have not been cut. A premium unwound; the earnings line did not break.

AutoZone is a different case: consensus profit of $150.85 a share is 2.8% above last year, a stalled line at 16.3 times forward earnings, with fiscal third-quarter gross margin down about half a percentage point that the company attributed principally to a non-cash inventory accounting charge. Dorman Products, the supplier that imports parts and actually pays the Section 232 duty, saw gross margin fall to 36.0% in the March quarter and rebound to 46.1% in June, with operating income up 40.9% on revenue up 0.7% — cost absorbed, then recovered — yet its shares are down 22.1% on flat estimates and 14.1 times forward earnings.

The split was dated on August 20, when Advance Auto Parts missed on revenue and blamed tighter household budgets in its do-it-yourself channel, its shares falling about 22% to $43.96 even as $26m of one-off tariff refunds flattered adjusted earnings. AutoZone fell 3.7% that day and O'Reilly 2.8%. LKQ closed up 0.3%.

So the verdict runs in two directions. LKQ's is a genuine earnings break with a named, geographic cause, priced below book while the claim pool it feeds steadied. O'Reilly's decline is the unwind of a 2024–25 rating rather than evidence of a damaged business — but the second half is a real test, because with pricing fading to 1–2% and DIY visits already shrinking, a 4–6% comp has to be carried almost entirely by professional installers.

One input runs only one way. The Section 232 tariff on imported auto parts took effect in May 2025, and a quarterly inclusions process lets domestic manufacturers petition to add parts to the list — with no comparable route to take one off.

The AI Build-Out Pays Corning by the Mile and Costs Universal Display by the Gram

Hypothesis Opus 5 · Research Opus 5 · Writing Opus 5 · Prompt v1.6

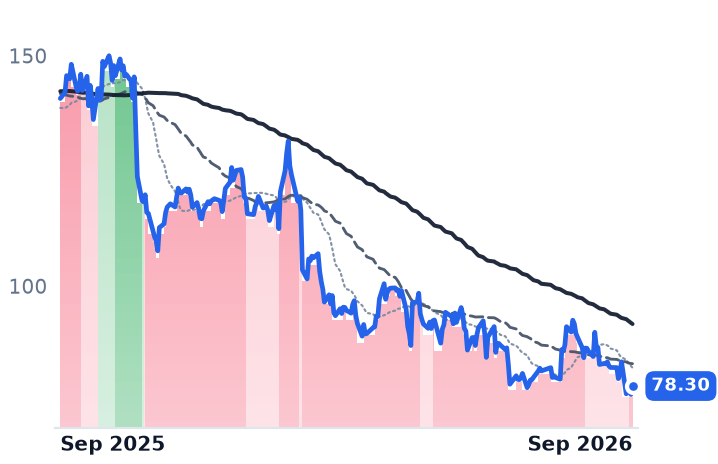
Two companies filed under the same industry code fell together on September 14, and only one of them is paid by the thing that moved them. Corning dropped hardest in the S&P 500 that session after disclosing a $2bn at-the-market equity program — a funding event landing six days after Verizon contracted for more than 80 million miles of its fiber. Its optical sales grew 32% to $2.07bn in the June quarter, with enterprise networks up 65%.

Universal Display, which ships no cable and no panel, fell 8.3% the same day on an artificial-intelligence story it earns nothing from. Its actual problem is the other side of that boom: memory prices have raised smartphone costs and cut handset builds, and its emitter material sales fell to $66.2m from $88.7m. One name is being re-rated. The other is shrinking.

GLWOLEDCOHRLITEAAOICIENCRDOFNMUNVDAOptical Fiber & ConnectivityAI Data-Center BuildoutOLED Emitter MaterialsMemory PricingSmartphone Build RatesCapacity Expansion Financing
TickerCompanySegmentTrend · 13mo30D1Y
The subject · what this brief is about
GLWCorningDisplay & Optical Materials⚠️ Emerging Bear−0.9%+89.7%
OLEDUniversal DisplayDisplay & Optical Materials🔴 Cont. Bear−9.5%−44.4%
Compared against · context, not the story
COHRCoherentInstrumentation & Test Equipment⚠️ Emerging Bear+9.4%+190.9%
LITELumentumOptical Transport & Switching🟢 Cont. Bull+5.9%+451.7%
AAOIApplied OptoelectronicsRF & Wireless⚠️ Emerging Bear−18.5%+262.8%
CIENCienaOptical Transport & Switching⚠️ Emerging Bear−11.1%+152.1%
CRDOCredo TechnologyOptical Transport & Switching🟢 Cont. Bull−24.0%+3.7%
FNFabrinetSpecialty Manufacturing & Components⚠️ Emerging Bear−12.7%+1.4%
MUMicron TechnologyMemory (DRAM/NAND)🟢 Cont. Bull+5.6%+525.1%
NVDANVIDIAAI & Data Center GPUs🟢 Cont. Bull+2.5%+25.8%

12-month price & trend

GLW
Corning
150
−4.36 (−2.82%)
vs. prior close
Price20d50d150d
GLW 12-month price
Display & Optical Materials
OLED
Universal Display
78.30
+1.83 (+2.39%)
vs. prior close
Price20d50d150d
OLED 12-month price
Display & Optical Materials
COHR
Coherent
317
+7.25 (+2.34%)
vs. prior close
Price20d50d150d
COHR 12-month price
Instrumentation & Test Equipment
TickerMkt capP/EP/E fwdP/SP/S fwdP/GPP/GP fwdEV/EBITDAFCF yld
GLW$129.3B67.9x45.7x7.6x6.7x21.0x18.5x34.9x1.9%
OLED$3.6B18.9x18.7x5.9x5.7x7.9x7.6x13.6x4.7%
COHR$57.6B67.7x31.2x8.1x5.4x21.6x14.5x38.5x-1.8%
LITE
Lumentum
931
+1.91 (+0.21%)
vs. prior close
Price20d50d150d
LITE 12-month price
Optical Transport & Switching
AAOI
Applied Optoelectronics
105
+3.65 (+3.60%)
vs. prior close
Price20d50d150d
AAOI 12-month price
RF & Wireless
CIEN
Ciena
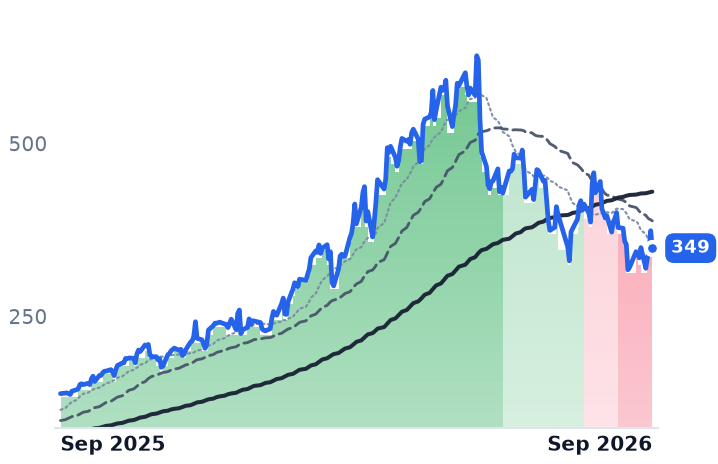
349
−25.19 (−6.74%)
vs. prior close
Price20d50d150d
CIEN 12-month price
Optical Transport & Switching
TickerMkt capP/EP/E fwdP/SP/S fwdP/GPP/GP fwdEV/EBITDAFCF yld
LITE$74.4Bn/m44.5x24.7x12.0x59.2x28.7xn/m0.7%
AAOI$9.1Bn/m153.1x15.3x8.7x52.7x30.0xn/m-4.5%
CIEN$56.0B128.1x60.5x10.1x8.9x23.4x20.6x77.4x1.5%
CRDO
Credo Technology
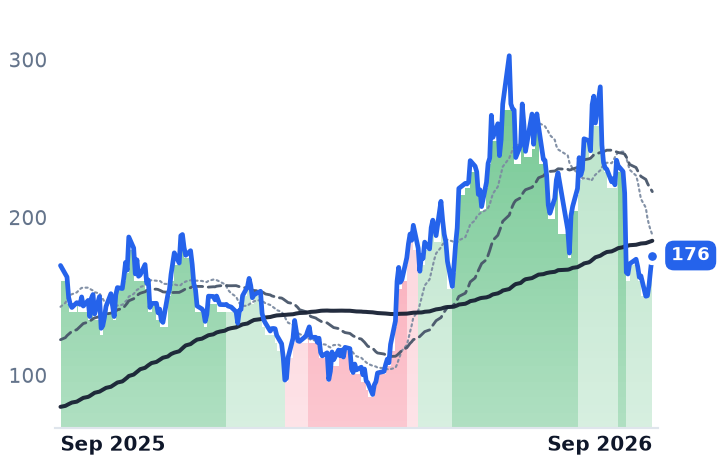
176
+8.42 (+5.03%)
vs. prior close
Price20d50d150d
CRDO 12-month price
Optical Transport & Switching
FN
Fabrinet
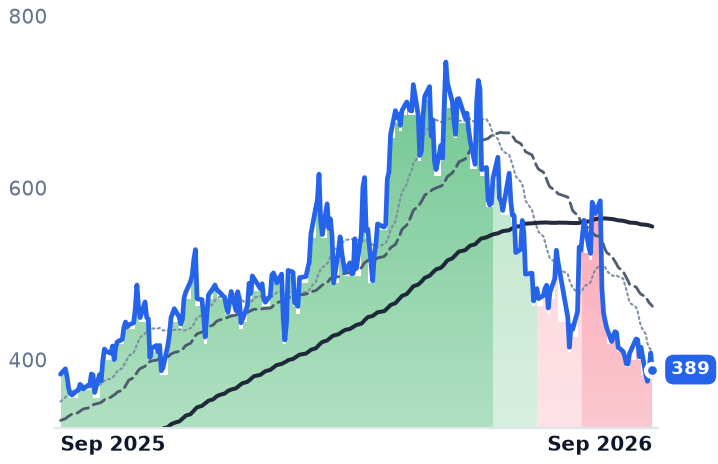
389
−19.35 (−4.74%)
vs. prior close
Price20d50d150d
FN 12-month price
Specialty Manufacturing & Components
MU
Micron Technology
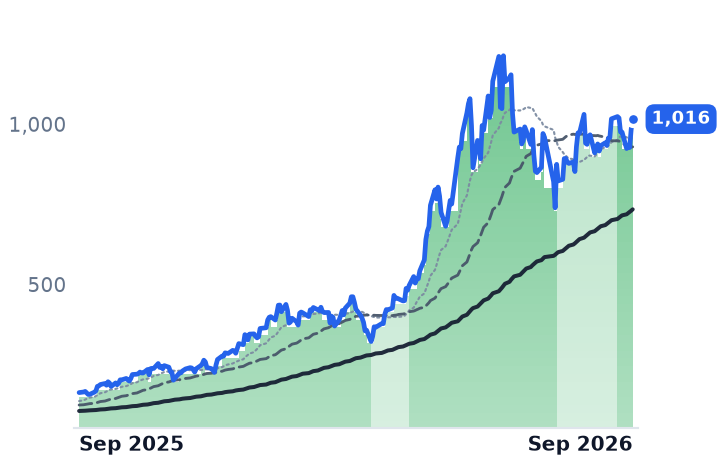
1,016
+32.22 (+3.28%)
vs. prior close
Price20d50d150d
MU 12-month price
Memory (DRAM/NAND)
TickerMkt capP/EP/E fwdP/SP/S fwdP/GPP/GP fwdEV/EBITDAFCF yld
CRDO$43.0B88.0x37.3x32.2x17.5x47.3x25.7x82.0x0.9%
FN$15.6B33.1x24.0x3.4x2.6x28.1x21.4x27.6x0.0%
MU$1.0T19.9x12.2x11.2x7.8x15.4x10.7x14.5x2.6%
NVDA
NVIDIA
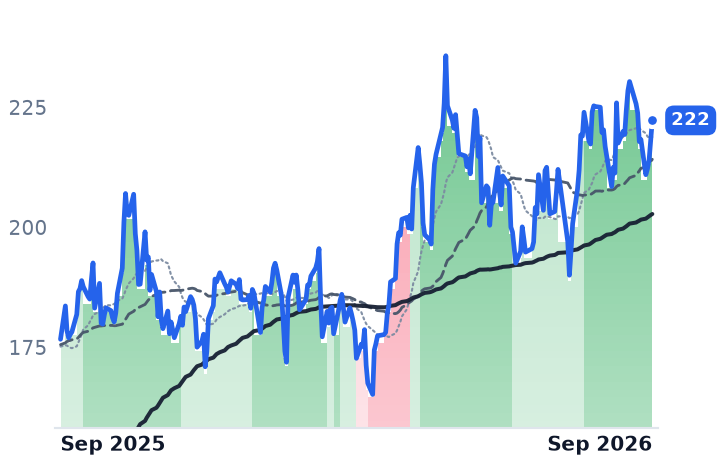
222
+4.21 (+1.93%)
vs. prior close
Price20d50d150d
NVDA 12-month price
AI & Data Center GPUs
TickerMkt capP/EP/E fwdP/SP/S fwdP/GPP/GP fwdEV/EBITDAFCF yld
NVDA$5.5T34.3x25.0x21.5x13.9x29.0x18.7x28.3x2.2%

Consensus projections

TickerFY2026EFY2027EFY2028E
GLWRevenue+17.6%+18.7%+21.3%
EPS+30.4%+32.3%+37.4%
OLEDRevenue−3.2%+7.7%+11.9%
EPS−15.3%+12.5%+22.1%
COHRRevenue+22.1%+49.9%+37.5%
EPS+56.5%+72.3%+48.9%
LITERevenue+83.9%+107.3%+52.3%
EPS+314.0%+161.3%+54.6%
AAOIRevenue+131.7%+182.3%+72.7%
EPS−327.3%+650.2%+92.2%
CIENRevenue+34.4%+26.9%+27.3%
EPS+160.5%+48.0%+47.5%
CRDORevenue+211.9%+85.0%+49.7%
EPS+423.2%+86.8%+48.2%
FNRevenue+35.6%+32.3%+19.4%
EPS+36.2%+31.5%+19.4%
MURevenue+248.0%+92.8%+11.4%
EPS+804.9%+111.2%+7.9%
NVDARevenue+65.1%+84.2%+43.2%
EPS+59.0%+91.7%+42.0%

Forward fiscal years only. Blank means no analyst coverage for that year.

Corning filed on September 11 for a $2bn at-the-market equity program through Goldman Sachs, with no preset price, share count or timetable. When the market read it the following Monday, the shares fell 13.7%, the worst showing in the S&P 500 that day. Six days earlier the company had announced a multi-year, multi-billion-dollar agreement with Verizon for more than 80 million miles of high-density optical fiber and connectivity, running from 2027 to 2032.

That sequence is the story. Corning — which sells optical fiber, cable and connectors to carriers and data-center operators, glass substrates to panel makers, and ceramic emissions substrates to carmakers — is raising money to build capacity customers have already reserved. Amazon signed in June for US data-center fiber, with 1,000 manufacturing jobs in North Carolina; NVIDIA has committed up to $3.2bn through a warrant arrangement to support the same build; Meta has reserved up to $6bn of capacity through 2030 and Lumen a tenth of global fiber capacity. The equity program is a cost-of-capital event, and the market priced it as a demand one.

What the order book did

Corning's optical communications sales grew 32% year on year to $2.07bn in the June quarter, enterprise networks up 65% to $1.27bn and segment net income up 77%. Company-defined core sales rose 17% to $4.74bn with core earnings of $0.78 a share against $0.64 reported, a gap the company attributes principally to hedged currency exposures and largely non-cash discrete tax items. September-quarter guidance was raised to $4.9-5.0bn of sales and core earnings up about 28%. "We are entering a new phase of accelerating growth," chairman and chief executive Wendell Weeks told investors on the July 28 call, alongside an upgraded plan targeting $40bn of annualized sales by the end of 2030.

None of that stopped the shares. They sit 41.3% below their June 29 close of $255.69, having already dropped 18.2% in the July 28 session on handset cover-glass guidance, and are still up 88.7% over twelve months. Corning trades at 45.7 times forward earnings against roughly 52 times in May, and at 21 times gross profit against 24.1 times in August. On the 2027 consensus of $4.35 a share, from ten analysts whose estimates have not been cut, the multiple is 34.5 times; the free cash flow yield is 1.85%. The extreme has come out; the premium has not.

The other meter

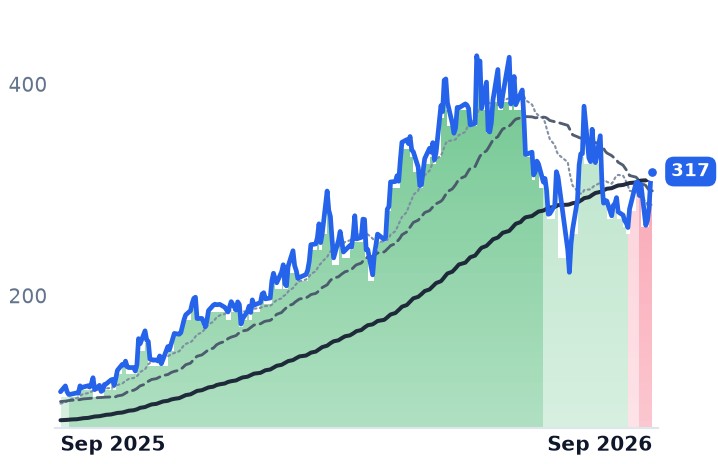
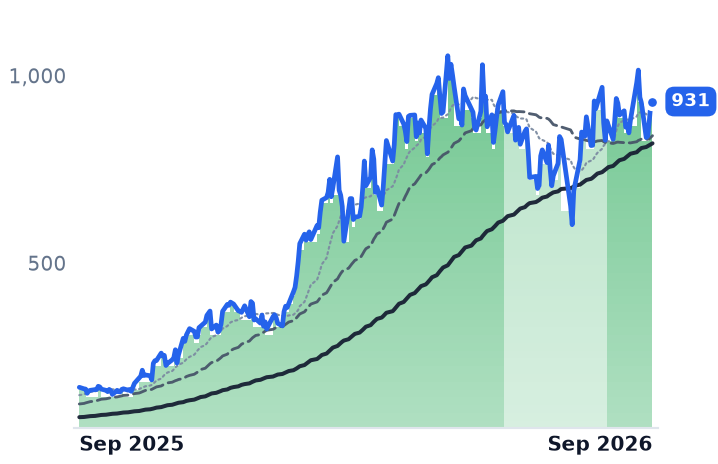
Universal Display ships neither panel nor cable. It sells phosphorescent emitter material by the gram and licenses roughly 5,500 patents for royalties and fixed fees, with 469 employees. It fell 8.3% in the same September 14 session, when the whole optical and chip complex sold off after Anthropic's Dario Amodei argued for slowing the pace of frontier-model improvement — Coherent down 12.7%, Lumentum 9.9%, Ciena 8.6%, Micron 5.3%.

It earns nothing from data centers. Its trouble is the boom's second-order effect: memory demand has raised DRAM and NAND prices, raised smartphone bills of materials, and cut build plans. "Rising memory costs and supply constraints continue to weigh on demand expectations, particularly within the smartphone market," chief executive Steven Abramson said of the June quarter. Fewer phones means less panel area, and less panel area means fewer grams. Material sales fell to $66.2m from $88.7m, while royalty and license fees rose to $81.2m helped by a $16.3m favorable catch-up adjustment. Revenue declined 11.4%, the third annual fall in four quarters; operating margin went from 39.9% to 35.3%; full-year guidance was narrowed to the low end of $630-670m. At 18.9 times trailing and 18.7 times forward earnings, the shares price no growth whatever, against an enterprise value of 13.6 times earnings before interest, tax, depreciation and amortization versus about 17 times in May.

The verdict

The two fell on the same day for different reasons, and the classification code that groups them hides the fact that they sit on opposite sides of one mechanism. Corning's de-rating is explained by a cover-glass volume guide and by the price of equity capital; its optical business is growing faster than its guidance and its estimates have not moved. Universal Display's is a genuine volume decline in the material it sells, and the recovery case rests on Gen 8.6 lines at Samsung Display and BOE and on blue phosphorescent emitters — which LG Display has verified at mass-production performance, cutting power consumption 15%, but for which management has given no commercialization date.

The sharpest thing in the September 14 record is that an essay about how fast laboratories should train models knocked 8.3% off a royalty business whose product ends up inside a telephone. Corning's problem is that AI infrastructure costs money to build. Universal Display's is that somebody else is buying the memory.

Aon Sold $13.5bn of USI Bonds Into $65bn of Orders and the Broker Group Fell 9%

Hypothesis Opus 5 · Research Opus 5 · Writing Opus 5 · Prompt v1.6

The five listed insurance brokers were sold together over eleven sessions in September, and four of them had no news to sell on. What splits the group is how each one gets paid.

A retail broker earns a percentage of the premium it places, and that premium base has now shrunk for eight straight quarters — global commercial rates fell 6% in the June quarter, property 12%. Yet organic growth barely moved: Aon, Marsh and Willis Towers Watson each grew 5% and Gallagher 6%, and consensus 2026 earnings for Aon sit unchanged at $18.79. Gallagher Bassett, the claims arm paid a fee per file rather than a share of premium, grew 12%.

The twelve-month losses rank almost exactly by premium linkage, from Brown & Brown at the bottom to fee-heavy Willis at the top. The de-rating is price, not estimates.

AONAJGBROWTWMRSHSPYInsurance Brokerage CommissionsSoft P&C MarketProperty Rate ResetClaims Administration FeesInvestment-Grade Bond IssuanceBroker M&A Multiples
TickerCompanySegmentTrend · 13mo30D1Y
The subject · what this brief is about
AONAonGlobal Risk & Insurance Brokers🌱 Emerging Bull−16.2%−15.6%
AJGArthur J. GallagherGlobal Risk & Insurance Brokers🌱 Emerging Bull−7.9%−19.6%
Compared against · context, not the story
BROBrown & BrownRetail & Specialty Brokers🌱 Emerging Bull−10.3%−28.6%
WTWWillis Towers Watson PublicGlobal Risk & Insurance Brokers⚠️ Emerging Bear−9.1%−7.1%
MRSHMarsh & McLennan CompaniesGlobal Risk & Insurance Brokers🔴 Cont. Bear−8.2%−9.7%
SPYState Street SPDR S&P 500 ETF TrustAsset Management🟢 Cont. Bull−0.2%+15.4%

12-month price & trend

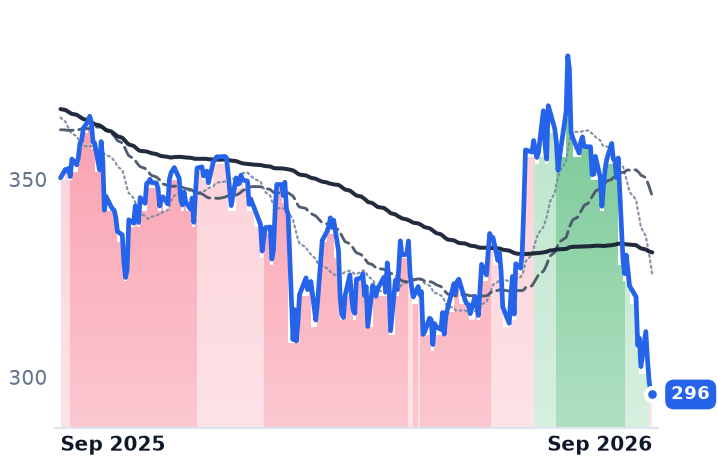
AON
Aon
296
−0.41 (−0.14%)
vs. prior close
Price20d50d150d
AON 12-month price
Global Risk & Insurance Brokers
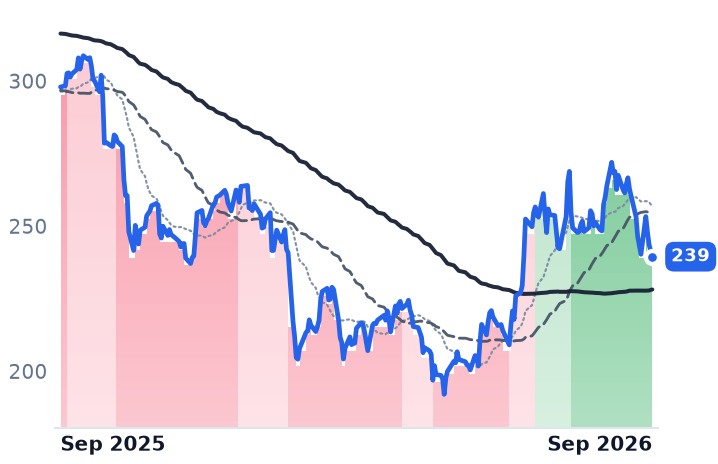
AJG
Arthur J. Gallagher
239
−1.97 (−0.81%)
vs. prior close
Price20d50d150d
AJG 12-month price
Global Risk & Insurance Brokers
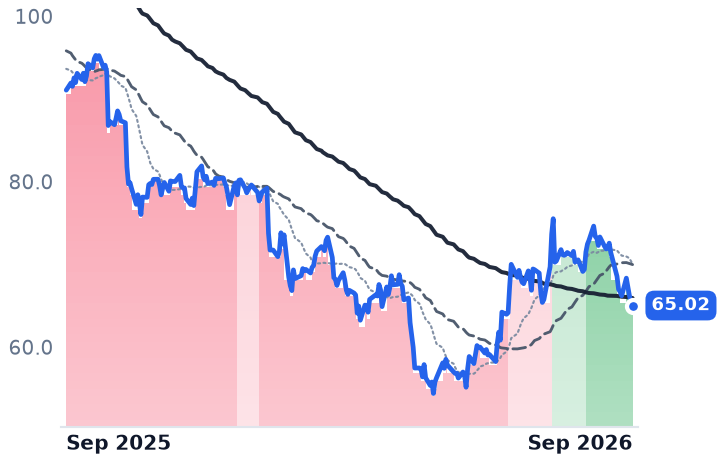
BRO
Brown & Brown
65.02
−0.42 (−0.64%)
vs. prior close
Price20d50d150d
BRO 12-month price
Retail & Specialty Brokers
TickerMkt capP/EP/E fwdP/SP/S fwdP/GPP/GP fwdEV/EBITDAFCF yld
AON$62.7B16.2x15.7x3.6x3.5x4.3x4.2x12.3x5.2%
AJG$61.5B39.3x18.1x3.9x3.7x5.2x4.9x15.7x3.7%
BRO$21.8B18.0x14.5x3.2x3.1x5.4x5.3x11.9x6.9%
WTW
Willis Towers Watson Public
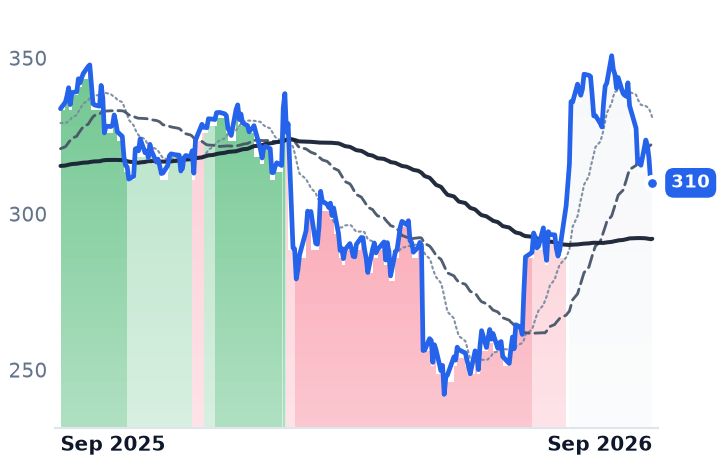
310
+0.00 (+0.00%)
vs. prior close
Price20d50d150d
WTW 12-month price
Global Risk & Insurance Brokers
MRSH
Marsh & McLennan Companies
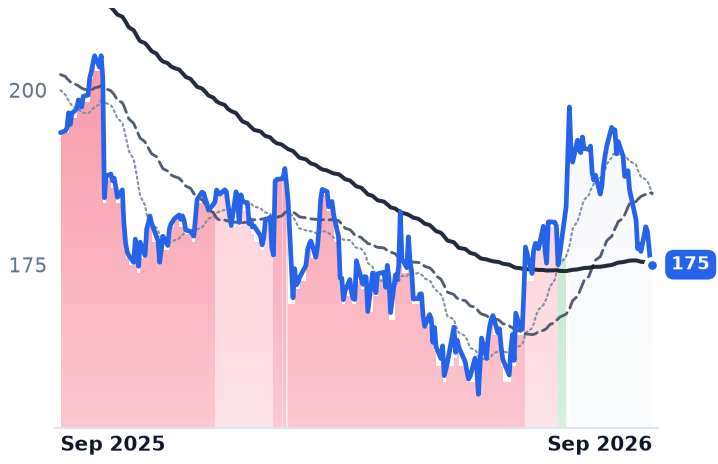
175
−0.10 (−0.05%)
vs. prior close
Price20d50d150d
MRSH 12-month price
Global Risk & Insurance Brokers
SPY
State Street SPDR S&P 500 ETF Trust
762
+1.49 (+0.20%)
vs. prior close
Price20d50d150d
SPY 12-month price
Asset Management
TickerMkt capP/EP/E fwdP/SP/S fwdP/GPP/GP fwdEV/EBITDAFCF yld
WTW$28.8B19.0x15.6x2.8x2.8x5.3x5.1x12.8x5.9%
MRSH$77.6B19.9x15.5x2.8x2.7x6.7x6.4x14.7x6.4%
SPY$773.0B

Consensus projections

TickerFY2026EFY2027EFY2028E
AONRevenue+3.8%+15.5%+6.8%
EPS+10.8%+9.7%+15.5%
AJGRevenue+20.4%+8.8%+8.9%
EPS+23.9%+12.7%+12.8%
BRORevenue+17.6%+4.3%+5.9%
EPS+5.7%+7.8%+9.0%
WTWRevenue+8.7%+5.3%+5.6%
EPS+16.9%+15.4%+18.6%
MRSHRevenue+5.5%+5.0%+5.1%
EPS+8.4%+8.8%+8.9%

Forward fiscal years only. Blank means no analyst coverage for that year.

Aon completed the borrowing for its $17bn purchase of USI Insurance Services in the middle of September, raising $13.5bn across seven tranches of dollar bonds and drawing as much as $65bn of orders — enough demand to tighten price talk on the 30-year piece by 0.35 percentage points, to 1.15 points over Treasuries. A roughly $4bn term loan is expected to finish the package. The equity went the other way: Aon's shares closed at $295.64 on 18 September against $327.00 on 3 September.

And not only Aon's. Over the same eleven sessions Gallagher fell 10.2%, Brown & Brown 10.4%, Willis Towers Watson 9.4% and Marsh & McLennan 7.1% — an equal-weight 9.1% against 1.5% for the S&P 500 ETF. No company-specific news for the other four was discoverable in that window; the likelier reading is a sector de-rating rather than anything issued by these companies, and there is no positioning data to say more. What is being repriced is the unit of revenue itself. A retail broker is paid a percentage of the premium it places, so when property-and-casualty rates soften, the same policy on the same risk pays less next year without a single client lost.

Eight quarters of a shrinking base

That base has been shrinking. Marsh's own index of global commercial insurance rates showed them down 6% in the second quarter after a 5% fall in the first, with property off 12% while casualty rose 2%. Broker-reported account data says the same: average commercial premiums declined in the first quarter for the first time in nearly nine years, ending a 33-quarter run of increases, with commercial property down 7.1%.

The revenue lines have absorbed it so far. Aon, Marsh and Willis Towers Watson each grew 5% organically in the June quarter and Gallagher 6%; Aon put the net market impact at zero to two points of growth against roughly ten points from new business for nine consecutive quarters, with retention in the mid-90s. Softening rates have cost a point or two of price, not a client base.

The part that does not reprice

Gallagher is the clean test, because half its identity is not a commission at all. Gallagher Bassett, its claims-administration arm, is paid a fee per claim handled for self-insured employers and public entities, and it competes with Sedgwick and Crawford rather than with Aon. That book grew 12% organically in the second quarter on a 22.3% adjusted margin, 1.4 points wider, with management guiding the segment to stay above 22% — roughly double the 5.5% to 6% pace of the premium-linked brokerage arm, and ahead of the 9% the company had guided to.

"Every other past soft market, the market has dropped like a brick across every line all at once," chairman and chief executive J. Patrick Gallagher Jr. said on the 30 July call. "This is a property reset." On the same call, asked whether private-market prices for middle-market brokers had adjusted, he said of rivals claiming otherwise: "It ain't happening. Multiples are coming down." Chief financial officer Doug Howell put Gallagher's tuck-in price at around nine times earnings for US retail and benefits businesses — against the 14.5 times post-synergy Aon agreed to pay for USI.

The market has ranked them by exposure

Over twelve months the losses line up almost exactly with premium linkage. Brown & Brown, the Daytona Beach broker most exposed to catastrophe property and to commission, posted organic revenue of -0.7% excluding contingent commissions and is down 29.2%. Then Gallagher at -19.3%, Aon at -16.2%, Marsh at -10.8%, and Willis Towers Watson — whose Health, Wealth and Career half bills per project and per participant — down 6.5%, the least of the five.

The second income line moved too, and is about to move back. Fiduciary investment income, the yield a broker earns on client premium held in trust, fell 12% at Aon to $58m in the June quarter; Marsh's interest income was $19m for the half against $24m, which it attributed to lower average rates. The Federal Reserve's 25 basis-point increase on 16 September, its first since 2023, reverses that headwind — while raising the discount rate applied to capital-light compounders and the coupon Aon pays on its new debt.

What the business earns and what it does not

Aon now trades at 15.7 times forward earnings, against 17.6 times on 2 September and 20.2 times at last September's high, on consensus 2026 earnings of $18.79 that have not moved — compression of the multiple, not cuts to the numbers, on a 12.3 times enterprise-value-to-earnings-before-interest-tax-depreciation-and-amortization and a 5.2% free-cash-flow yield. Some of that discount is earned: leverage reaches 4.8 times at closing, buybacks are suspended, and the deal dilutes 2027 earnings before adding to 2028. Gallagher is the opposite case — the group's most expensive at 18.1 times forward and its thinnest cash yield at 3.7%, with consensus revenue growth halving from 20.4% this year to 8.8% next as AssuredPartners anniversaries. Brown & Brown is cheapest at 14.5 times, Willis 15.6 times with the best cash yield of the five, Marsh about 17 times at its 18 September close.

So the soft market is real and the ordering of the selling is rational. What nothing in the reported numbers explains is the eleven sessions themselves: organic growth held, estimates held, and the only fee stream genuinely indifferent to premium pricing is growing at twice the brokerage rate — yet it sits inside the most expensive name in the group. In February the same four brokers gapped down together on an artificial-intelligence shopping app; the market has now marked this segment twice in a year for two unrelated reasons, and neither showed up in a revenue line.

The next reading is the third-quarter prints in late October, where the split between rate and new business inside that 5% is disclosed. Aon's lenders got nearly five times the book they needed; its shareholders are waiting on a smaller number.

CBRE Guided 2026 Core Earnings Up 23% as the Ten-Year Treasury Topped 5%

Hypothesis Opus 5 · Research Opus 5 · Writing Opus 5 · Prompt v1.6

A month of selling has taken every listed commercial property services firm down together, and the reported numbers went the other way. CBRE raised its full-year forecast in late July, with each of its four segments growing operating profit by more than a quarter and data-center services revenue up nearly 30% to more than $700m. US investment sales volume rose 11.8% in the first half.

What changed was the price of money: the ten-year Treasury yield reached its highest level since October 2023 and the Federal Reserve raised rates on September 16. One company-level crack exists. Newmark declined to raise guidance on tougher second-half comparisons, its operating margin fell to 4.55% on 17% revenue growth, and it is the only one of the five that sold off on its own results.

CBRENMRKJLLCWKCIGICommercial Property ServicesData-Center BuildoutLong-End Treasury YieldsInvestment Sales VolumeFacilities Management ContractsOffice Leasing Demand
TickerCompanySegmentTrend · 13mo30D1Y
The subject · what this brief is about
CBRECBRECommercial Real Estate Services🟢 Cont. Bull−8.8%−15.0%
NMRKNewmarkCommercial Real Estate Services⚠️ Emerging Bear−13.9%−26.9%
Compared against · context, not the story
JLLJones Lang LaSalle IncorporatedCommercial Real Estate Services🟢 Cont. Bull−13.2%+5.6%
CWKCushman & WakefieldCommercial Real Estate Services⚠️ Emerging Bear−16.4%−25.5%
CIGIColliers InternationalCommercial Real Estate Services🔴 Cont. Bear−16.2%−45.4%

12-month price & trend

CBRE
CBRE
140
−0.55 (−0.39%)
vs. prior close
Price20d50d150d
CBRE 12-month price
Commercial Real Estate Services
NMRK
Newmark
13.94
−0.32 (−2.24%)
vs. prior close
Price20d50d150d
NMRK 12-month price
Commercial Real Estate Services
JLL
Jones Lang LaSalle Incorporated
336
−3.62 (−1.06%)
vs. prior close
Price20d50d150d
JLL 12-month price
Commercial Real Estate Services
TickerMkt capP/EP/E fwdP/SP/S fwdP/GPP/GP fwdEV/EBITDAFCF yld
CBRE$40.4B31.8x17.8x0.9x0.9x5.2x4.9x18.3x2.3%
NMRK$2.2B16.8x7.1x0.6x0.6x0.6x0.6x8.2x36.6%
JLL$15.5B15.8x13.5x0.6x0.5x0.6x0.6x11.5x8.0%
CWK
Cushman & Wakefield
12.40
−0.22 (−1.74%)
vs. prior close
Price20d50d150d
CWK 12-month price
Commercial Real Estate Services
CIGI
Colliers International
89.61
+0.15 (+0.17%)
vs. prior close
Price20d50d150d
CIGI 12-month price
Commercial Real Estate Services
TickerMkt capP/EP/E fwdP/SP/S fwdP/GPP/GP fwdEV/EBITDAFCF yld
CWK$2.9B42.5x8.4x0.3x0.3x1.6x1.6x12.8x10.4%
CIGI$4.5B41.5x11.9x0.7x0.7x2.7x2.6x11.1x4.5%

Consensus projections

TickerFY2026EFY2027EFY2028E
CBRERevenue+15.4%+11.3%+9.7%
EPS+23.7%+14.8%+13.0%
NMRKRevenue+16.8%+9.2%+8.4%
EPS+22.2%+13.0%+9.7%
JLLRevenue+11.9%+7.5%+6.8%
EPS+43.4%+12.2%+14.0%
CWKRevenue+58.6%+6.5%+6.1%
EPS+20.5%+17.4%+15.4%
CIGIRevenue+16.1%+8.6%+3.0%
EPS+12.8%+13.5%+11.1%

Forward fiscal years only. Blank means no analyst coverage for that year.

The forecast went up

CBRE Group, the Dallas firm that brokers leases, arranges mortgages and runs buildings for corporate occupiers, told investors on July 29 that it would earn more this year than it had previously said. It raised core earnings guidance to $7.80–$7.90 a share from $7.60–$7.80 — about 23% growth at the midpoint on its adjusted measure, which strips out items management treats as non-operating. The stock rose the day of the print, reached $155.07 by August 19, and has since fallen to $139.50.

That decline is not CBRE's alone, and it is not old. Measured from the August 19 close, the five listed commercial real estate services firms fell between 10% and 19% to September 18. But August 19 was itself a single-session jump — CBRE up 5.3%, Cushman & Wakefield 8.5% — after the Treasury said it would at least double its buybacks of ten- to thirty-year debt, knocking the ten-year yield to 4.637%. From the day before that spike, the declines run 5% to 15%. The month begins and ends with the bond market: the ten-year topped 5.04% in the week to September 14, its highest since October 2023, and the Federal Reserve then raised its target range 25 basis points to 3.75%–4.00%, its first increase since 2023. Every fee attached to a building is being discounted at a higher rate.

What the fees actually are

Half of CBRE's work is not a commission. Building Operations & Experience and Project Management, which houses the Turner & Townsend consultancy, bill per facility and per square foot under multi-year contracts; Advisory holds the transactional half, where a fee exists only if a lease is signed or a building trades. In the June quarter the contracted side grew 15% and the transactional side 19% — the recurring revenue is growing slightly slower than the deal revenue, so the selling cannot be read as a markdown of per-square-foot operations specifically. All four segments grew operating profit by more than 25% on 16% revenue growth.

The growth engine is increasingly a machine room rather than an office tower. Data-center services revenue rose nearly 30% to more than $700m and infrastructure work more than 45% to nearly $1.2bn. Chair and chief executive Robert Sulentic told the July 29 call that more than half of data-center revenue is now downstream work — managing and refitting operating facilities — and that he expects roughly 25% annual growth there for five years. On office, he said: "We generated our highest U.S. office leasing revenue for any second quarter, driven by large deals in gateway markets."

One caveat belongs beside the core number. On US accounting rules CBRE's second-quarter operating income fell 2.4% to $365m even as revenue rose 15.1%; across the first half, the same line rose 34.8%. The quarter is a distortion, but the gap between reported and core is real, and it runs through the valuation too: CBRE's 17.8x forward multiple is built on consensus core earnings while its 31.8x trailing figure uses reported earnings of about $4.36. The apparent compression is largely definitional.

The one that fell on its own numbers

Newmark, the New York brokerage that earns investment-sales and debt fees plus a government-sponsored-enterprise origination and loan-servicing annuity, is the exception worth isolating. It reported an eighth straight quarter of double-digit revenue growth — $888m, up 17%, with management and servicing revenue up 18% — and its shares fell 6.3% over the print. It held 2026 guidance rather than raising it, citing tougher second-half comparisons and transaction timing, and its operating margin compressed to 4.55% from 5.63%: producer compensation absorbed the entire revenue gain. Raymond James downgraded it to Market Perform on "greater sensitivity to investment sales revenue relative to its peers". Against that, net leverage is one times, and the shares sit at 8.2x trailing enterprise value to earnings before interest, tax, depreciation and amortization.

The rest went the other way on results. Jones Lang LaSalle rose 6.4% the day it reported, with operating income up 33% and the group's cheapest-relative-to-growth rating at 13.5x forward earnings. Cushman & Wakefield raised adjusted earnings growth guidance to 18%–23% and cut net leverage to three times, though its capital markets revenue slipped 1% on what chief executive Michelle MacKay called an air pocket in institutional portfolio trades; it trades at 8.4x. Colliers, at 11.9x, grew revenue 14.7% but carries a share-count discontinuity in its reported history that makes per-share comparisons unreliable.

What the fall does and does not earn

Demand is not the problem. US investment sales reached $122.4bn in the first half, up 11.8%, with first-quarter office volume up 39%, and private-label commercial mortgage-backed issuance passed $76.2bn through July. The twelve-month de-rating is not a grind either: all five dropped 11% to 14% in the single session of February 11–12 on fears that artificial intelligence erodes the information asymmetry commissions are paid for — the steepest one-day falls since 2020 for CBRE and Cushman & Wakefield.

So the market has priced two things the reported numbers do not yet show: cheaper information destroying brokerage economics, and dearer money shrinking what any fee stream is worth today. The rates half is defensible arithmetic and applies to contracted revenue as much as to commissions. The artificial-intelligence half remains a forecast, and CBRE's premium — the most expensive of the five on forward earnings — is where it costs most if it proves right. Newmark's decision not to raise guidance is the only company-level evidence on the bears' side of either argument, and it concerns deal timing rather than fee rates.

Most Federal Reserve participants expect another increase before year-end. Buildings will still need leasing, managing and refinancing at any funds rate; what has changed is the price the market will pay today for the right to bill for it.

Blue Owl Capped Withdrawals From Its $36bn Credit Fund at 5% as Investors Asked for 21.9%

Hypothesis Opus 5 · Research Opus 5 · Writing Opus 5 · Prompt v1.6

A year of selling has treated every listed private-capital manager as one trade. The businesses say it is two.

Blue Owl's fee-related earnings rose 9.5% to $392.2m in the June quarter and assets under management reached $319bn, up 12%, while the shares lost nearly half their value. What broke was the channel, not the credit: retail holders of its flagship non-traded business development company asked for 21.9% of shares back in the first quarter and 18.8% in the second, and the fund paid the 5% quarterly cap. The market halved Blue Owl's forward earnings multiple to 11.1x; BlackRock's barely moved, at 19.0x. Apollo, whose profit comes mostly from an annuity spread nobody can redeem, fell 12.3% and still originated $74bn in a quarter. The one genuine impairment at Blue Owl is coverage — a $0.92 dividend against roughly $0.88 of distributable earnings.

OWLAPOOBDCBXBLKKKRARESCGAMGBENIVZTROWSPYPrivate Credit RedemptionsNon-Traded BDCsMiddle-Market Direct LendingRetail Fundraising ChannelDividend Coverage
TickerCompanySegmentTrend · 13mo30D1Y
The subject · what this brief is about
OWLBlue Owl CapitalAlternative & Private Capital🌱 Emerging Bull−16.4%−46.7%
APOApollo Global ManagementAlternative & Private Capital🌱 Emerging Bull−5.8%−11.5%
Compared against · context, not the story
OBDCBlue Owl CapitalBusiness Development & Specialty Finance🔴 Cont. Bear−0.5%−10.6%
BXBlackstoneAlternative & Private Capital🌱 Emerging Bull−13.3%−31.9%
BLKBlackRockDiversified Asset Managers🌱 Emerging Bull−9.2%−6.5%
KKRKKRAlternative & Private Capital🌱 Emerging Bull−9.9%−33.1%
ARESAres ManagementAlternative & Private Capital🌱 Emerging Bull−11.2%−29.3%
CGThe CarlyleAlternative & Private Capital🔴 Cont. Bear−17.0%−40.1%
AMGAffiliated ManagersDiversified Asset Managers🟢 Cont. Bull−2.0%+42.6%
BENFranklin ResourcesDiversified Asset Managers🟢 Cont. Bull−2.8%+41.1%
IVZInvescoDiversified Asset Managers🟢 Cont. Bull−5.2%+37.1%
TROWT. Rowe PriceDiversified Asset Managers🟢 Cont. Bull−8.1%+0.2%
SPYState Street SPDR S&P 500 ETF TrustAsset Management🟢 Cont. Bull−1.2%+15.8%

12-month price & trend

OWL
Blue Owl Capital
9.84
−0.43 (−4.14%)
vs. prior close
Price20d50d150d
OWL 12-month price
Alternative & Private Capital
APO
Apollo Global Management
126
−1.20 (−0.94%)
vs. prior close
Price20d50d150d
APO 12-month price
Alternative & Private Capital
OBDC
Blue Owl Capital
11.27
+0.21 (+1.94%)
vs. prior close
Price20d50d150d
OBDC 12-month price
Business Development & Specialty Finance
TickerMkt capP/EP/E fwdP/SP/S fwdP/GPP/GP fwdEV/EBITDAFCF yld
OWL$15.4B82.8x11.1x5.1x5.4x8.4x8.9x20.4x8.6%
APO$72.5B27.3x14.4x2.0x3.1x2.4x3.7x6.3x11.0%
OBDC$5.5B19.9x8.6x3.9x3.5x5.8x5.2x13.9x20.7%
BX
Blackstone
126
−0.52 (−0.41%)
vs. prior close
Price20d50d150d
BX 12-month price
Alternative & Private Capital
BLK
BlackRock
1,052
−4.89 (−0.46%)
vs. prior close
Price20d50d150d
BLK 12-month price
Diversified Asset Managers
KKR
KKR
99.55
+0.06 (+0.06%)
vs. prior close
Price20d50d150d
KKR 12-month price
Alternative & Private Capital
TickerMkt capP/EP/E fwdP/SP/S fwdP/GPP/GP fwdEV/EBITDAFCF yld
BX$151.0B27.8x20.8x9.4x10.4x10.6x11.7x19.3x2.9%
BLK$165.8B25.2x19.0x6.1x5.7x10.9x10.2x15.9x1.4%
KKR$88.7B29.4x14.9x4.2x8.4x18.7x37.2x13.2x2.6%
ARES
Ares Management
127
+0.22 (+0.17%)
vs. prior close
Price20d50d150d
ARES 12-month price
Alternative & Private Capital
CG
The Carlyle
40.98
−0.48 (−1.15%)
vs. prior close
Price20d50d150d
CG 12-month price
Alternative & Private Capital
AMG
Affiliated Managers
348
−1.51 (−0.43%)
vs. prior close
Price20d50d150d
AMG 12-month price
Diversified Asset Managers
TickerMkt capP/EP/E fwdP/SP/S fwdP/GPP/GP fwdEV/EBITDAFCF yld
ARES$40.7B54.1x21.1x6.4x7.5x10.2x12.0x21.6x2.1%
CG$17.7B48.7x13.7x4.5x4.8x6.3x6.7x35.2x-11.3%
AMG$7.8B10.4x8.5x3.3x3.3x4.8x4.9x6.7x13.8%
BEN
Franklin Resources
33.02
−0.12 (−0.37%)
vs. prior close
Price20d50d150d
BEN 12-month price
Diversified Asset Managers
IVZ
Invesco
30.54
−0.17 (−0.55%)
vs. prior close
Price20d50d150d
IVZ 12-month price
Diversified Asset Managers
TROW
T. Rowe Price
103
−1.21 (−1.16%)
vs. prior close
Price20d50d150d
TROW 12-month price
Diversified Asset Managers
TickerMkt capP/EP/E fwdP/SP/S fwdP/GPP/GP fwdEV/EBITDAFCF yld
BEN$16.5B20.3x11.6x1.8x2.4x2.5x3.2x16.0x5.6%
IVZ$12.0Bn/m10.5x1.8x2.3x3.6x4.6x16.7x13.2%
TROW$21.9B10.9x10.8x3.0x2.9x4.3x4.2x6.4x10.7%
SPY
State Street SPDR S&P 500 ETF Trust
760
+6.15 (+0.82%)
vs. prior close
Price20d50d150d
SPY 12-month price
Asset Management
TickerMkt capP/EP/E fwdP/SP/S fwdP/GPP/GP fwdEV/EBITDAFCF yld
SPY$773.0B

Consensus projections

TickerFY2026EFY2027EFY2028E
OWLRevenue+6.2%+10.5%+15.5%
EPS+7.9%+11.5%+14.6%
APORevenue+26.9%+16.3%+14.0%
EPS+10.4%+22.4%+15.5%
OBDCRevenue−15.3%−1.6%−0.6%
EPS−15.4%−0.8%−6.1%
BXRevenue+13.8%+25.4%+4.6%
EPS+12.3%+24.2%+11.7%
BLKRevenue+21.1%+11.8%+13.3%
EPS+19.1%+14.6%+14.4%
KKRRevenue+34.2%+17.5%+31.4%
EPS+34.4%+11.5%+15.6%
ARESRevenue+17.8%+19.4%+9.7%
EPS+17.1%+24.2%+18.1%
CGRevenue−1.7%+36.3%+9.0%
EPS−10.1%+41.6%+15.4%
AMGRevenue+12.0%+10.6%+11.2%
EPS+35.0%+14.5%+18.4%
BENRevenue+6.0%+6.2%+6.7%
EPS+28.6%+6.8%+7.3%
IVZRevenue+10.7%+6.0%+2.9%
EPS+29.0%+14.5%+12.3%
TROWRevenue+1.5%+2.1%+1.3%
EPS−3.3%+0.4%−1.8%

Forward fiscal years only. Blank means no analyst coverage for that year.

Blue Owl Capital told holders of its largest non-traded credit fund this year that they could have 5% of their money back. They had asked for a great deal more. Investors in Blue Owl Credit Income Corp., a roughly $36bn vehicle that lends to mid-sized American companies, requested withdrawal of 21.9% of shares outstanding in the first quarter and 18.8%, or $3.6bn, in the second; the fund repurchased at its standard cap of 5% of net asset value per quarter, satisfying about 27% of each second-quarter request. Moody's cut the fund's outlook to negative, citing "significantly higher-than-peer redemption requests in the first quarter."

That is the money at issue, and it is not the fund's money. Blue Owl, a New York manager that does direct lending, buys minority stakes in other private-capital firms and writes sale-leasebacks on corporate real estate, earns almost all of its profit as contracted management fees on fee-paying assets. The semi-liquid retail vehicle is where that fee base had been growing fastest. When the retail door jammed, the market repriced the fee stream behind it — and left the fee streams that have no such door alone.

The fee dollar, and what can be taken back

The reported numbers have not yet broken. Second-quarter fee-related earnings were $392.2m, up about 9.5% year on year, on $319.0bn of assets under management, of which $190.6bn pays fees; a further $31.1bn is committed but not yet earning, worth roughly $380m of annual fees once deployed. The firm raised $7.8bn in the quarter and $50.5bn over twelve months. Co-chief executive Marc Lipschultz told investors on the second-quarter call that the redemption wave "has stayed very concentrated in the products where the narrative and the conversations perhaps got most carried away."

What has broken is the trajectory. Reported revenue growth decelerated across four quarters, from 21.2% year on year in the September 2025 quarter to 7.1% in June 2026, and consensus now has full-year revenue up 6.2% with earnings before interest, taxes, depreciation and amortization falling 1.0% before a reacceleration in 2027. The shares fell 48.5% over twelve months. On unchanged 2026 consensus earnings per share of $0.89, the forward multiple halved, from 21.6x to 11.1x.

The second impairment is arithmetic. Distributable earnings ran $0.22 per adjusted share in the quarter against a declared quarterly dividend of $0.23 and an announced annual dividend of $0.92 — a payout near 105% of what the business currently distributes. It is the yield being repriced, more than the fees.

The loans themselves

Blue Owl Capital Corporation, the firm's listed business development company, lends senior secured debt to middle-market borrowers and trades at 0.79x book against a net asset value of $14.26 per share. Its credit is not the problem: non-accruals were 0.8% of the portfolio at fair value in the June quarter, payment-in-kind income — interest taken in more debt rather than cash — fell to 10.7% of total investment income from above 13% two years ago, and net leverage of 1.11x was the lowest in over two years. "Since inception, our platform loss rate has been just 12 bps," chief executive Craig Packer said on the August 6 call. The vehicle bought $35m of its own shares in the quarter. But its base dividend was cut from $0.37 to $0.31, and consensus has its earnings per share falling to $1.30 this year from $1.54.

Apollo, the same asset without the door

Apollo Global Management fell 12.3% over the same year — a third of Blue Owl's decline — and its forward multiple went from 16.4x to 14.4x. Its June quarter produced $877m of spread-related earnings, the gap between asset yields and what it owes annuity holders at Athene, against $785m of fee-related earnings, up 25%. Athene's net spread widened sequentially to 114 basis points from 97, after compressing over the year as its cost of funds rose to 3.79% from 3.46%. Apollo originated $74bn in the quarter and led a record $35bn financing for Broadcom's artificial-intelligence platform. Apollo and Ares both crossed their 50-day averages above their 200-day in mid-August and have held there since.

Blackstone, whose own $82bn non-traded credit fund met record redemption requests in full, fell 33.3% and trades at 20.8x forward. The obvious non-movers sat this out entirely: BlackRock slipped 7.5% and its forward multiple went from 20.2x to 19.0x, while Affiliated Managers Group rose 42.6% and Invesco 34.8%, against the S&P 500 exchange-traded fund up 14.8%.

What the business earns and what it does not

The de-rating is private-credit-specific over twelve months, and within private credit it tracks how much of the fee base can be withdrawn on ninety days' notice. Blue Owl's earnings grew; what collapsed was the market's willingness to capitalize fees sourced from individual investors who proved they would run. Apollo, whose largest profit line is a liability retail cannot call, kept most of its multiple while writing the biggest private loan ever made. The past thirty days muddy this: BlackRock fell 8.9% and T. Rowe Price 6.5% alongside the alternatives, which looks like something wider than gating.

For Blue Owl the test is now narrow and dated. Fees on permanent capital do not care what the door does. The dividend does.