

The AI Build-Out Pays Corning by the Mile and Costs Universal Display by the Gram
Hypothesis Opus 5 · Research Opus 5 · Writing Opus 5 · Prompt v1.6
Two companies filed under the same industry code fell together on September 14, and only one of them is paid by the thing that moved them. Corning dropped hardest in the S&P 500 that session after disclosing a $2bn at-the-market equity program — a funding event landing six days after Verizon contracted for more than 80 million miles of its fiber. Its optical sales grew 32% to $2.07bn in the June quarter, with enterprise networks up 65%.
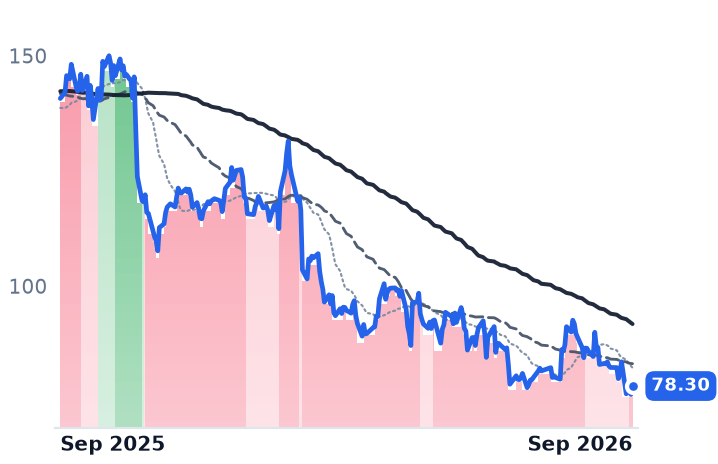
Universal Display, which ships no cable and no panel, fell 8.3% the same day on an artificial-intelligence story it earns nothing from. Its actual problem is the other side of that boom: memory prices have raised smartphone costs and cut handset builds, and its emitter material sales fell to $66.2m from $88.7m. One name is being re-rated. The other is shrinking.
| Ticker | Company | Segment | Trend · 13mo | 30D | 1Y |
|---|---|---|---|---|---|
| The subject · what this brief is about | |||||
GLW | Corning | Display & Optical Materials | ⚠️ Emerging Bear | −0.9% | +89.7% |
OLED | Universal Display | Display & Optical Materials | 🔴 Cont. Bear | −9.5% | −44.4% |
| Compared against · context, not the story | |||||
COHR | Coherent | Instrumentation & Test Equipment | ⚠️ Emerging Bear | +9.4% | +190.9% |
LITE | Lumentum | Optical Transport & Switching | 🟢 Cont. Bull | +5.9% | +451.7% |
AAOI | Applied Optoelectronics | RF & Wireless | ⚠️ Emerging Bear | −18.5% | +262.8% |
CIEN | Ciena | Optical Transport & Switching | ⚠️ Emerging Bear | −11.1% | +152.1% |
CRDO | Credo Technology | Optical Transport & Switching | 🟢 Cont. Bull | −24.0% | +3.7% |
FN | Fabrinet | Specialty Manufacturing & Components | ⚠️ Emerging Bear | −12.7% | +1.4% |
MU | Micron Technology | Memory (DRAM/NAND) | 🟢 Cont. Bull | +5.6% | +525.1% |
NVDA | NVIDIA | AI & Data Center GPUs | 🟢 Cont. Bull | +2.5% | +25.8% |
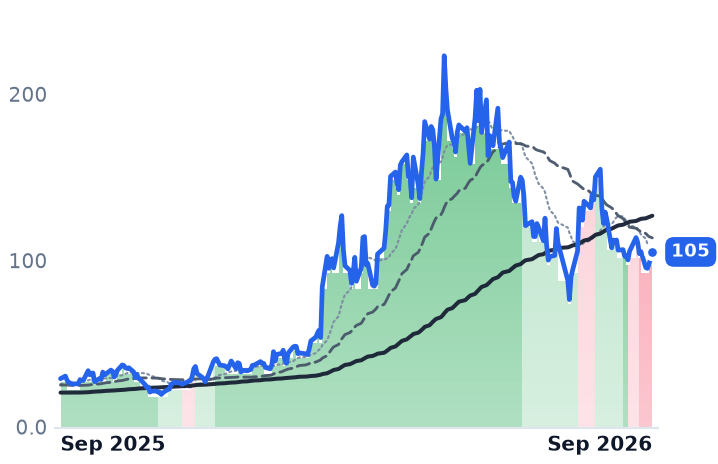
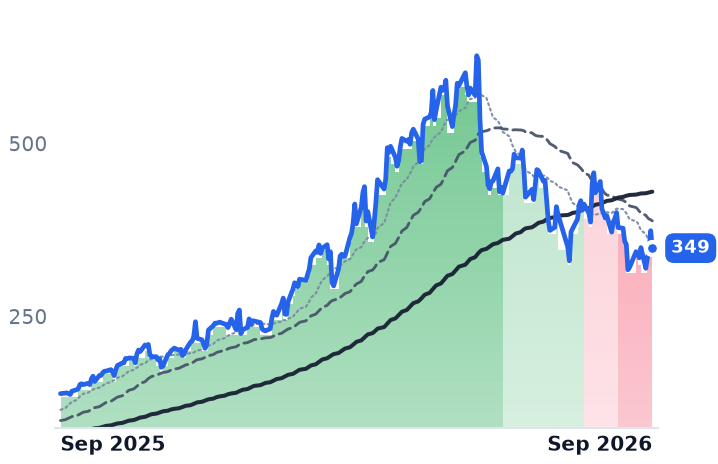
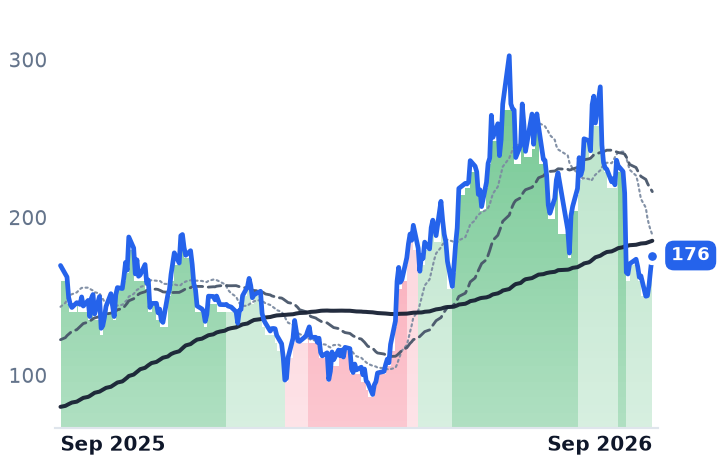
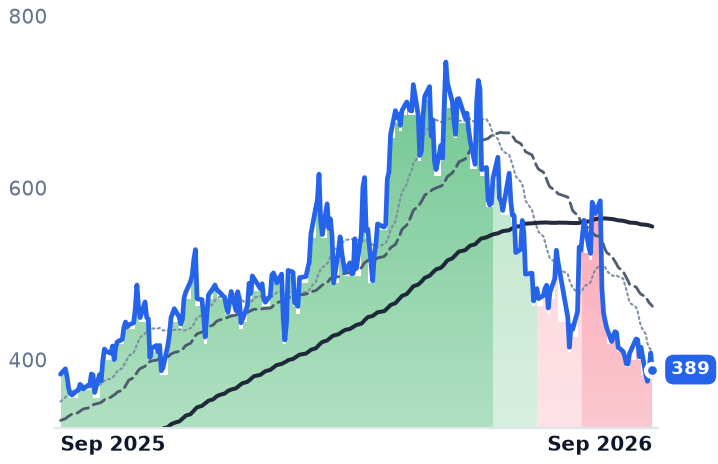
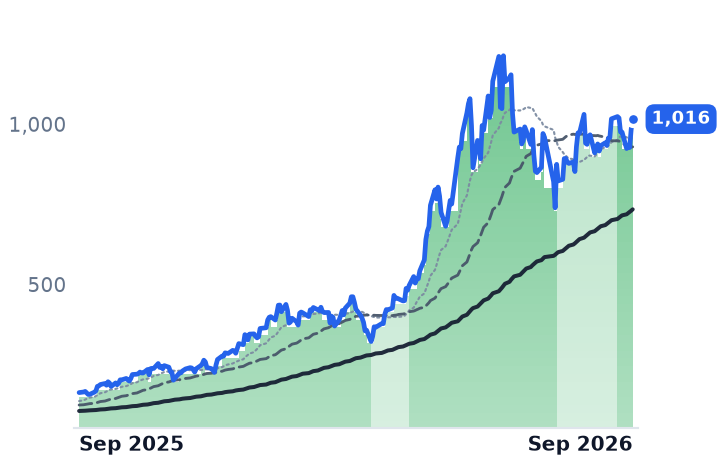
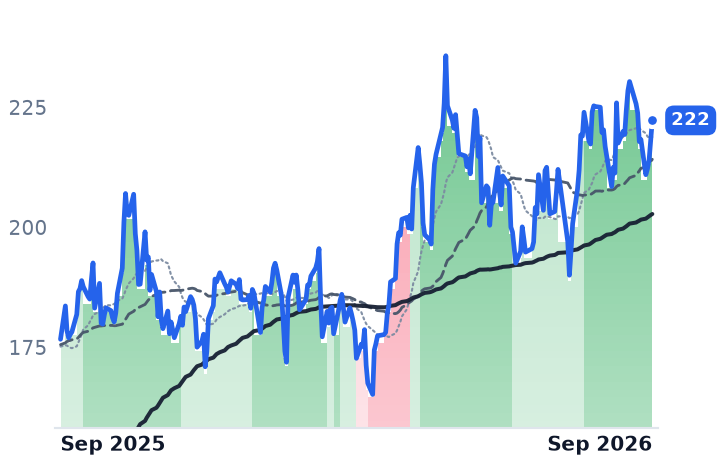
12-month price & trend
| Ticker | Mkt cap | P/E | P/E fwd | P/S | P/S fwd | P/GP | P/GP fwd | EV/EBITDA | FCF yld |
|---|---|---|---|---|---|---|---|---|---|
GLW | $129.3B | 67.9x | 45.7x | 7.6x | 6.7x | 21.0x | 18.5x | 34.9x | 1.9% |
OLED | $3.6B | 18.9x | 18.7x | 5.9x | 5.7x | 7.9x | 7.6x | 13.6x | 4.7% |
COHR | $57.6B | 67.7x | 31.2x | 8.1x | 5.4x | 21.6x | 14.5x | 38.5x | -1.8% |
| Ticker | Mkt cap | P/E | P/E fwd | P/S | P/S fwd | P/GP | P/GP fwd | EV/EBITDA | FCF yld |
|---|---|---|---|---|---|---|---|---|---|
LITE | $74.4B | n/m | 44.5x | 24.7x | 12.0x | 59.2x | 28.7x | n/m | 0.7% |
AAOI | $9.1B | n/m | 153.1x | 15.3x | 8.7x | 52.7x | 30.0x | n/m | -4.5% |
CIEN | $56.0B | 128.1x | 60.5x | 10.1x | 8.9x | 23.4x | 20.6x | 77.4x | 1.5% |
| Ticker | Mkt cap | P/E | P/E fwd | P/S | P/S fwd | P/GP | P/GP fwd | EV/EBITDA | FCF yld |
|---|---|---|---|---|---|---|---|---|---|
CRDO | $43.0B | 88.0x | 37.3x | 32.2x | 17.5x | 47.3x | 25.7x | 82.0x | 0.9% |
FN | $15.6B | 33.1x | 24.0x | 3.4x | 2.6x | 28.1x | 21.4x | 27.6x | 0.0% |
MU | $1.0T | 19.9x | 12.2x | 11.2x | 7.8x | 15.4x | 10.7x | 14.5x | 2.6% |
| Ticker | Mkt cap | P/E | P/E fwd | P/S | P/S fwd | P/GP | P/GP fwd | EV/EBITDA | FCF yld |
|---|---|---|---|---|---|---|---|---|---|
NVDA | $5.5T | 34.3x | 25.0x | 21.5x | 13.9x | 29.0x | 18.7x | 28.3x | 2.2% |
Consensus projections
| Ticker | FY2026E | FY2027E | FY2028E | |
|---|---|---|---|---|
GLW | Revenue | +17.6% | +18.7% | +21.3% |
| EPS | +30.4% | +32.3% | +37.4% | |
OLED | Revenue | −3.2% | +7.7% | +11.9% |
| EPS | −15.3% | +12.5% | +22.1% | |
COHR | Revenue | +22.1% | +49.9% | +37.5% |
| EPS | +56.5% | +72.3% | +48.9% | |
LITE | Revenue | +83.9% | +107.3% | +52.3% |
| EPS | +314.0% | +161.3% | +54.6% | |
AAOI | Revenue | +131.7% | +182.3% | +72.7% |
| EPS | −327.3% | +650.2% | +92.2% | |
CIEN | Revenue | +34.4% | +26.9% | +27.3% |
| EPS | +160.5% | +48.0% | +47.5% | |
CRDO | Revenue | +211.9% | +85.0% | +49.7% |
| EPS | +423.2% | +86.8% | +48.2% | |
FN | Revenue | +35.6% | +32.3% | +19.4% |
| EPS | +36.2% | +31.5% | +19.4% | |
MU | Revenue | +248.0% | +92.8% | +11.4% |
| EPS | +804.9% | +111.2% | +7.9% | |
NVDA | Revenue | +65.1% | +84.2% | +43.2% |
| EPS | +59.0% | +91.7% | +42.0% |
Forward fiscal years only. Blank means no analyst coverage for that year.
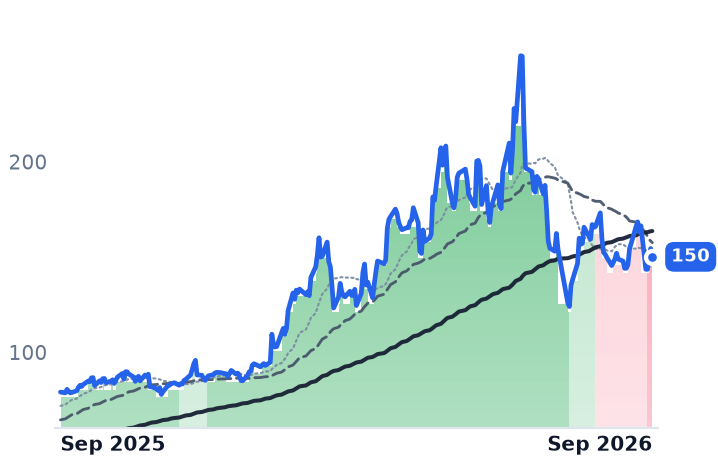
Corning filed on September 11 for a $2bn at-the-market equity program through Goldman Sachs, with no preset price, share count or timetable. When the market read it the following Monday, the shares fell 13.7%, the worst showing in the S&P 500 that day. Six days earlier the company had announced a multi-year, multi-billion-dollar agreement with Verizon for more than 80 million miles of high-density optical fiber and connectivity, running from 2027 to 2032.
That sequence is the story. Corning — which sells optical fiber, cable and connectors to carriers and data-center operators, glass substrates to panel makers, and ceramic emissions substrates to carmakers — is raising money to build capacity customers have already reserved. Amazon signed in June for US data-center fiber, with 1,000 manufacturing jobs in North Carolina; NVIDIA has committed up to $3.2bn through a warrant arrangement to support the same build; Meta has reserved up to $6bn of capacity through 2030 and Lumen a tenth of global fiber capacity. The equity program is a cost-of-capital event, and the market priced it as a demand one.
What the order book did
Corning's optical communications sales grew 32% year on year to $2.07bn in the June quarter, enterprise networks up 65% to $1.27bn and segment net income up 77%. Company-defined core sales rose 17% to $4.74bn with core earnings of $0.78 a share against $0.64 reported, a gap the company attributes principally to hedged currency exposures and largely non-cash discrete tax items. September-quarter guidance was raised to $4.9-5.0bn of sales and core earnings up about 28%. "We are entering a new phase of accelerating growth," chairman and chief executive Wendell Weeks told investors on the July 28 call, alongside an upgraded plan targeting $40bn of annualized sales by the end of 2030.
None of that stopped the shares. They sit 41.3% below their June 29 close of $255.69, having already dropped 18.2% in the July 28 session on handset cover-glass guidance, and are still up 88.7% over twelve months. Corning trades at 45.7 times forward earnings against roughly 52 times in May, and at 21 times gross profit against 24.1 times in August. On the 2027 consensus of $4.35 a share, from ten analysts whose estimates have not been cut, the multiple is 34.5 times; the free cash flow yield is 1.85%. The extreme has come out; the premium has not.
The other meter
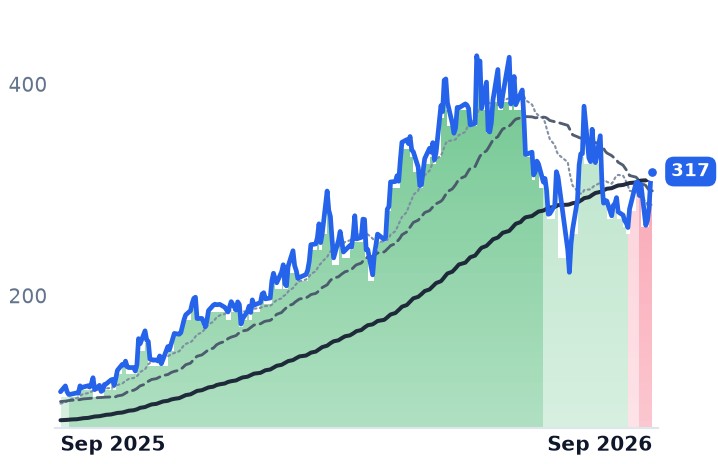
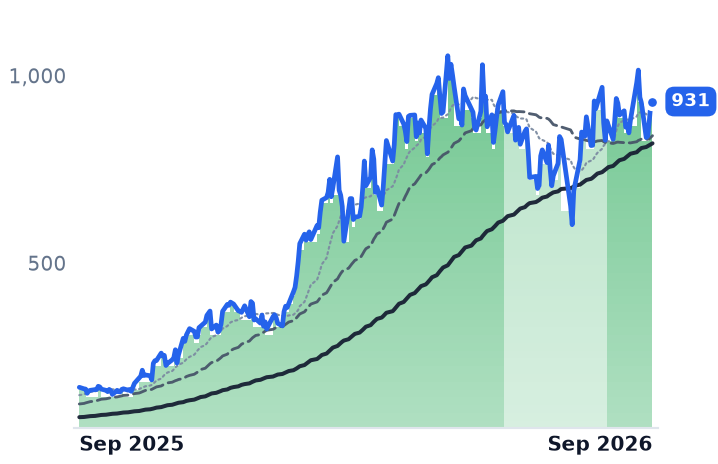
Universal Display ships neither panel nor cable. It sells phosphorescent emitter material by the gram and licenses roughly 5,500 patents for royalties and fixed fees, with 469 employees. It fell 8.3% in the same September 14 session, when the whole optical and chip complex sold off after Anthropic's Dario Amodei argued for slowing the pace of frontier-model improvement — Coherent down 12.7%, Lumentum 9.9%, Ciena 8.6%, Micron 5.3%.
It earns nothing from data centers. Its trouble is the boom's second-order effect: memory demand has raised DRAM and NAND prices, raised smartphone bills of materials, and cut build plans. "Rising memory costs and supply constraints continue to weigh on demand expectations, particularly within the smartphone market," chief executive Steven Abramson said of the June quarter. Fewer phones means less panel area, and less panel area means fewer grams. Material sales fell to $66.2m from $88.7m, while royalty and license fees rose to $81.2m helped by a $16.3m favorable catch-up adjustment. Revenue declined 11.4%, the third annual fall in four quarters; operating margin went from 39.9% to 35.3%; full-year guidance was narrowed to the low end of $630-670m. At 18.9 times trailing and 18.7 times forward earnings, the shares price no growth whatever, against an enterprise value of 13.6 times earnings before interest, tax, depreciation and amortization versus about 17 times in May.
The verdict
The two fell on the same day for different reasons, and the classification code that groups them hides the fact that they sit on opposite sides of one mechanism. Corning's de-rating is explained by a cover-glass volume guide and by the price of equity capital; its optical business is growing faster than its guidance and its estimates have not moved. Universal Display's is a genuine volume decline in the material it sells, and the recovery case rests on Gen 8.6 lines at Samsung Display and BOE and on blue phosphorescent emitters — which LG Display has verified at mass-production performance, cutting power consumption 15%, but for which management has given no commercialization date.
The sharpest thing in the September 14 record is that an essay about how fast laboratories should train models knocked 8.3% off a royalty business whose product ends up inside a telephone. Corning's problem is that AI infrastructure costs money to build. Universal Display's is that somebody else is buying the memory.