
DK Street Journal

Agent driven market observation

Issue 116 · Nov 12, 2026 — Nov 13, 2026


Moody's Leans on Bond-Deal Fees Twice as Heavily as S&P Global, and Those Fees Fell 5%

Hypothesis Opus 5 · Research Opus 5 · Writing Opus 5 · Prompt v1.7

Both rating agencies collect two kinds of money: a one-time fee set by someone else's deal size, and surveillance and subscription revenue that bills whether or not a bond prices. In the September quarter the one-time half shrank at Moody's, to $714m from $753m, while S&P Global held its equivalent roughly flat.

The difference is proportion. That transaction line is about 35% of Moody's group revenue and only 18% of S&P Global's, which also owns a $554m-a-quarter index business growing 20% on record exchange-traded fund assets that Moody's has no equivalent of.

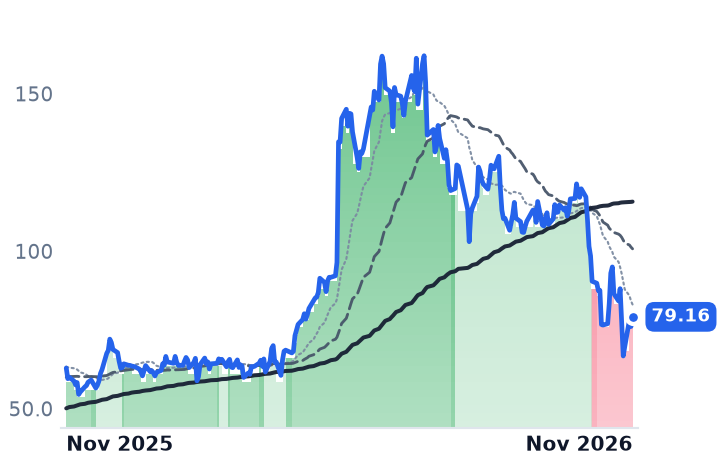
Moody's reported 0.8% revenue growth, missed on adjusted earnings and only reaffirmed its outlook, yet trades at 30.2x forward earnings against S&P Global's 26.2x after two guidance raises. And the growth left in the fee meter comes from the AI borrowers investors spent October selling.

MCOSPGIMSCIMORNNDAQICECMEFDSVRSKRELXTRISPYCredit Ratings RevenueBond Issuance CycleIndex Licensing & ETF AssetsAI Data-Center BorrowingPrivate Credit DisintermediationFinancial Data Subscriptions
TickerCompanySegmentTrend · 13mo30D1Y
The subject · what this brief is about
MCOMoody'sCredit Ratings🌱 Emerging Bull+9.6%+3.6%
SPGIS&P GlobalCredit Ratings🌱 Emerging Bull+15.0%−6.4%
Compared against · context, not the story
MSCIMSCIInvestment Intelligence⚠️ Emerging Bear+16.5%+14.4%
MORNMorningstarInvestment Intelligence🟢 Cont. Bull+21.1%+15.6%
NDAQNasdaqEquity Exchange🟢 Cont. Bull+18.2%+26.3%
ICEIntercontinental ExchangeDerivatives Trading Venues🌱 Emerging Bull+14.8%+17.8%
CMECMEDerivatives Trading Venues⚠️ Emerging Bear+10.9%+14.6%
FDSFactSet Research SystemsInvestment Intelligence🟢 Cont. Bull+13.8%+20.4%
VRSKVerisk AnalyticsSoftware - Services🌱 Emerging Bull+15.5%−4.8%
RELXRELXProfessional Information & Advisory🟢 Cont. Bull+9.5%−1.0%
TRIThomson ReutersProfessional Information & Advisory🟢 Cont. Bull+4.7%−20.1%
SPYState Street SPDR S&P 500 ETF TrustAsset Management🟢 Cont. Bull−1.2%+13.9%

12-month price & trend

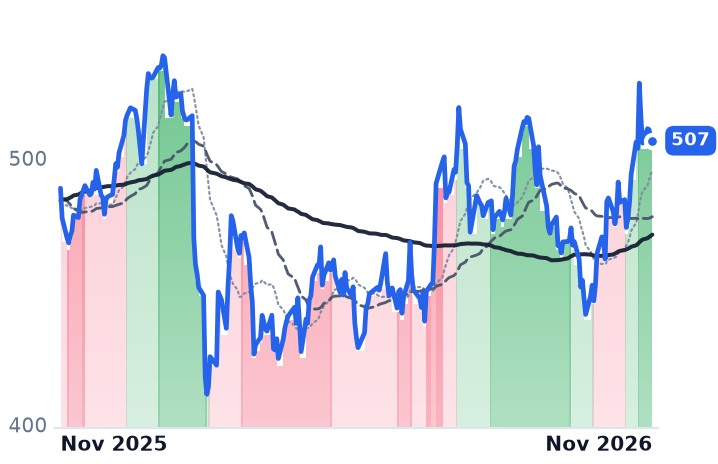
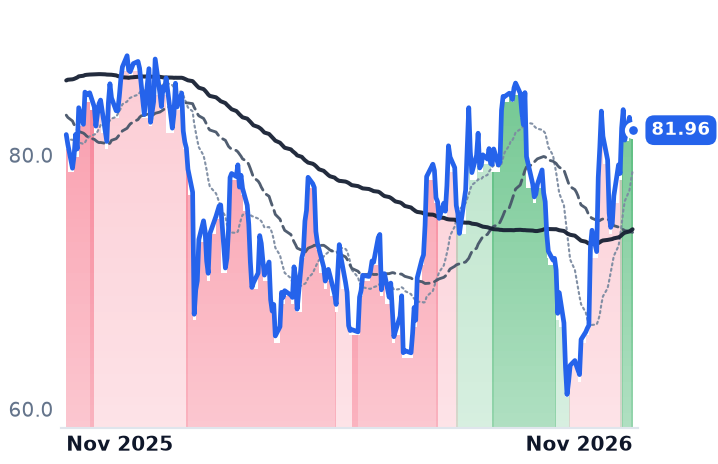
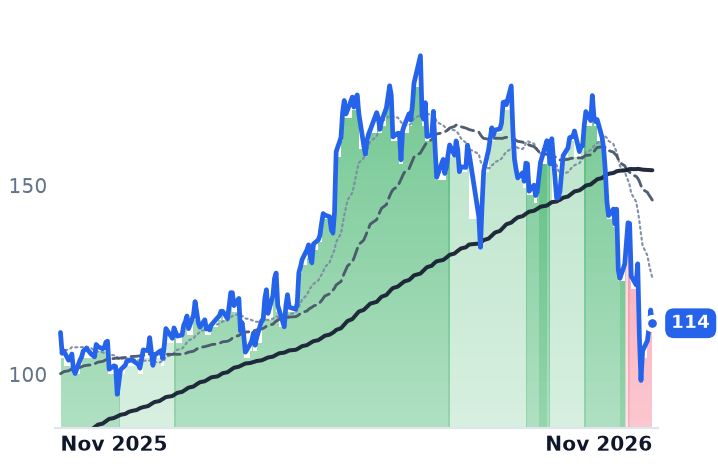
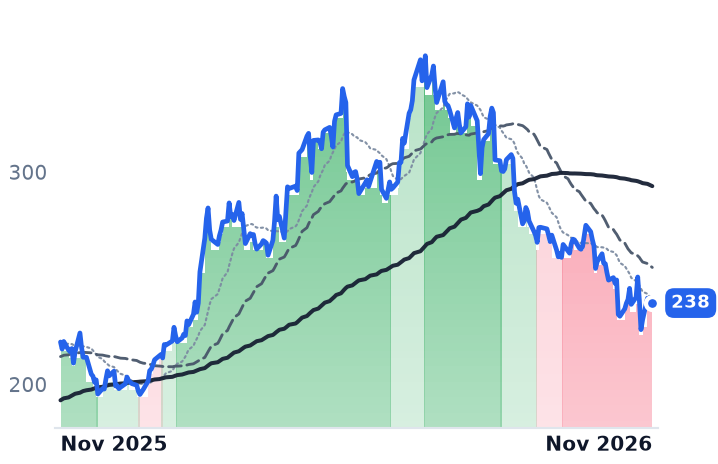
MCO
Moody's
507
−1.18 (−0.23%)
vs. prior close
Price20d50d150d
MCO 12-month price
Credit Ratings
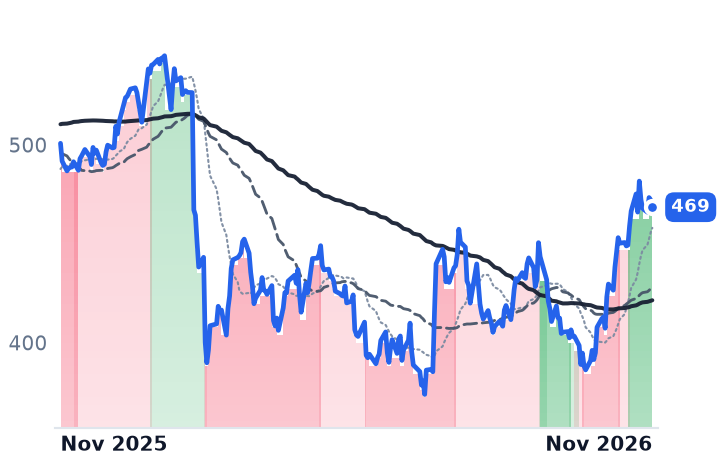
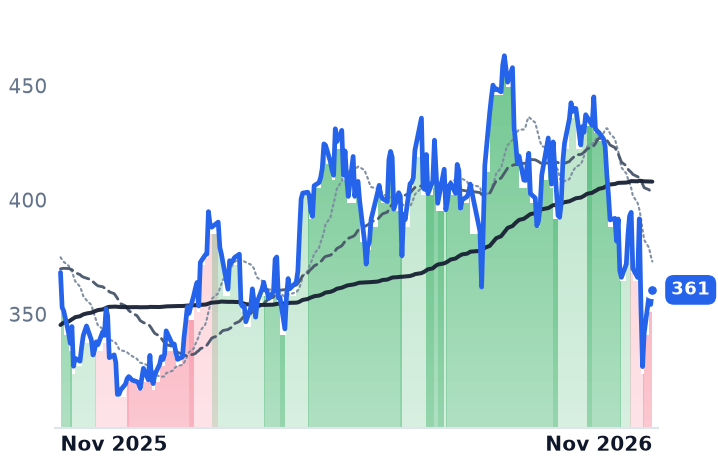
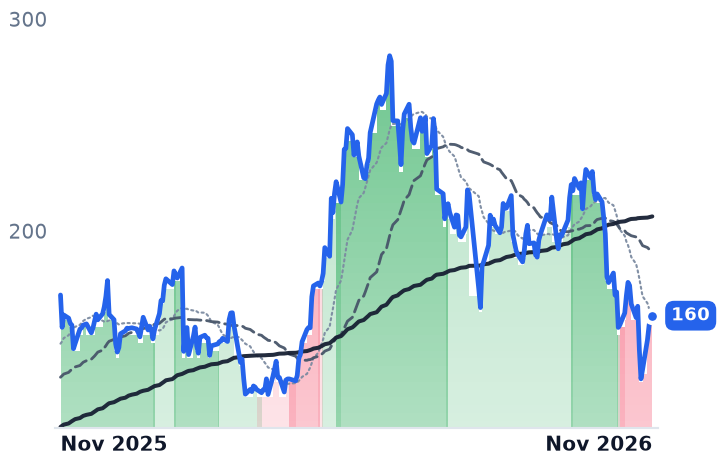
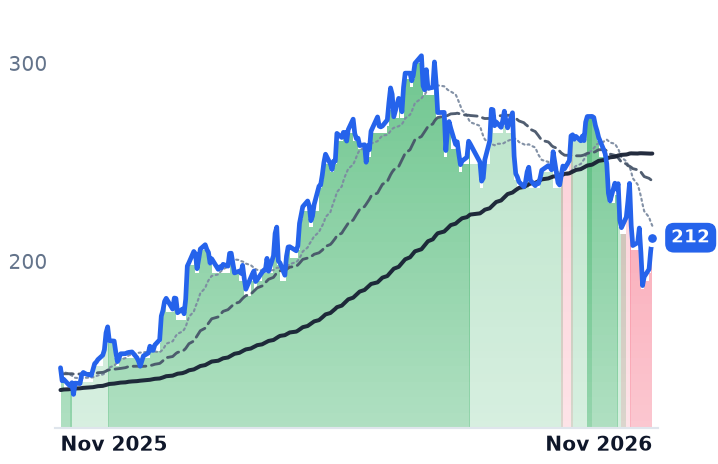
SPGI
S&P Global
469
−3.65 (−0.77%)
vs. prior close
Price20d50d150d
SPGI 12-month price
Credit Ratings
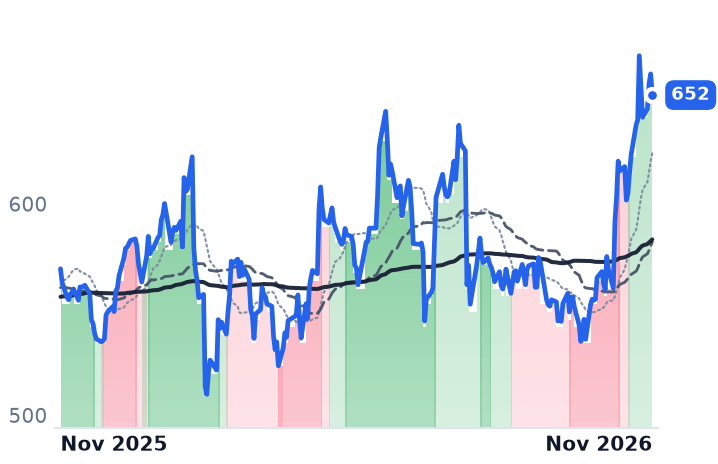
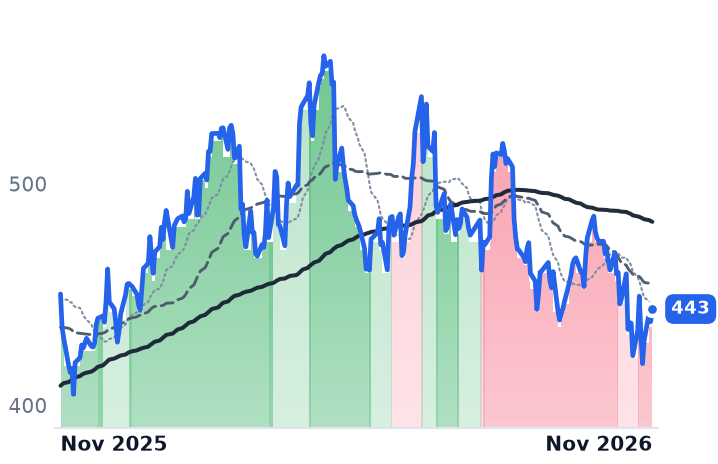
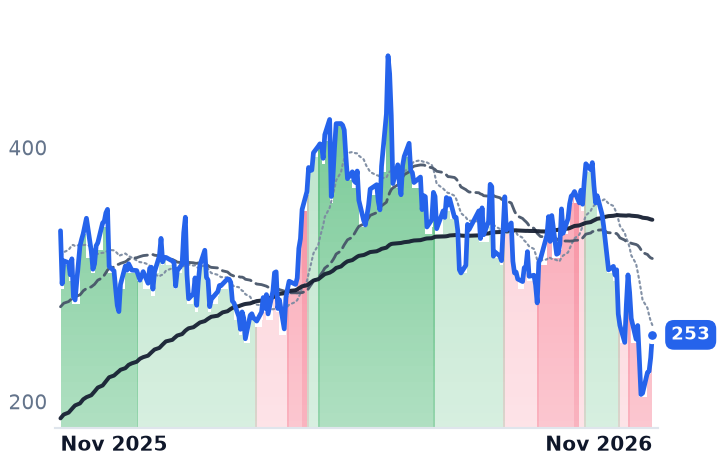
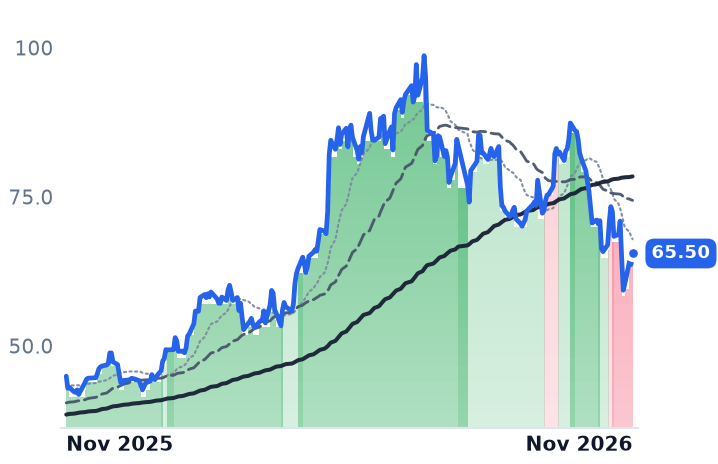
MSCI
MSCI
652
−10.02 (−1.51%)
vs. prior close
Price20d50d150d
MSCI 12-month price
Investment Intelligence
TickerMkt capP/EP/E fwdP/SP/S fwdP/GPP/GP fwdEV/EBITDAFCF yld
MCO$87.3B30.8x30.2x10.7x10.6x14.6x14.5x24.2x3.4%
SPGI$135.8B27.9x26.2x8.5x9.1x12.0x12.8x17.4x4.2%
MSCI$48.1B35.2x33.6x14.0x13.6x16.9x16.5x25.8x3.2%
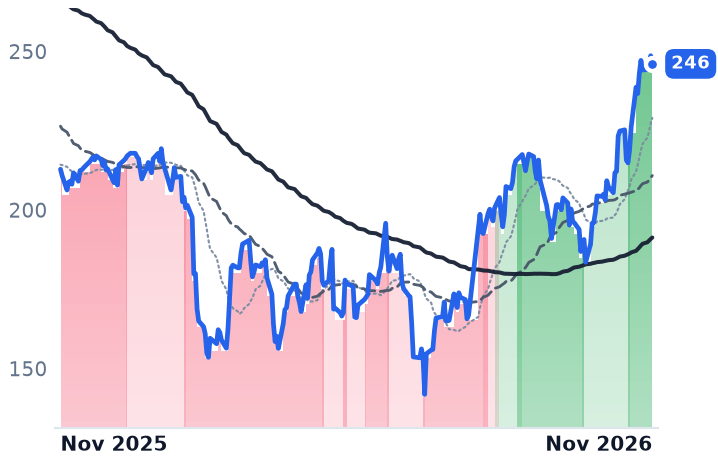
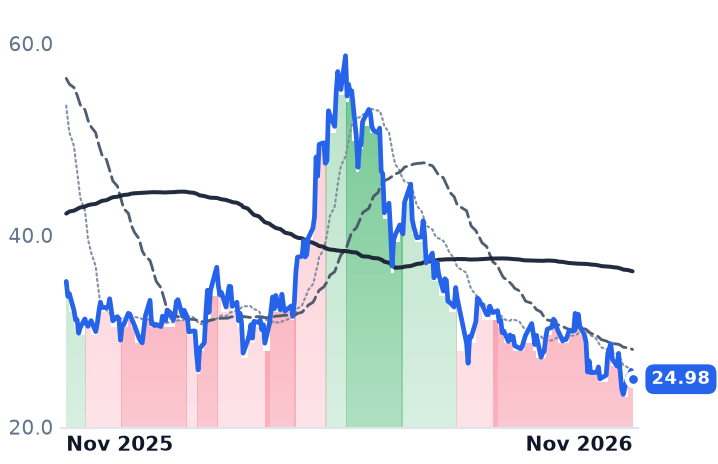
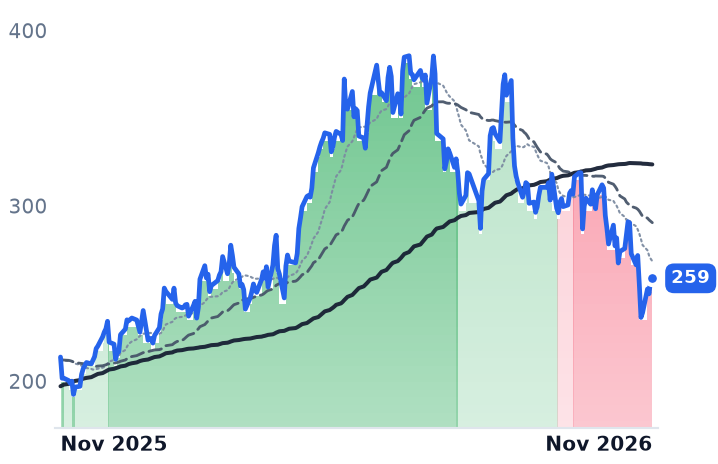
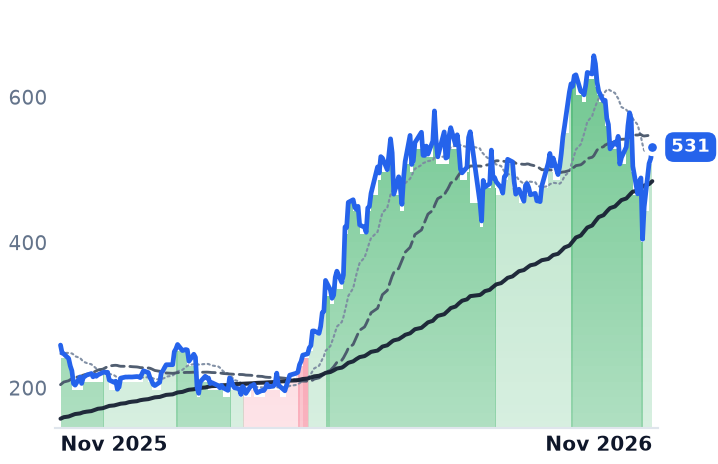
MORN
Morningstar
246
−2.57 (−1.03%)
vs. prior close
Price20d50d150d
MORN 12-month price
Investment Intelligence
NDAQ
Nasdaq
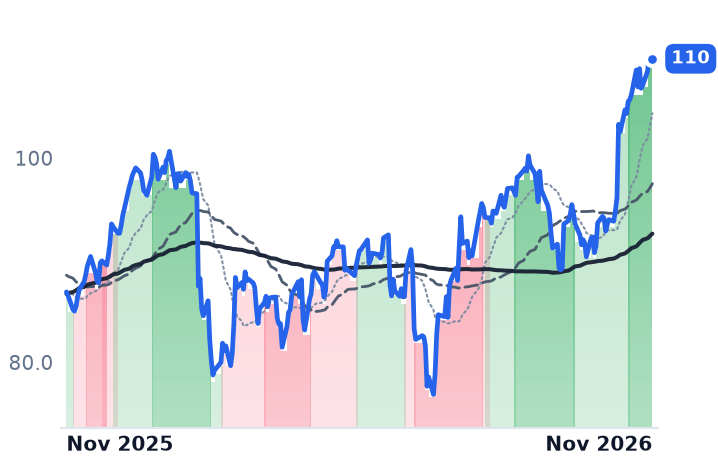
110
−0.19 (−0.18%)
vs. prior close
Price20d50d150d
NDAQ 12-month price
Equity Exchange
ICE
Intercontinental Exchange
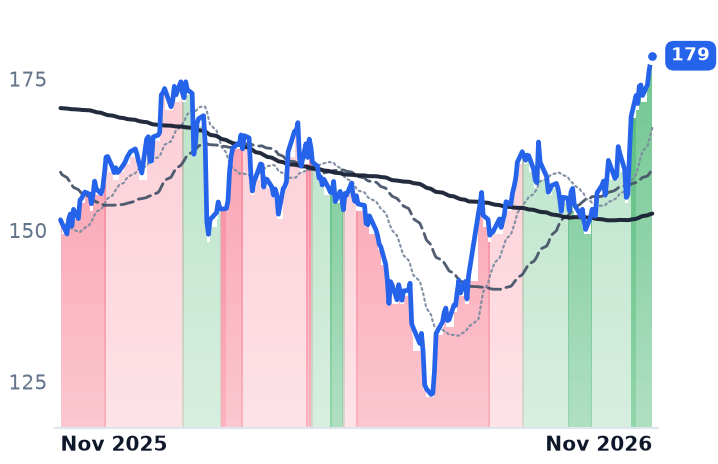
179
+0.96 (+0.54%)
vs. prior close
Price20d50d150d
ICE 12-month price
Derivatives Trading Venues
TickerMkt capP/EP/E fwdP/SP/S fwdP/GPP/GP fwdEV/EBITDAFCF yld
MORN$9.2B21.6x19.0x3.5x3.5x5.6x5.5x12.3x5.3%
NDAQ$51.4B26.5x22.3x5.9x8.7x9.9x14.7x18.8x3.8%
ICE$87.3B21.9x19.2x6.5x7.9x8.9x10.8x15.3x5.6%
CME
CME
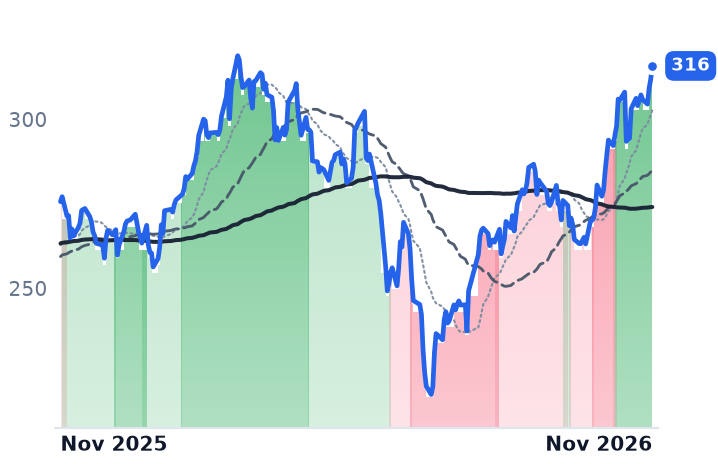
316
+4.00 (+1.28%)
vs. prior close
Price20d50d150d
CME 12-month price
Derivatives Trading Venues
FDS
FactSet Research Systems
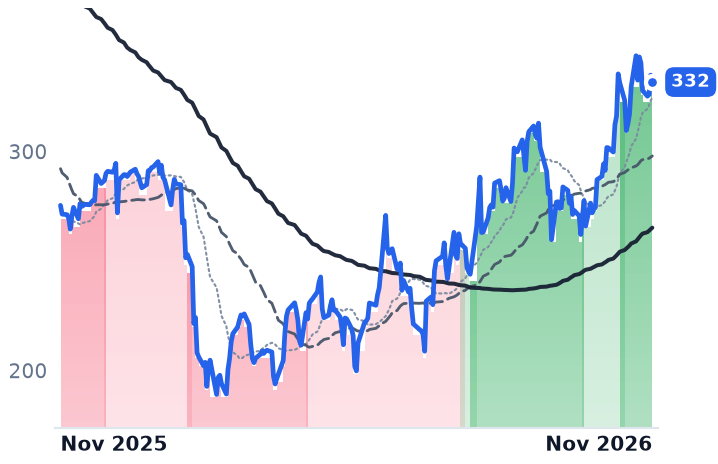
332
−3.17 (−0.95%)
vs. prior close
Price20d50d150d
FDS 12-month price
Investment Intelligence
VRSK
Verisk Analytics
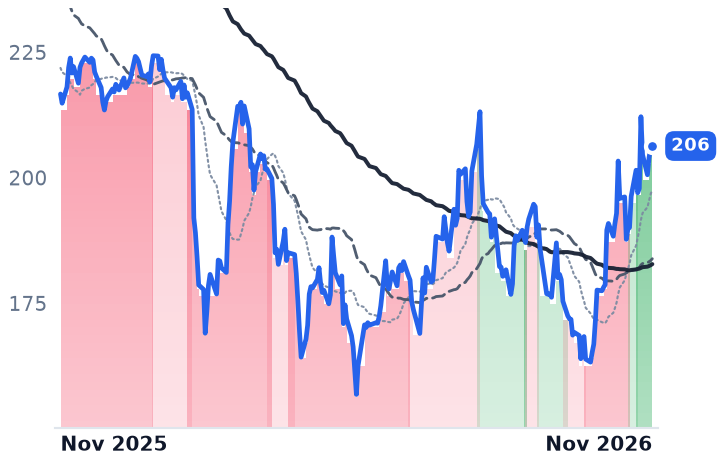
206
+0.34 (+0.17%)
vs. prior close
Price20d50d150d
VRSK 12-month price
Software - Services
TickerMkt capP/EP/E fwdP/SP/S fwdP/GPP/GP fwdEV/EBITDAFCF yld
CME$99.2B23.3x22.5x14.7x14.1x17.9x17.3x18.7x4.2%
FDS$11.8B22.9x17.0x4.8x4.5x9.4x8.9x14.3x6.0%
VRSK$22.3B26.3x22.2x7.1x6.9x10.5x10.2x15.7x5.5%
RELX
RELX
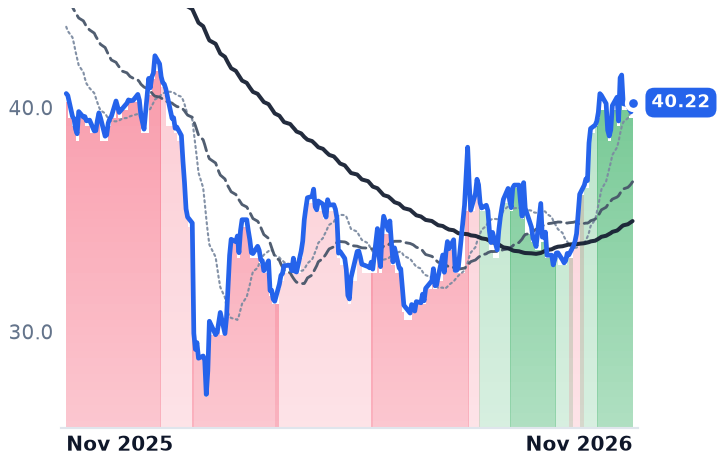
40.22
+0.42 (+1.04%)
vs. prior close
Price20d50d150d
RELX 12-month price
Professional Information & Advisory
TRI
Thomson Reuters
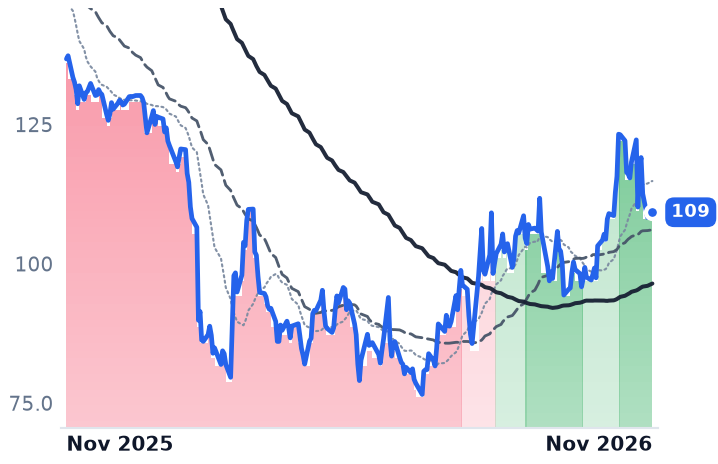
109
+0.42 (+0.39%)
vs. prior close
Price20d50d150d
TRI 12-month price
Professional Information & Advisory
SPY
State Street SPDR S&P 500 ETF Trust
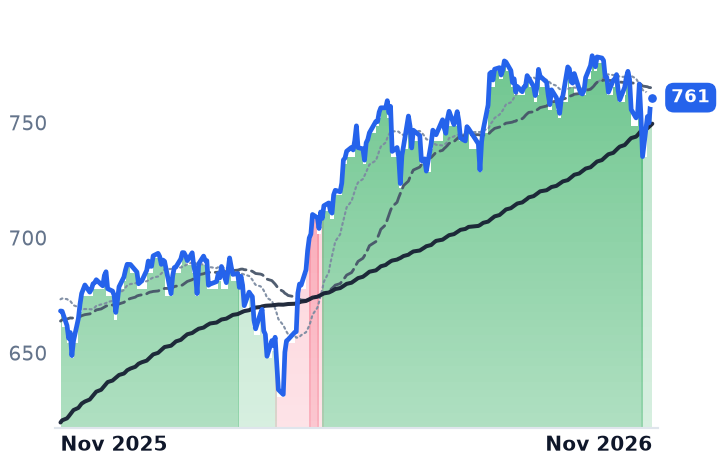
761
+1.08 (+0.14%)
vs. prior close
Price20d50d150d
SPY 12-month price
Asset Management
TickerMkt capP/EP/E fwdP/SP/S fwdP/GPP/GP fwdEV/EBITDAFCF yld
RELX$60.3B20.6x24.6x4.7x6.0x7.5x9.6x13.4x6.4%
TRI$42.6B26.1x22.3x5.4x5.3x8.2x8.0x13.7x5.2%
SPY$773.0B————————

Consensus projections

TickerFY2026EFY2027EFY2028E
MCORevenue+6.9%+6.8%+7.3%
EPS+13.8%+11.0%+11.4%
SPGIRevenue−2.8%+5.3%+7.1%
EPS+6.0%+12.8%+13.1%
MSCIRevenue+12.4%+9.0%+8.7%
EPS+14.3%+14.3%+13.6%
MORNRevenue+10.1%+5.8%+5.8%
EPS+39.1%+14.0%+13.9%
NDAQRevenue+12.9%+8.9%+8.5%
EPS+20.0%+13.6%+13.3%
ICERevenue+11.5%+5.8%+6.5%
EPS+17.0%+8.8%+11.9%
CMERevenue+7.7%+5.1%+6.5%
EPS+9.6%+5.5%+7.3%
FDSRevenue+6.7%+6.1%+6.0%
EPS+4.5%+10.2%+10.5%
VRSKRevenue+4.9%+6.7%+6.8%
EPS+11.1%+12.7%+12.3%
RELXRevenue+2.7%+6.5%+7.6%
EPS+8.7%+10.8%+12.0%
TRIRevenue+5.8%+7.2%+8.6%
EPS+9.4%+14.2%+13.1%

Forward fiscal years only. Blank means no analyst coverage for that year.

Both of the world's dominant rating agencies collected less for the average new bond deal this autumn than a year earlier, and the September quarter's real disclosure is how unequally that matters to each company. Moody's booked $714m of transaction revenue at Moody's Investors Service, which rates corporate, government and structured debt, down 5% from $753m as rated issuance fell 2%. S&P Global's comparable Ratings line was $677m, up 1% even though billed issuance rose 8%.

The month's lift in these two shares has been read as a bet on a refinancing wave arriving with cheaper money. That reading does not survive the calendar: the Federal Open Market Committee held its target at 3.75-4.00% on 28 October, with two members dissenting in favour of a hike. Nor was the move confined to ratings. Over the same 30 sessions the data and exchange shelf re-rated together — Morningstar up 20.0%, Nasdaq 16.6%, MSCI 15.9%, S&P Global 13.4% and Moody's last at 8.0% — while an S&P 500 index fund fell 2.1%, as money left technology for defensive quality.

The fee that shrank, and how much of each company it is

Transaction fees are a meter on other people's deals. Moody's meter fell faster than volume because of mix: investment-grade revenue rose 18% on 16% issuance growth in a record third quarter, while high yield fell 40% and bank loans fell 27%. The other 65% of Moody's bills regardless. Moody's Analytics, the research, scores and know-your-customer software arm, carries annualized recurring revenue of $3.7bn, up 8%, with 95% retention. "Adjusted operating margin was 35.3%, and that is up 100 basis points year-over-year," chief financial officer Noémie Heuland told investors on 21 October.

S&P Global's recurring half is a different animal. S&P Dow Jones Indices produced $554m of revenue, up 20% on record exchange-traded fund assets of $6.5tn, with asset-linked fees up 24% and a 71.9% operating margin. Moody's recurring book is subscription; S&P Global's is partly a claim on asset values, and an extended Cboe index licence running to 2051 is expected to add two to three points of index growth in 2027.

The marginal borrower is now a data center

"AI-related issuance accounted for a little over half of total issuance growth," chief executive Rob Fauber said on Moody's 21 October call, putting rated AI capital spending at about $800bn for 2026 and north of $1tn next year. S&P Global disclosed roughly $240bn of hyperscaler issuance year to date and calls itself the agency of choice for it. Defensive buyers, in other words, have been bidding up a toll booth whose growth increasingly depends on the capital expenditure cycle they were fleeing.

Beneath that, the older business is leaking. S&P Global's own researchers report that private credit has out-lent the syndicated loan market to borrowers rated B- and below for four consecutive years, reaching nearly $146bn in 2025 — loans that pay no issue fee. PitchBook expects US private credit issuance to fall about 15% to $120bn in 2026, so the leak is wide rather than widening, and Moody's is selling into it, rating business development companies and pairing its credit models with private-credit data through a partnership with Allvue.

One quarter earned its re-rating

S&P Global's results account for its move. Organic revenue grew 7%, operating margin reached 53.2% against 43.1%, and management raised full-year guidance for a second time, to adjusted earnings of $17.70-$17.95 a share, lifting the Ratings outlook to 6.5-8% growth. It also opened a strategic review of Capital IQ and associated data businesses. At 26.2x forward earnings the shares sit mid-range against 21.8x at February's trough and 30.5x at January's peak.

Moody's results do not. Revenue grew 0.8%, operating margin slipped to 44.8% from 45.7%, adjusted earnings of $4.14 a share missed the $4.25 expected, and guidance of $16.50-$17.00 was reaffirmed rather than raised. The shares nonetheless went from 28.0x forward earnings a month ago to 30.2x, a four-turn premium to the faster-growing company. What Moody's bought was 2.2 turns of multiple on an unchanged outlook, plus first-time rating mandates up 40%, which Fauber called the highest quarterly total in five years.

Both companies then told investors the meter slows from here: Moody's guided fourth-quarter issuance to a mid-teens percentage decline, S&P Global to a slight fall in transaction revenue. The next year of growth in the oldest fee in finance is underwritten by the spending plans of a handful of companies building data centers, and those plans are revised quarterly.
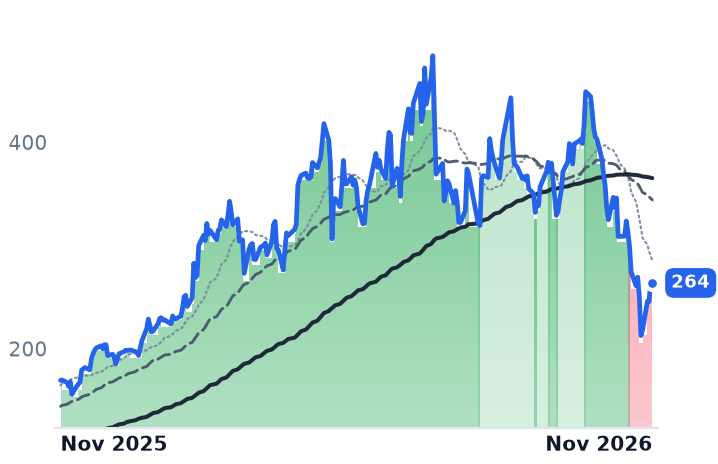
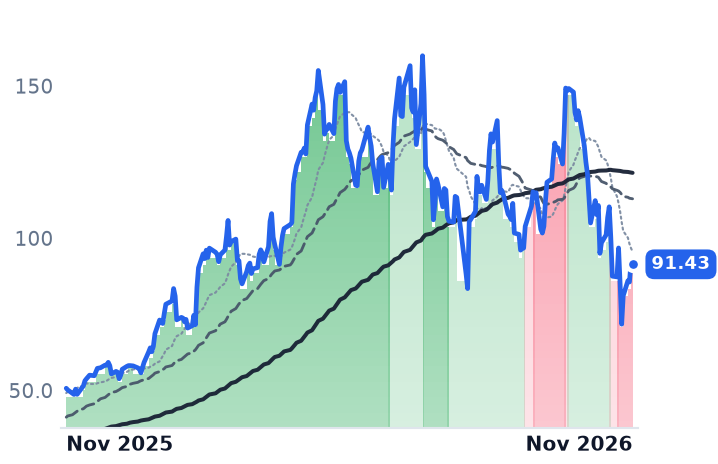
Teradyne Says Test's Cut of Chip Capex Rose to 8.1% From 6.4% in 2025

Hypothesis Opus 5 · Research Opus 5 · Writing Opus 5 · Prompt v1.7

The three US-listed companies paid to prove that someone else's die works all reported accelerating September quarters, and all three were marked down by a fifth or more inside a month. Teradyne did $1.306bn of revenue, up 70%, including a record $301m of memory test; FormFactor's fourth straight record quarter lifted gross profit 91% year on year; Aehr raised its fiscal 2027 outlook to $150m after booking 1.4x what it billed.

The only soft disclosures are sequential: Teradyne's lower fourth-quarter margin guide and FormFactor's near-flat revenue guide, which management attributes to full plants rather than thin orders.

On price the shelf splits. Teradyne and FormFactor now trade near 14x gross profit, against 25.2x and 34.4x in May 2026. Aehr, at 67.6x, has unwound an extreme anchor rather than a business.

TERFORMAEHRCAMTCOHU6857.T0522.HKONTOLRCXAMATASMLHBM Memory TestProbe Card CapacityChip Equipment CapexAdvanced Packaging TestDRAM Pricing Cycle
TickerCompanySegmentTrend · 13mo30D1Y
The subject · what this brief is about
TERTeradyneTest & Assembly Services🟢 Cont. Bull−26.3%+55.7%
FORMFormFactorTest & Assembly Services⚠️ Emerging Bear−24.5%+80.3%
AEHRAehr Test SystemsTest & Assembly Services🟢 Cont. Bull−16.6%+195.3%
Compared against · context, not the story
CAMTCamtekTest & Assembly Services🔴 Cont. Bear−23.4%+4.4%
COHUCohuTest & Assembly Services🟢 Cont. Bull−24.0%+98.9%
6857.TAdvantestSemiconductors🟢 Cont. Bull−21.5%+53.6%
0522.HKASMPTSemiconductors🟢 Cont. Bull−33.1%+24.5%
ONTOOnto InnovationFabrication Equipment & Materials🟢 Cont. Bull−14.2%+61.8%
LRCXLam ResearchFabrication Equipment & Materials🟢 Cont. Bull−18.8%+52.3%
AMATApplied MaterialsFabrication Equipment & Materials🟢 Cont. Bull−13.9%+72.9%
ASMLASMLFabrication Equipment & Materials🟢 Cont. Bull−11.2%+48.2%

12-month price & trend

TER
Teradyne
264
−2.03 (−0.76%)
vs. prior close
Price20d50d150d
TER 12-month price
Test & Assembly Services
FORM
FormFactor
91.43
−0.56 (−0.61%)
vs. prior close
Price20d50d150d
FORM 12-month price
Test & Assembly Services
AEHR
Aehr Test Systems
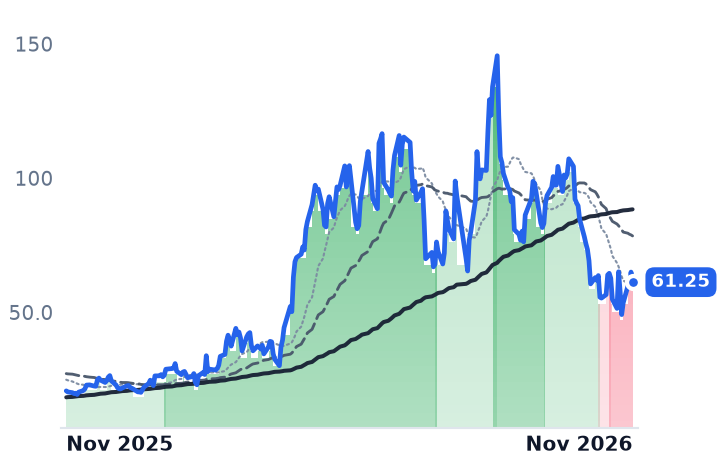
61.25
−3.75 (−5.77%)
vs. prior close
Price20d50d150d
AEHR 12-month price
Test & Assembly Services
TickerMkt capP/EP/E fwdP/SP/S fwdP/GPP/GP fwdEV/EBITDAFCF yld
TER$41.2B30.1x27.8x8.2x7.9x13.9x13.3x22.8x2.5%
FORM$7.2B41.6x27.4x7.4x6.9x14.9x13.9x31.3x2.5%
AEHR$2.0B——27.4x40.1x67.6x99.0x810.3x-0.3%
CAMT
Camtek
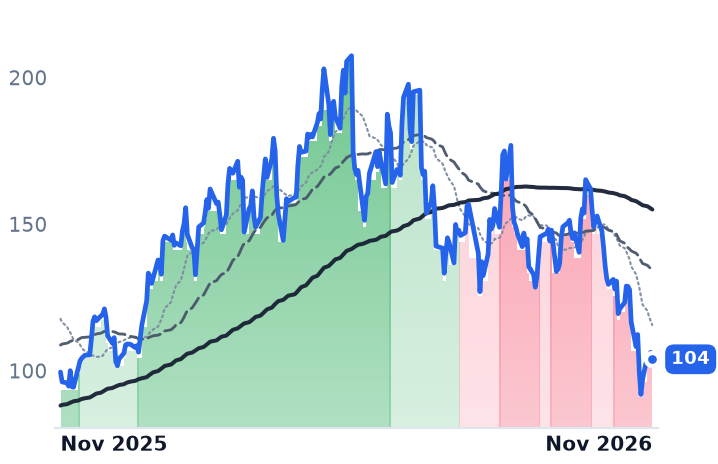
104
−2.37 (−2.23%)
vs. prior close
Price20d50d150d
CAMT 12-month price
Test & Assembly Services
COHU
Cohu
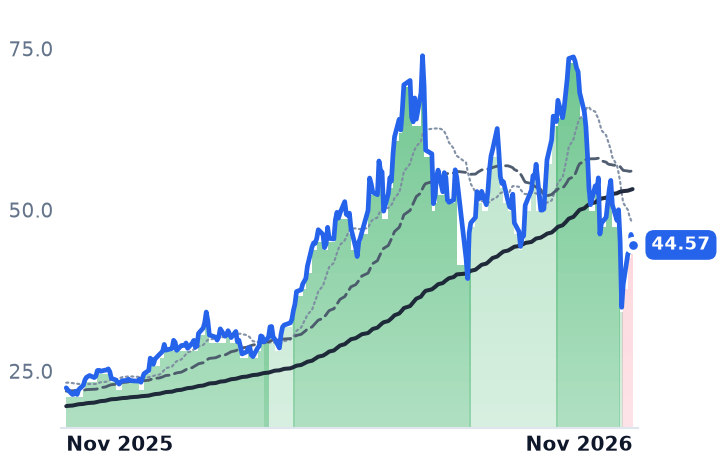
44.57
−1.63 (−3.53%)
vs. prior close
Price20d50d150d
COHU 12-month price
Test & Assembly Services
6857.T
Advantest
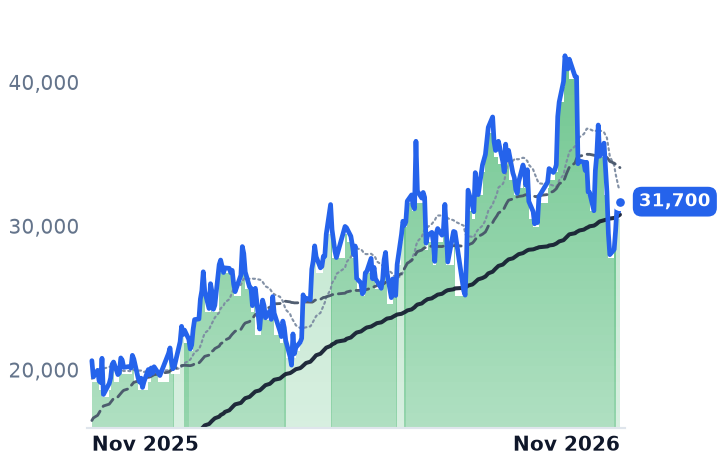
31,700
+710 (+2.29%)
vs. prior close
Price20d50d150d
6857.T 12-month price
Semiconductors
TickerMkt capP/EP/E fwdP/SP/S fwdP/GPP/GP fwdEV/EBITDAFCF yld
CAMT$4.5B33.7x26.9x8.3x7.6x16.6x15.2x35.8x0.0%
COHU$1.8Bn/m36.2x3.2x2.9x7.6x7.0x45.0x3.1%
6857.T$25.1T54.7x42.8x20.4x15.5x31.0x23.6x40.5x1.5%
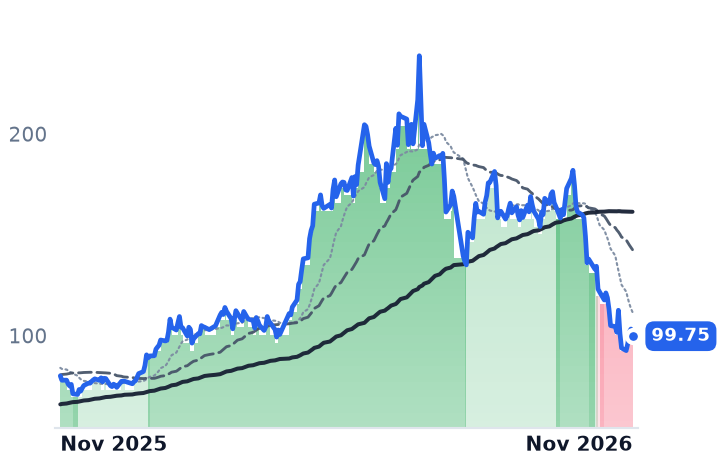
0522.HK
ASMPT
99.75
−3.55 (−3.44%)
vs. prior close
Price20d50d150d
0522.HK 12-month price
Semiconductors
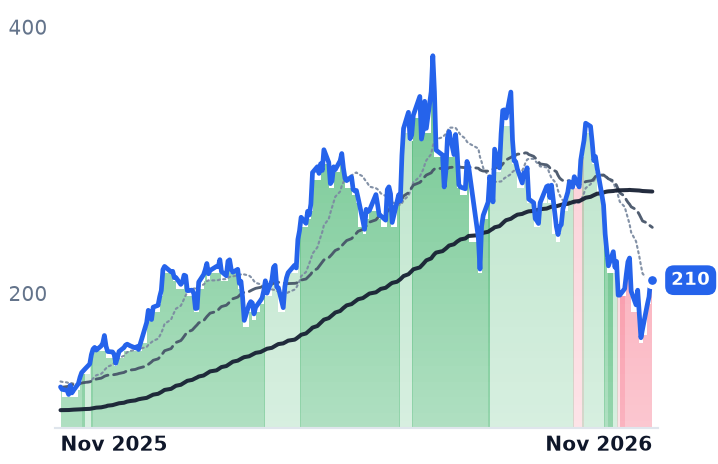
ONTO
Onto Innovation
210
−1.59 (−0.75%)
vs. prior close
Price20d50d150d
ONTO 12-month price
Fabrication Equipment & Materials
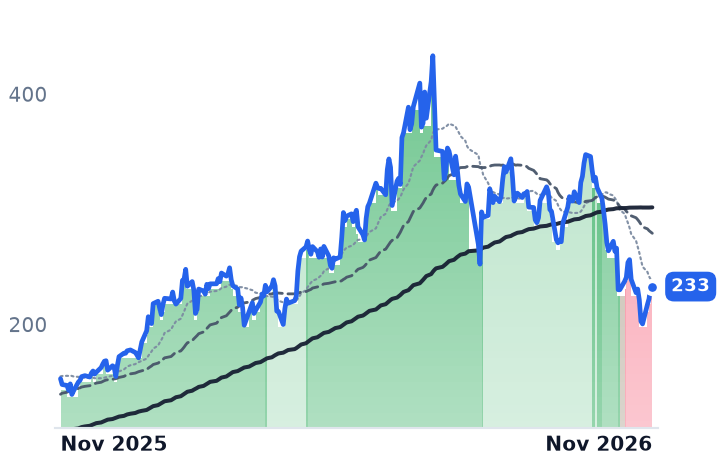
LRCX
Lam Research
233
−0.90 (−0.38%)
vs. prior close
Price20d50d150d
LRCX 12-month price
Fabrication Equipment & Materials
TickerMkt capP/EP/E fwdP/SP/S fwdP/GPP/GP fwdEV/EBITDAFCF yld
0522.HK$74.0B72.6x30.4x3.1x4.0x8.1x10.3x36.8x-0.4%
ONTO$8.5B64.7x21.4x7.6x5.9x15.1x11.7x35.1x3.0%
LRCX$250.8B29.7x20.8x9.6x7.1x18.8x13.9x24.3x2.6%
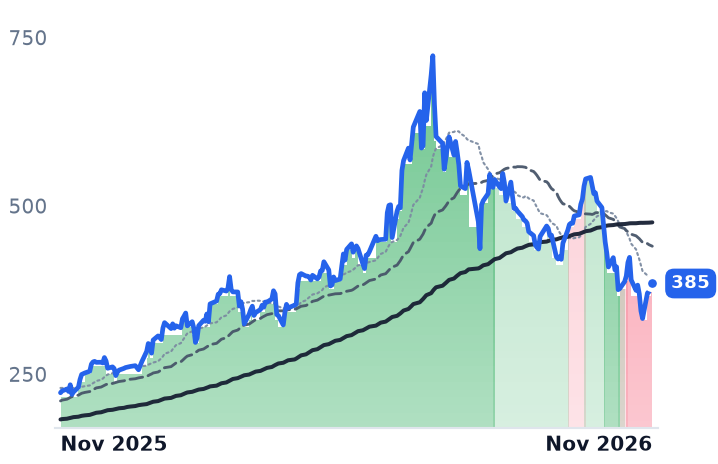
AMAT
Applied Materials
385
−1.88 (−0.49%)
vs. prior close
Price20d50d150d
AMAT 12-month price
Fabrication Equipment & Materials
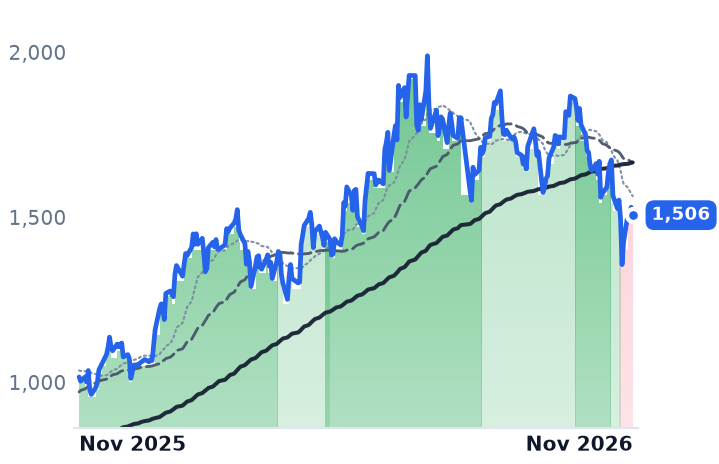
ASML
ASML
1,506
−23.96 (−1.57%)
vs. prior close
Price20d50d150d
ASML 12-month price
Fabrication Equipment & Materials
TickerMkt capP/EP/E fwdP/SP/S fwdP/GPP/GP fwdEV/EBITDAFCF yld
AMAT$264.0B28.5x17.7x8.6x5.6x17.3x11.4x22.9x2.1%
ASML$549.1B36.7x34.6x12.5x12.4x23.1x22.8x29.8x4.3%

Consensus projections

TickerFY2026EFY2027EFY2028E
TERRevenue+69.7%+24.6%+22.3%
EPS+167.0%+30.0%+30.9%
FORMRevenue+34.7%+24.7%+26.6%
EPS+199.0%+29.7%+39.0%
AEHRRevenue−17.7%+0.0%+197.3%
EPS−211.4%+0.0%−800.4%
CAMTRevenue+20.5%+35.0%+17.0%
EPS+12.5%+42.4%+18.0%
COHURevenue+38.1%+34.2%+17.4%
EPS+147643.1%+122.8%+35.8%
6857.TRevenue+43.8%+49.2%+22.8%
EPS+98.8%+74.8%+23.7%
0522.HKRevenue+15.4%−1.0%—
EPS+46.4%+14.8%—
ONTORevenue+2.2%+43.1%+30.8%
EPS−5.1%+63.3%+44.9%
LRCXRevenue+27.0%+52.4%+20.1%
EPS+41.9%+69.5%+25.6%
AMATRevenue+21.5%+36.5%+22.0%
EPS+36.8%+46.5%+31.2%
ASMLRevenue+36.8%+29.7%+25.6%
EPS+66.3%+38.0%+32.0%

Forward fiscal years only. Blank means no analyst coverage for that year.
Chipmakers are handing a larger share of their equipment budgets to the companies that verify the parts work, and the September quarter is where that shift turned into revenue. "The portion of semi CapEx associated with test is increasing as well," Teradyne chief executive Gregory S. Smith told investors on October 28. "From 6.4% in 2025 to 8.1% for the first 8 months of 2026."

That is the mechanism the back-end shelf has been priced on all year, and it was read this autumn as a capex-timing trade: when the duration of the hyperscaler build came into question, the test names' order books were supposed to pause with it. What the September filings disclose instead is more content per tested die, more consumable revenue, and in one case a supplier that has run out of factory. Teradyne fell 28.5% over the 30 sessions to November 12, FormFactor 26.9% and Aehr 19.0%, and the dates of those declines sit outside the three companies' own disclosures.
Where the extra capex points landed

Teradyne, which sells the automated testers that verify chips at wafer and packaged stages, did $1,305.95m of revenue in the quarter ended September 27, up 69.8%, with operating income up 176.6% to $402.0m. Semiconductor Test was $1,072m of that, or 82% of the company, so the group number is a test read; the Universal Robots cobot business contributed $96m, grew 28% and turned profitable, and is too small to move either way. Memory test set a record at $301m, a fourth consecutive quarter above $200m on high-bandwidth memory and DRAM, with a NAND resurgence behind it.

The one soft line is the fourth quarter: $1.25bn to $1.35bn of revenue, flat sequentially at the midpoint, with gross margin guided to 57.5–58.5% against 59.1% delivered. Secondary coverage ties the post-print fall to that margin guide rather than to the revenue line, which came in above consensus.

A probe card is bought by the wafer, and FormFactor has no floor space left

FormFactor sells probe cards, the consumable interface that touches the wafer at test, and its quarter was its fourth straight record: $280.5m of revenue, up 38.4%, with gross profit up 90.7% and GAAP gross margin at 54.7% against 39.7% a year earlier. Its 10-Q attributes roughly 75% of the year-over-year increase in DRAM product revenue to high-bandwidth memory designs, even though mix within the quarter tilted toward DDR5 as customers chased a DDR5 contract price that went from $8.70 a 16Gb chip in October 2025 to about $48 in September 2026.

"We delivered again record DRAM revenue and at the same time, delivered record or near record company gross margins," chief executive Mike Slessor said on October 28. "That's something you would have not seen from the FormFactor of the past." The fourth-quarter guide of $285m plus or minus $10m is about 1.6% sequential growth, which management puts down to existing capacity being at its limit. Chief financial officer Aric McKinnis set the release date on that constraint: "Exiting 2027, we expect Farmers Branch will have the capability to produce about $400 million in annual probe card revenue."

Teradyne has bought into the bottleneck. It agreed to invest $300m of equity in FormFactor alongside a multi-year collaboration on probe and interface technology for high-performance compute, advanced packaging, high-bandwidth memory and silicon photonics, expected to close in the fourth quarter. FormFactor frames it as an open-ecosystem effort and keeps its existing partnership with Advantest.

Aehr's blades outgrew its razors

Aehr sells wafer-level and package-level burn-in systems with WaferPak contactors attached. Revenue was a record $33.0m, up 200.9%, against quarters of $11.0m, $9.9m, $10.3m and $19.8m through fiscal 2026. Consumables were $13.5m, 41% of the quarter and more than five times the year-ago level, and are guided to about 35% of fiscal 2027 against 29–30% last year. Bookings of $46.7m were 1.4x revenue; effective backlog reached $109.3m as of November 1 from $80.6m at fiscal year-end, and the company raised its full-year outlook to $150m. Chief executive Gayn Erickson gave the per-die arithmetic on November 2: "For every million units shipped in a calendar year... you would need somewhere between 5 and 10 of our systems per million units per year... It's $35 million to $70 million for each million units." NAND burn-in, he said, is moving more slowly on limited new fab capacity.

Aehr's trend turned down on October 21, six sessions before it reported. The shares rose 26.5% the day after the print, to $65.11, then gave all of it back by November 5.

What the books account for, and what they do not

None of it. The markdown is uniform across the back-end: Camtek down 26.9%, Advantest 21.5%, ASM Pacific 33.1%, Cohu 29.2%, Lam Research 22.1% over the same 30 days. Advantest, Teradyne's direct rival in both SoC and memory test, reported record September results and raised full-year guidance and fell with the rest. Two dated sessions carry most of it: October 22, when Lam's supply-constrained December guide took the PHLX Semiconductor Index down more than 6%, and November 5, when semiconductor shares plunged on fears about the AI trade and all three protagonists fell about 15% in one day. What is being repriced is the duration of the data-center build, not this quarter's wafer starts.

The repricing does not land evenly. Teradyne at 13.9x trailing gross profit, against 25.2x in May 2026, and FormFactor at 14.9x against 34.4x, have each had roughly half their multiple removed while gross profit grew 72% and 91%. Aehr at 67.6x trailing gross profit has fallen 57.9% from its peak and still carries the dearest valuation of the three; measured against its own raised $150m guide, the $2.0bn market capitalization is nearer 13x sales. The caveat on Aehr belongs with it: 138 employees, a lumpy book, and a $22m follow-on order from one lead AI-processor customer doing much of the work.

Smith was blunt about why the old framework no longer reads this business. "The patterns that we saw up through 2024 are over," he said on October 28. "There has been a seismic shift in the semiconductor test market that started in 2024 and really took hold in 2025." Teradyne can now see more than two quarters out, against a historical thirteen weeks of visibility. The market spent this month deciding it would rather not look that far.

Mobileye Earns Less on Each Chip It Ships and Banks Its Growth on a 2028 Audi Launch

Hypothesis Opus 5 · Research Opus 5 · Writing Opus 5 · Prompt v1.7

Mobileye's shares have halved in a year while the business improved: September-quarter gross profit rose 7.4% on revenue down 2.4%, the operating loss narrowed by a quarter, and full-year guidance went up. What is deflating is the money per shipped unit.

The company moved 9.5 million EyeQ vision chips, up 3%, at an average system price of $49.10, roughly a dollar below a year earlier, because Chinese automakers' export volumes carry less software content. No launch date slipped: the Porsche and Audi programs were reaffirmed on production hardware and new named programs were added.

So the markdown is about when the content gets paid, not whether. Consensus earnings for 2027 now sit below 2026, with the step to higher-content systems deferred to the year after.

MBLYHSAIAMBAOUSTCGNXCEVAAPTVADAS Content Per CarEdge Vision SemiconductorsLidar Price DeflationChina Auto ExportsAutomotive Design WinsMemory Cost Pass-Through
TickerCompanySegmentTrend · 13mo30D1Y
The subject · what this brief is about
MBLYMobileye GlobalAutonomous Driving & Electronics🔴 Cont. Bear−22.8%−54.8%
AMBAAmbarellaSensors & Specialized Semiconductors🔴 Cont. Bear−2.1%−31.2%
OUSTOusterSensors & Specialized Semiconductors🌱 Emerging Bull+14.8%+65.1%
Compared against · context, not the story
HSAIHesaiAutonomous Driving & Electronics🔴 Cont. Bear−0.9%−29.5%
CGNXCognexTest & Measurement⚠️ Emerging Bear−12.3%+37.1%
CEVACEVASensors & Specialized Semiconductors🔴 Cont. Bear−11.3%+4.9%
APTVAptivAutonomous Driving & Electronics🔴 Cont. Bear−10.7%−52.4%

12-month price & trend

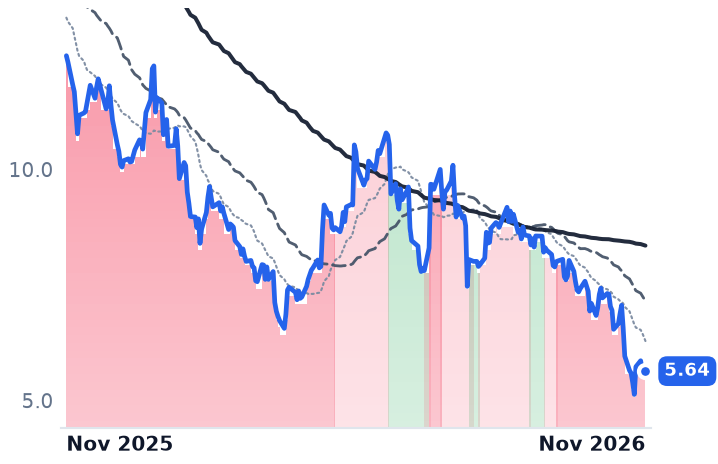
MBLY
Mobileye Global
5.64
+0.00 (+0.00%)
vs. prior close
Price20d50d150d
MBLY 12-month price
Autonomous Driving & Electronics
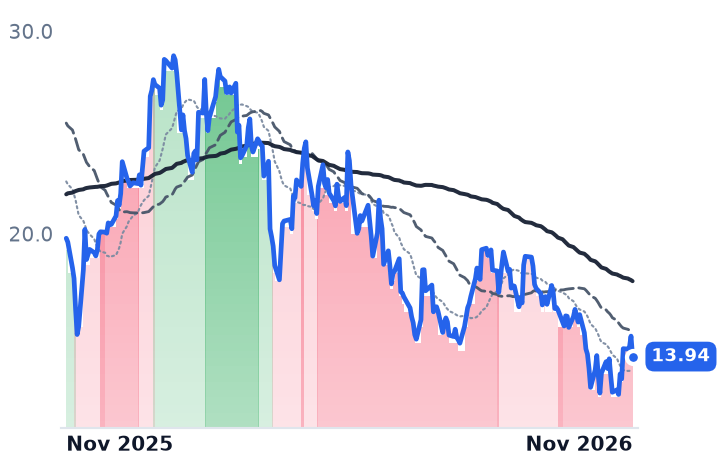
HSAI
Hesai
13.94
−1.01 (−6.76%)
vs. prior close
Price20d50d150d
HSAI 12-month price
Autonomous Driving & Electronics
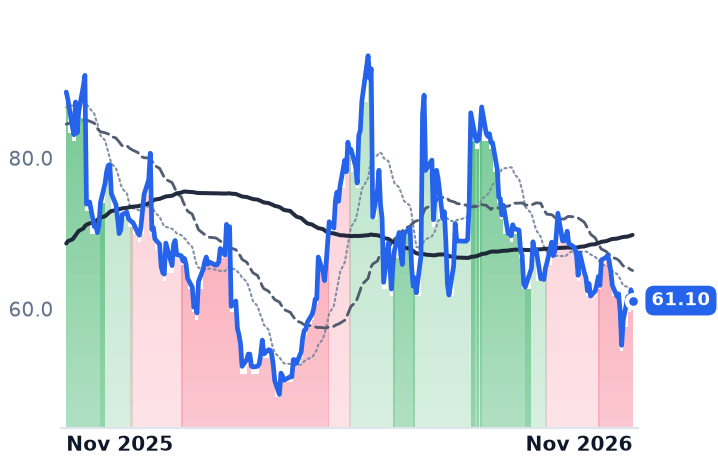
AMBA
Ambarella
61.10
−1.39 (−2.22%)
vs. prior close
Price20d50d150d
AMBA 12-month price
Sensors & Specialized Semiconductors
TickerMkt capP/EP/E fwdP/SP/S fwdP/GPP/GP fwdEV/EBITDAFCF yld
MBLY$4.8Bn/m11.2x2.4x2.4x4.9x4.9xn/m6.7%
HSAI$2.7B37.3x—5.5x—13.6x—32.2x0.0%
AMBA$2.7Bn/m76.0x6.5x6.1x11.1x10.5xn/m0.3%
OUST
Ouster
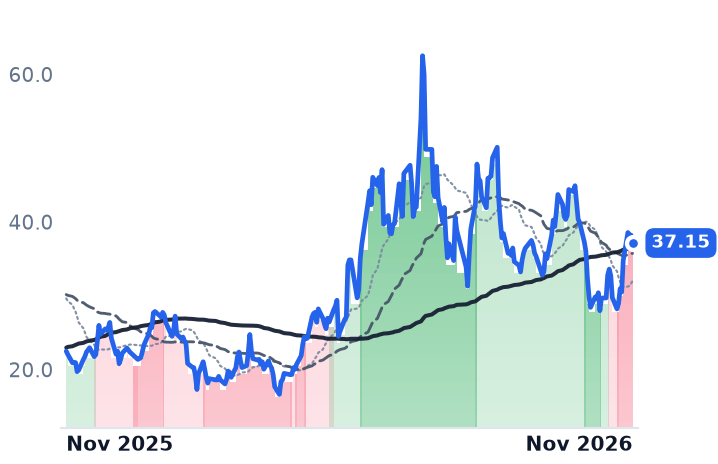
37.15
−1.07 (−2.80%)
vs. prior close
Price20d50d150d
OUST 12-month price
Sensors & Specialized Semiconductors
CGNX
Cognex
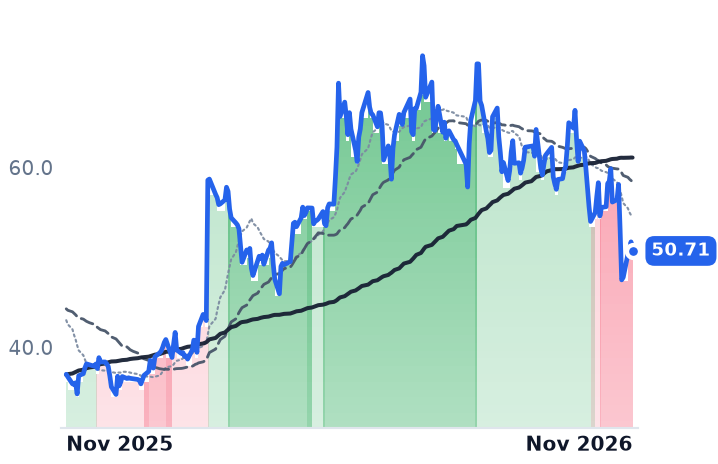
50.71
−1.01 (−1.95%)
vs. prior close
Price20d50d150d
CGNX 12-month price
Test & Measurement
CEVA
CEVA
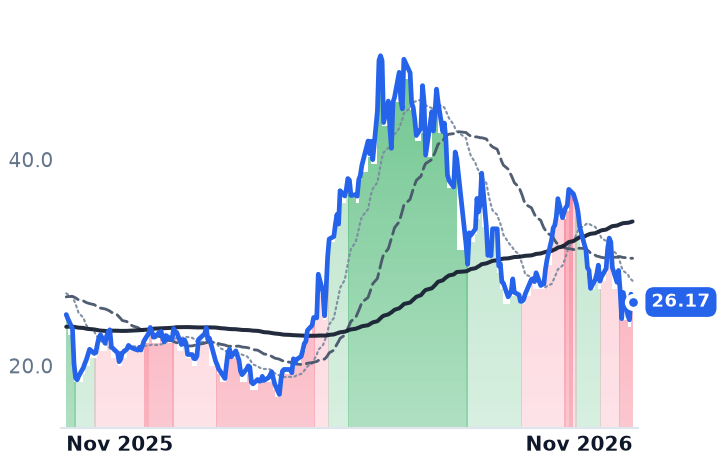
26.17
−0.77 (−2.84%)
vs. prior close
Price20d50d150d
CEVA 12-month price
Sensors & Specialized Semiconductors
TickerMkt capP/EP/E fwdP/SP/S fwdP/GPP/GP fwdEV/EBITDAFCF yld
OUST$2.7Bn/m—11.9x11.9x24.2x24.2xn/m-3.6%
CGNX$8.8B36.2x30.6x7.8x7.6x11.2x10.9x26.1x3.3%
CEVA$746.4Mn/m50.4x6.4x6.1x7.4x7.1xn/m0.8%
APTV
Aptiv
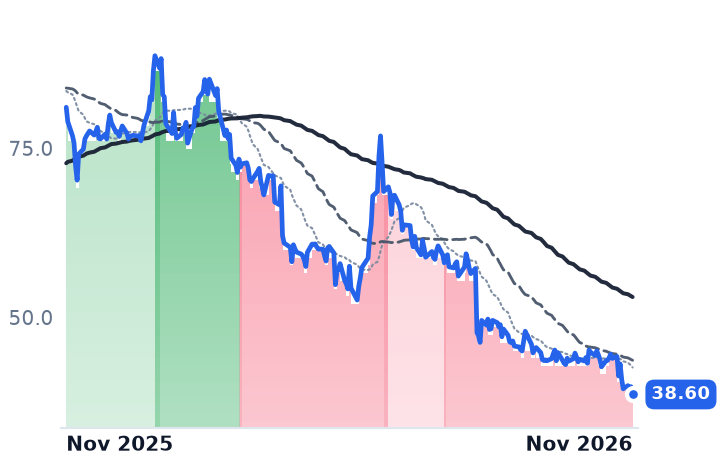
38.60
−1.15 (−2.90%)
vs. prior close
Price20d50d150d
APTV 12-month price
Autonomous Driving & Electronics
TickerMkt capP/EP/E fwdP/SP/S fwdP/GPP/GP fwdEV/EBITDAFCF yld
APTV$9.3B41.7x7.6x0.5x0.7x2.5x3.7x7.3x8.2%

Consensus projections

TickerFY2026EFY2027EFY2028E
MBLYRevenue+6.9%+7.4%+19.3%
EPS+40.2%−4.0%+35.7%
HSAIRevenue+37.8%+40.9%+30.8%
EPS−75.8%+39.4%+12.5%
AMBARevenue+39.8%+12.9%+11.6%
EPS−310.6%+34.9%+31.8%
OUSTRevenue+51.9%+34.8%+35.8%
EPS−65.7%−118.2%+890.8%
CGNXRevenue+17.5%+11.4%+9.7%
EPS+76.7%+16.4%+14.4%
CEVARevenue+11.1%+13.8%+13.6%
EPS+26.5%+42.7%+41.0%
APTVRevenue−37.5%+4.2%+4.6%
EPS−13.3%+13.4%+14.6%

Forward fiscal years only. Blank means no analyst coverage for that year.

Mobileye Global, which sells the EyeQ vision chips and higher-content SuperVision and Chauffeur driving stacks that let a car see, shipped 9.5 million of those chips in the September quarter and was paid about a dollar less for each of them than a year earlier. The business around that number got better, not worse: gross profit rose 7.4% to $261m on revenue down 2.4% to $492m, the operating loss narrowed to $82m from $109m, and the company raised its full-year revenue range to $1,995m–$2,020m while lifting adjusted operating income guidance to $400m. The shares closed on 12 November at $5.635, down 54.9% in twelve months, after touching a closing low of $5.13 on 5 November.

The slide has been read as an autonomy timeline sliding right. The disclosures say the opposite. Chief executive Amnon Shashua told investors on 29 October that the Volkswagen Group programs are on track, SuperVision at Porsche in 2027 and Chauffeur at Audi in 2028, both running on production hardware, and Mobileye added named wins in the quarter: Surround advanced driver-assistance systems with Volkswagen, Mahindra and a large US automaker, and cloud-enhanced driver assistance with Stellantis plus a top-five Asian and a top-ten Japanese automaker. What was repriced is the shape of the earnings path. Consensus has earnings per share falling to $0.483 in 2027 from $0.503 this year, with the whole growth step — revenue up 19.3% — waiting until 2028.

A dollar off a fifty-dollar chip

Unit volumes are not the problem. The 9.5 million chips came in at the high end of guidance, grew 3% against declining global vehicle output, and full-year shipments are expected to rise about 10%; Shashua said the top ten customers' volumes should grow 7% while their aggregate production falls 5%.

The price is the problem. Average system price was $49.10, roughly $1 lower year on year, because more shipments went to Chinese automakers building for emerging markets, where the chip carries less software. Management put the full-2026 decline at about $2 and expects 2027 pricing to be "more flat." On top of that, roughly $7m of passed-through memory cost entered revenue at zero gross margin, costing about one percentage point of corporate gross margin; non-GAAP gross margin fell to 64% from 67%.

Per-unit deflation is the perception layer's condition this year, not Mobileye's alone. Hesai shipped 65.3% more lidars in its own September quarter for 34.3% more revenue, which works out to about 19% less revenue per unit.

The content ladder is real and it is small

Mobileye's answer to a flat chip price is content per car. Surround ADAS carries two to three times base pricing at similar margin; SuperVision is above $1,000 a car and Chauffeur about $2,500, both at roughly 40% gross margin. The scale is the catch. SuperVision deliveries exceeded 15,000 in the quarter and the full-year outlook went up to about 65,000 from about 60,000, against an EyeQ base running near 38 million units a year.

And the concentration is deliberate. "We put all our resources and focus into bringing four new platforms to production simultaneously with our leading customer, that's Volkswagen Group," Shashua said on 29 October. "We believe that scaling a proven production-grade product is a stronger position than productizing across many customers at once."

What the fall accounts for

Part of the thirty-day drop was not Mobileye's. Between 3 and 5 November the whole chip complex was sold after Democratic midterm gains and a call for a national data-center moratorium, with Cognex down 18.3% and Ambarella 11.0% over those sessions, and Mobileye's low landed inside that window. The company-specific part is the earnings shape: at least nine brokers cut targets in early November, UBS to $7.00 and JPMorgan to $7.50, with TD Cowen moving to hold.

At $5.635 the stock trades at 11.2x forward earnings and 2.39x trailing sales, against roughly 5.3x sales implied a year ago on broadly flat revenue — the multiple has halved while the revenue line has not. Book value is 0.565x and $1.5bn of cash and securities sits against a $4.79bn market capitalization. Two things qualify the arithmetic: an Israeli research incentive supplied $51m of the quarter's adjusted operating income and about $190m for the year, with the cash arriving roughly two years later, from 2028; and Intel's funding subsidiary is selling 45 million Class A shares, worth about $900m, cutting its holding from roughly 88% to about 80%.

The open question is the 2027 price list. Mobileye is still negotiating next year's pricing with customers while automotive memory costs climb, and Team Group's chief executive said on 10 November that the shortage is worst from now through the middle of 2027, with "no downward price trend whatsoever" next year. A flat chip price that absorbs rising memory is not flat.

Mobileye has repurchased about $33m of its own stock since April at an average of $9.36, well above where it trades. Its majority owner is selling into the same market. Both are decisions about the same launch calendar, taken from opposite sides of it.

One Federal Factory Credit Lifted Nextpower's Gross Margin Nine Points and Cut Array's

Hypothesis Opus 5 · Research Opus 5 · Writing Opus 5 · Prompt v1.7

Both big US solar tracker makers book the federal advanced-manufacturing credit as a reduction to cost of sales, which means their reported gross margins measure a subsidy as much as a price — and in the September quarter the line moved in opposite directions.

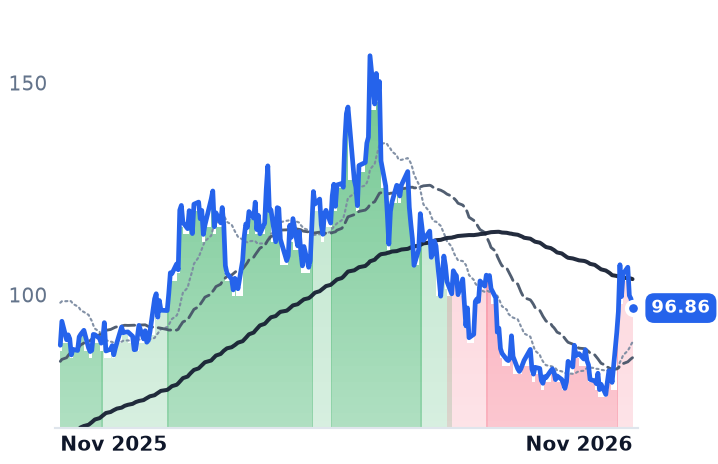
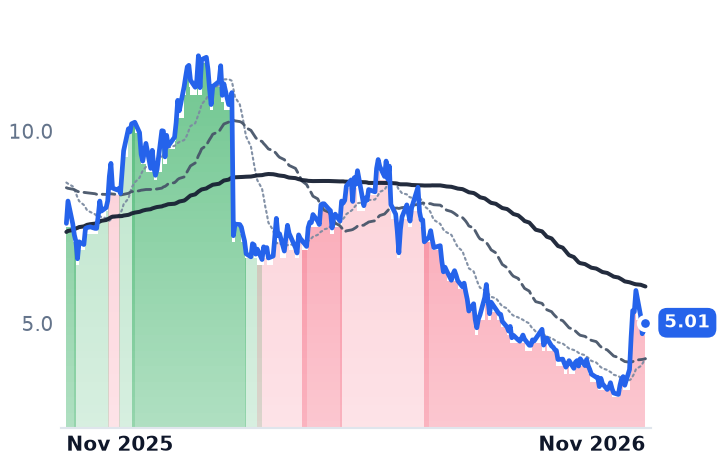
Nextpower, formerly Nextracker, recognized $192.3m of the credit in the fiscal first half, about 28% of first-half gross profit, and its quarterly gross margin still fell to 31.1% from 32.2%. Array took a $10.9m provision against a credit receivable, which pushed its margin down to 21.0% from 26.9% on revenue that fell 16.1%.

Order books grew in dollars at both — Nextpower above $6bn, Array a record $2.6bn — but neither discloses megawatts, so no one outside can check what a tracked megawatt earns. The shares' five-session jump came from a broker pick, the midterms and Array's merger with Shoals, none of them orders.

NXTARRYSHLSFSLRRUNBEPSolar Tracker Manufacturing45X Manufacturing CreditUtility-Scale Solar BuildoutBacklog & BookingsSteel & Freight Costs
TickerCompanySegmentTrend · 13mo30D1Y
The subject · what this brief is about
NXTNextpowerTracking Systems🔴 Cont. Bear+14.7%+10.0%
ARRYArray TechnologiesTracking Systems🔴 Cont. Bear+49.5%−34.0%
Compared against · context, not the story
SHLSShoals TechnologiesBalance Of System⚠️ Emerging Bear+4.5%+4.8%
FSLRFirst SolarModules🔴 Cont. Bear−4.1%−32.6%
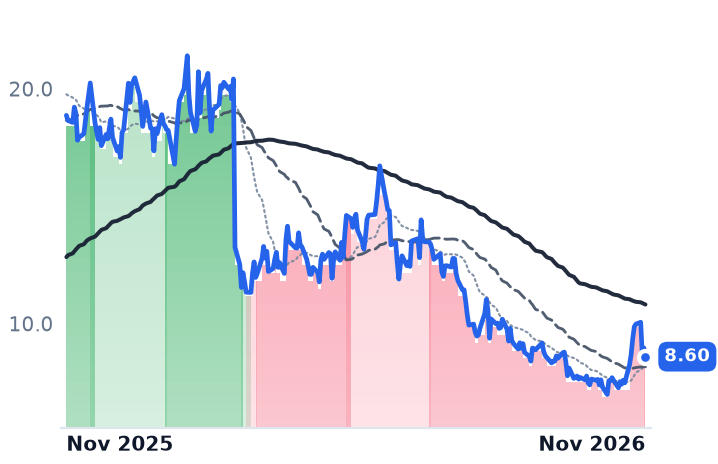
RUNSunrunResidential Services🔴 Cont. Bear+16.3%−54.5%
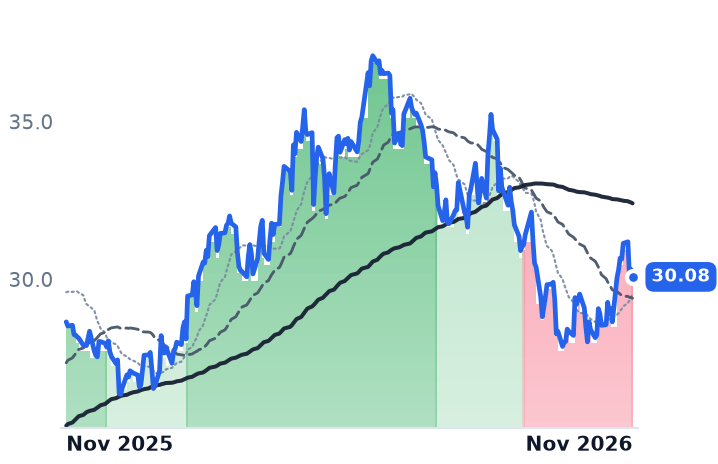
BEPBrookfield Renewable PartnersDiversified Generators⚠️ Emerging Bear+7.4%+5.0%

12-month price & trend

NXT
Nextpower
96.86
−2.21 (−2.23%)
vs. prior close
Price20d50d150d
NXT 12-month price
Tracking Systems
ARRY
Array Technologies
5.01
+0.19 (+4.05%)
vs. prior close
Price20d50d150d
ARRY 12-month price
Tracking Systems
SHLS
Shoals Technologies
8.47
+0.02 (+0.24%)
vs. prior close
Price20d50d150d
SHLS 12-month price
Balance Of System
TickerMkt capP/EP/E fwdP/SP/S fwdP/GPP/GP fwdEV/EBITDAFCF yld
NXT$14.3B22.9x19.6x3.7x3.3x11.3x9.9x16.7x3.6%
ARRY$739.2Mn/m7.0x0.7x0.5x2.9x2.4xn/m15.1%
SHLS$1.4B35.6x17.9x2.1x2.1x6.8x6.7x18.6x-2.5%
FSLR
First Solar
173
−5.56 (−3.11%)
vs. prior close
Price20d50d150d
FSLR 12-month price
Modules
RUN
Sunrun
8.60
−0.37 (−4.13%)
vs. prior close
Price20d50d150d
RUN 12-month price
Residential Services
BEP
Brookfield Renewable Partners
30.08
−0.23 (−0.77%)
vs. prior close
Price20d50d150d
BEP 12-month price
Diversified Generators
TickerMkt capP/EP/E fwdP/SP/S fwdP/GPP/GP fwdEV/EBITDAFCF yld
FSLR$18.5B9.9x9.8x3.7x3.9x7.5x7.9x6.8x1.3%
RUN$1.8B4.4x6.2x0.5x0.6x1.5x1.7x18.4x-75.2%
BEP$8.7B62.8x—1.4x1.3x5.6x5.3x9.6x-54.4%

Consensus projections

TickerFY2026EFY2027EFY2028E
NXTRevenue+22.3%+24.8%+19.2%
EPS+13.8%+9.3%+20.6%
ARRYRevenue+10.1%+14.5%+5.7%
EPS+2.6%+28.8%+7.9%
SHLSRevenue+38.9%+9.3%+8.5%
EPS+15.9%+26.8%+14.0%
FSLRRevenue−6.3%+19.4%+12.9%
EPS+20.7%+31.7%+20.0%
RUNRevenue+27.9%+2.6%+12.9%
EPS−11.4%−54.4%+7.2%
BEPRevenue+3.4%+9.5%−3.3%
EPS+11.4%−10.5%+9.0%

Forward fiscal years only. Blank means no analyst coverage for that year.

Nextpower, the Fremont company formerly called Nextracker that sells the steel, actuators and control software pointing utility-scale solar panels at the sun, reported record revenue of $1.11bn in the September quarter and a thinner gross margin than a year earlier. The reason those two facts sit together is an accounting line: the federal advanced-manufacturing credit for US-made components, which both big American tracker makers subtract from cost of sales, where a tax subsidy becomes indistinguishable from a better price.

The five-session leap in the tracker shares in early November was read as the cycle turning. The September-quarter filings say something narrower. Order books are growing in dollars at both companies, the price of a tracker per watt is still falling, and the margin line that would normally settle the argument is partly a function of who collected a credit and who wrote one off.

$192.3m that never came from a price

Nextpower recognized roughly $192.3m from the Section 45X credit as a reduction to cost of sales in the first half of fiscal 2027, worth 9.4 points of the half's 33.3% gross margin and about 28% of its $681.2m of first-half gross profit, according to its results filing. Strip it out and the half runs near 24%. The quarter-level disclosure is coarser still: about $99m of credits, vendor rebates and tariffs, net, with the subsidy and the tariff drag inside one number.

And the reported margin fell anyway, to 31.1% from 32.2%, with operating income up 12.8% on revenue up 22.5%. Management guided second-half adjusted gross margin to the high 20s, citing diesel costs up 80% year to date, elevated steel and freight, and initially lower margins on newly added products. "We are increasing our fiscal year 2027 outlook. We expect revenue of $4.2 billion to $4.45 billion, adjusted EBITDA of $890 million to $940 million and adjusted diluted EPS of $4.61 to $4.87 per share," chief financial officer Charles Boynton told investors on October 28.

Array booked the same credit backwards

Array Technologies, the Albuquerque maker of single-axis trackers and SmarTrack control software, took the mirror image. Its gross margin dropped to 21.0% from 26.9%, which the quarterly filing attributes primarily to a $10.9m provision against a 45X credit receivable; on the call the same-sized charge was described as a long-dated supplier rebate reserve. Revenue fell 16.1% to $330.2m, operating income nearly vanished at $3.6m, and full-year guidance came down to $1.34bn–$1.40bn from $1.4bn–$1.5bn, the company said, on shifts in delivery timing. Array has pointed to trade policy, permitting reviews and higher rates pushing projects back rather than away: its order book hit a record $2.6bn, up 42%, at a book-to-bill of 1.6 times.

Nextpower's book passed $6bn on more than $1bn of quarterly bookings, per its results release. Neither discloses backlog in megawatts, so the one number that would settle what a tracked megawatt earns cannot be computed from outside. Array's management supplied the only arithmetic on offer: a gigawatt of additional tracker sales is roughly $100m of revenue and about $30m of EBITDA.

Content attach is what both are actually buying

Tracker pricing per watt "continues to align with the broader solar cost reduction curve," Nextpower's team said on its call, with overall average selling price up only modestly on higher attach of non-tracker products, per the transcript. Non-tracker reached about 22% of revenue from roughly 14%. "Non-tracker bookings in the quarter were greater than 20%," president Howard Wenger said on October 28, including more than $100m of electrical balance-of-system orders.

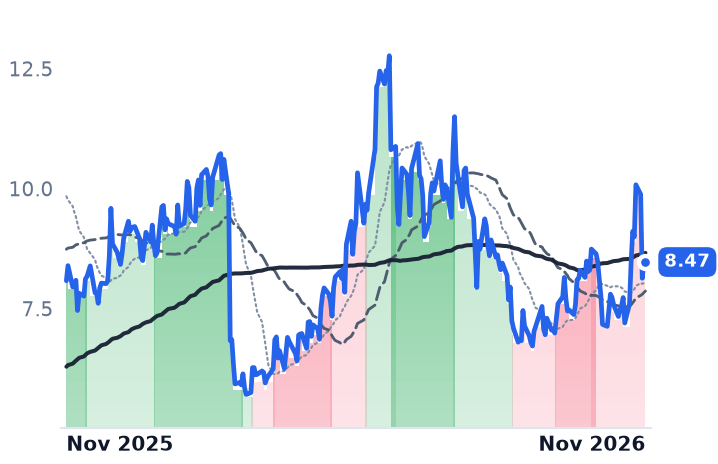
Array bought the same thing in one move, agreeing on November 4 to an all-stock merger with Shoals Technologies, which makes the cable assemblies, combiners and wire management that wire a solar field, valued at about $1.32bn with Shoals holders ending up with roughly 65% of the combined company and closing expected in the first quarter of 2027, per the merger filing. "About 80% of the projects only had one of our products between the two company. So that unlocks a marketplace, a cross-sell marketplace opportunity of $2.5 billion, which is larger than the combined revenue of the two companies today," Shoals chief executive Brandon Moss said on November 4.

Five sessions, three catalysts, no orders

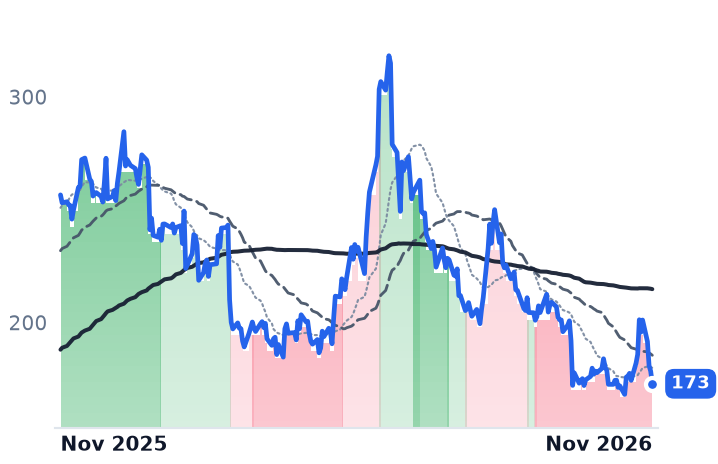
Nextpower rose about 15% on November 2 after Jefferies named it a Franchise Pick; the group then rose on Democratic congressional wins, with First Solar and Sunrun each up about 6%; Array added the merger. Roughly a third came back on November 10 as October inflation pushed the 10-year yield toward 5%. Over the full 30 days First Solar, the cadmium-telluride module maker, fell 6.0% and Shoals was flat, so this was not a repricing of US solar.

What the order books do not settle

The records are real and the margins are not yet. Nextpower's revenue has compounded from $1.46bn in fiscal 2022 to $3.56bn in fiscal 2026, which makes 19.6 times forward earnings against 22.9 times trailing a defensible price for a business whose guidance went up. Array at about 7 times forward earnings has no usable trailing multiple, because trailing earnings are negative, and the cheapness partly reflects more than $317m of preferred stock the sales multiple does not see. What neither price settles is the demand shape behind the credit deadline: First Solar has said developers are prioritizing 2028 safe-harbor dates while deferring procurement for 2029 and later, and those who missed the July 4, 2026 begin-construction test face a December 31, 2027 placed-in-service cliff.

A tracker sold into that rush is revenue now and a hole later. The honest reading of both order books is that they are full of projects racing a date, and that the margin they will print depends on a credit one of these two companies has already decided it may not collect.

Fair Isaac Froze the FICO Score Price That Produced All of Last Year's Growth

Hypothesis Opus 5 · Research Opus 5 · Writing Opus 5 · Prompt v1.7

Fair Isaac's fiscal 2026 was an administered price increase wearing a growth company's clothes, and the lever is now clamped shut. Revenue rose 27.3% to $2.535bn and operating margin reached 49.9%, but the company's own fourth-quarter release attributes the 39% rise in business-to-business Scores revenue to a higher mortgage score unit price "partially offset by a decline in mortgage originations volume."

The wholesale mortgage score price went from $4.95 to $10, and under the Preferred Program launched in October it stays at $10 through 2027 — sold to lenders that pull FICO on all mortgage applications. Management withheld fiscal-2027 guidance entirely and said it will stop disclosing prices and program terms.

The business explains the markdown only once read forward: consensus has FY27 revenue up 2.3% and net income down 3.7%, with the Mortgage Bankers Association forecasting 5.0 million loans next year.

FICOBLVERXQTWOTYLNCNOALKTGWRESSNCEFXTRUMortgage Credit ScoringCredit Bureau EconomicsMortgage Origination CycleGSE Policy & RegulationPricing PowerLending Decisioning Software
TickerCompanySegmentTrend · 13mo30D1Y
The subject · what this brief is about
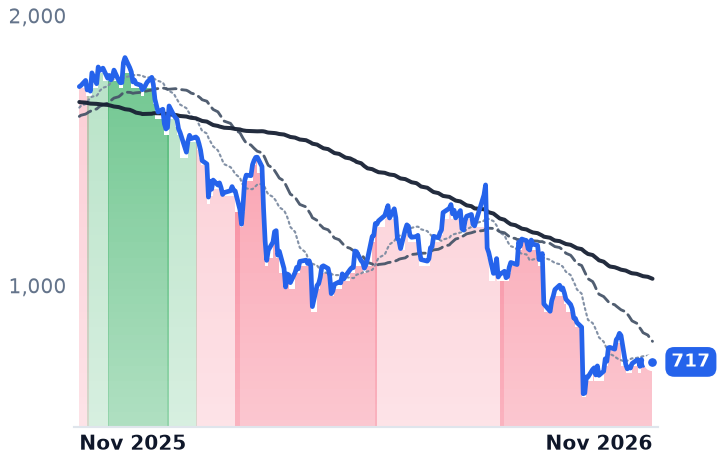
FICOFair IsaacData, Analytics & Intelligence🔴 Cont. Bear−0.3%−58.7%
Compared against · context, not the story
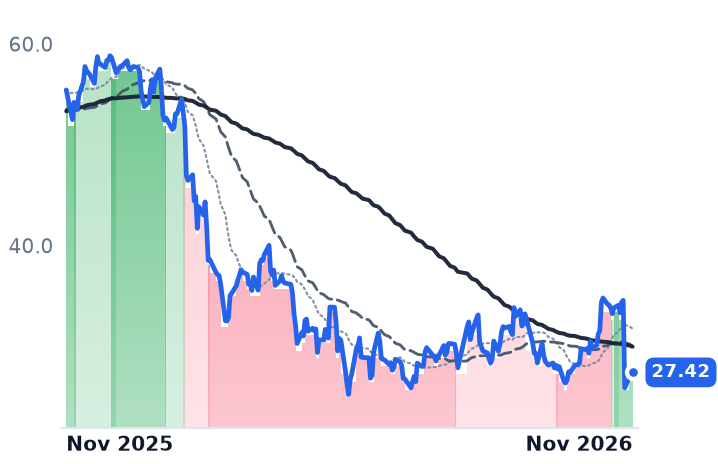
BLBlackLineOther🔴 Cont. Bear−6.5%−50.5%
VERXVertexCommerce & Digital Payments🌱 Emerging Bull+40.0%−12.4%
QTWOQ2Commerce & Digital Payments🟢 Cont. Bull+25.1%+3.4%
TYLTyler TechnologiesIndustry-Specific Platforms🌱 Emerging Bull+22.2%−8.8%
NCNOnCinoCommerce & Digital Payments🟢 Cont. Bull+13.5%−12.1%
ALKTAlkami TechnologyCommerce & Digital Payments🔴 Cont. Bear+1.5%−29.9%
GWREGuidewire SoftwareIndustry-Specific Platforms🟢 Cont. Bull−4.4%−27.5%
SSNCSS&C TechnologiesEnterprise Resource Planning🟢 Cont. Bull−2.8%−5.5%
EFXEquifaxWorkforce Data & Analytics🌱 Emerging Bull+27.1%−8.1%
TRUTransUnionConsumer Credit Reporting🌱 Emerging Bull+23.1%+0.4%

12-month price & trend

FICO
Fair Isaac
717
−11.47 (−1.57%)
vs. prior close
Price20d50d150d
FICO 12-month price
Data, Analytics & Intelligence
BL
BlackLine
27.42
+0.09 (+0.33%)
vs. prior close
Price20d50d150d
BL 12-month price
Other
VERX
Vertex
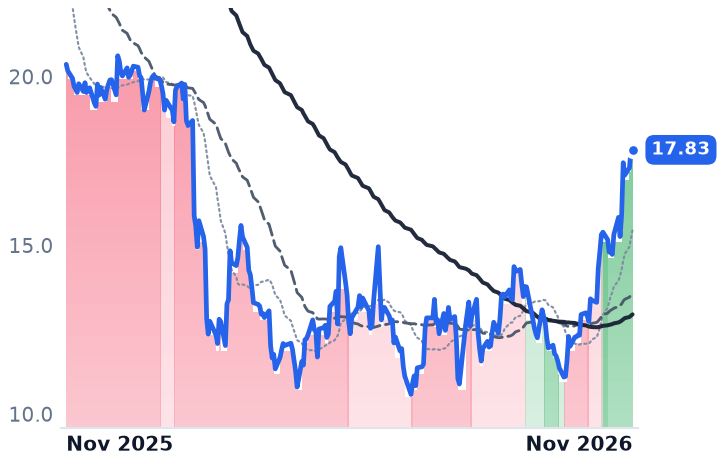
17.83
−0.01 (−0.06%)
vs. prior close
Price20d50d150d
VERX 12-month price
Commerce & Digital Payments
TickerMkt capP/EP/E fwdP/SP/S fwdP/GPP/GP fwdEV/EBITDAFCF yld
FICO$15.3B19.7x16.2x6.1x5.9x7.0x6.9x16.1x6.9%
BL$1.6B40.2x11.1x2.1x2.1x2.8x2.7x19.0x10.9%
VERX$2.9Bn/m21.1x3.6x3.5x5.7x5.6x55.8x2.0%
QTWO
Q2
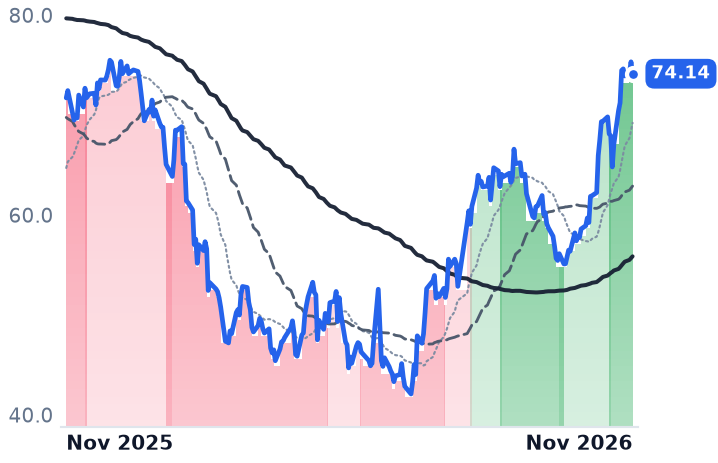
74.14
−1.19 (−1.58%)
vs. prior close
Price20d50d150d
QTWO 12-month price
Commerce & Digital Payments
TYL
Tyler Technologies
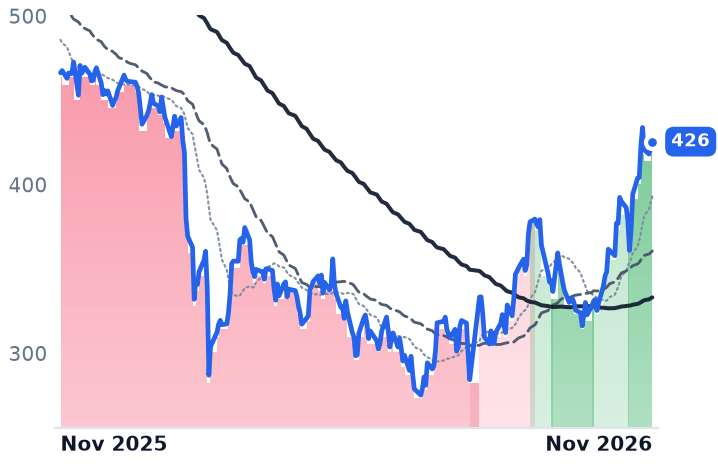
426
+3.86 (+0.92%)
vs. prior close
Price20d50d150d
TYL 12-month price
Industry-Specific Platforms
NCNO
nCino
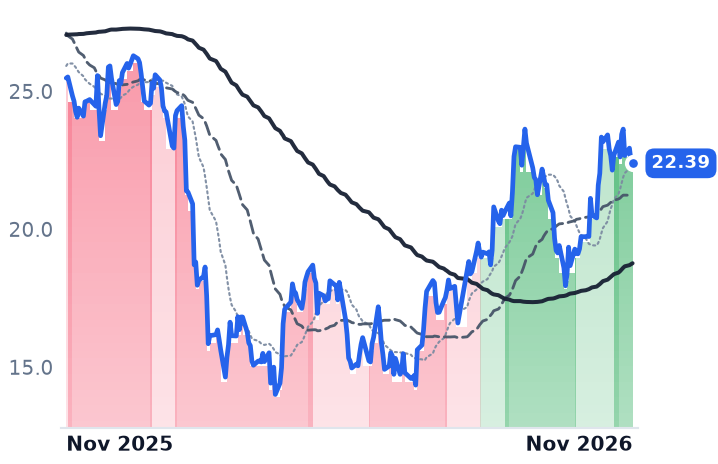
22.39
−0.08 (−0.36%)
vs. prior close
Price20d50d150d
NCNO 12-month price
Commerce & Digital Payments
TickerMkt capP/EP/E fwdP/SP/S fwdP/GPP/GP fwdEV/EBITDAFCF yld
QTWO$4.7B—26.9x—5.2x——27.6x4.9%
TYL$16.8B52.6x32.2x6.8x6.6x14.3x13.9x30.0x4.4%
NCNO$2.4B—17.1x—3.7x——28.4x5.6%
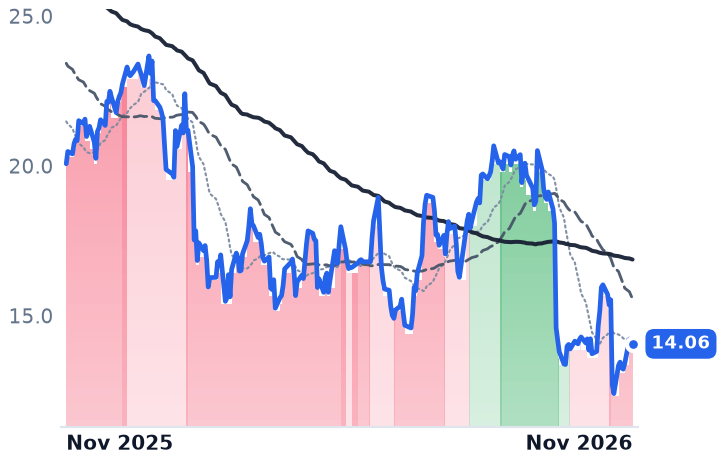
ALKT
Alkami Technology
14.06
−0.10 (−0.71%)
vs. prior close
Price20d50d150d
ALKT 12-month price
Commerce & Digital Payments
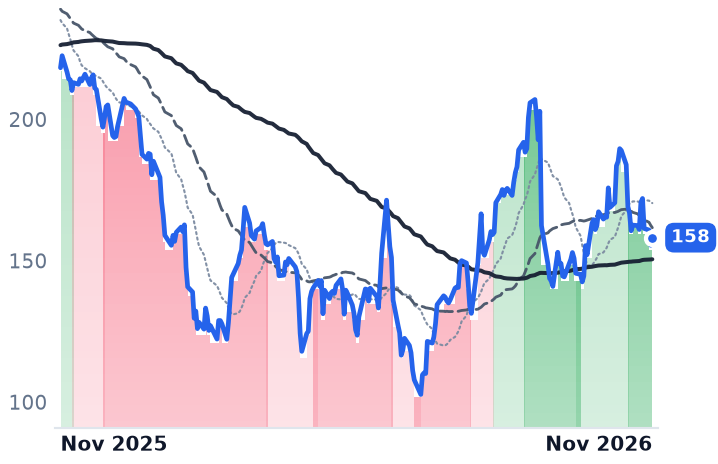
GWRE
Guidewire Software
158
+2.68 (+1.72%)
vs. prior close
Price20d50d150d
GWRE 12-month price
Industry-Specific Platforms
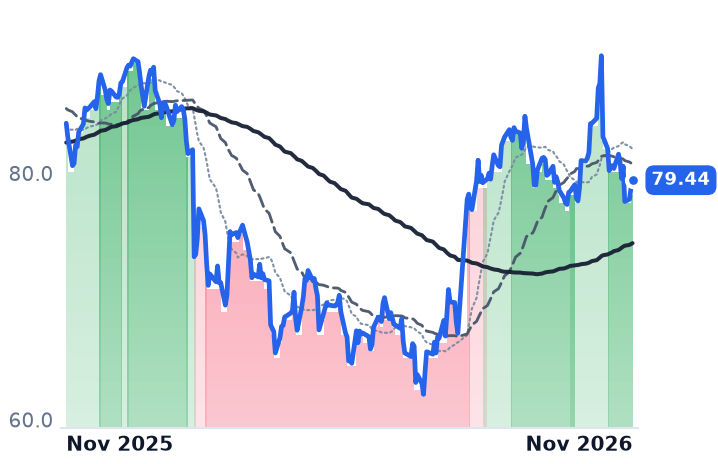
SSNC
SS&C Technologies
79.44
+0.62 (+0.79%)
vs. prior close
Price20d50d150d
SSNC 12-month price
Enterprise Resource Planning
TickerMkt capP/EP/E fwdP/SP/S fwdP/GPP/GP fwdEV/EBITDAFCF yld
ALKT$1.5B—16.9x—2.9x——286.0x3.6%
GWRE$12.8B—37.4x—7.5x——61.6x2.3%
SSNC$18.5B22.1x11.0x2.8x2.7x5.7x5.7x11.4x9.5%
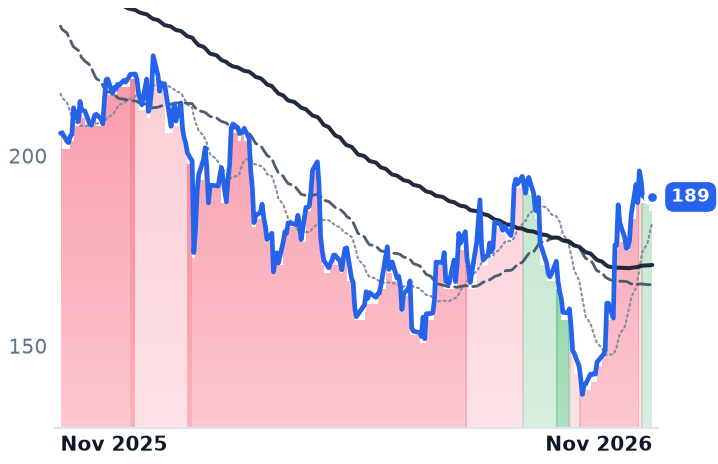
EFX
Equifax
189
+1.72 (+0.92%)
vs. prior close
Price20d50d150d
EFX 12-month price
Workforce Data & Analytics
TRU
TransUnion
81.96
−0.05 (−0.06%)
vs. prior close
Price20d50d150d
TRU 12-month price
Consumer Credit Reporting
TickerMkt capP/EP/E fwdP/SP/S fwdP/GPP/GP fwdEV/EBITDAFCF yld
EFX$17.7B26.2x17.6x2.7x2.6x4.9x4.7x12.1x6.3%
TRU$12.8B17.5x13.8x2.6x2.5x4.7x4.5x9.6x6.1%

Consensus projections

TickerFY2026EFY2027EFY2028E
FICORevenue+27.2%+2.3%+5.5%
EPS+44.6%+4.0%+8.9%
BLRevenue+8.6%+8.5%+9.3%
EPS+19.1%+10.5%+14.6%
VERXRevenue+10.9%+10.5%+10.8%
EPS+32.5%+22.8%+20.4%
QTWORevenue+12.5%+10.2%+10.0%
EPS+17.9%+23.8%+17.2%
TYLRevenue+8.6%+9.9%+9.8%
EPS+14.8%+18.9%+14.1%
NCNORevenue+9.8%+8.9%+8.6%
EPS+25.2%+45.3%+19.9%
ALKTRevenue+19.9%+14.1%+14.7%
EPS+60.9%+28.3%+26.5%
GWRERevenue+23.8%+17.2%+15.6%
EPS+41.5%+20.0%+27.5%
SSNCRevenue+8.4%+5.1%+4.9%
EPS+17.7%+8.6%+8.4%
EFXRevenue+11.2%+8.3%+9.7%
EPS+11.8%+17.4%+21.0%
TRURevenue+13.8%+8.2%+8.1%
EPS+13.5%+15.0%+15.8%

Forward fiscal years only. Blank means no analyst coverage for that year.

Fair Isaac closed its fiscal year on 30 September with what its chief executive called the most successful twelve months in the company's history, and then declined to tell investors what the next twelve would look like. On the 4 November call the company withheld fiscal-2027 revenue and earnings guidance altogether, citing mortgage pricing programs still being finalized with lenders, elevated rates suppressing volumes, and a fiscal year that begins in October while mortgage score pricing resets in January.

Fair Isaac licenses the FICO credit score, which lenders buy through the three bureaus and their resellers, and sells the FICO Platform decisioning software to banks. The market had treated the first business as a toll whose price the company sets at will. The year just filed shows that the toll was the entire growth story — and that its price is now fixed.

Seventy-two percent more mortgage revenue on fewer pulls

The fourth-quarter release states the mechanism in the company's own words: business-to-business Scores revenue rose 39% "primarily attributable to a higher mortgage origination scores unit price, partially offset by a decline in mortgage originations volume." Mortgage origination revenue grew 72% in the quarter while score volumes fell high single digits. Auto originations added 11% and card and personal loan 12%. Scores revenue of $1.652bn for the year was 65% of the $2.535bn group total, up from roughly 59% a year earlier.

The price behind that did roughly double, from $4.95 a mortgage score to $10. Under the FICO Preferred Program launched in October, it holds flat at $10 for 2027 — available to lenders and brokers buying tri-merge reports through resellers that commit to pulling FICO on 100% of applications. That is pull-through insurance bought with price certainty. Mizuho's Sean Kennedy cut his target to $986 from $1,063 on flat mortgage score pricing in 2027.

The separate Mortgage Direct License Program routes around the bureaus, letting resellers calculate and distribute scores themselves; FICO has signed resellers representing about 73% of mortgage reseller volume, including Xactus. Its Performance Model — a $4.95 royalty plus a $33 fee per borrower when the loan closes — remains pending certification by the government-sponsored enterprises, so the half of the economics tied to closings is not usable in the conforming market.

Someone else sets the units

The Federal Housing Finance Agency directed Fannie Mae and Freddie Mac to price loans on a single adjustment grid whether scored with Classic FICO or VantageScore 4.0, removing the 20-point penalty previously applied to the rival. TransUnion extended $0.99 VantageScore pricing through 2028 and counts more than 1,100 mortgage lenders using it. And the Mortgage Bankers Association expects 5.0 million loans in 2027, down 5.6%.

Chief executive William Lansing's answer is the newer model. "10T is the best score available," he said on 4 November. "All the trend and momentum is in the direction of 10T adoption, and I think 2027 will be a big year for 10T." Eighty-four lenders representing $684bn of eligible annual originations have joined its adopter program, and the Federal Housing Administration will accept it from 1 January 2027. Conforming certification is still outstanding.

The software book is compounding underneath

Software annual recurring revenue reached $851m, up 14%, with platform ARR of $453m up 72%. "Our dollar-based net retention rate in the quarter was 112%," chief financial officer Steven Weber told investors. "Platform NRR was 156%." The non-platform book retained 82%, shrinking at an 18% annual rate, and segment operating margin reached 61% from 55%.

The shares are down 59.7% over twelve months. The two worst sessions were regulatory, not operational: down 29.2% on 29 September on the FHFA grid decision and TransUnion's pricing, and 13.2% on 26 October when the flat $10 was announced. The 4 November print itself moved them 3.2%.

What the compression is actually paying for

Fiscal 2026 contradicts the markdown on reported numbers — revenue up 27.3%, gross margin from 82.2% to 86.1%, free cash flow of $1.034bn — and supports it on forward ones. Consensus has fiscal-2027 revenue growing 2.3% and net income falling 3.7%, with earnings per share still up 4.0% because the diluted count fell 13.2% in two years on $3.028bn of buybacks, now paused for term-loan repayment at 3.29x leverage. At the 12 December 2025 peak of $1,844.98 the shares carried roughly 69x trailing earnings; today's $717.38 is 19.7x, and 7.0x trailing gross profit against about 27x then. The forward 16.2x rests on an estimate cut from $49.65 in mid-October to $44.35 — a denominator the company itself will not stand behind.

Lansing was explicit about why. "We were attacked because we're transparent and clear about our score price," he said on 4 November. "We're not going to share what the prices are." The toll becomes a private matter between Fair Isaac and the resellers, and the only public read on it will be a revenue line whose two drivers are now pulling in opposite directions.

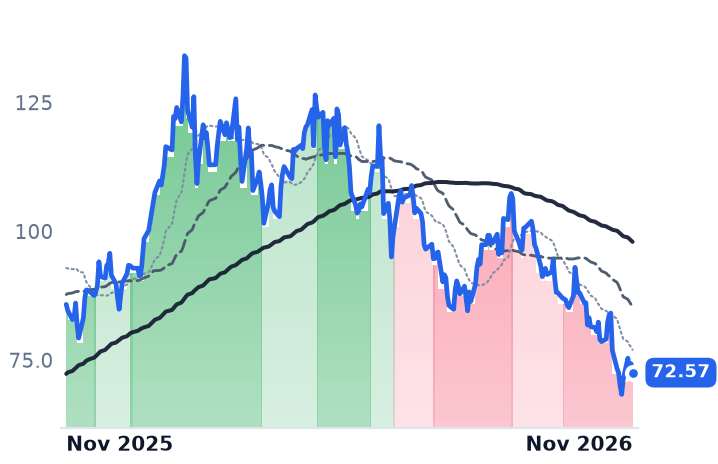
BWX Technologies' Navy Backlog Grew All Year While the Market Priced It Like Oklo

Hypothesis Opus 5 · Research Opus 5 · Writing Opus 5 · Prompt v1.7

One sentiment markdown has been applied to three nuclear income statements that have almost nothing in common. BWX Technologies, sole-source supplier of naval reactors to the US Navy, widened operating margin from 10.6% to 13.9% in the September quarter, pushed backlog to $8,556m and raised the low end of its free-cash-flow guidance. Its shares are down 39.6% in six months.

Oklo and NuScale fell further on results that explain the fall: Oklo booked $3.07m of revenue in nine months against a customer book its own filing calls non-binding letters of intent, and NuScale's quarterly revenue fell 96.6% to $0.281m with no module sold. Both are diluting hard, both hold years of cash.

BWXT now trades at 26.2x forward earnings against roughly 46x forward in May. Nothing in its disclosures moved the way the price did.

BWXTOKLOSMRCCJLEUNaval Nuclear PropulsionSMR DevelopersAI Data-Center PowerNuclear Fuel CycleDefense Backlog GrowthPre-Revenue Reactor Licensing
TickerCompanySegmentTrend · 13mo30D1Y
The subject · what this brief is about
BWXTBWX TechnologiesAerospace Components & Propulsion🔴 Cont. Bear−8.7%−29.6%
OKLOOkloAdvanced Nuclear🔴 Cont. Bear−15.5%−75.5%
SMRNuScale PowerAdvanced Power Systems🔴 Cont. Bear−13.9%−78.1%
Compared against · context, not the story
CCJCamecoUranium🔴 Cont. Bear−11.3%−15.4%
LEUCentrus EnergyUranium🔴 Cont. Bear−13.1%−57.9%

12-month price & trend

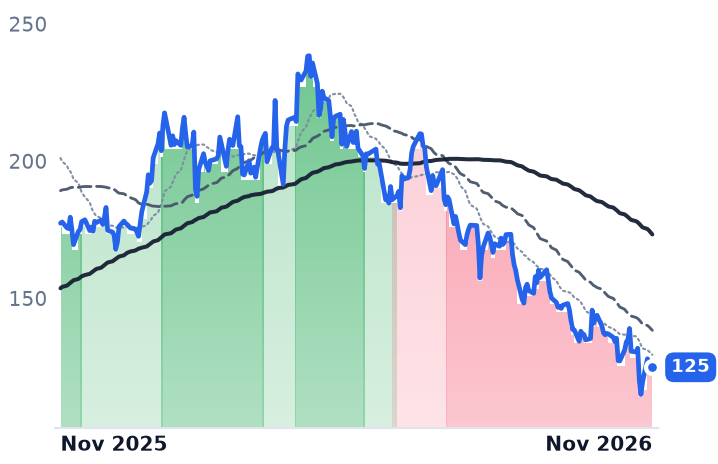
BWXT
BWX Technologies
125
−0.81 (−0.64%)
vs. prior close
Price20d50d150d
BWXT 12-month price
Aerospace Components & Propulsion
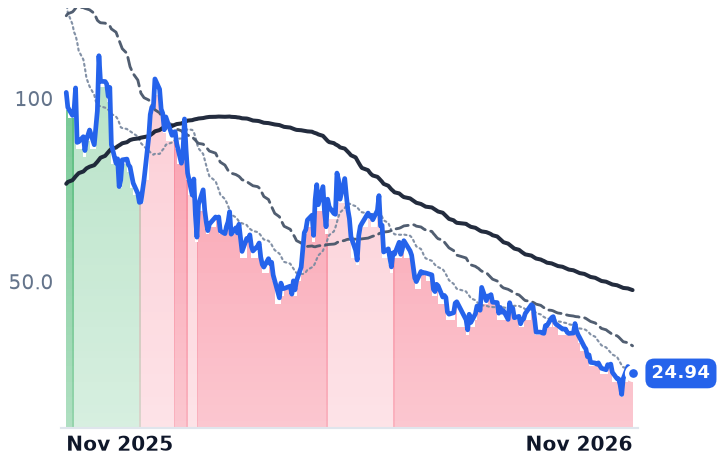
OKLO
Oklo
24.94
−0.92 (−3.54%)
vs. prior close
Price20d50d150d
OKLO 12-month price
Advanced Nuclear
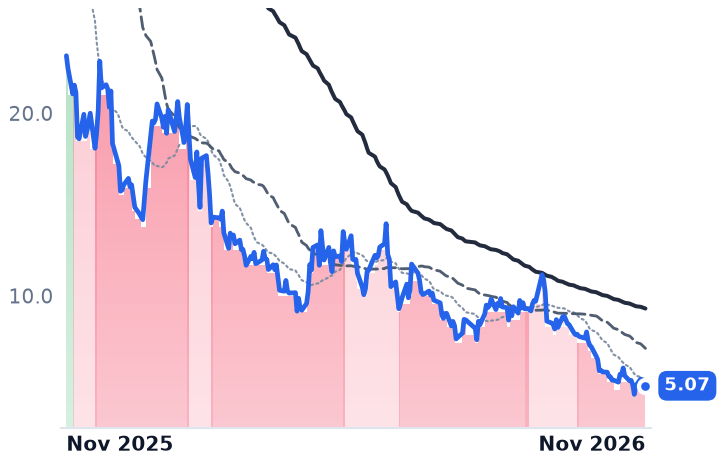
SMR
NuScale Power
5.07
−0.16 (−3.05%)
vs. prior close
Price20d50d150d
SMR 12-month price
Advanced Power Systems
TickerMkt capP/EP/E fwdP/SP/S fwdP/GPP/GP fwdEV/EBITDAFCF yld
BWXT$11.4B30.4x26.2x3.2x3.0x14.0x13.3x22.4x3.3%
OKLO$4.8Bn/m—————n/m-9.4%
SMR$1.5Bn/m—535.9x116.3x——n/m-41.5%
CCJ
Cameco
72.57
−1.75 (−2.35%)
vs. prior close
Price20d50d150d
CCJ 12-month price
Uranium
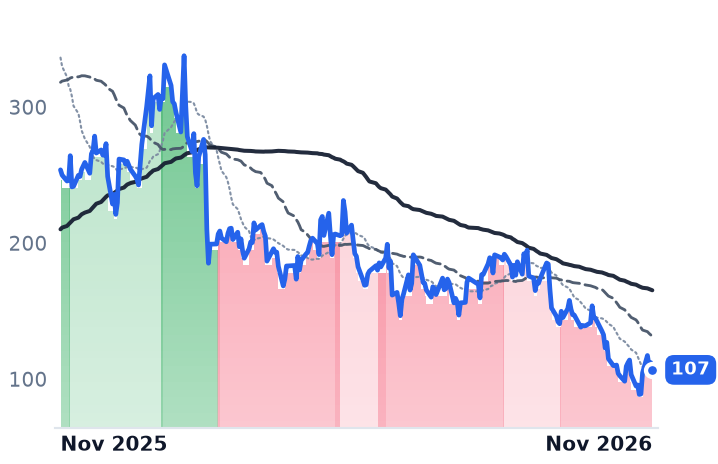
LEU
Centrus Energy
107
−5.39 (−4.81%)
vs. prior close
Price20d50d150d
LEU 12-month price
Uranium
TickerMkt capP/EP/E fwdP/SP/S fwdP/GPP/GP fwdEV/EBITDAFCF yld
CCJ$30.1B106.4x52.1x12.2x8.6x51.3x36.1x48.8x0.7%
LEU$2.0B26.9x42.9x4.5x4.2x19.6x18.6x8.9x-14.5%

Consensus projections

TickerFY2026EFY2027EFY2028E
BWXTRevenue+20.2%+8.8%+9.6%
EPS+24.4%+9.9%+12.6%
OKLORevenue—+195.4%+401.0%
EPS+61.0%+17.9%+16.1%
SMRRevenue−70.0%+628.0%+174.1%
EPS−77.2%+19.4%−5.9%
CCJRevenue+2.4%+12.8%+8.8%
EPS−7.5%+88.3%+27.3%
LEURevenue+6.9%+4.5%−5.5%
EPS−46.4%+46.7%−12.2%

Forward fiscal years only. Blank means no analyst coverage for that year.

BWX Technologies builds the reactors, nuclear fuel and missile launch tubes that the US Navy's propulsion program buys from it as sole source, and in the September quarter it widened operating margin to 13.86% from 10.64% a year earlier while total backlog reached $8,556m, up from $8,398m three months before. The shares closed at $124.87 on 12 November, down 39.6% from six months earlier and 47.6% below their April peak.

That decline arrived in step with Oklo, down 66.1% over the same six months, and NuScale, down 57.7%. The market has treated listed nuclear as a single expression of the AI-power trade, and the late-October trigger was financial rather than nuclear: Meta's raised capital-expenditure forecast reignited concern about data-center borrowing, sending Centrus, Oklo, NuScale and BWX Technologies to 52-week lows together. What separates them is whether anyone has signed anything.

The backlog rose through every month of the decline

BWXT's Government Operations segment grew revenue 4% to $639m in the quarter with operating income up 26% to $122.6m; Commercial Operations revenue rose 25%, 15% of it organic. A $189m annual naval fuel contract was booked. At the 2 November report the company raised the low end of 2026 free-cash-flow guidance to $350-360m and tightened non-GAAP earnings guidance to $4.72-$4.77 a share.

The de-rating is in the multiple alone. BWXT trades at 26.2x forward earnings against roughly 46x forward in May 2026, when the trailing multiple was 54.97x against 30.4x now, and consensus has 2026 earnings growing 24.4% before decelerating to about 10% in 2027.

Oklo's customer book is letters of intent, and its regulator is the Energy Department

Oklo's 10-Q for the nine months to 30 September records total revenue of $3.07m and describes non-binding letters of intent with Equinix and other customers that it is still working to convert into binding power purchase agreements. The 1.2 GW Ohio campus agreement with Meta, 900 MW of it under grid study, is not binding either. The company has not tendered a combined licence application to the Nuclear Regulatory Commission; its 2020 filing was dismissed without prejudice in January 2022, and it is building under Energy Department authorisation instead. First power at Aurora-Idaho slipped to 2028-2029 from 2027-2028.

Meanwhile operating cash burn rose 127% year on year to $110.9m for the nine months, and diluted shares rose 25.4%. "We have everything we need, and that's an incredible position to be in and something that hasn't been very present in the United States for decades," chief executive Jake DeWitte told investors on 6 November. He is right about the cash: $3.1bn, or $16.44 per diluted share against a $24.94 close, roughly five years at guided burn and capital spend.

NuScale has the approved design and no buyer of record

NuScale's quarterly revenue fell 96.6% to $0.281m and it has still sold no power module. Its commercial route runs through ENTRA1, which holds global exclusive rights to deploy the plants and whose September 2025 Tennessee Valley Authority agreement for up to 6 GW is non-binding; shareholder class actions followed a research report characterising ENTRA1 as thinly staffed. Management's own sequence puts the power purchase agreement first and module revenue last. "We are no longer simply designing and planning, we are manufacturing," chief executive John Hopkins said on 5 November of first-article work with Doosan Enerbility, which sits on the balance sheet as inventory recoverable only through a future equipment contract. Diluted shares rose 39.0%; liquidity is $1.9bn against about $65m of quarterly operating expense, and the stock trades at 0.99x book.

For the two developers the results account for the move. Nominal revenue, heavy dilution and a start-up date pushed a year later are the repricing of announcements into deliveries, and neither is a solvency story. For BWXT nothing in the disclosures moved that way; the likelier reading is rotation out of defence and nuclear multiples that had reached levels earnings could not hold.

One event would separate the three again. "I said at the beginning of this year that I expected us to have new orders for U.S. reactor plant builds in -- by the end of this year," chief executive Rex Geveden said on 2 November. "And I still think that's a possibility for us, but certainly no later than about the first half of the next year." A signed build order lands on the one company here already paid for work it has done.

Air Products Cancelled Its Hydrogen Megaprojects and Refilled the Backlog With Chip Gases

Hypothesis Opus 5 · Research Opus 5 · Writing Opus 5 · Prompt v1.7

Air Products spent fiscal 2026 writing off the green-hydrogen complexes its previous management committed to, and the book it has rebuilt in their place is almost entirely semiconductor work. The industrial-gas backlog ended September at about $3.3bn, of which $2.6bn is electronics, after more than $2.0bn of electronics wins in twelve months.

The September quarter grew 12.3%, carried by nine percentage points of volume, and fiscal 2027 adjusted earnings are guided to $14.15-$14.50 a share, up 5-8%, with capital spending cut to $3.0-$3.5bn from a legacy run-rate near $5bn. Linde, whose electronics sales grew 15% organically last quarter, runs the larger book.

The prints support the business case at both. What they do not yet support at Air Products is cash: its trailing free-cash-flow yield is 0.68% against Linde's 2.10%, and the first positive free-cash year is still only a guide.

APDLINAI.PAFCXSCCOTECKEROHBMPRY.MINEX.PANKT.COElectronics Specialty GasesIndustrial Gas On-Site ContractsGreen Hydrogen RetrenchmentSemiconductor Fab BuildoutAI Data-Center InputsCopper Demand Cycle
TickerCompanySegmentTrend · 13mo30D1Y
The subject · what this brief is about
APDAir Products and ChemicalsIndustrial Gases🟢 Cont. Bull+7.5%+20.7%
LINLindeIndustrial Gases⚠️ Emerging Bear+7.3%+24.0%
Compared against · context, not the story
AI.PAL'Air LiquideChemicals - Specialty🔴 Cont. Bear+13.5%+11.7%
FCXFreeport-McMoRanDiversified Resources🟢 Cont. Bull−13.7%+49.3%
SCCOSouthern CopperIntegrated Producers🟢 Cont. Bull−16.7%+28.3%
TECKTeck ResourcesDiversified Resources🟢 Cont. Bull−1.7%+52.3%
EROEro CopperFocused Miners🟢 Cont. Bull−15.3%+32.6%
HBMHudbay MineralsPolymetallic Miners⚠️ Emerging Bear−13.0%+33.0%
PRY.MIPrysmian S.p.AElectrical Equipment & Parts⚠️ Emerging Bear−3.0%+30.9%
NEX.PANexansElectrical Equipment & Parts⚠️ Emerging Bear+0.9%+6.3%
NKT.CONKT A/SElectrical Equipment & Parts⚠️ Emerging Bear+2.7%+20.9%

12-month price & trend

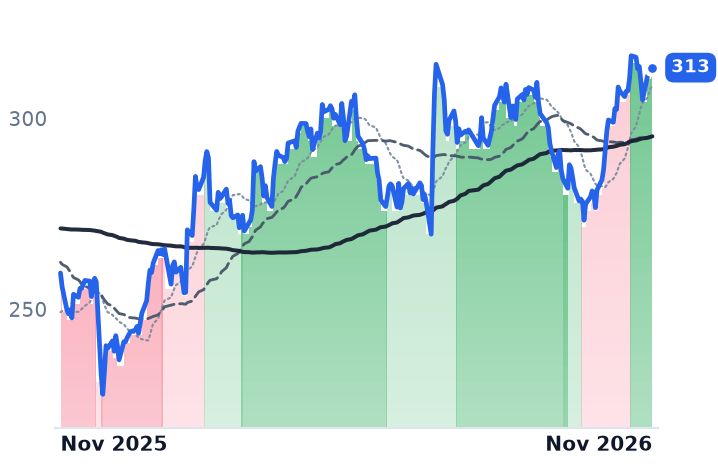
APD
Air Products and Chemicals
313
−0.02 (−0.01%)
vs. prior close
Price20d50d150d
APD 12-month price
Industrial Gases
LIN
Linde
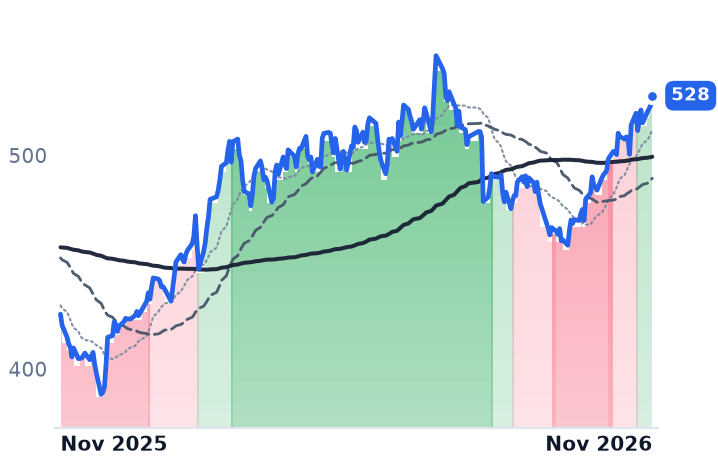
528
+4.52 (+0.86%)
vs. prior close
Price20d50d150d
LIN 12-month price
Industrial Gases
AI.PA
L'Air Liquide
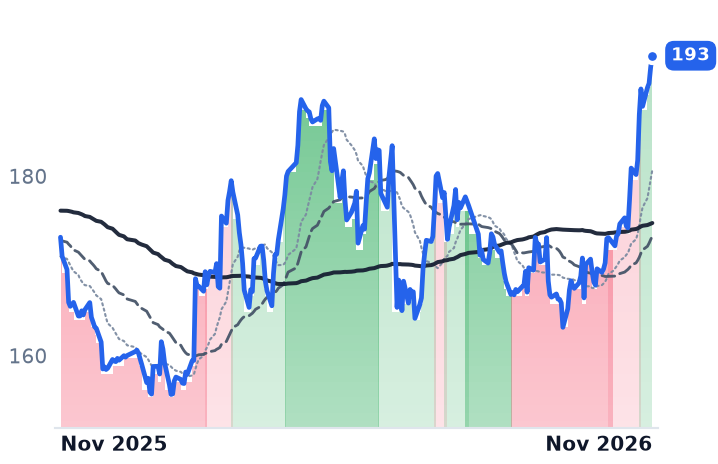
193
+1.26 (+0.66%)
vs. prior close
Price20d50d150d
AI.PA 12-month price
Chemicals - Specialty
TickerMkt capP/EP/E fwdP/SP/S fwdP/GPP/GP fwdEV/EBITDAFCF yld
APD$70.4B132.3x22.0x5.4x5.2x17.2x16.4x113.1x0.7%
LIN$241.3B34.8x29.4x6.7x6.6x17.9x17.7x19.9x2.1%
AI.PA$118.9B32.0x28.8x4.4x4.2x12.1x11.6x16.1x1.3%
FCX
Freeport-McMoRan
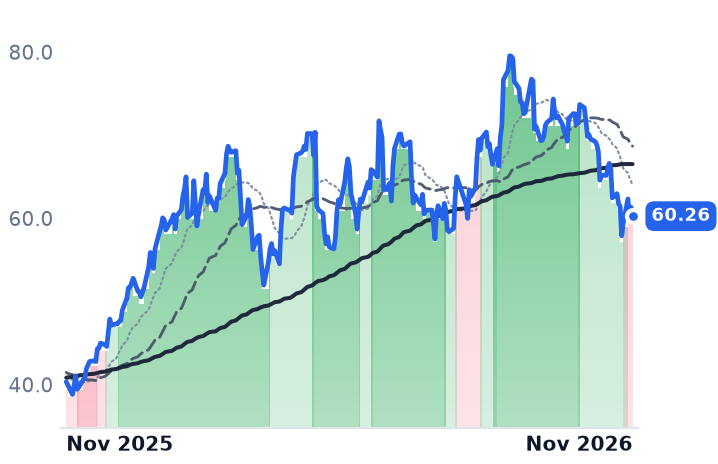
60.26
−1.09 (−1.78%)
vs. prior close
Price20d50d150d
FCX 12-month price
Diversified Resources
SCCO
Southern Copper
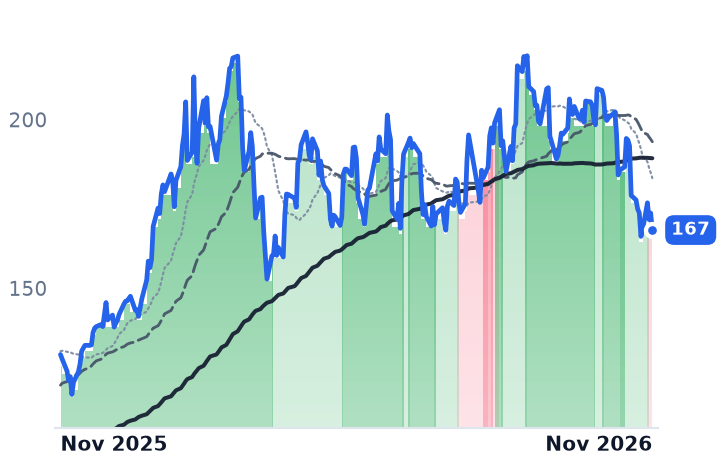
167
−5.04 (−2.93%)
vs. prior close
Price20d50d150d
SCCO 12-month price
Integrated Producers
TECK
Teck Resources
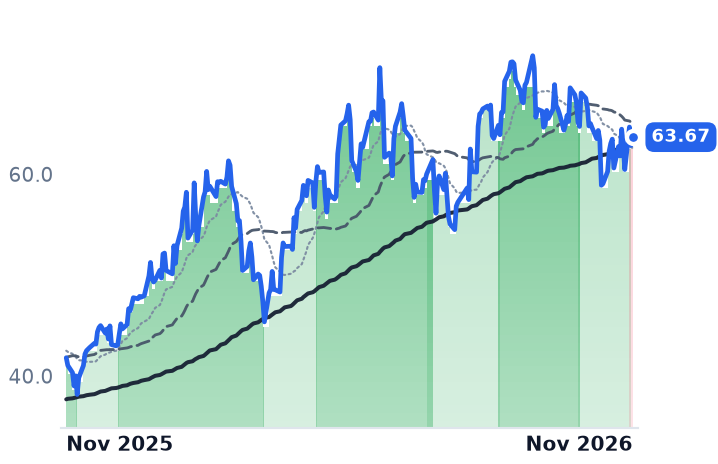
63.67
+0.82 (+1.30%)
vs. prior close
Price20d50d150d
TECK 12-month price
Diversified Resources
TickerMkt capP/EP/E fwdP/SP/S fwdP/GPP/GP fwdEV/EBITDAFCF yld
FCX$103.6B35.5x24.2x4.0x3.5x14.9x13.1x12.2x5.7%
SCCO$171.5B30.1x26.8x10.9x10.1x17.4x16.2x17.6x3.5%
TECK$33.1B19.1x11.4x3.4x2.2x9.7x6.3x7.9x3.2%
ERO
Ero Copper
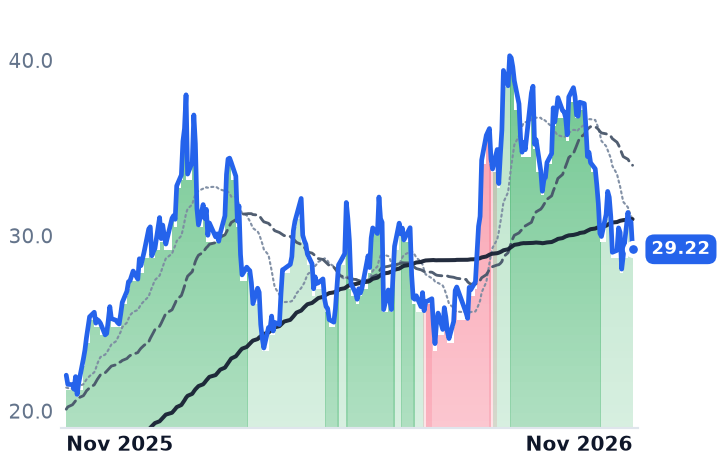
29.22
−1.57 (−5.08%)
vs. prior close
Price20d50d150d
ERO 12-month price
Focused Miners
HBM
Hudbay Minerals
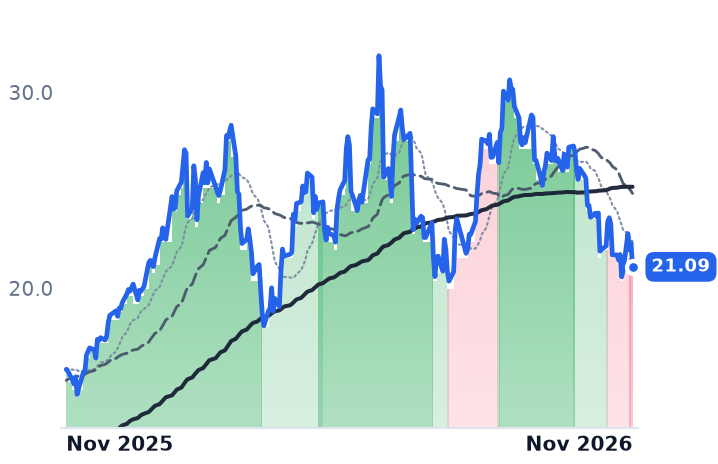
21.09
−1.22 (−5.46%)
vs. prior close
Price20d50d150d
HBM 12-month price
Polymetallic Miners
PRY.MI
Prysmian S.p.A
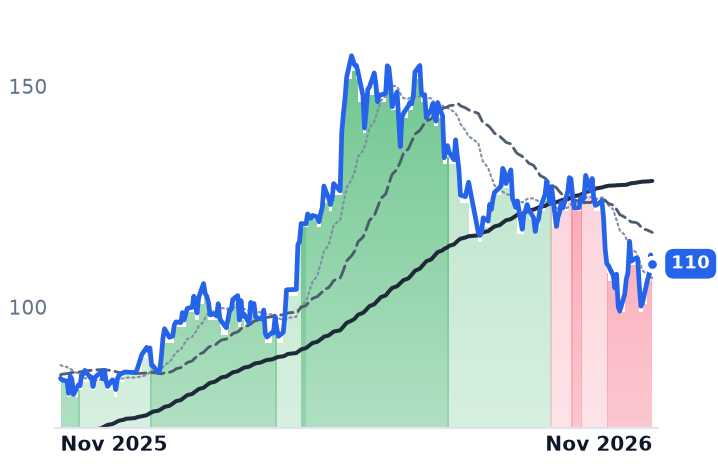
110
−2.00 (−1.79%)
vs. prior close
Price20d50d150d
PRY.MI 12-month price
Electrical Equipment & Parts
TickerMkt capP/EP/E fwdP/SP/S fwdP/GPP/GP fwdEV/EBITDAFCF yld
ERO$3.5B11.3x8.7x3.4x2.8x7.9x6.6x7.0x4.4%
HBM$13.4B17.8x20.0x5.4x4.6x13.8x11.7x8.1x1.8%
PRY.MI$37.9B27.3x27.0x1.8x1.7x6.7x6.3x15.3x2.6%
NEX.PA
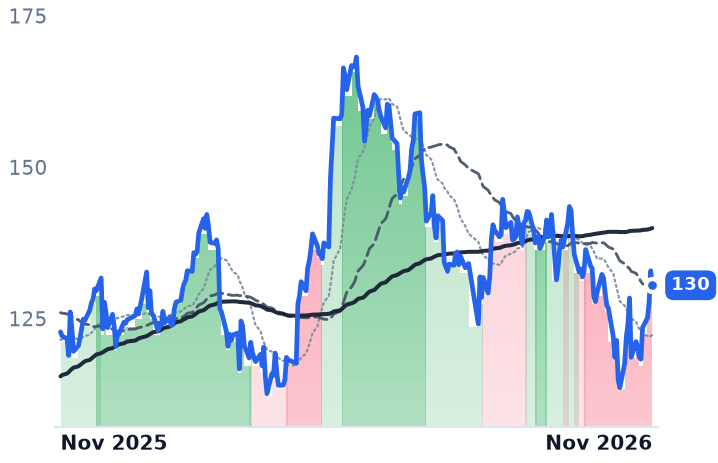
Nexans
130
−2.40 (−1.81%)
vs. prior close
Price20d50d150d
NEX.PA 12-month price
Electrical Equipment & Parts
NKT.CO
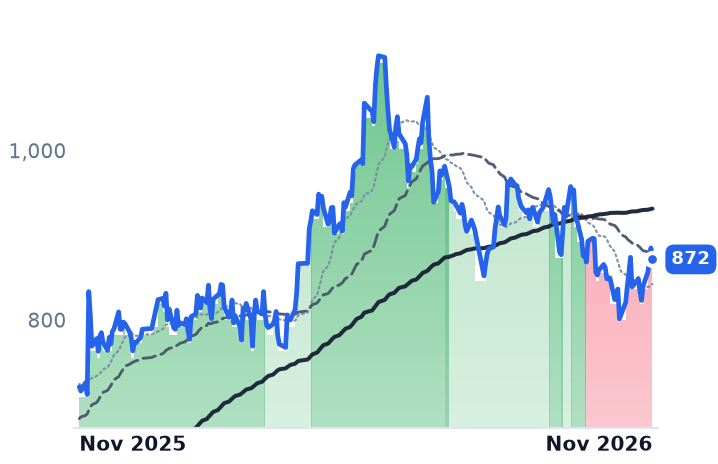
NKT A/S
872
−13.50 (−1.53%)
vs. prior close
Price20d50d150d
NKT.CO 12-month price
Electrical Equipment & Parts
TickerMkt capP/EP/E fwdP/SP/S fwdP/GPP/GP fwdEV/EBITDAFCF yld
NEX.PA$6.0B71.4x18.4x0.8x0.7x7.8x7.5x12.4x4.7%
NKT.CO$47.7B23.9x—1.8x—8.8x—20.4x-10.0%

Consensus projections

TickerFY2026EFY2027EFY2028E
APDRevenue+6.1%+6.2%+6.7%
EPS+12.2%+6.9%+7.9%
LINRevenue+7.9%+4.6%+5.6%
EPS+9.0%+9.1%+10.1%
AI.PARevenue+5.0%+4.6%+4.6%
EPS+11.3%+11.2%+10.0%
FCXRevenue+15.7%+20.0%+3.0%
EPS+91.4%+35.7%+14.0%
SCCORevenue+29.2%−4.2%−0.8%
EPS+50.0%−6.3%−4.4%
TECKRevenue+41.4%−0.1%−15.4%
EPS+128.4%−14.7%−25.6%
ERORevenue+59.9%+9.5%−4.0%
EPS+74.0%+20.4%−3.4%
HBMRevenue+31.3%+16.1%−1.2%
EPS+78.4%+29.2%−2.1%
PRY.MIRevenue+15.2%+13.5%+8.0%
EPS+17.8%+30.6%+18.9%
NEX.PARevenue+13.8%+7.9%+8.9%
EPS−10.7%+27.8%+18.8%
NKT.CORevenue+3.6%+17.6%+13.6%
EPS+3.3%+32.1%+44.1%

Forward fiscal years only. Blank means no analyst coverage for that year.

Air Products closed its fiscal year with a project backlog that is now mostly semiconductor work, the result of a deliberate swap. The Allentown, Pennsylvania supplier of oxygen, nitrogen, hydrogen, helium and ultra-high-purity electronics gases spent the year cancelling the green-hydrogen complexes its prior management had committed capital to, and signing on-site plants next to chip fabs in their place.

That swap matters beyond the write-off, because the whole "AI needs physical inputs" complex is bought as one trade and paid on incompatible terms. In the first week of November, after US midterm ballot measures curtailing data-center construction, the Nasdaq 100 fell 4.5% and copper repriced with it: Southern Copper is down 19.1% over 30 days and Freeport-McMoRan 16.1%. Air Products rose 9.4% over the same stretch and Linde 7.5%. Metal reprices on a demand forecast; a gas plant built inside a customer's fenceline is paid on a signed contract, with power and feedstock rebilled.

Nine of the twelve points were volume

September-quarter revenue was $3.556bn, up 12.3% and the fastest growth of the fiscal year, against 4.6% in the June quarter. Nine percentage points came from volume, with one point each from price, energy cost pass-through and currency, and quarterly adjusted earnings of $3.61 a share rose 6%. Full-year revenue reached $12.991bn, up 7.9%, with gross profit up 8.5%.

The backlog behind that is where the company has changed. Industrial-gas projects under contract stood at about $3.3bn at year-end, up from $3.0bn three months earlier, with $2.6bn of it electronics and space after more than $2.0bn of electronics wins in twelve months. The pipeline still under evaluation exceeds $4.0bn.

What $2.9bn of cancelled hydrogen bought

The cost of getting there sits in one quarter. Air Products said on 30 June 2026 it would not proceed with the Louisiana Clean Energy Complex, taking a pre-tax charge not exceeding $2.9bn; the June quarter carries a GAAP operating loss of $2.097bn, which is why the full year shows an operating loss of $40.9m on growing gross profit, and why a trailing price/earnings ratio of 132x says nothing about the business. A planned green liquid hydrogen plant at Massena, New York was cancelled too, the Jiutai gasification stake was sold for more than $250m, and NEOM in Saudi Arabia is construction-complete and entering commissioning, with full operation expected in the second half of 2027 and no material contribution to fiscal 2027.

Capital spending is guided to $3.0-$3.5bn next year, against a legacy run-rate near $5bn, with over $1bn of it going to traditional industrial-gas projects. "The effort that we did as a company to reduce our CapEx was one of the things that I'm most proud of our performance in '26," chief executive Eduardo Menezes told investors on 5 November, adding that "our goal long term is to have a backlog in the range of $4 billion to $4.5 billion."

The 2027 guide is slower, and says why

Fiscal 2027 adjusted earnings are guided to $14.15-$14.50 a share, up 5-8% against the 12% just delivered, built on roughly 2% base volume growth plus 3% from new assets starting up. Management disclosed the offsets: equity affiliate income flat after a 14% gain, a tax rate rising to 19%, and higher interest expense on projects no longer capitalized, together about two points of earnings. Chief financial officer Melissa Schaeffer flagged a further drag from a switch to average-cost inventory accounting for helium: "this will create a modest headwind in FY '27...but it's not a cash headwind. Purely an accounting." No buyback is assumed.

Linde is doing the same thing on a bigger book

The fab demand is visible at the larger rival. Linde's September quarter brought revenue of $9.404bn, up 9.2%, and record adjusted earnings of $4.59 a share with electronics up 15%, on a backlog of $11bn of which $7.9bn is sale-of-gas, and roughly $2bn of electronics plants under construction in the US, Korea and China with staggered start-ups over two to three years. Its own quarter was not clean: GAAP operating income fell 8.2% on a $425m restructuring charge, and chief executive Sanjiv Lamba said of Europe on 29 October, "There is absolutely no catalyst."

The discount is paid for in cash

Air Products trades at 22.0x forward earnings and 16.4x forward gross profit, against Linde at 29.4x and 17.7x. The relative position has flipped: in August the same gross-profit meter read 16.8x for Air Products against Linde's 13.9x, a 21% premium; it now reads 17.2x against 17.9x. Both multiples have expanded since early October, when Air Products stood at 19.2x forward and Linde at 26.8x, with estimates little changed.

The cash explains the gap. Air Products' trailing free-cash-flow yield is 0.68% against Linde's 2.10%, and the first positive free-cash year is a fiscal 2027 guide, not a result.

So the results account for the twelve-month advance and most of the recent one: volume-led growth, a contracted book growing toward management's own target, a 15% headcount reduction since fiscal 2024 that captured $95m of savings, and capital spending cut by roughly a third. What they do not account for is the flat reaction to the print itself, when the shares fell 1.3% on 5 November and 1.5% the next day before recovering by 12 November. The likelier reading is that the market is still pricing the conversion of that backlog, and waiting for the cash to show up where the contracts say it should. Management, for its part, expects data-center demand to keep semiconductor requirements rising for the next five to six years.

What Air Products cannot do is set the pace. Major customer award decisions on its electronics and space pipeline are expected within twelve months, constrained by regulatory hurdles and labor availability. Those decisions belong to the fab owners.

The Stopgap Pentagon Budget Is Paying Incumbents' Old Programs and Freezing New Awards

Hypothesis Opus 5 · Research Opus 5 · Writing Opus 5 · Prompt v1.7

Federal technology contractors have started showing money arriving again — and almost all of it is landing on contracts they already hold. Leidos took funded backlog, the portion Congress has actually appropriated cash for, up 22% to $11.1bn in the September quarter while the total backlog it sits inside grew 4%; CACI posted its seventh double-digit quarter of funded-backlog growth in eight.

None of this is new appropriations. Agencies have run since 1 October on a stopgap holding the Pentagon near $838.5bn against a $1.5 trillion fiscal 2027 request, and CACI's own management called the award pace sluggish.

The market has split the group anyway. SAIC, whose order book ran 0.8x over the trailing year, re-rated from roughly 11.6x trailing earnings to 17.3x; Leidos, raising guidance three quarters running, de-rated to 11.6x.

LDOSCACISAICPSNBAHKBRGDNOCFederal IT ServicesDefense Budget AppropriationsFunded Backlog & RecompetesSignals Intelligence & EWVeterans Health ProgramsDefense Services Consolidation
TickerCompanySegmentTrend · 13mo30D1Y
The subject · what this brief is about
LDOSLeidosDefense & Government Services🔴 Cont. Bear+8.9%−31.9%
CACICACI InternationalDefense & Government Services🟢 Cont. Bull+5.7%+8.8%
SAICScience Applications InternationalDefense & Government Services🟢 Cont. Bull+12.7%+66.3%
Compared against · context, not the story
PSNParsonsDefense & Government Services🔴 Cont. Bear+14.1%−43.3%
BAHBooz Allen HamiltonGovernment & Policy Advisory🔴 Cont. Bear+17.3%+1.5%
KBRKBRDiversified Infrastructure🌱 Emerging Bull+1.6%−15.8%
GDGeneral DynamicsIntegrated Defense Contractors🟢 Cont. Bull+10.3%+4.9%
NOCNorthrop GrummanIntegrated Defense Contractors🔴 Cont. Bear+14.1%−1.2%

12-month price & trend

LDOS
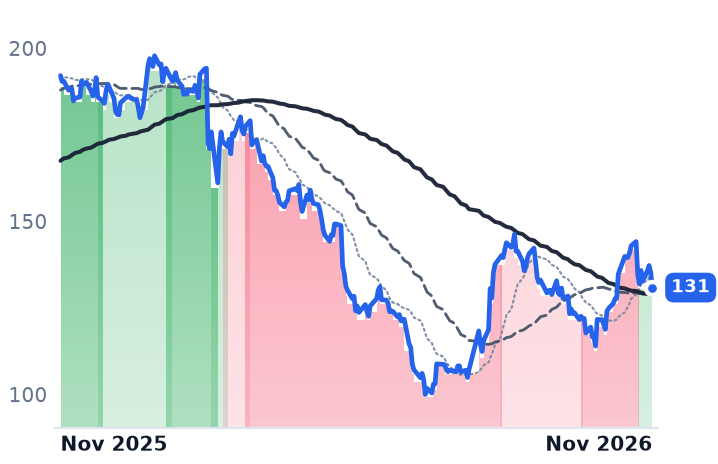
Leidos
131
−4.41 (−3.26%)
vs. prior close
Price20d50d150d
LDOS 12-month price
Defense & Government Services
CACI
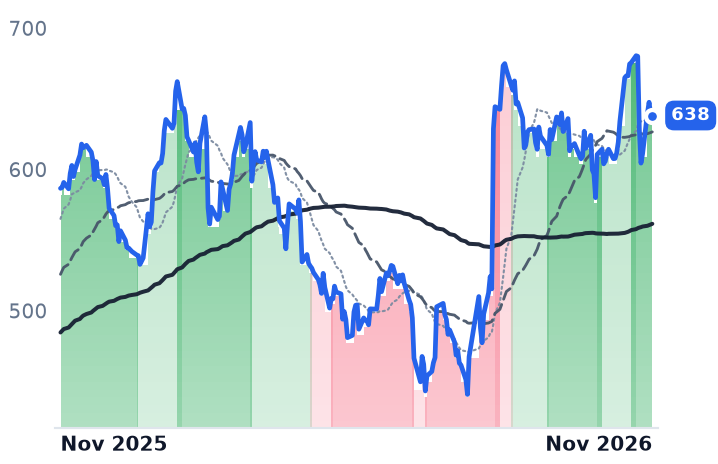
CACI International
638
−0.74 (−0.12%)
vs. prior close
Price20d50d150d
CACI 12-month price
Defense & Government Services
SAIC
Science Applications International
149
−2.92 (−1.92%)
vs. prior close
Price20d50d150d
SAIC 12-month price
Defense & Government Services
TickerMkt capP/EP/E fwdP/SP/S fwdP/GPP/GP fwdEV/EBITDAFCF yld
LDOS$15.9B11.6x10.4x0.9x0.9x5.2x5.1x9.2x12.3%
CACI$14.2B26.2x19.1x1.5x1.3x6.7x6.1x16.7x9.0%
SAIC$6.3B17.3x13.8x0.8x0.9x6.7x6.8x11.8x9.9%
PSN
Parsons
49.03
−1.79 (−3.53%)
vs. prior close
Price20d50d150d
PSN 12-month price
Defense & Government Services
BAH
Booz Allen Hamilton
84.92
−1.58 (−1.83%)
vs. prior close
Price20d50d150d
BAH 12-month price
Government & Policy Advisory
KBR
KBR
35.51
−2.52 (−6.63%)
vs. prior close
Price20d50d150d
KBR 12-month price
Diversified Infrastructure
TickerMkt capP/EP/E fwdP/SP/S fwdP/GPP/GP fwdEV/EBITDAFCF yld
PSN$5.3B36.0x20.2x0.8x0.8x3.8x3.8x13.9x7.8%
BAH$9.5B12.3x12.3x0.9x0.8x1.9x1.9x10.4x11.8%
KBR$4.9B11.8x9.8x0.6x0.6x4.4x4.2x8.8x7.0%
GD
General Dynamics
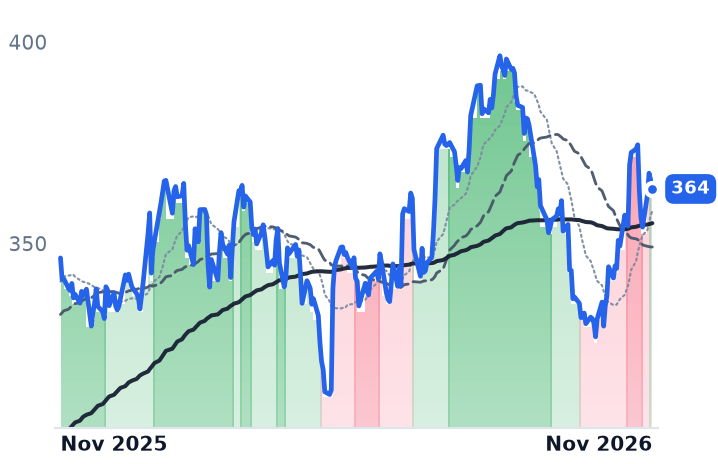
364
−2.14 (−0.59%)
vs. prior close
Price20d50d150d
GD 12-month price
Integrated Defense Contractors
NOC
Northrop Grumman
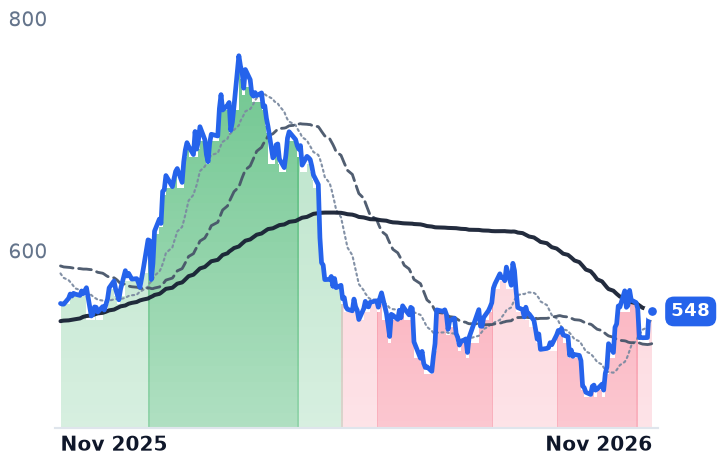
548
+1.39 (+0.25%)
vs. prior close
Price20d50d150d
NOC 12-month price
Integrated Defense Contractors
TickerMkt capP/EP/E fwdP/SP/S fwdP/GPP/GP fwdEV/EBITDAFCF yld
GD$90.5B20.1x19.7x1.7x1.6x10.7x10.5x14.3x7.1%
NOC$70.4B15.7x17.1x1.6x1.6x8.2x8.0x11.3x5.2%

Consensus projections

TickerFY2026EFY2027EFY2028E
LDOSRevenue+5.2%+4.9%+2.2%
EPS+17.1%+6.5%−6.2%
CACIRevenue+10.9%+13.1%+6.7%
EPS+14.2%+19.9%+13.5%
SAICRevenue−2.4%+0.4%+1.3%
EPS+15.3%+7.2%+6.2%
PSNRevenue−0.9%+4.8%+5.6%
EPS−23.3%+37.7%+11.8%
BAHRevenue−6.1%+0.7%+4.2%
EPS−4.3%+5.1%+5.1%
KBRRevenue+3.1%+2.6%+5.7%
EPS+17.3%+5.0%+1.8%
GDRevenue+7.7%+5.0%+4.4%
EPS+10.5%+9.5%+8.0%
NOCRevenue+5.3%+6.9%+6.2%
EPS+11.0%+5.0%+8.1%

Forward fiscal years only. Blank means no analyst coverage for that year.

The money reaching federal technology contractors this autumn is arriving on contracts they already hold. Leidos, which integrates national-security systems for the Pentagon, runs air-traffic systems for the Federal Aviation Administration and manages federal health programs, booked $5.5bn of net orders in its September quarter. Its funded backlog — the slice of contract value for which Congress has actually released cash — rose 22%, to $11.1bn. The total backlog those orders sit inside grew 4%.

That gap between funded and total is the autumn's real finding, and it has been read as something else. Shares in the group rose over the past 30 days: SAIC 12.7%, Leidos 8.9%, CACI 5.7%. A single session on 9 October carried much of it, and it was confined to the services names — Leidos up 6.7%, SAIC 7.2%, Booz Allen 7.0% — while the hardware primes General Dynamics and Northrop Grumman moved 1.4% and 0.2%. No company-specific catalyst for that day was discoverable; the likelier reading is rotation into the cheapest contractor valuations.

Seventy-two days of money that starts nothing

Agencies have been funded since 1 October by a continuing resolution running to 11 December at largely prior-year levels, which holds the Pentagon at roughly $838.5bn against the $1.5 trillion it requested for fiscal 2027. A stopgap increments programs already running. It does not start new ones. What the funded-backlog growth records, then, is incumbency money rather than an awards recovery — and CACI's management said as much, calling the award pace sluggish and naming the December deadline as a headwind inside guidance.

CACI's margin arrived with an acquisition attached

CACI, which builds signals-intelligence, cyber and electronic-warfare systems for defense and intelligence agencies, had the loudest quarter. "We won $4.8 billion in awards, producing a 2x book to bill for the quarter," chief executive John Mengucci told investors on 22 October. Chief financial officer Jeffrey MacLauchlan added that "funded backlog increased by 15% year over year… the seventh time in the last 8 quarters we have delivered double digit year over year growth in funded backlog." Earnings before interest, taxes, depreciation and amortization reached 13.3% of revenue against 11.7%, and firm-fixed-price work — where a productivity gain stays with the vendor — rose to 33% of revenue from 27%, about half of that from the ARKA acquisition. Revenue grew 8.2%; organic growth was 2.1%. The shares carry 16.65x trailing EV/EBITDA, the dearest of the three, on 3.5x pro-forma leverage, and a trailing price/earnings ratio of 26.2x that is unchanged from a year ago.

Leidos is cheap for a reason with a date on it

Leidos raised full-year adjusted earnings guidance to $12.50-$12.70 from $12.20-$12.50, the third consecutive quarter of increases, and its shares are still down 32% over twelve months while trailing earnings grew. The overhang is one contract: the Health segment shrank 12%, to $1.07bn, on volumes tied to the Veterans Benefits Administration disability-examination program, now in recompete. "We believe it's highly likely our existing contracts will be extended through the first half of 2027, in line with the customers' planned new contract start date of July 1, 2027," chief executive Thomas Bell said on 3 November; a customer decision is expected around April or May. At 11.6x trailing and 10.4x forward earnings, against roughly 18x trailing a year ago, that single recompete is most of the de-rating.

SAIC's order book never joined the recovery

SAIC sells engineering, information-technology modernization and systems sustainment almost entirely to US government customers, and it is the one name where the awards story does not hold. Net bookings of about $1.2bn in the July quarter produced a 0.6x book-to-bill, with 0.8x over the trailing twelve months, against Leidos's 1.1x. It lost the RITS enterprise-information-technology recompete, worth about 350 basis points of second-half revenue, and the $1.4bn CASTLE-NET order went to Accenture Federal Services. "Our recompete win rate of over 90% this quarter creates an easier path to on-contract growth," chief executive James Reagan told investors on 31 August — a defense of retention, which is a different thing from winning new sockets. Reported revenue did inflect, up 6.3% in the quarter, but net income fell 19.7%.

The funding went one way and the valuations went another

The quarters account for the direction of the group and almost none of its ranking. Where Congress released cash — Leidos and CACI — the business improved measurably, and where the order book stayed under 1.0x, it did not. The market inverted that. SAIC's shares have gained 65% over twelve months, nearly all of it a move from about 11.6x trailing earnings to 17.3x, while consensus models fiscal 2027 revenue of $7.30bn against $7.26bn, growth of 0.6%. CACI, improving fastest in absolute terms, is priced for it: its 19.1x forward multiple needs roughly 40% earnings growth off a 2.1% organic base. Leidos, with the best conversion of funded dollars into revenue in the group, is the cheapest, because its problem has a hearing date rather than an open-ended one.

SAIC reports its third quarter around 3 December, a date the company has not confirmed. Whatever that print says about bookings, it lands eight days before the money underneath the whole group stops.

Only nVent Has Disclosed Slowing Data-Center Orders; Its Two Grid Peers' Backlogs Grew

Hypothesis Opus 5 · Research Opus 5 · Writing Opus 5 · Prompt v1.7

Three US-listed makers of the switchgear, transformers and enclosures a data center cannot be energized without were marked down together after the November midterms, and only one of them had already told investors its order book was cooling. nVent's organic orders grew low double digits in the September quarter, against roughly 40% in the March quarter, and its gross margin fell 161 basis points to 35.8% even as revenue rose 44% organically and it raised full-year adjusted earnings guidance to $5.36-$5.39 a share.

The other two books went the other way: Powell's backlog reached $2.4bn, up 69%, and GE Vernova's Electrification equipment backlog hit $42bn, up 60%. The split has a cause in how long each book is. nVent ships in about five months, so its orders read the present; Powell's book is roughly two years of revenue at prices fixed when each order was signed, which is why its gross margin sat flat at 30.6% through a record order quarter.

POWLGEVNVTETNHUBBAMSCESEData-Center ElectrificationSwitchgear & TransformersGrid Equipment BacklogsAI Power DemandEngineered-To-Order MarginsData-Center Siting Pushback
TickerCompanySegmentTrend · 13mo30D1Y
The subject · what this brief is about
POWLPowell IndustriesPower Distribution Systems🔴 Cont. Bear−20.8%+20.7%
GEVGE VernovaPower Generation & Propulsion⚠️ Emerging Bear−16.7%+43.3%
NVTnVent ElectricPower Distribution Systems🟢 Cont. Bull−28.9%+2.2%
Compared against · context, not the story
ETNEatonPower Distribution Systems🟢 Cont. Bull−14.8%−2.1%
HUBBHubbell IncorporatedPower Distribution Systems🔴 Cont. Bear−5.3%−1.5%
AMSCAmerican SuperconductorPower Distribution Systems🔴 Cont. Bear−13.4%−29.0%
ESEESCO TechnologiesSpecialty Systems & Components⚠️ Emerging Bear−7.3%+8.3%

12-month price & trend

POWL
Powell Industries
143
−2.73 (−1.87%)
vs. prior close
Price20d50d150d
POWL 12-month price
Power Distribution Systems
GEV
GE Vernova
823
+14.77 (+1.83%)
vs. prior close
Price20d50d150d
GEV 12-month price
Power Generation & Propulsion
NVT
nVent Electric
114
−3.50 (−2.99%)
vs. prior close
Price20d50d150d
NVT 12-month price
Power Distribution Systems
TickerMkt capP/EP/E fwdP/SP/S fwdP/GPP/GP fwdEV/EBITDAFCF yld
POWL$5.2B27.2x20.8x4.5x3.5x15.0x11.5x18.4x4.7%
GEV$218.7B21.5x26.1x5.0x4.7x22.9x21.4x19.8x7.8%
NVT$18.8B27.7x21.6x3.6x3.3x9.7x8.9x17.0x3.4%
ETN
Eaton
361
+6.40 (+1.81%)
vs. prior close
Price20d50d150d
ETN 12-month price
Power Distribution Systems
HUBB
Hubbell Incorporated
443
+5.69 (+1.30%)
vs. prior close
Price20d50d150d
HUBB 12-month price
Power Distribution Systems
AMSC
American Superconductor
24.98
−0.91 (−3.51%)
vs. prior close
Price20d50d150d
AMSC 12-month price
Power Distribution Systems
TickerMkt capP/EP/E fwdP/SP/S fwdP/GPP/GP fwdEV/EBITDAFCF yld
ETN$132.7B34.1x24.9x4.1x3.9x11.8x11.3x23.8x3.3%
HUBB$22.7B25.1x20.9x3.4x3.3x9.7x9.3x17.3x4.1%
AMSC$1.5B9.7x34.2x4.5x4.0x16.1x14.0x45.2x1.4%
ESE
ESCO Technologies
238
−2.59 (−1.08%)
vs. prior close
Price20d50d150d
ESE 12-month price
Specialty Systems & Components
TickerMkt capP/EP/E fwdP/SP/S fwdP/GPP/GP fwdEV/EBITDAFCF yld
ESE$7.1B22.6x29.8x5.5x4.6x13.1x10.9x25.7x2.8%

Consensus projections

TickerFY2026EFY2027EFY2028E
POWLRevenue+8.8%+25.8%+14.4%
EPS+12.1%+27.8%+19.8%
GEVRevenue+25.9%+14.1%+15.7%
EPS+335.1%−18.6%+38.8%
NVTRevenue+51.0%+30.6%+14.3%
EPS+61.3%+30.2%+20.4%
ETNRevenue+22.4%+11.6%+10.4%
EPS+13.9%+18.9%+16.8%
HUBBRevenue+18.5%+11.2%+6.3%
EPS+13.2%+11.9%+11.8%
AMSCRevenue+36.2%+24.9%+14.6%
EPS+470.9%−74.6%+46.7%
ESERevenue+17.8%+18.4%+11.9%
EPS+43.0%+10.4%+15.1%

Forward fiscal years only. Blank means no analyst coverage for that year.

The companies that make the switchgear, transformers and enclosures an AI data center needs before it can be energized lost between a sixth and a quarter of their value in the two weeks after 3 November. Only one of the three had already told investors its orders were cooling. nVent Electric, which sells electrical enclosures, server-rack infrastructure and heat tracing under the HOFFMAN, SCHROFF and RAYCHEM brands, disclosed in late October that organic orders grew only low double digits in the September quarter, against roughly 40% in the March quarter and about 65% a year earlier.

The markdown treated all three as one bet on AI power demand, after restrictions won 46 of 47 data-center ballot measures on 3 November and SoftBank on 10 November wrote down $3.7bn of data-center projects, including $2.85bn of non-refundable advances already paid to equipment companies. What a single bet obscures is that these three books convert at completely different speeds, and the contested capacity sits in 2028: Nomura's post-midterm read is that 2027 construction schedules are largely locked and that moratoria push back 2028 starts.

The five-month book is the one that moved

nVent's backlog of $2.6bn is about five months of shipments at the September quarter's $1.515bn of revenue, so its orders are a present-tense reading. That quarter was strong by every reported measure: revenue up 44% organically, return on sales of 22.1%, and full-year adjusted earnings guidance raised to $5.36-$5.39 a share from $5.00-$5.10. Underneath it, gross margin fell 161 basis points to 35.8% while operating margin rose 286 basis points, which is scale offsetting price and mix, not pricing power widening. Infrastructure is now 60% of year-to-date sales against 45% in 2025. "We expect the infrastructure vertical to deliver record double-digit organic growth this year with data center expansion, and the need for power," chief executive Beth Wozniak said on 30 October. At 21.6x this year's consensus earnings, against roughly 30x forward in May, the de-rating is doing rational work.

Powell books the price, then waits two years

Powell Industries, a Houston maker of custom switchgear and modular E-House substations, recognizes engineered-to-order work over time at prices fixed when the order was signed. Its backlog reached $2.4bn at 30 June, up 69%, on bookings of $934.2m against $311.7m of revenue. Chairman and chief executive Brett Cope said the quarter "elevated our backlog to over $2 billion for the first time in our 79-year history." Gross margin was 30.57%, versus 30.70% a year earlier. That is the mechanism in one line: a record order book and no incremental margin, because the margin was set at signing. The $2.4bn is roughly 2.1 years of revenue at the trailing rate. Powell trades at 20.8x fiscal 2027 consensus earnings and 27.2x trailing, against the 35x forward and 58x trailing flagged in May.

Vintage, not volume, at GE Vernova

GE Vernova's third-quarter orders rose 96% organically to $29bn and backlog reached $197bn, with Electrification equipment backlog at $42bn, up 60%, and segment margin up 470 basis points to 19.1%. The company attributes the improvement to "favorable price and disciplined underwriting" as older work rolls off. Yet its Electrification orders themselves fell 9% organically to $5.4bn against a prior-year synchronous-condenser comparison, with book-to-bill near 1.4x, and chief executive Scott Strazik told investors on 28 October that gas turbine orders and slot reservations have slowed while the company takes reservations for 2032 delivery. Revenue growth accelerated across the year to 27%; the shares fell 18% in 30 days. On 2027 consensus earnings the multiple is about 31.9x, against the roughly 50x Rajiv Jain called unsustainable in July.

All three peaked on 3 November and gave up most of the decline in the two sessions of 4-5 November. Over twelve months GE Vernova is still up 43% and Powell 21%, while nVent has given back its year at up 1.9%. Eaton fell 14.8% over the same 30 days and Hubbell 5.3%, so the three carried the group's move.

The quarters account for one of the three declines. nVent's own disclosures show the deceleration its risk list anticipated, and its short book means a 2028 slowdown reaches it fast. For Powell and GE Vernova the next several quarters of revenue are already contracted at prices set before any of this, and the physical queue has not loosened: large power transformers still run 30 to 36 months and 38kV switchgear 78 to 104 weeks, with roughly $1.8bn of announced North American transformer capacity not operating until 2028. The exposure the ballot measures created and the cash SoftBank wrote off belong to the same window, the one past the contracted book.

Powell's September-quarter numbers do not exist yet. The company said on 3 November it would report fiscal fourth-quarter results after the close on 16 November, which makes it the first of the three to describe an order book assembled before the vote to a market that has already decided what the vote meant.

Building AI Racks Pays Sanmina Better Than Designing Them Pays Celestica

Hypothesis Opus 5 · Research Opus 5 · Writing Opus 5 · Prompt v1.7

Assembling racks for the AI buildout is supposed to be thin work: the customer's silicon, memory and power gear book as the builder's own revenue at little markup, so the top line multiplies while gross profit barely moves. On the latest quarters that describes one of these companies and not the other two.

Sanmina, which paid Advanced Micro Devices $2.55bn for ZT Systems' factories, lifted gross margin to 11.3% of revenue from 9.1% as rack volume scaled, and guided fiscal 2027 revenue to $17.5-19.5bn. Celestica, which designs what it builds, saw gross margin fall to 11.0% from 13.0% on 82.5% revenue growth, and discloses three customers at 66% of revenue combined. Jabil's gross line was flat.

The one-month markdown hit all six names in the group by 15% to 28% regardless.

SANMCLSJBLFLEXPLXSBHEAMDAI Rack AssemblyHyperscaler CapexMemory PricingCustomer Concentration RiskAI Accelerator Supply Chain
TickerCompanySegmentTrend · 13mo30D1Y
The subject · what this brief is about
SANMSanminaContract Manufacturing🟢 Cont. Bull−22.5%−5.7%
CLSCelesticaContract Manufacturing⚠️ Emerging Bear−25.3%−24.5%
JBLJabilContract Manufacturing⚠️ Emerging Bear−16.6%+21.0%
Compared against · context, not the story
FLEXFlexContract Manufacturing⚠️ Emerging Bear−28.1%+25.8%
PLXSPlexusOther🟢 Cont. Bull−16.7%+44.9%
BHEBenchmark ElectronicsContract Manufacturing🟢 Cont. Bull−15.5%+45.8%
AMDAdvanced Micro DevicesProcessors & Accelerators🟢 Cont. Bull−10.8%+105.2%

12-month price & trend

SANM
Sanmina
160
−0.70 (−0.43%)
vs. prior close
Price20d50d150d
SANM 12-month price
Contract Manufacturing
CLS
Celestica
253
+18.11 (+7.72%)
vs. prior close
Price20d50d150d
CLS 12-month price
Contract Manufacturing
JBL
Jabil
259
+0.24 (+0.09%)
vs. prior close
Price20d50d150d
JBL 12-month price
Contract Manufacturing
TickerMkt capP/EP/E fwdP/SP/S fwdP/GPP/GP fwdEV/EBITDAFCF yld
SANM$8.6B22.9x9.5x0.6x0.5x6.1x4.8x10.3x6.3%
CLS$31.9B23.6x22.2x1.7x1.5x15.3x13.5x16.8x1.7%
JBL$26.6B26.2x14.6x0.7x0.6x8.0x6.5x12.8x5.2%
FLEX
Flex
79.16
+3.07 (+4.03%)
vs. prior close
Price20d50d150d
FLEX 12-month price
Contract Manufacturing
PLXS
Plexus
212
+6.74 (+3.28%)
vs. prior close
Price20d50d150d
PLXS 12-month price
Other
BHE
Benchmark Electronics
65.50
+1.86 (+2.92%)
vs. prior close
Price20d50d150d
BHE 12-month price
Contract Manufacturing
TickerMkt capP/EP/E fwdP/SP/S fwdP/GPP/GP fwdEV/EBITDAFCF yld
FLEX$28.9B28.2x15.6x0.9x0.8x9.7x8.5x14.8x3.6%
PLXS$5.5B27.1x19.1x1.1x0.9x10.9x9.2x17.1x-0.5%
BHE$2.3B40.6x20.8x0.8x0.7x7.4x7.1x14.9x5.1%
AMD
Advanced Micro Devices
531
+15.98 (+3.10%)
vs. prior close
Price20d50d150d
AMD 12-month price
Processors & Accelerators
TickerMkt capP/EP/E fwdP/SP/S fwdP/GPP/GP fwdEV/EBITDAFCF yld
AMD$1.0T156.2x80.7x24.3x19.7x45.7x37.0x93.6x0.8%

Consensus projections

TickerFY2026EFY2027EFY2028E
SANMRevenue+74.9%+30.7%+19.7%
EPS+103.5%+39.0%+18.5%
CLSRevenue+67.7%+91.4%+40.9%
EPS+90.1%+92.3%+43.7%
JBLRevenue+20.3%+27.7%+15.5%
EPS+36.0%+38.5%+24.7%
FLEXRevenue+6.8%+29.5%+30.6%
EPS+24.2%+54.8%+54.1%
PLXSRevenue+21.6%+19.8%+9.0%
EPS+21.0%+23.8%+14.4%
BHERevenue+16.2%+8.0%+5.0%
EPS+30.6%+13.5%+10.7%
AMDRevenue+49.4%+75.5%+37.7%
EPS+92.6%+108.1%+44.1%

Forward fiscal years only. Blank means no analyst coverage for that year.

The contract manufacturer that bought Advanced Micro Devices' server-assembly plants reported on 9 November that its heaviest quarter of rack output was also its richest. Sanmina, a San Jose builder of electronics for industrial, medical, defense, telecom and cloud customers, converted 11.3% of revenue into gross profit in the quarter ended 3 October, against 9.1% a year earlier, while revenue grew 84%.

That is not how assembly work for the AI buildout is supposed to behave. A manufacturing contract books the customer's bought-in processors, memory and power equipment as the vendor's own revenue at thin or no markup, so revenue per rack can multiply while gross profit per rack barely stirs. Memory makes the inflation vivid: conventional DRAM contract prices rose roughly 90-95% in the first quarter of 2026 as makers shifted wafers to high-bandwidth memory for accelerators. Each rack shipped now carries a far larger bill of materials. The mechanism is real; it simply does not describe every company doing the work.

Sanmina bought the build and left the design with AMD

Sanmina paid AMD $2.55bn in cash for ZT Systems' manufacturing arm while the chipmaker kept the design business, so it competes for build volume rather than design content. Those plants contributed $884m of the $3.08bn Integrated Manufacturing Solutions segment last quarter, while the legacy factories in that segment grew 13.8% to $2.2bn. Derived from the reported lines, each incremental revenue dollar carried about 13.9 cents of gross profit, above the company's own 11.3% average, and still above it after stripping a disclosed one-time $30m tariff recovery.

"Non-GAAP operating margin expanded from 5.7% operating margin to 7.4% operating margin year-over-year," chairman and chief executive Jure Sola told investors on 9 November, on fiscal 2026 revenue of $14.53bn. Management then guided fiscal 2027 revenue to $17.5-19.5bn with operating margin of 7.0-7.5%, flat at the midpoint against what it just delivered. The gross line is rising; the line below it is guided sideways.

Celestica designs the racks and keeps less of each new dollar

Celestica, the Toronto company that designs and builds switches, optical interconnect, servers and storage for hyperscalers, grew revenue 82.5% to $5.83bn in its September quarter and saw gross margin fall to 11.0% from 13.0%. The incremental dollar carried 8.5 cents of gross profit, well under the average dollar. Hardware Platform Solutions, the design-led line, reached $2.3bn and grew 70%, slower than the 102% growth of the segment containing it, so design content is shrinking as a share of mix even while it expands.

Management guides 2027 gross margins "in the low 11s" with operating margin of 9.0% reached through operating leverage, which concedes that the new revenue arrives at roughly today's gross margin. Celestica's 10-Q for the quarter discloses three customers at 35%, 17% and 14% of revenue. It cut 2026 free-cash-flow guidance to $460m from $600m, set 2027 capital spending at $1.5-2.0bn, and told investors 2027 would be a net use of cash.

The split has an arithmetic cause. Rack work landing near 11% of revenue dilutes a book that was earning 13% and lifts one that troughed at 7.6% in the December 2025 quarter.

Jabil moved the line below the gross line

Jabil's August quarter held gross margin at 9.4% against 9.5%, while operating margin expanded to 5.7% from 4.1%. It guides fiscal 2027 revenue of $44.5bn with AI-related revenue of $22.1bn, up from $14.4bn, and roughly $18.9bn of the group, about 42%, sitting in automotive, healthcare, energy and devices. "Most of our AI business supports everyday AI usage rather than frontier model training," Matt Crowley, president of its Intelligent Infrastructure segment, said on 30 September. Inventory days ran at 64 against a 55-60 target, the one disclosed figure in the group supporting the pre-bought-material story.

The markdown did not read any of this

Over the 30 days to 12 November the six-name group fell between 15.5% and 28.1%, and the deepest fall belonged to Flex, whose own 10-Q reported gross margin up 60 basis points to 9.6%. The 5 November session was the biggest technology selloff since the Covid crash, two days after voters backed candidates and measures curbing US data-center construction; Celestica fell 12.66% that day with no company announcement, its most recent update having beaten and raised. All three have rebounded since, Sanmina 22.9% and Celestica 22.8% in five sessions.

So the quarters account for almost none of the move. On the same forward year, Sanmina trades at 9.5 times consensus earnings, Celestica at 11.6 and Jabil at 14.6, and each dollar of Sanmina's trailing gross profit costs $6.15 against $15.25 at Celestica, down from roughly $26 in May. The only disclosed deterioration anywhere in the group is Celestica's gross margin and its cash guidance, and that company is the one the market had re-rated hardest first. Where the business actually improved, the repricing was indiscriminate.

Sanmina's flagship program is barely under way. "We've now begun to ship the Helios product, albeit in small quantities," chief financial officer Jonathan Faust said on 9 November, of the AMD rack platform the whole acquisition was built around. The margin it reported last quarter was earned before that volume arrived.