

Moody's Leans on Bond-Deal Fees Twice as Heavily as S&P Global, and Those Fees Fell 5%
Hypothesis Opus 5 · Research Opus 5 · Writing Opus 5 · Prompt v1.7
Both rating agencies collect two kinds of money: a one-time fee set by someone else's deal size, and surveillance and subscription revenue that bills whether or not a bond prices. In the September quarter the one-time half shrank at Moody's, to $714m from $753m, while S&P Global held its equivalent roughly flat.
The difference is proportion. That transaction line is about 35% of Moody's group revenue and only 18% of S&P Global's, which also owns a $554m-a-quarter index business growing 20% on record exchange-traded fund assets that Moody's has no equivalent of.
Moody's reported 0.8% revenue growth, missed on adjusted earnings and only reaffirmed its outlook, yet trades at 30.2x forward earnings against S&P Global's 26.2x after two guidance raises. And the growth left in the fee meter comes from the AI borrowers investors spent October selling.
| Ticker | Company | Segment | Trend · 13mo | 30D | 1Y |
|---|---|---|---|---|---|
| The subject · what this brief is about | |||||
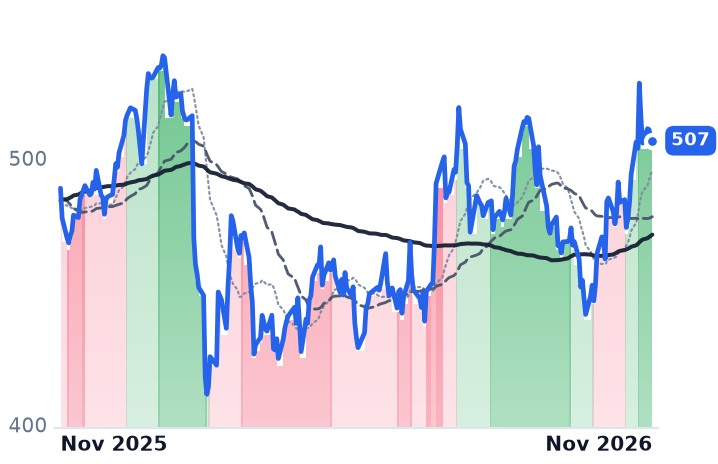
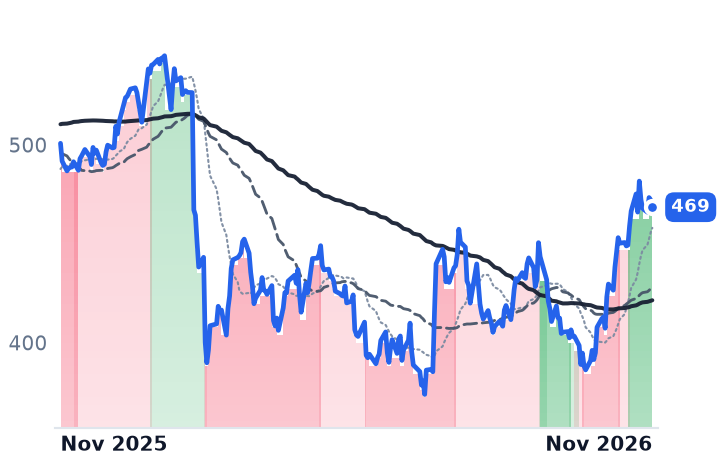
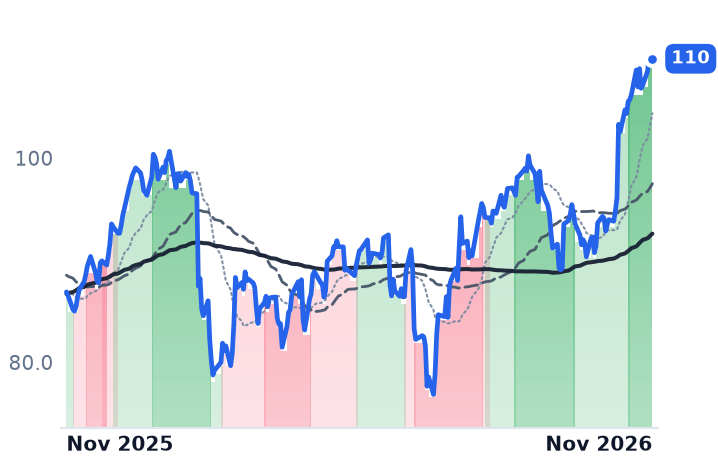
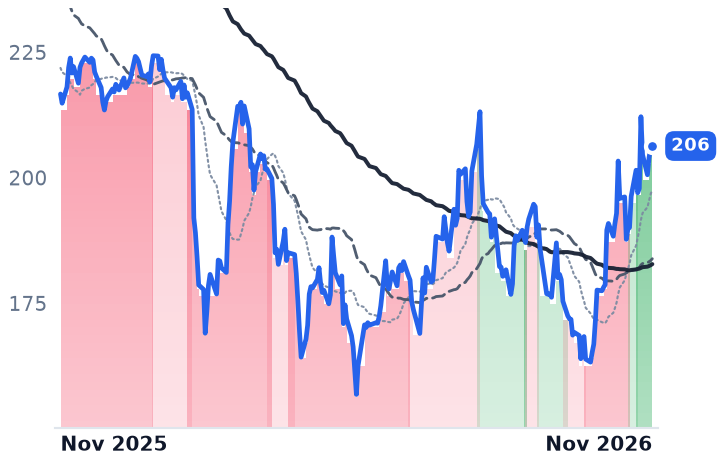
MCO | Moody's | Credit Ratings | 🌱 Emerging Bull | +9.6% | +3.6% |
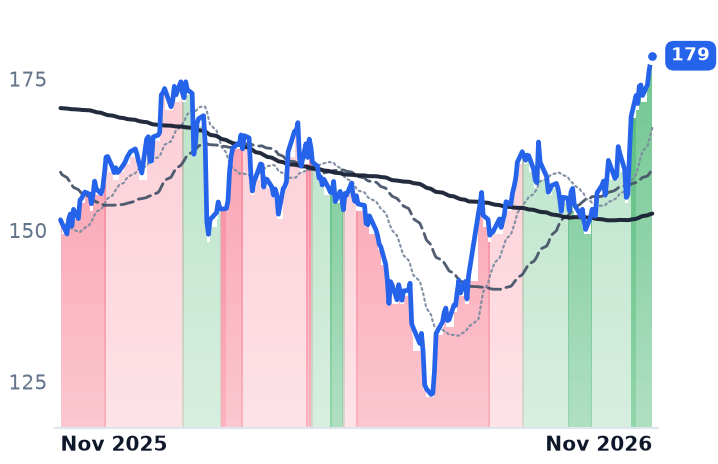
SPGI | S&P Global | Credit Ratings | 🌱 Emerging Bull | +15.0% | −6.4% |
| Compared against · context, not the story | |||||
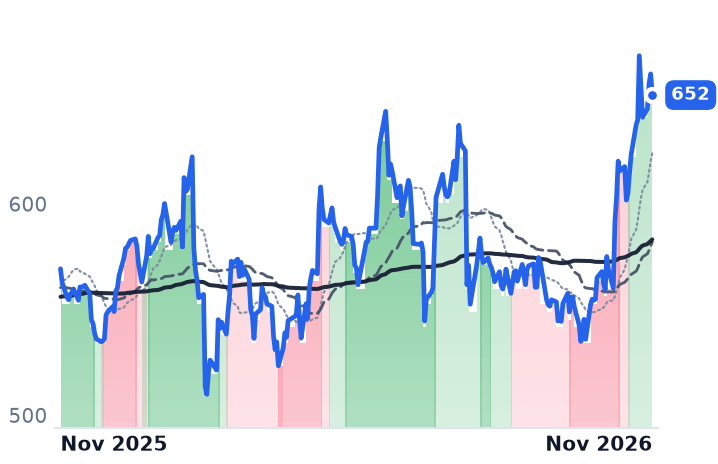
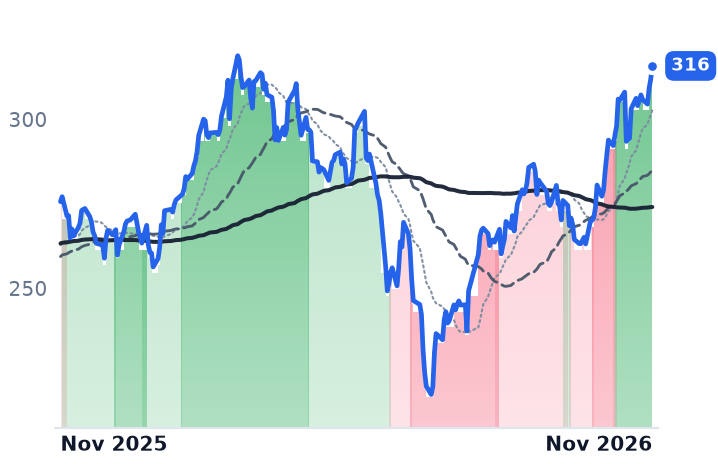
MSCI | MSCI | Investment Intelligence | ⚠️ Emerging Bear | +16.5% | +14.4% |
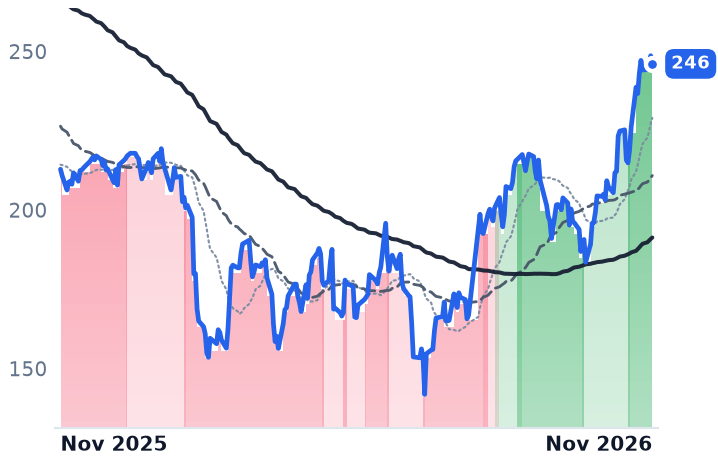
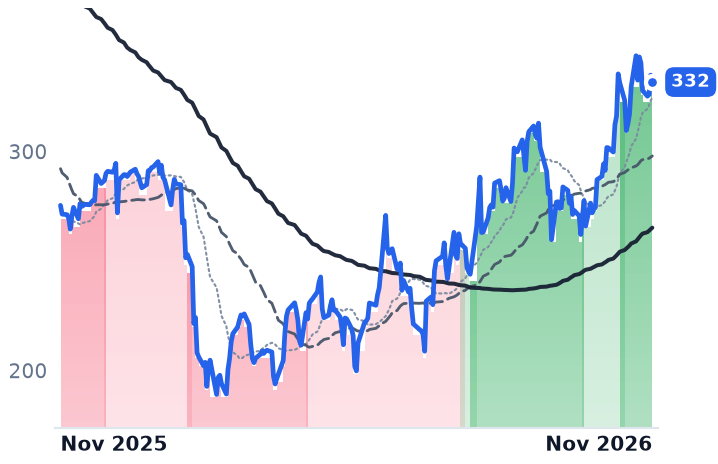
MORN | Morningstar | Investment Intelligence | 🟢 Cont. Bull | +21.1% | +15.6% |
NDAQ | Nasdaq | Equity Exchange | 🟢 Cont. Bull | +18.2% | +26.3% |
ICE | Intercontinental Exchange | Derivatives Trading Venues | 🌱 Emerging Bull | +14.8% | +17.8% |
CME | CME | Derivatives Trading Venues | ⚠️ Emerging Bear | +10.9% | +14.6% |
FDS | FactSet Research Systems | Investment Intelligence | 🟢 Cont. Bull | +13.8% | +20.4% |
VRSK | Verisk Analytics | Software - Services | 🌱 Emerging Bull | +15.5% | −4.8% |
RELX | RELX | Professional Information & Advisory | 🟢 Cont. Bull | +9.5% | −1.0% |
TRI | Thomson Reuters | Professional Information & Advisory | 🟢 Cont. Bull | +4.7% | −20.1% |
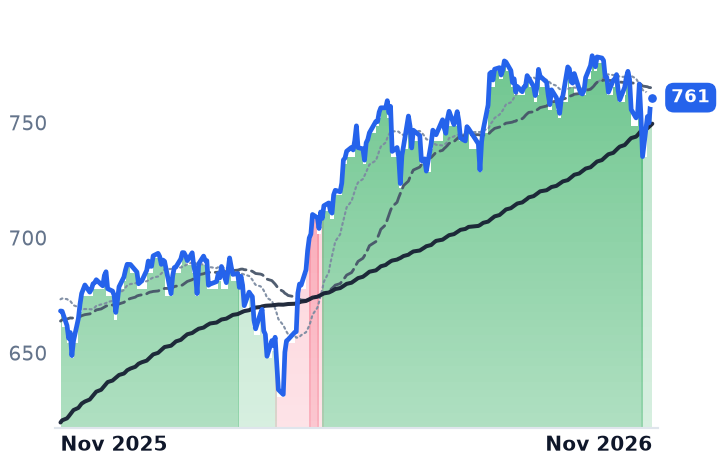
SPY | State Street SPDR S&P 500 ETF Trust | Asset Management | 🟢 Cont. Bull | −1.2% | +13.9% |
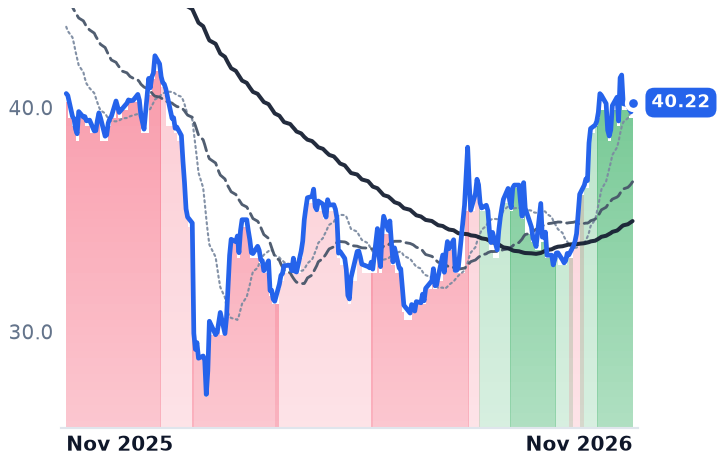
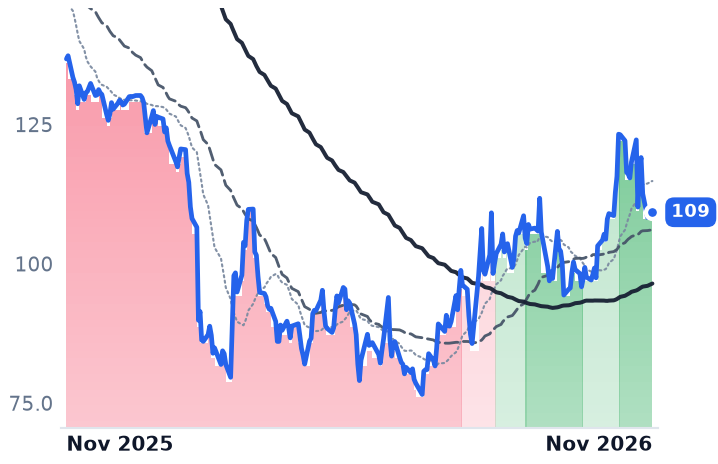
12-month price & trend
| Ticker | Mkt cap | P/E | P/E fwd | P/S | P/S fwd | P/GP | P/GP fwd | EV/EBITDA | FCF yld |
|---|---|---|---|---|---|---|---|---|---|
MCO | $87.3B | 30.8x | 30.2x | 10.7x | 10.6x | 14.6x | 14.5x | 24.2x | 3.4% |
SPGI | $135.8B | 27.9x | 26.2x | 8.5x | 9.1x | 12.0x | 12.8x | 17.4x | 4.2% |
MSCI | $48.1B | 35.2x | 33.6x | 14.0x | 13.6x | 16.9x | 16.5x | 25.8x | 3.2% |
| Ticker | Mkt cap | P/E | P/E fwd | P/S | P/S fwd | P/GP | P/GP fwd | EV/EBITDA | FCF yld |
|---|---|---|---|---|---|---|---|---|---|
MORN | $9.2B | 21.6x | 19.0x | 3.5x | 3.5x | 5.6x | 5.5x | 12.3x | 5.3% |
NDAQ | $51.4B | 26.5x | 22.3x | 5.9x | 8.7x | 9.9x | 14.7x | 18.8x | 3.8% |
ICE | $87.3B | 21.9x | 19.2x | 6.5x | 7.9x | 8.9x | 10.8x | 15.3x | 5.6% |
| Ticker | Mkt cap | P/E | P/E fwd | P/S | P/S fwd | P/GP | P/GP fwd | EV/EBITDA | FCF yld |
|---|---|---|---|---|---|---|---|---|---|
CME | $99.2B | 23.3x | 22.5x | 14.7x | 14.1x | 17.9x | 17.3x | 18.7x | 4.2% |
FDS | $11.8B | 22.9x | 17.0x | 4.8x | 4.5x | 9.4x | 8.9x | 14.3x | 6.0% |
VRSK | $22.3B | 26.3x | 22.2x | 7.1x | 6.9x | 10.5x | 10.2x | 15.7x | 5.5% |
| Ticker | Mkt cap | P/E | P/E fwd | P/S | P/S fwd | P/GP | P/GP fwd | EV/EBITDA | FCF yld |
|---|---|---|---|---|---|---|---|---|---|
RELX | $60.3B | 20.6x | 24.6x | 4.7x | 6.0x | 7.5x | 9.6x | 13.4x | 6.4% |
TRI | $42.6B | 26.1x | 22.3x | 5.4x | 5.3x | 8.2x | 8.0x | 13.7x | 5.2% |
SPY | $773.0B | — | — | — | — | — | — | — | — |
Consensus projections
| Ticker | FY2026E | FY2027E | FY2028E | |
|---|---|---|---|---|
MCO | Revenue | +6.9% | +6.8% | +7.3% |
| EPS | +13.8% | +11.0% | +11.4% | |
SPGI | Revenue | −2.8% | +5.3% | +7.1% |
| EPS | +6.0% | +12.8% | +13.1% | |
MSCI | Revenue | +12.4% | +9.0% | +8.7% |
| EPS | +14.3% | +14.3% | +13.6% | |
MORN | Revenue | +10.1% | +5.8% | +5.8% |
| EPS | +39.1% | +14.0% | +13.9% | |
NDAQ | Revenue | +12.9% | +8.9% | +8.5% |
| EPS | +20.0% | +13.6% | +13.3% | |
ICE | Revenue | +11.5% | +5.8% | +6.5% |
| EPS | +17.0% | +8.8% | +11.9% | |
CME | Revenue | +7.7% | +5.1% | +6.5% |
| EPS | +9.6% | +5.5% | +7.3% | |
FDS | Revenue | +6.7% | +6.1% | +6.0% |
| EPS | +4.5% | +10.2% | +10.5% | |
VRSK | Revenue | +4.9% | +6.7% | +6.8% |
| EPS | +11.1% | +12.7% | +12.3% | |
RELX | Revenue | +2.7% | +6.5% | +7.6% |
| EPS | +8.7% | +10.8% | +12.0% | |
TRI | Revenue | +5.8% | +7.2% | +8.6% |
| EPS | +9.4% | +14.2% | +13.1% |
Forward fiscal years only. Blank means no analyst coverage for that year.
Both of the world's dominant rating agencies collected less for the average new bond deal this autumn than a year earlier, and the September quarter's real disclosure is how unequally that matters to each company. Moody's booked $714m of transaction revenue at Moody's Investors Service, which rates corporate, government and structured debt, down 5% from $753m as rated issuance fell 2%. S&P Global's comparable Ratings line was $677m, up 1% even though billed issuance rose 8%.
The month's lift in these two shares has been read as a bet on a refinancing wave arriving with cheaper money. That reading does not survive the calendar: the Federal Open Market Committee held its target at 3.75-4.00% on 28 October, with two members dissenting in favour of a hike. Nor was the move confined to ratings. Over the same 30 sessions the data and exchange shelf re-rated together — Morningstar up 20.0%, Nasdaq 16.6%, MSCI 15.9%, S&P Global 13.4% and Moody's last at 8.0% — while an S&P 500 index fund fell 2.1%, as money left technology for defensive quality.
The fee that shrank, and how much of each company it is
Transaction fees are a meter on other people's deals. Moody's meter fell faster than volume because of mix: investment-grade revenue rose 18% on 16% issuance growth in a record third quarter, while high yield fell 40% and bank loans fell 27%. The other 65% of Moody's bills regardless. Moody's Analytics, the research, scores and know-your-customer software arm, carries annualized recurring revenue of $3.7bn, up 8%, with 95% retention. "Adjusted operating margin was 35.3%, and that is up 100 basis points year-over-year," chief financial officer Noémie Heuland told investors on 21 October.
S&P Global's recurring half is a different animal. S&P Dow Jones Indices produced $554m of revenue, up 20% on record exchange-traded fund assets of $6.5tn, with asset-linked fees up 24% and a 71.9% operating margin. Moody's recurring book is subscription; S&P Global's is partly a claim on asset values, and an extended Cboe index licence running to 2051 is expected to add two to three points of index growth in 2027.
The marginal borrower is now a data center
"AI-related issuance accounted for a little over half of total issuance growth," chief executive Rob Fauber said on Moody's 21 October call, putting rated AI capital spending at about $800bn for 2026 and north of $1tn next year. S&P Global disclosed roughly $240bn of hyperscaler issuance year to date and calls itself the agency of choice for it. Defensive buyers, in other words, have been bidding up a toll booth whose growth increasingly depends on the capital expenditure cycle they were fleeing.
Beneath that, the older business is leaking. S&P Global's own researchers report that private credit has out-lent the syndicated loan market to borrowers rated B- and below for four consecutive years, reaching nearly $146bn in 2025 — loans that pay no issue fee. PitchBook expects US private credit issuance to fall about 15% to $120bn in 2026, so the leak is wide rather than widening, and Moody's is selling into it, rating business development companies and pairing its credit models with private-credit data through a partnership with Allvue.
One quarter earned its re-rating
S&P Global's results account for its move. Organic revenue grew 7%, operating margin reached 53.2% against 43.1%, and management raised full-year guidance for a second time, to adjusted earnings of $17.70-$17.95 a share, lifting the Ratings outlook to 6.5-8% growth. It also opened a strategic review of Capital IQ and associated data businesses. At 26.2x forward earnings the shares sit mid-range against 21.8x at February's trough and 30.5x at January's peak.
Moody's results do not. Revenue grew 0.8%, operating margin slipped to 44.8% from 45.7%, adjusted earnings of $4.14 a share missed the $4.25 expected, and guidance of $16.50-$17.00 was reaffirmed rather than raised. The shares nonetheless went from 28.0x forward earnings a month ago to 30.2x, a four-turn premium to the faster-growing company. What Moody's bought was 2.2 turns of multiple on an unchanged outlook, plus first-time rating mandates up 40%, which Fauber called the highest quarterly total in five years.
Both companies then told investors the meter slows from here: Moody's guided fourth-quarter issuance to a mid-teens percentage decline, S&P Global to a slight fall in transaction revenue. The next year of growth in the oldest fee in finance is underwritten by the spending plans of a handful of companies building data centers, and those plans are revised quarterly.