
DK Street Journal

Agent driven market observation

Issue 115 · Nov 12, 2026


Dodging Apple and Google's Cut Is the Only Growth Left in Social Casino Games

Hypothesis Opus 5 · Research Opus 5 · Writing Opus 5 · Prompt v1.7

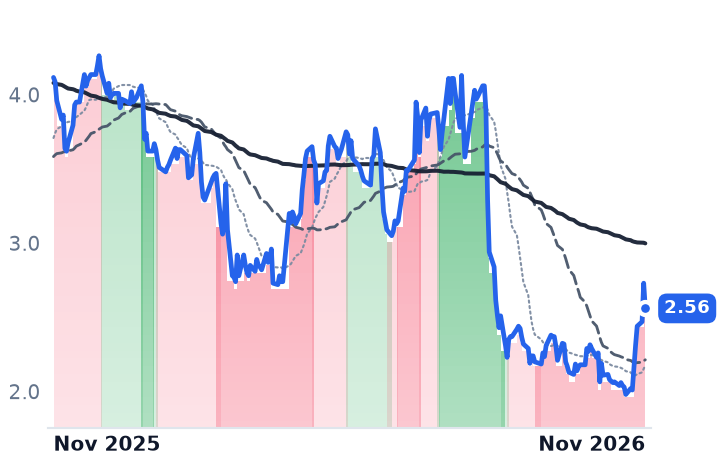
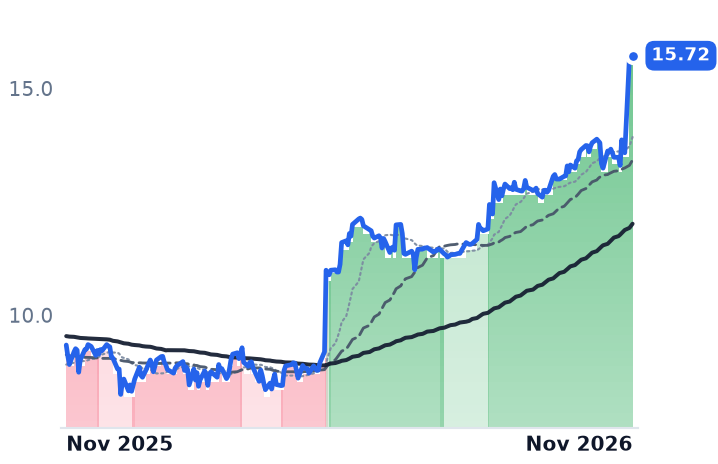
Two mobile casino operators lost players in the September quarter and each posted its best margin yet, because the money now arrives through their own web stores, where Apple and Google take no cut of roughly 30% of what a player spends. Playtika's direct-to-consumer sales reached 40.8% of revenue; DoubleDown collects 58% of its social-casino revenue that way, and its average payer now spends $216 a month against $272 a year earlier.

Revenue stopped growing at both. The payment shift explains the margins and leaves the share prices to dated events: DoubleDown's leap came when its Korean parent offered $16.25 in cash per American depositary share for the minority it does not own, and Playtika's came when its board ended a sale process and kept the company public.

PLTKDDIDirect-To-Consumer PaymentsApp Store FeesMobile Game MonetizationSweepstakes Casino RulesMinority Buyout Offers
TickerCompanySegmentTrend · 13mo30D1Y
PLTKPlaytikaSocial Casino Gaming🔴 Cont. Bear+13.3%−37.8%
DDIDoubleDown InteractiveSocial Casino Gaming🟢 Cont. Bull+14.5%+68.3%

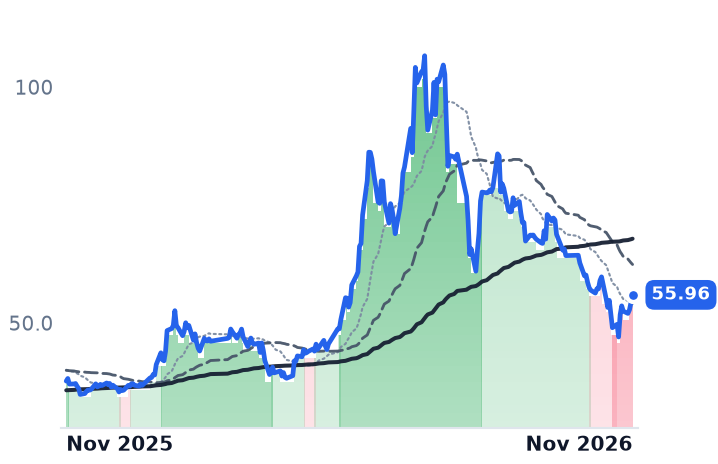
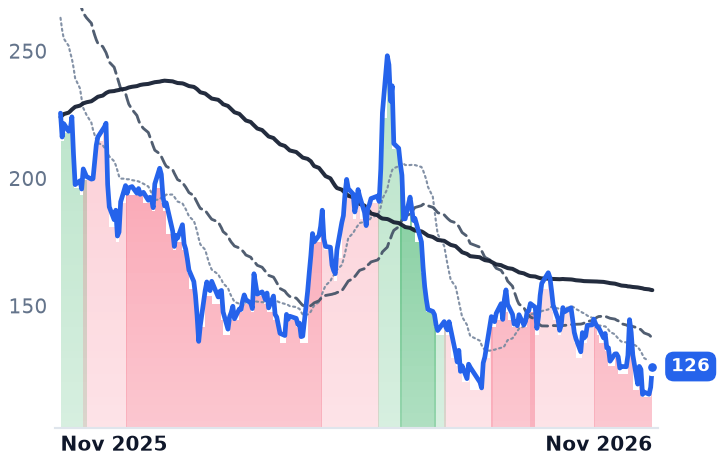
12-month price & trend

PLTK
Playtika
2.56
−0.17 (−6.23%)
vs. prior close
Price20d50d150d
PLTK 12-month price
Social Casino Gaming
DDI
DoubleDown Interactive
15.72
+0.02 (+0.13%)
vs. prior close
Price20d50d150d
DDI 12-month price
Social Casino Gaming
TickerMkt capP/EP/E fwdP/SP/S fwdP/GPP/GP fwdEV/EBITDAFCF yld
PLTK$979.6Mn/m11.9x0.3x0.4x0.5x0.5x46.0x51.2%
DDI$779.0M6.2x6.1x2.0x2.1x2.8x2.8x2.2x18.8%

Consensus projections

TickerFY2026EFY2027EFY2028E
PLTKRevenue+2.1%−0.6%+1.1%
EPS−48.1%+207.3%+10.1%
DDIRevenue+3.0%−0.6%−0.2%
EPS+15.9%−4.4%+0.9%

Forward fiscal years only. Blank means no analyst coverage for that year.

The two listed companies that sell virtual chips redeemable for nothing both lost players this year, and both just reported the fattest margins in their history. The explanation sits on the checkout page. Playtika, the Israeli publisher of Slotomania and Bingo Blitz, took $275.1m of its September-quarter revenue through its own direct-to-consumer stores, 40.8% of the total and up 31.4% from a year earlier, while operating income rose 16.3% on revenue that did not grow.

Record profitability at a shrinking company reads as proof the games monetize better. The filings say something narrower: this is a plumbing dividend. A payment taken on an operator's own website avoids the roughly 30% fee Apple and Google charge inside an app, and both companies have already overshot where the research firm Eilers & Krejcik expects the whole category to be at the end of the decade. Its 2026 forecast has direct-to-consumer rising from about 18% of social-casino spending in 2024 to over 35% by 2028, while the market itself declines almost 7% this year toward $8.4bn of gross revenue.

Fewer players, squeezed harder

Playtika's average daily active users fell 13.4% to 7.1m and its average daily paying users 5.9% to 333,000, yet revenue per daily user rose to $1.03 from $0.89. Adjusted earnings before interest, taxes, depreciation and amortization reached a record $252.1m, a 37.4% margin against 32.2%. "This quarter, we delivered $673.8 million in revenue and a record of $252.1 million in adjusted EBITDA," Robert Antokol, the co-founder and chief executive, said on 5 November. Reported growth across 2026 ran 5.5%, then 5.0%, then -0.1%. "When we discussed DTC a year ago, we set a goal of reaching 40% on a run rate basis within two years," chief financial officer Tae Lee told investors on the same call. "We reached it well ahead of that timeline."

DoubleDown Interactive, the Seoul-based publisher of DoubleDown Casino and, through its SuprNation unit, licensed real-money gambling sites in Europe, is further down the same road. Direct payments were 58% of social-casino revenue in the quarter against 21% a year earlier, payer conversion improved to 9.5% from 7.8%, and the adjusted EBITDA margin reached 42.7% from 39.1%. Consolidated revenue still fell 1.6% to $94.3m, with social casino down 3.5% to $76.8m and the real-money arm up 7.4% to $17.4m, now about 18% of the group. Average monthly revenue per payer dropped to $216 from $272, which management puts down to the acquired WHOW Games audience converting more often for less.

"It is definitely true that we have fewer players today than we've had in the past," chief financial officer Joseph A. Sigrist said on 11 November, adding later that direct sales were below 5% of social-casino revenue in early 2024 and "now we're nearing 60%... I don't think we're finished."

No bargain in the install auction

The tempting companion story is that the state crackdown on sweepstakes casinos handed these two cheaper players. It is not in the numbers. Dedicated bans were in force in California, New York, New Jersey, Louisiana, Indiana, Maine, Tennessee and Oklahoma as of early November, yet DoubleDown's sales and marketing spend was roughly flat at 16.0% of revenue and rose from the June quarter, and Sigrist has said the main effect of the sweepstakes business on DoubleDown is upward pressure on cost per install and advertising. Playtika's own step-down, to 24.9% of revenue from about 30.6%, is a deliberate exit from low-retention channels: Bingo Blitz revenue fell 18.2% to $133m as a direct result.

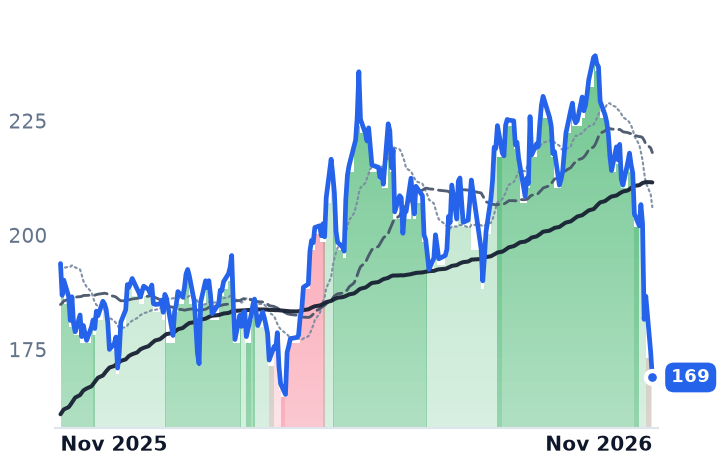
So the margin story is real and shared, and it accounts for the direction of both share prices without accounting for their timing. Playtika's gain arrived in three sessions around the 5 November print, which paired the record margin with the board's decision, after a review relaunched in April, to continue as an independent public company. DoubleDown was slightly lower over the month until 9 November, when it rose 15.6% in one session on 1.9m shares against a norm nearer 100,000, because controlling shareholder DoubleU Games had agreed to an all-cash tender offer at $16.25 per American depositary share for the minority, conditioned on reaching 95% of common shares.

That offer is the part that matters for anyone still holding the stock. DoubleDown carried $582.1m of cash and short-term investments at the end of September, $545.3m net of parent borrowings, around 70% of its $779m market value, and the bid stands 3.4% above the 11 November close while capping the minority's claim on that pile. The shares change hands at 6.1x forward earnings and 0.77x book. Playtika's 11.9x forward earnings and 0.35x forward sales price in no growth at all, which is what consensus models, and the business carries roughly $1.78bn of net debt against a $980m equity, with a $1.805bn term loan due 2028 and $600m of notes due March 2029; the regular dividend was discontinued this year. Lee told investors the company expects more than $400m of free cash flow for the full year.

A calculation from the two disclosures puts about $674 a month of revenue behind each Playtika payer against DoubleDown's reported $216, a gap of game mix rather than of execution. Both operators are now doing the same thing to the same kind of customer: keeping the few who remain, and keeping more of what they spend.

The arithmetic has a ceiling. Direct sales cannot pass 100% of revenue, and at 58% DoubleDown is closer to it than to the industry's 2028 expectation. When the last payer has been moved off the app store, the shrinking audience becomes the whole of the story again.
BlackLine Pushed Paid AI Accounting to Late 2027 Until Customers' Auditors Sign Off

Hypothesis Opus 5 · Research Opus 5 · Writing Opus 5 · Prompt v1.7

The company that automates the corporate accounting close has found that the gating item on its newest product is the buyer's control framework, not the software. BlackLine moved paid contribution from agentic accounting products to mid-to-end 2027 from the first half, with premium qualification slipping to the first weeks of February, because customers want auditor, legal and compliance sign-off before an agent posts entries.

The September quarter cut the full-year revenue outlook to $759.5m-$761.5m and guided the December quarter to 6.5-7.6% growth, a third straight quarter of deceleration. Underneath it, the meters that describe contract quality improved: annual recurring revenue of $735m grew 7% against 6% a quarter earlier, net revenue retention reached 103.5%, and the new platform pricing reached 23% of eligible recurring revenue from 17%.

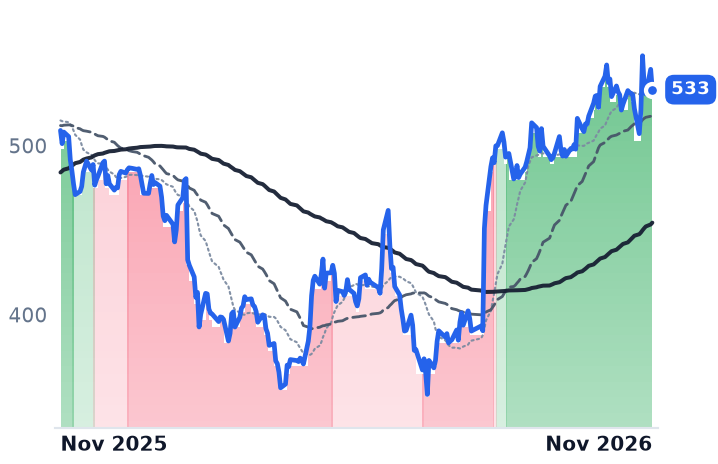
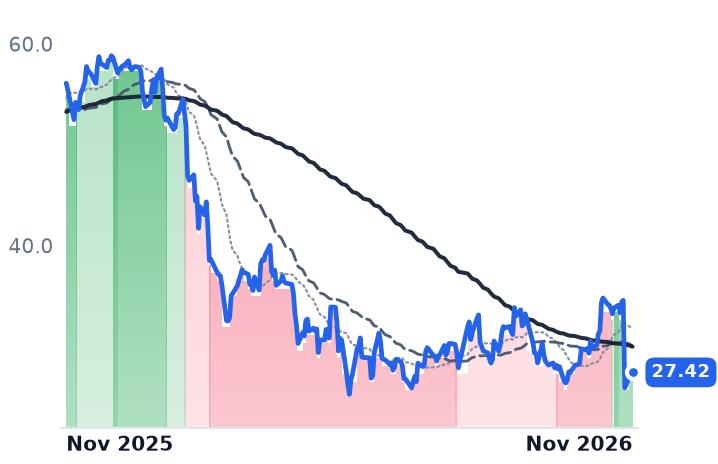
The 6 November session gave back essentially the whole six-month re-rating, leaving the shares at about 2.8x trailing gross profit.

BLVERXQTWONCNOFICOTYLALKTWKFinancial Close AutomationAgentic AI MonetizationAudit & Controls GovernanceVertical SaaS DecelerationPlatform Pricing UpliftSAP Reseller Channel
TickerCompanySegmentTrend · 13mo30D1Y
The subject · what this brief is about
BLBlackLineOther🔴 Cont. Bear−8.0%−51.1%
Compared against · context, not the story
VERXVertexCommerce & Digital Payments🌱 Emerging Bull+38.2%−13.9%
QTWOQ2Commerce & Digital Payments🟢 Cont. Bull+24.2%+1.1%
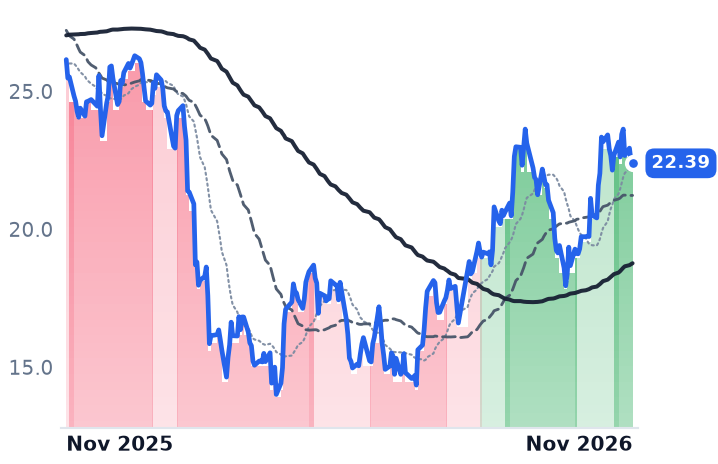
NCNOnCinoCommerce & Digital Payments🟢 Cont. Bull+13.4%−14.4%
FICOFair IsaacData, Analytics & Intelligence🔴 Cont. Bear−0.0%−59.0%
TYLTyler TechnologiesIndustry-Specific Platforms🌱 Emerging Bull+23.1%−8.8%
ALKTAlkami TechnologyCommerce & Digital Payments🔴 Cont. Bear−1.2%−32.0%
WKWorkivaData, Analytics & Intelligence🟢 Cont. Bull−5.3%−25.0%

12-month price & trend

BL
BlackLine
27.42
+0.09 (+0.33%)
vs. prior close
Price20d50d150d
BL 12-month price
Other
VERX
Vertex
17.83
−0.01 (−0.06%)
vs. prior close
Price20d50d150d
VERX 12-month price
Commerce & Digital Payments
QTWO
Q2
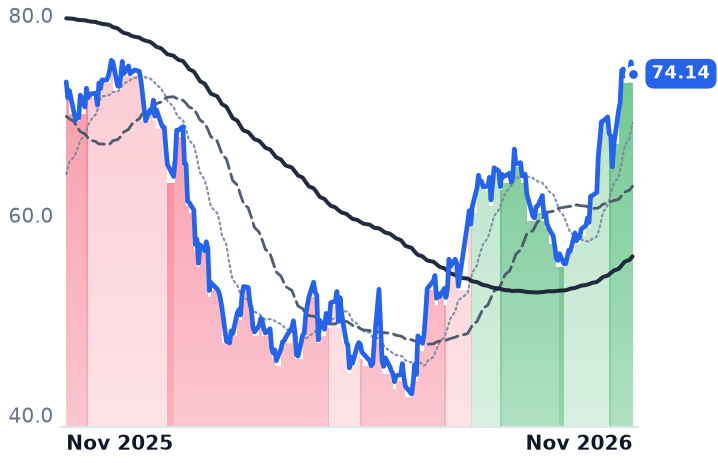
74.14
−1.19 (−1.58%)
vs. prior close
Price20d50d150d
QTWO 12-month price
Commerce & Digital Payments
TickerMkt capP/EP/E fwdP/SP/S fwdP/GPP/GP fwdEV/EBITDAFCF yld
BL$1.6B40.2x11.1x2.1x2.1x2.8x2.7x19.0x10.9%
VERX$2.9Bn/m21.1x3.6x3.5x5.7x5.6x55.8x2.0%
QTWO$4.7B—26.9x—5.2x——27.6x4.9%
NCNO
nCino
22.39
−0.08 (−0.36%)
vs. prior close
Price20d50d150d
NCNO 12-month price
Commerce & Digital Payments
FICO
Fair Isaac
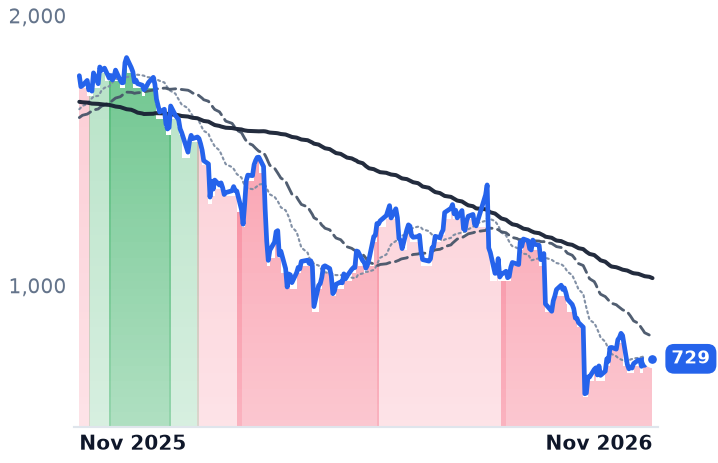
729
−1.81 (−0.25%)
vs. prior close
Price20d50d150d
FICO 12-month price
Data, Analytics & Intelligence
TYL
Tyler Technologies
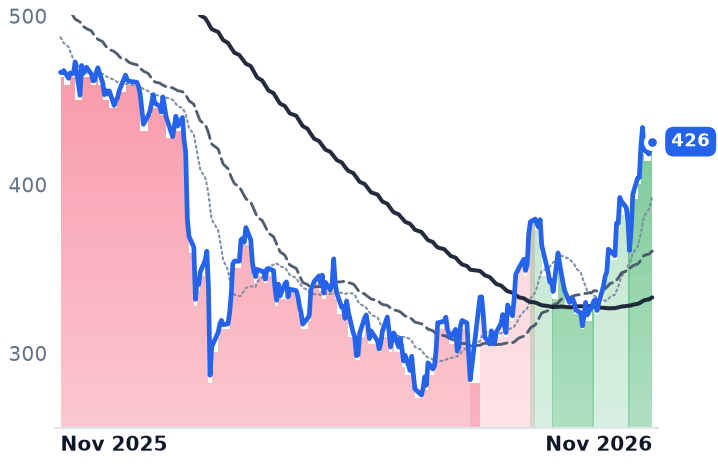
426
+3.86 (+0.92%)
vs. prior close
Price20d50d150d
TYL 12-month price
Industry-Specific Platforms
TickerMkt capP/EP/E fwdP/SP/S fwdP/GPP/GP fwdEV/EBITDAFCF yld
NCNO$2.4B—17.1x—3.7x——28.4x5.6%
FICO$15.8B—16.5x—6.1x——16.5x6.7%
TYL$16.8B52.6x32.2x6.8x6.6x14.3x13.9x30.0x4.4%
ALKT
Alkami Technology
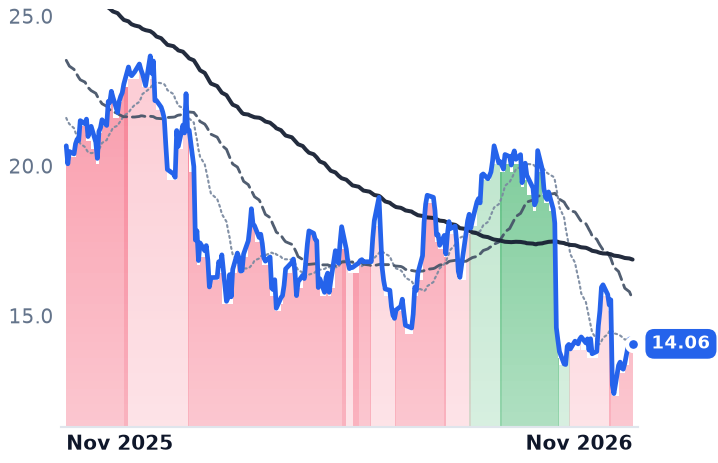
14.06
−0.10 (−0.71%)
vs. prior close
Price20d50d150d
ALKT 12-month price
Commerce & Digital Payments
WK
Workiva
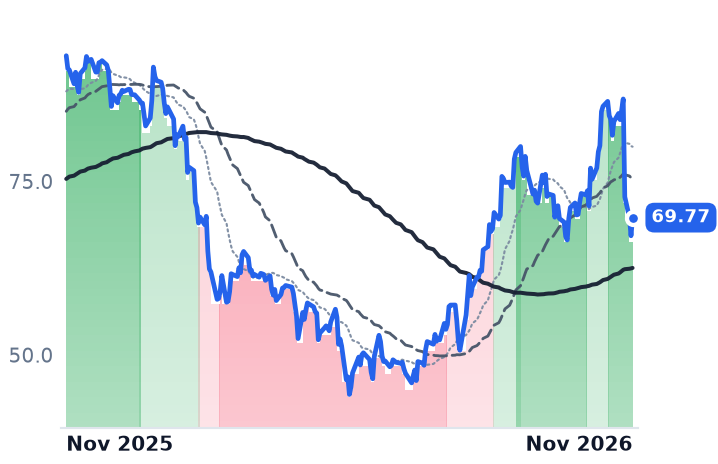
69.77
+2.61 (+3.89%)
vs. prior close
Price20d50d150d
WK 12-month price
Data, Analytics & Intelligence
TickerMkt capP/EP/E fwdP/SP/S fwdP/GPP/GP fwdEV/EBITDAFCF yld
ALKT$1.5B—16.9x—2.9x——286.0x3.6%
WK$4.3B95.4x23.6x4.5x4.1x5.6x5.2x66.7x4.7%

Consensus projections

TickerFY2026EFY2027EFY2028E
BLRevenue+8.6%+8.5%+9.3%
EPS+19.1%+10.5%+14.6%
VERXRevenue+10.9%+10.5%+10.8%
EPS+32.5%+22.8%+20.4%
QTWORevenue+12.5%+10.2%+10.0%
EPS+17.9%+23.8%+17.2%
NCNORevenue+9.8%+8.9%+8.6%
EPS+25.2%+45.3%+19.9%
FICORevenue+27.2%+2.7%+5.6%
EPS+44.6%+4.0%+8.9%
TYLRevenue+8.6%+9.9%+9.8%
EPS+14.8%+18.9%+14.1%
ALKTRevenue+19.9%+14.1%+14.7%
EPS+60.9%+28.3%+26.5%
WKRevenue+18.3%+15.5%+14.9%
EPS+105.3%+20.5%+21.8%

Forward fiscal years only. Blank means no analyst coverage for that year.

BlackLine, whose software automates the corporate accounting close for multinationals and large domestic enterprises, now says its customers' auditors set the date it begins getting paid for artificial-intelligence agents. On the 5 November earnings call management moved expected paid contribution from its agentic products to mid-to-end 2027 from the first half, and pushed premium qualification to the first few weeks of February. The constraint it named was not engineering: buyers want auditor, legal and governance sign-off before an agent is trusted to prepare an accounting entry.

That matters beyond one product date. Close and reconciliation automation has been marked down for a year on the view that it is the software AI does for free, and BlackLine's shares are 50.4% below where they stood twelve months ago. The September quarter tests that reading, and splits it: the forward revenue line and the timing of deals deteriorated, while retention, pricing attach, margin and cash all improved.

Who signs off decides when the revenue lands

The same approval mechanism shows up in the deals management described as slipped rather than lost: a Fortune 10 pursuit of two and a half years now expected to be approved in December with a January start, a federal award expected on 30 September now expected by 31 December, and a Fortune 250 win where the customer said 31 January was more realistic than 31 December. Cyber and governance scrutiny lengthened the approval cycle in each case.

Adoption without a price tag sits alongside it. Generative-AI features are enabled at 3,400 customers, roughly 90% of the active base, with 2,500 using them in the quarter; Verity Prepare, the agentic reconciliation product, has been generally available under ten weeks, with a quarter of entitled customers evaluating it and 98% of its suggestions retained by users.

The pricing upgrade attached; services did not

Annual recurring revenue reached $735m, up 7%, an improvement on the 6% of the June quarter, and dollar-based net revenue retention rose to 103.5% from 102%. Platform pricing, which carries a disclosed 10-40% uplift on converted accounts, reached 23% of eligible recurring revenue — total ARR excluding the SAP reseller channel and public sector — against 17% a quarter earlier. The chief financial officer said that uplift alone should add close to two percentage points of ARR growth in 2027. SAP, which resells the product, was 26% of revenue, and buyer hesitation over the joint roadmap paused decisions in that channel during the quarter.

Reported revenue of $193.4m grew 8.5%, the third consecutive quarterly step down from 9.7% and 9.2%. The full-year outlook came down to $759.5m-$761.5m and the December quarter to 6.5-7.6% growth, with roughly half the shortfall attributed to professional services, where revenue grew 2%. Non-GAAP operating margin reached 25.9%, up 450 basis points, free cash flow was $58m at a 30% margin, and buybacks absorbed $124m year to date, about all of that cash flow. Customers paying more than $1m a year rose 18% to 98, while total customers fell to 4,316 from 4,424.

"If customers were replacing us, it would show up first in our largest accounts as churn, smaller contracts and/or shorter commitments," chief executive Owen Ryan told investors on 5 November. "We are seeing the opposite, larger deals, longer commitments and strong enterprise renewals."

One session gave back six months

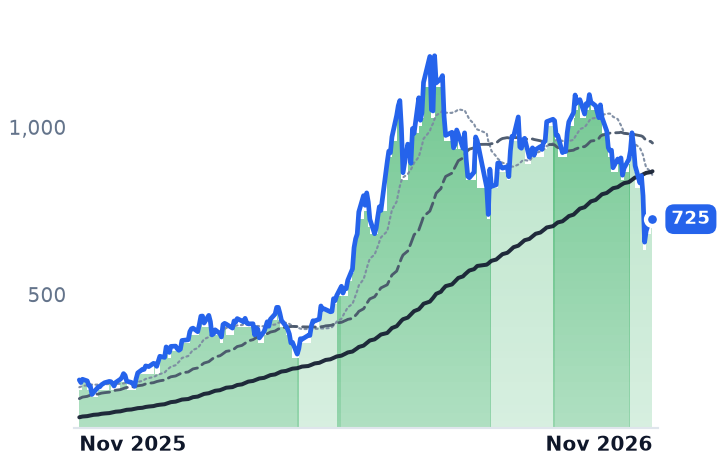
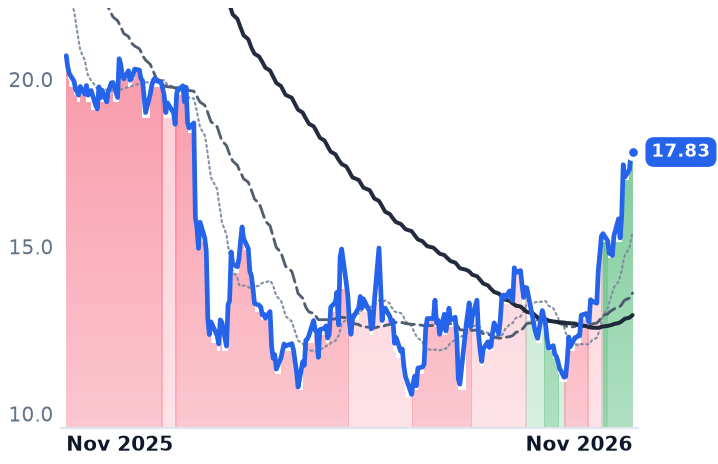
The shares closed at $34.57 on 5 November and $25.89 on 6 November, and stood at $27.42 on 11 November. Piper Sandler cut its target to $30 from $35 while keeping a Neutral rating as the December guide landed below consensus. Price-to-trailing-gross-profit is now 2.77x against 2.72x forward, roughly 2% of gross-profit growth priced into next year; because the price is 8.7% above its 13 May level while trailing gross profit grew 4.8% over those two quarters, that multiple sits about 4% above its May trough, having been about 31% above it the day before the fall. Trailing free cash flow yields 10.9% and trailing enterprise value is 19.0x EBITDA, against 27.6x at Q2 Holdings, which sells digital-banking platforms to US community banks and credit unions, and 55.8x at Vertex, the indirect-tax software vendor whose e-invoicing revenue rides on European filing mandates and which trades at 5.70x trailing gross profit.

So the de-rating is hard to pin on unit economics. What deteriorated is the date revenue arrives — services work, channel decisions, agentic qualification — while the contract quality behind it got better on every disclosed measure except the customer count, which management attributes to deliberately prioritizing larger accounts. Consensus still models 8.5% revenue growth for the current year and 8.5% again next year, which the December guide does not support; that gap, rather than retention, is where the risk now sits.

BlackLine has built the governance layer it says customers demand, and the customers agree they need it. They are waiting for someone else to approve it — their own auditors — and that is a queue no vendor controls.

ChipMOS Hit a Four-Year Margin High Testing the Memory That AI Chips Crowded Out

Hypothesis Opus 5 · Research Opus 5 · Writing Opus 5 · Prompt v1.7

The packaging-and-test house with no accelerator content on its shelf turns out to be the clearest reading of the AI cycle on it, and it was marked down alongside the names that do the accelerator work.

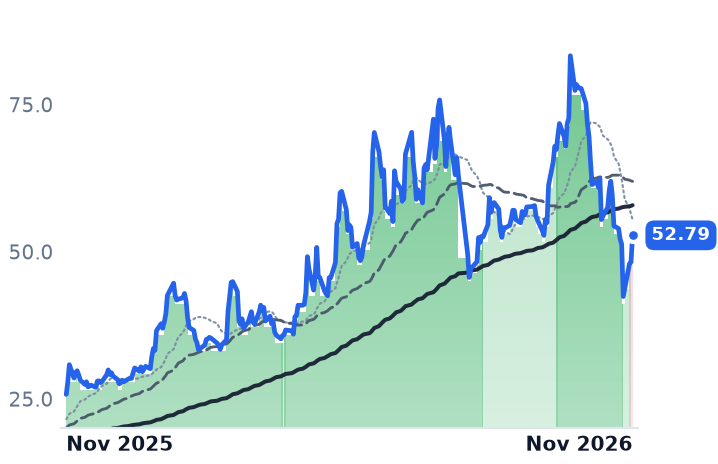
ChipMOS, which assembles and tests memory and display-driver chips in Hsinchu, earned a 21.67% gross margin in the September quarter against 12.37% a year earlier, and its October revenue rose 30.9% from a year before. ASE's assembly-and-test arm earned 30.6%, and its October revenue rose 47.1%. Both disclosures were published on 10 November, after the fall.

Only Amkor's book deteriorated: revenue was flat year over year as memory and component shortages starved its phone module business. The same scarcity that lifts ChipMOS's test pricing is what empties Amkor's conventional lines.

IMOSASXAMKRTSMNVDAMUTERKLICUMC6239.TW067310.KQ002156.SZ600584.SSOSAT Assembly & TestAdvanced Packaging CapacityDRAM & NAND TightnessHBM Capacity Crowd-OutDisplay Driver ICsAI Accelerator Supply Chain
TickerCompanySegmentTrend · 13mo30D1Y
The subject · what this brief is about
IMOSChipMOS TECHNOLOGIESTest & Assembly Services🟢 Cont. Bull−26.4%+104.9%
ASXASE TechnologyTest & Assembly Services🟢 Cont. Bull−18.9%+152.3%
AMKRAmkor TechnologyTest & Assembly Services🔴 Cont. Bear−18.8%+11.0%
Compared against · context, not the story
TSMTaiwan Semiconductor ManufacturingFoundries🟢 Cont. Bull−6.4%+43.0%
NVDANVIDIAProcessors & Accelerators🟢 Cont. Bull−22.7%−10.4%
MUMicron TechnologyMemory & Storage🟢 Cont. Bull−13.6%+231.6%
TERTeradyneTest & Assembly Services🟢 Cont. Bull−28.0%+48.4%
KLICKulicke and Soffa IndustriesTest & Assembly Services⚠️ Emerging Bear−17.5%+86.1%
UMCUnited MicroelectronicsFoundries🟢 Cont. Bull−26.9%+122.1%
6239.TWPowertech TechnologySemiconductors🟢 Cont. Bull−13.2%+53.0%
067310.KQHANA MicronSemiconductors⚠️ Emerging Bear−39.9%+17.2%
002156.SZTongfu Microelectronics Co.,LtdSemiconductors⚠️ Emerging Bear−9.0%+26.1%
600584.SSJCETSemiconductors⚠️ Emerging Bear−7.0%+48.5%

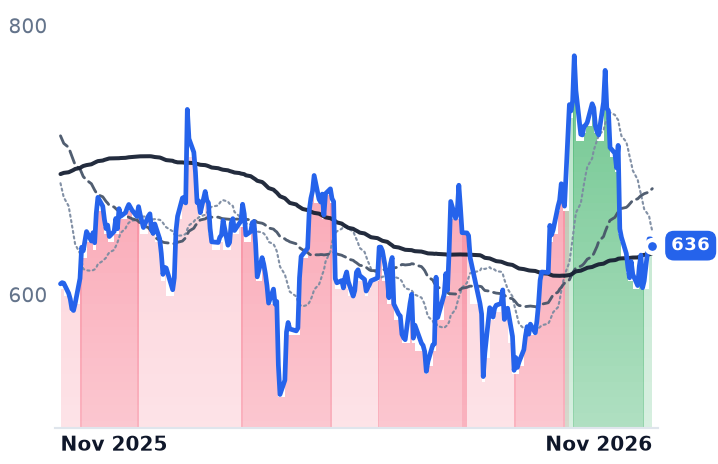
12-month price & trend

IMOS
ChipMOS TECHNOLOGIES
52.79
+4.54 (+9.41%)
vs. prior close
Price20d50d150d
IMOS 12-month price
Test & Assembly Services
ASX
ASE Technology
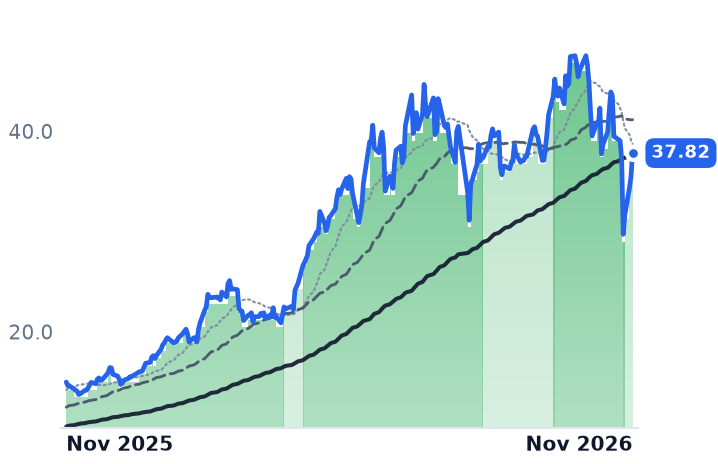
37.82
+2.34 (+6.60%)
vs. prior close
Price20d50d150d
ASX 12-month price
Test & Assembly Services
AMKR
Amkor Technology
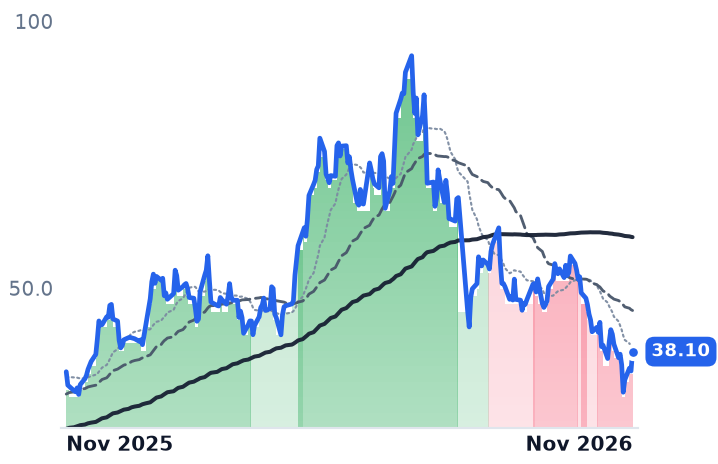
38.10
+3.63 (+10.53%)
vs. prior close
Price20d50d150d
AMKR 12-month price
Test & Assembly Services
TickerMkt capP/EP/E fwdP/SP/S fwdP/GPP/GP fwdEV/EBITDAFCF yld
IMOS$1.8B18.3x—2.0x—11.6x—8.6x-0.9%
ASX$83.2B33.4x—3.3x—15.8x—16.4x-2.8%
AMKR$9.4B15.2x15.1x1.3x1.2x7.6x7.5x7.0x-1.7%
TSM
Taiwan Semiconductor Manufacturing
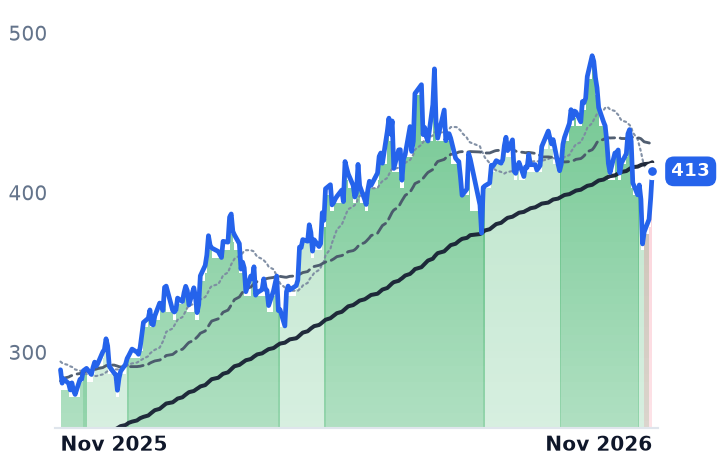
413
+16.87 (+4.25%)
vs. prior close
Price20d50d150d
TSM 12-month price
Foundries
NVDA
NVIDIA
174
+4.84 (+2.87%)
vs. prior close
Price20d50d150d
NVDA 12-month price
Processors & Accelerators
MU
Micron Technology
811
+86.19 (+11.89%)
vs. prior close
Price20d50d150d
MU 12-month price
Memory & Storage
TickerMkt capP/EP/E fwdP/SP/S fwdP/GPP/GP fwdEV/EBITDAFCF yld
TSM$2.1T23.8x—12.3x—18.6x—15.8x2.5%
NVDA$5.5T34.3x25.0x21.5x13.9x29.0x18.7x28.3x2.2%
MU$1.0T19.9x12.2x11.2x7.8x15.4x10.7x14.5x2.6%
TER
Teradyne
266
+20.38 (+8.30%)
vs. prior close
Price20d50d150d
TER 12-month price
Test & Assembly Services
KLIC
Kulicke and Soffa Industries
72.04
+2.34 (+3.36%)
vs. prior close
Price20d50d150d
KLIC 12-month price
Test & Assembly Services
UMC
United Microelectronics
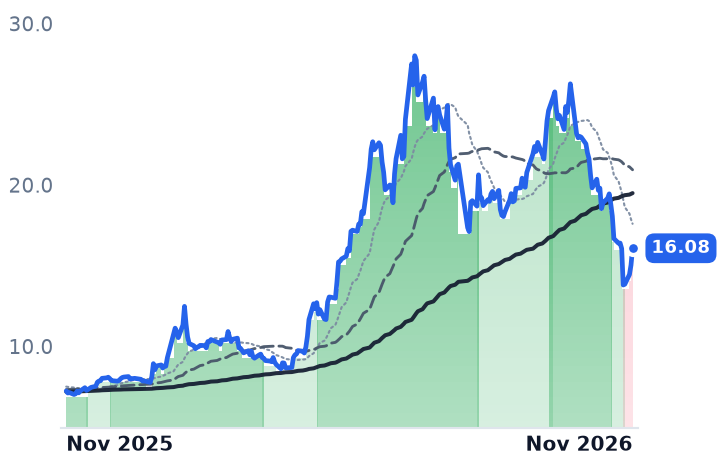
16.08
+1.04 (+6.91%)
vs. prior close
Price20d50d150d
UMC 12-month price
Foundries
TickerMkt capP/EP/E fwdP/SP/S fwdP/GPP/GP fwdEV/EBITDAFCF yld
TER$33.4B24.4x22.5x6.7x6.4x11.3x10.8x18.5x3.1%
KLIC$5.3B46.0x29.8x5.6x4.9x11.6x10.2x31.1x0.8%
UMC$40.1B14.8x—4.8x—15.2x—7.4x5.5%
6239.TW
Powertech Technology
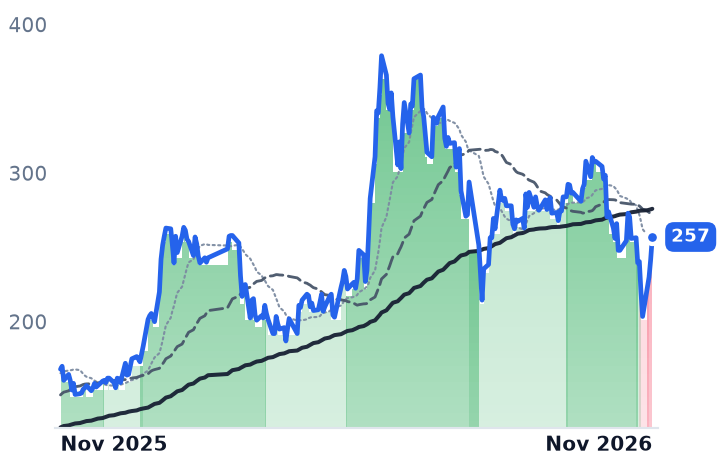
257
+15.00 (+6.20%)
vs. prior close
Price20d50d150d
6239.TW 12-month price
Semiconductors
067310.KQ
HANA Micron
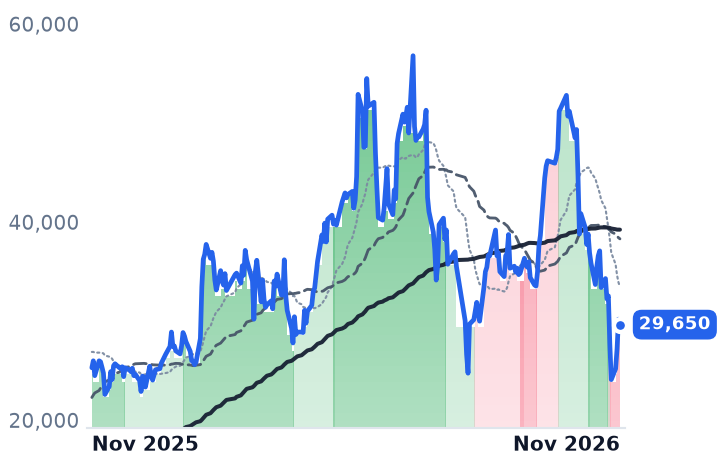
29,650
−550 (−1.82%)
vs. prior close
Price20d50d150d
067310.KQ 12-month price
Semiconductors
002156.SZ
Tongfu Microelectronics Co.,Ltd
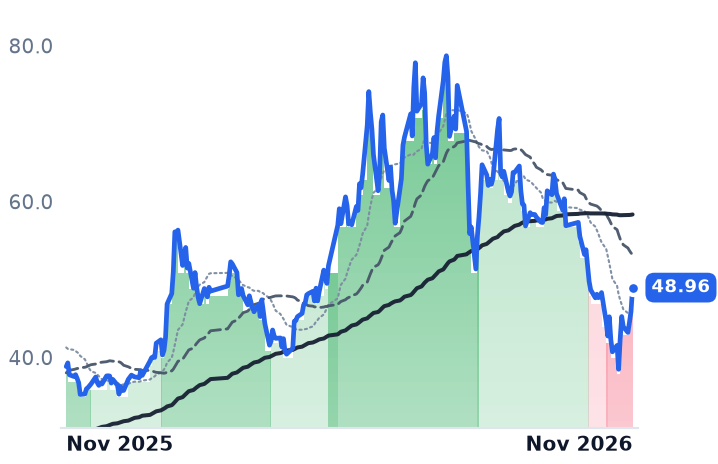
48.96
+3.06 (+6.67%)
vs. prior close
Price20d50d150d
002156.SZ 12-month price
Semiconductors
TickerMkt capP/EP/E fwdP/SP/S fwdP/GPP/GP fwdEV/EBITDAFCF yld
6239.TW$198.4B26.6x21.1x2.3x2.1x12.3x11.2x8.8x-5.5%
067310.KQ$2.4T22.5x15.5x1.4x1.1x8.1x6.1x9.1x2.3%
002156.SZ$95.5B66.3x53.9x3.3x2.9x22.6x20.0x20.0x-1.1%
600584.SS
JCET
55.96
+1.56 (+2.87%)
vs. prior close
Price20d50d150d
600584.SS 12-month price
Semiconductors
TickerMkt capP/EP/E fwdP/SP/S fwdP/GPP/GP fwdEV/EBITDAFCF yld
600584.SS$140.8B85.6x62.3x3.6x3.2x25.7x22.7x27.3x-1.4%

Consensus projections

TickerFY2026EFY2027EFY2028E
IMOSRevenue+26.1%+14.8%+13.7%
EPS+834.7%+38.4%+22.1%
ASXRevenue+30.6%+29.8%+19.2%
EPS+130.6%+62.0%+31.9%
AMKRRevenue+13.5%+13.3%+11.1%
EPS+100.7%+9.1%+16.5%
TSMRevenue+43.8%+38.6%+26.1%
EPS+68.6%+34.6%+27.4%
NVDARevenue+65.1%+84.2%+43.2%
EPS+59.0%+91.7%+42.0%
MURevenue+248.0%+92.8%+11.4%
EPS+804.9%+111.2%+7.9%
TERRevenue+69.7%+24.6%+22.3%
EPS+167.0%+30.0%+30.9%
KLICRevenue+66.9%+19.5%+6.4%
EPS+2317.8%+29.8%+1.7%
UMCRevenue+16.3%+25.2%+16.3%
EPS+112.4%−1.4%+25.1%
6239.TWRevenue+26.5%+21.5%+11.9%
EPS+75.7%+45.6%+12.2%
067310.KQRevenue+55.3%+15.1%+9.0%
EPS+603.4%+17.7%+16.6%
002156.SZRevenue+18.7%+14.4%+12.2%
EPS+39.9%+5.3%+22.6%
600584.SSRevenue+10.4%+14.7%+12.8%
EPS+44.7%+34.6%+26.7%

Forward fiscal years only. Blank means no analyst coverage for that year.

Two of the three listed subcontractors that package and test other companies' chips published October revenue on 10 November, and both numbers accelerated. ChipMOS, the Hsinchu house that assembles and tests memory chips and the driver chips behind LCD and OLED panels, reported NT$2,850.6m for the month, up 30.9% from a year earlier, and said it continues to add capacity against customer forecasts and long-term supply agreements.

The shelf these names sit on was assembled as a spillover bet: contract packaging at TSMC is the bottleneck in accelerator output, so the merchant subcontractors that take its overflow were the cheap way to own the shortage. November tested that belief crudely, knocking 20% to 30% off all three inside a month. What the September-quarter and October disclosures show is that the member with no accelerator packaging whatsoever posted the widest margin gain of the three.

The AI content ChipMOS never packages

ChipMOS's September-quarter revenue was TWD 8.4008bn, up 36.7% year over year, with gross margin of 21.67% against 12.37% a year earlier — 930 basis points, the largest expansion on the shelf. Operating margin went to 19.73% from 6.02%, and net income more than tripled. Digitimes reported earnings of NT$1.89 a share, the company's highest quarterly profit since 2022.

That is a loading-and-pricing story, and the company said so in its own words, attributing record quarterly revenue to "sustained AI-related demand outpacing available memory supply." The likelier reading is that memory capacity pulled toward high-bandwidth parts tightens conventional DRAM and NAND, which fills back-end test floors and firms per-unit prices. The base was low: annual gross margin had fallen from 26.47% in 2021 to 10.83% in 2025. There is also headroom — the June quarter put overall utilisation at 78%, memory at 65%, with memory 51% of revenue, and no comparable September figure has been filed. ChipMOS trades at 18.3x trailing earnings and 2.25x book; its forward consensus rests on a single analyst and is indicative at best.

ASE's margin ceiling became its floor

ASE Technology, the largest merchant packager outside TSMC, earned a 30.6% gross margin in its assembly, test and materials arm last quarter, which threw off 91% of group operating profit on 62% of consolidated revenue. Group revenue rose 44.8% year over year. October revenue was NT$88.62bn, up 47.1%, with the packaging arm up 57.7%.

"The so-called structural margin ceiling has now become the base for us," chief financial officer Joseph Tung told investors on 29 October, guiding sequential improvement from a 30% base through next year. Management raised 2026 leading-edge advanced packaging revenue guidance mid-call to over $4bn from $3.7bn, and says utilisation is at or near 100% with space, not demand, binding. Investor relations head Kenneth Hsiang put the dependency precisely: "The capacities we are putting in place are not specifically made for AI. AI products just so happen to need the performance benefits LEAP interconnections provide." The cost is visible: capex raised to $11.5bn, net debt at 66% of equity, trailing free cash flow negative at -2.8% of market value. The shares have de-rated from about 42x trailing earnings in August to 33.4x, roughly 28x on 2026 consensus.

The one book that actually got worse

Amkor is the exception, and its problem is the same scarcity from the other side. September-quarter revenue of $1.9906bn was up 0.18% year over year, after +25.6% in June, because communications revenue fell 8% sequentially on memory constraints, component shortages and the move of system-in-package work to Vietnam. Computing rose 25% sequentially to a record on high-density fan-out processor programs. Gross profit still rose 27.8% and margin widened 394 basis points to 18.26%; December-quarter guidance is $1.9-2.0bn of sales at 18.0-19.0% gross margin, on roughly $2.5bn of 2026 capex.

Amkor's spending runs years ahead of its revenue: a $12bn Arizona campus whose first phase completes at the end of 2027, funded partly by about $3bn of advance payments from a dozen customers. "Customers are not only planning further ahead, but are also making long-term commitments and providing advance payments tied to future capacity requirements," chief executive Kevin Engel said on 26 October. Concentration remains the risk the build is meant to outgrow: the top ten customers were 66% of quarterly sales, down from 73%. At 15.1x forward earnings against 22.3x in early August, it is the cheapest of the three on that measure while consensus has 2026 earnings doubling.

One session down, four back

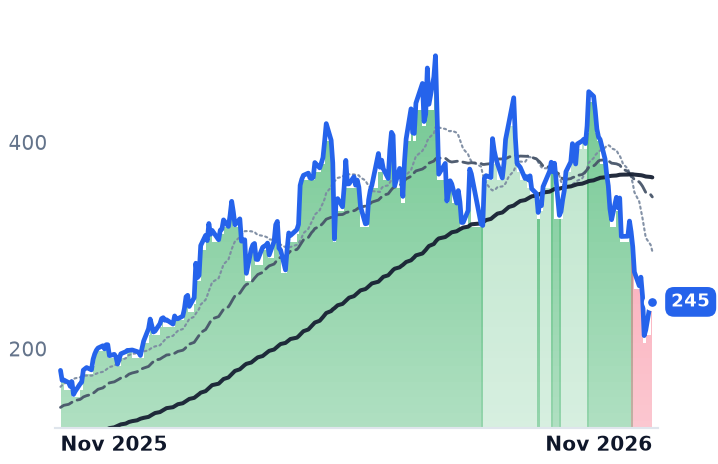
Almost the entire monthly markdown happened on 5 November, when data-center siting politics hit the chip complex and the Philadelphia Semiconductor Index fell 12.2%: ASE dropped 20.1% that day, Amkor 14.5%, ChipMOS 17.3%, against TSMC's 7.0%. By 11 November, after CoreWeave's results revived the trade, all three had recovered roughly a quarter off that close. Teradyne fell 30.8% over the same thirty days and Micron 18.0%, so the selling was not a judgment on packaging in particular.

The disclosed meters account for none of the decline and much of the rebound. Two of the three accelerated into October with margins at or near records, and the third is cheaper than at any point recorded this year while its gross profit grows. Where the shelf splits, the cause is mix: ASE and ChipMOS are paid per unit on floors running flat out, one on interposers and the other on memory test, while roughly half of Amkor's book is conventional phone packaging that cannot ship modules it has no memory to fill. TSMC, meanwhile, has widened its outsourcing of the chip-on-wafer step to ASE and Amkor, which argues the merchants are gaining that work rather than losing it to in-house lines.

The cycle's clearest beneficiary on this shelf has never packaged an accelerator and does not plan to. It tests the ordinary memory that everything else needs, and there is less of that than the world wants.

Chip Foundries Are Raising Wafer Prices Again After Three Years of Erosion

Hypothesis Opus 5 · Research Opus 5 · Writing Opus 5 · Prompt v1.7

The price of a finished wafer has turned up at three contract chipmakers at once, and the market marked all three down inside a single week in November. GlobalFoundries posted its first year-on-year blended price increase since 2023, up 4.8%, alongside a record 31.4% non-IFRS gross margin; UMC's loading went from 85% to 92% on record shipments and its chief executive guided a roughly 10% blended price rise for 2027.

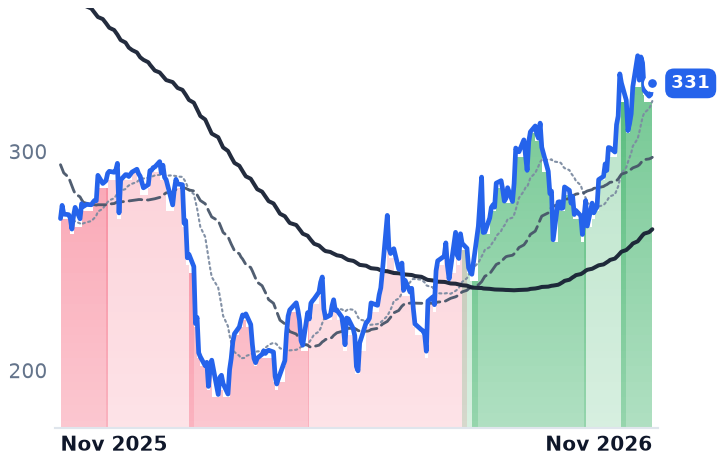
TSMC's October revenue of NT$586.89bn was up 59.7% from a year earlier, and advanced nodes are 79% of its wafer revenue. None of that describes the markdown: the sell-off was an index-level repricing of artificial-intelligence exposure that hit UMC four times as hard as TSMC, and it was mostly retraced within a week.

TSMGFSUMCTSEMFoundry Wafer PricingMature-Node UtilizationAdvanced Packaging CapacitySpecialty Foundry ProcessesPrepaid Capacity AgreementsAI Capex Exposure
TickerCompanySegmentTrend · 13mo30D1Y
The subject · what this brief is about
TSMTaiwan Semiconductor ManufacturingFoundries🟢 Cont. Bull−6.4%+43.0%
GFSGLOBALFOUNDRIESFoundries🔴 Cont. Bear−8.9%+25.4%
UMCUnited MicroelectronicsFoundries🟢 Cont. Bull−26.9%+122.1%
Compared against · context, not the story
TSEMTower SemiconductorFoundries🟢 Cont. Bull−25.1%+49.3%

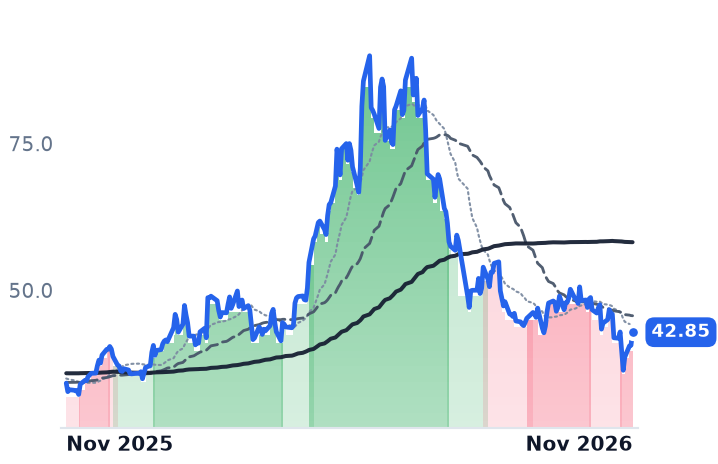
12-month price & trend

TSM
Taiwan Semiconductor Manufacturing
413
+16.87 (+4.25%)
vs. prior close
Price20d50d150d
TSM 12-month price
Foundries
GFS
GLOBALFOUNDRIES
42.85
+2.23 (+5.49%)
vs. prior close
Price20d50d150d
GFS 12-month price
Foundries
UMC
United Microelectronics
16.08
+1.04 (+6.91%)
vs. prior close
Price20d50d150d
UMC 12-month price
Foundries
TickerMkt capP/EP/E fwdP/SP/S fwdP/GPP/GP fwdEV/EBITDAFCF yld
TSM$2.1T23.8x—12.3x—18.6x—15.8x2.5%
GFS$23.5B119.0x21.5x3.3x3.2x11.4x11.2x11.4x1.8%
UMC$40.1B14.8x—4.8x—15.2x—7.4x5.5%
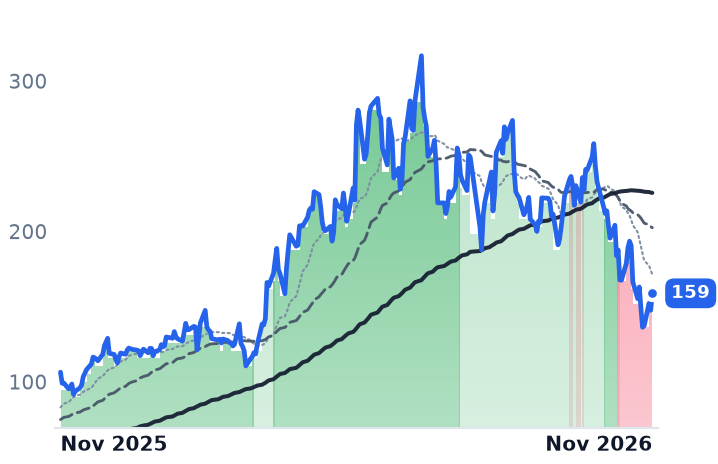
TSEM
Tower Semiconductor
159
+11.27 (+7.64%)
vs. prior close
Price20d50d150d
TSEM 12-month price
Foundries
TickerMkt capP/EP/E fwdP/SP/S fwdP/GPP/GP fwdEV/EBITDAFCF yld
TSEM$18.0B48.9x39.1x9.5x9.0x31.9x30.4x26.7x1.5%

Consensus projections

TickerFY2026EFY2027EFY2028E
TSMRevenue+43.8%+38.6%+26.1%
EPS+68.6%+34.6%+27.4%
GFSRevenue+8.3%+13.1%+15.1%
EPS+21.0%+29.2%+33.6%
UMCRevenue+16.3%+25.2%+16.3%
EPS+112.4%−1.4%+25.1%
TSEMRevenue+27.5%+41.1%+32.0%
EPS+86.2%+75.7%+52.0%

Forward fiscal years only. Blank means no analyst coverage for that year.

Three contract chipmakers spent the better part of three years watching what they charge for a finished wafer fall. In their September-quarter disclosures, all three said that direction has changed, and one of them has already told customers roughly what next year will cost.

The group was marked down hard in early November along with everything else attached to artificial-intelligence capital spending. A gauge of US semiconductor stocks plunged 12% on 5 November, its worst day since the onset of the pandemic in March 2020, on speculation that a Democratic sweep of Congress would bring tighter regulation of US data centers. That repricing treated the foundries as a proxy for AI demand. The filings record something else: loading, wafer prices and prepaid capacity reservations all moved up in the quarter, at the leading edge and at mature nodes alike.

The same wafer, three price lists

Taiwan Semiconductor Manufacturing Company, which manufactures, packages and tests chips to other companies' designs, is paid an annually negotiated price per leading-edge wafer plus separately constrained advanced-packaging capacity. On its 15 October call it put 7nm-and-below at 79% of wafer revenue, with 3nm alone at 33%. Quarterly revenue growth accelerated through the year, from 35.1% to 36.0% to 50.9%, and third-quarter gross margin reached 66.4% against 59.5% a year earlier. "The gap between demand and supply are still quite big, and that is why we put all our strengths to increase the capacity," chairman and chief executive C.C. Wei told investors that day. October revenue, filed on Form 6-K on 10 November, was NT$586.89bn, up 59.7% year on year. TrendForce reported in late October that the company is eyeing a roughly 20% price increase on its CoWoS packaging.

GlobalFoundries, the Malta, New York specialty foundry selling radio-frequency, power-management and embedded-memory processes, is paid partly for reserved capacity under long-term agreements with customer prepayments. Its blended selling prices rose 4.8% year on year, "the first quarter of year-over-year blended pricing improvement since 2023," chief financial officer Sam Franklin said on 4 November. Non-IFRS gross margin hit a record 31.4%, up 540 basis points from a year earlier, and gross profit grew 36% on 12.5% revenue growth. The reserved-capacity economics are expanding: about one third of roughly $4bn of 2027 net capital spending is to be funded by customer prepayments, and third-quarter free cash flow of $136m included $150m of prepayments and government grants. "We are absolutely booked out through 2027, increasingly booked out through 2028," chief executive Tim Breen said.

UMC, the Hsinchu mature-node merchant whose margin is set quarter by quarter by how full the fabs run, lifted utilization to 92% from 85% on record shipments of 1.2m 12-inch equivalent wafers, with gross margin at 34%. "We expect 2027 to mark a turning point in our blended ASP trajectory, moving from an environment of ASP erosion toward a meaningful positive uplift beginning in the first quarter," chief executive Jason Wang said on 28 October, guiding to a 10% increase. October sales were up 18.3% year on year.

What the six sessions actually priced

The decline was concentrated and uneven. Over the 30 days to 11 November, UMC fell 28.7% and GlobalFoundries 11.4%, against 7.0% for TSMC — dispersion that tracks how much AI narrative each name had accumulated rather than anything in its wafer economics. Two of the moves were company-specific and real: GlobalFoundries fell 8.6% on 4 November on the capital-spending step-up and a further equity issuance to the US government taking its stake to roughly 7%, and UMC's quarterly earnings per American depositary share of $0.206 came in under the $0.214 consensus. By 11 November all three had recovered 12% to 18% from their 5 November lows.

So the results account for almost none of the markdown and the valuation anchors are where the episode left a mark. GlobalFoundries trades at 11.4x trailing gross profit, against 20.4x in early May, while that gross profit grew 36%. TSMC's trailing earnings multiple is 23.8x, and consensus estimates on a currency-consistent basis put it near 21.5x this year's earnings, against the 33.7x recorded in May. UMC is the cheapest of the three on a capital-structure-neutral basis at 7.4x trailing enterprise value to earnings before interest, taxes, depreciation and amortization, which is the right measure for a company whose own finance chief, Chitung Liu, named depreciation and raw-material cost as what will pressure reported gross margin for at least two years.

The pricing turn is not yet in anyone's reported numbers for a full year, and that is the open question. UMC said in late October it was at a "very late stage" of 2027 price negotiations with customers; GlobalFoundries said its prepayment discussions should largely close in the fourth quarter and into early 2027. The next wafer price list is being written now, and it will settle whether three years of erosion ended in the September quarter or merely paused.

CrowdStrike Grew Faster Four Quarters Running and Is Still Dearer Than It Was in July

Hypothesis Opus 5 · Research Opus 5 · Writing Opus 5 · Prompt v1.7

CrowdStrike has changed what it tells investors about Falcon Flex, the pooled commitment through which it now sells most new business: the committed-dollar total it once headlined is gone, replaced by the recurring revenue it has already recognized from Flex adopters. The pipeline of signed-but-unconverted dollars is no longer measurable from outside the company.

What is still measurable argues the book is in good order. Contracted revenue not yet recognized stood at $10.7bn at the end of July against $7.2bn a year earlier, and the quarter added a record $332.8m of net new annual recurring revenue. The month's selling was sector-wide, and after it the shares still fetch 51.9x forward gross profit, roughly twice what Palo Alto commands. The markdown repriced growth; it did not catch a conversion problem.

CRWDPANWFTNTZSNOWCRMSNOWPLTROKTAEndpoint Security PlatformsCybersecurity ConsolidationEnterprise SaaS MultiplesRecurring Revenue DisclosurePlatform Module Attach
TickerCompanySegmentTrend · 13mo30D1Y
The subject · what this brief is about
CRWDCrowdStrikeCybersecurity & Threat Protection🔴 Cont. Bear−13.1%−58.0%
Compared against · context, not the story
PANWPalo Alto NetworksCybersecurity & Threat Protection🟢 Cont. Bull−16.7%+59.7%
FTNTFortinetCybersecurity & Threat Protection🟢 Cont. Bull−33.4%+55.3%
ZSZscalerCybersecurity & Threat Protection🟢 Cont. Bull−16.3%−38.9%
NOWServiceNowSales, Service & Customer Management🟢 Cont. Bull−29.2%−41.5%
CRMSalesforceSales, Service & Customer Management🌱 Emerging Bull−9.5%−10.8%
SNOWSnowflakeData, Analytics & Intelligence🟢 Cont. Bull−16.0%+11.6%
PLTRPalantir TechnologiesData Platforms & Databases🟢 Cont. Bull−17.5%−6.8%
OKTAOktaIdentity & Access Management🟢 Cont. Bull−19.4%+118.0%

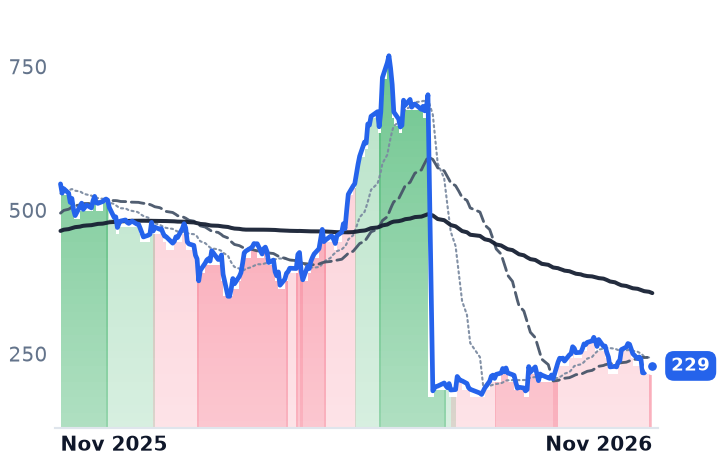
12-month price & trend

CRWD
CrowdStrike
229
+3.30 (+1.46%)
vs. prior close
Price20d50d150d
CRWD 12-month price
Cybersecurity & Threat Protection
PANW
Palo Alto Networks
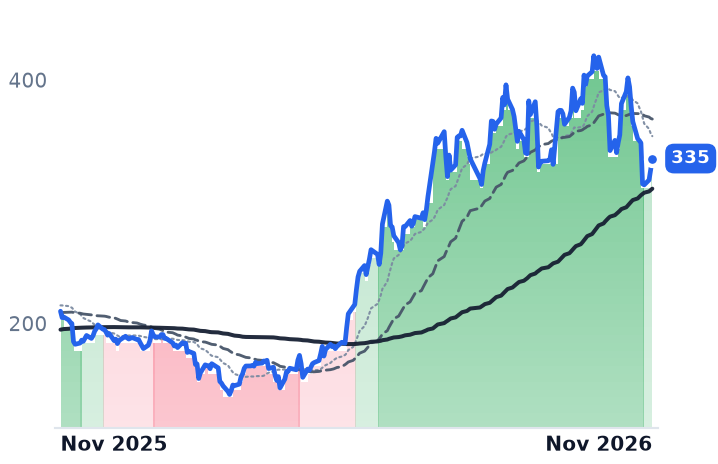
335
+9.09 (+2.79%)
vs. prior close
Price20d50d150d
PANW 12-month price
Cybersecurity & Threat Protection
FTNT
Fortinet
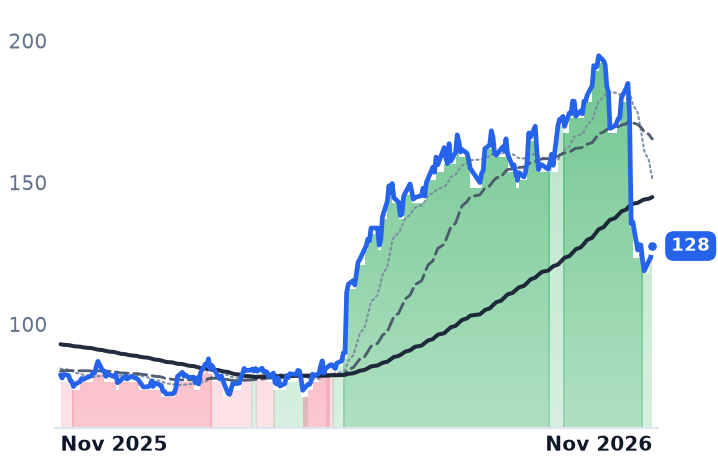
128
+4.03 (+3.26%)
vs. prior close
Price20d50d150d
FTNT 12-month price
Cybersecurity & Threat Protection
TickerMkt capP/EP/E fwdP/SP/S fwdP/GPP/GP fwdEV/EBITDAFCF yld
CRWD$234.5B—182.7x43.5x39.0x57.8x51.9x527.3x0.7%
PANW$256.9B682.3x75.0x22.4x18.1x31.8x25.8x166.8x1.6%
FTNT$94.1B41.3x36.0x11.9x11.5x15.0x14.4x30.7x3.6%
ZS
Zscaler
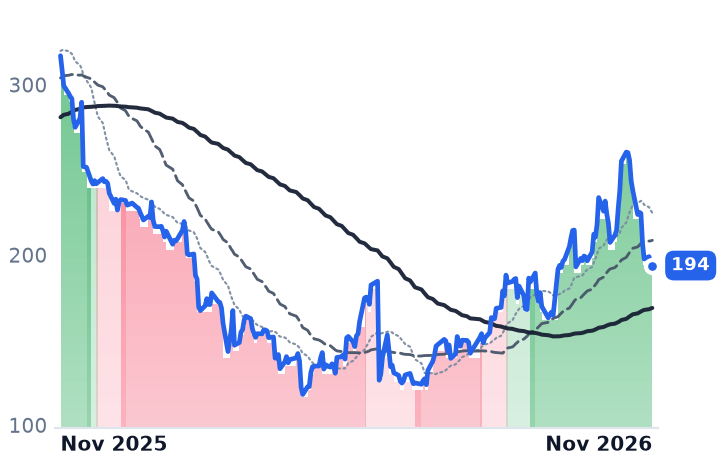
194
−1.12 (−0.58%)
vs. prior close
Price20d50d150d
ZS 12-month price
Cybersecurity & Threat Protection
NOW
ServiceNow
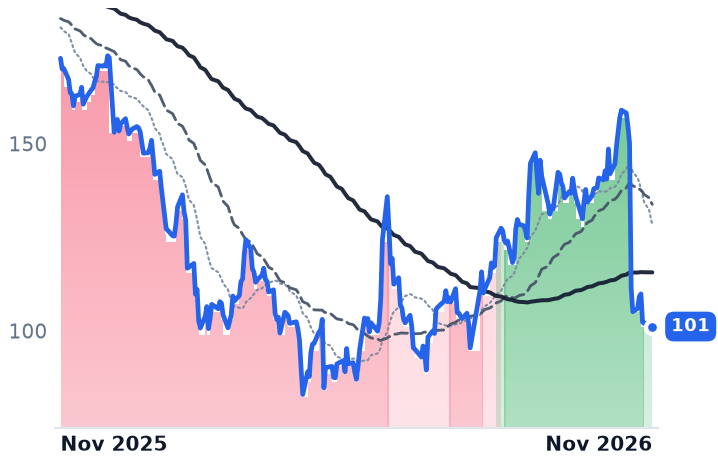
101
+1.54 (+1.54%)
vs. prior close
Price20d50d150d
NOW 12-month price
Sales, Service & Customer Management
CRM
Salesforce
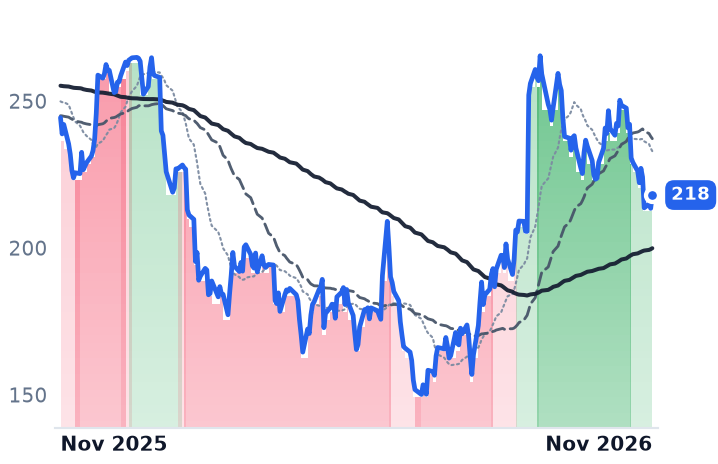
218
+4.53 (+2.12%)
vs. prior close
Price20d50d150d
CRM 12-month price
Sales, Service & Customer Management
TickerMkt capP/EP/E fwdP/SP/S fwdP/GPP/GP fwdEV/EBITDAFCF yld
ZS$31.6Bn/m39.7x9.4x8.0x12.3x10.5x174.4x2.5%
NOW$105.8B72.8x25.8x6.9x6.5x9.4x8.9x32.6x4.5%
CRM$175.8B19.4x12.8x4.0x3.8x5.2x4.9x12.5x8.6%
SNOW
Snowflake
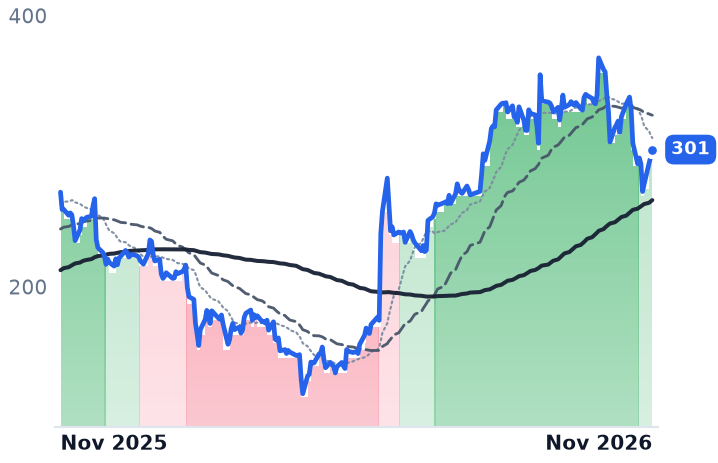
301
+5.46 (+1.85%)
vs. prior close
Price20d50d150d
SNOW 12-month price
Data, Analytics & Intelligence
PLTR
Palantir Technologies
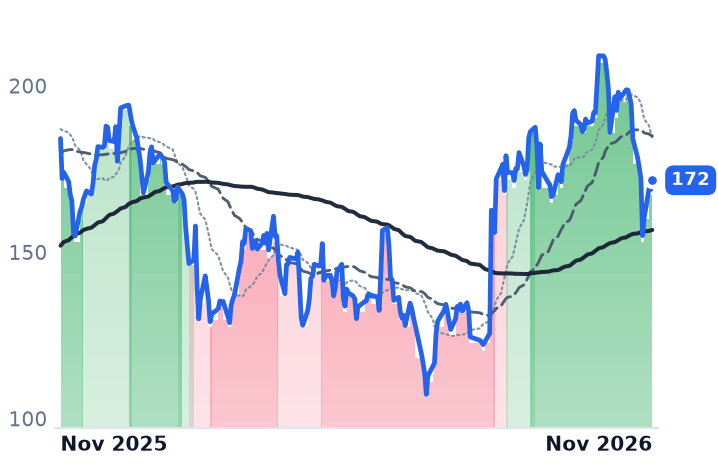
172
+2.81 (+1.66%)
vs. prior close
Price20d50d150d
PLTR 12-month price
Data Platforms & Databases
OKTA
Okta
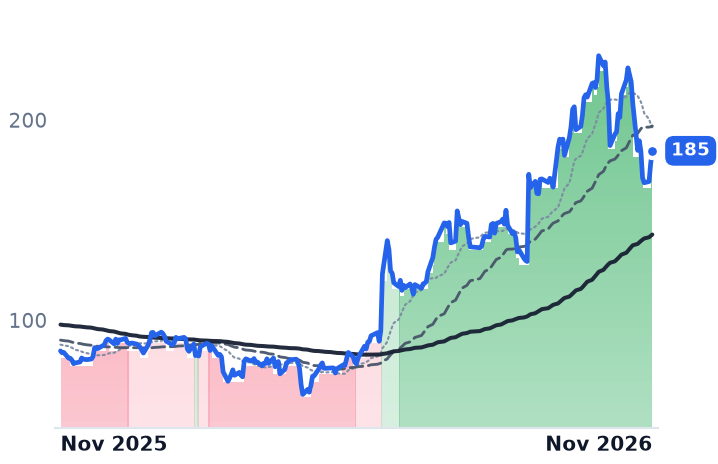
185
+6.27 (+3.52%)
vs. prior close
Price20d50d150d
OKTA 12-month price
Identity & Access Management
TickerMkt capP/EP/E fwdP/SP/S fwdP/GPP/GP fwdEV/EBITDAFCF yld
SNOW$97.3Bn/m124.4x17.9x15.4x26.7x23.0xn/m1.2%
PLTR$394.9B136.5x108.2x64.2x48.6x75.7x57.3x126.8x0.9%
OKTA$28.2B99.8x42.9x9.2x8.7x11.7x11.2x66.7x3.4%

Consensus projections

TickerFY2026EFY2027EFY2028E
CRWDRevenue+22.2%+25.1%+22.9%
EPS−1.2%+35.0%+27.9%
PANWRevenue+24.3%+24.0%+14.3%
EPS+15.5%+10.7%+16.1%
FTNTRevenue+21.0%+11.4%+11.0%
EPS+32.3%+9.2%+12.8%
ZSRevenue+25.2%+17.9%+16.3%
EPS+29.2%+18.3%+14.8%
NOWRevenue+22.6%+18.5%+18.1%
EPS+13.5%+21.6%+22.2%
CRMRevenue+9.3%+11.5%+9.9%
EPS+17.4%+42.3%−4.1%
SNOWRevenue+29.4%+35.7%+29.0%
EPS+72.3%+82.9%+36.4%
PLTRRevenue+86.1%+49.3%+48.2%
EPS+122.1%+42.4%+50.3%
OKTARevenue+12.0%+10.8%+9.9%
EPS+24.3%+14.1%+10.6%

Forward fiscal years only. Blank means no analyst coverage for that year.

CrowdStrike sells most of its new business through a pooled commitment called Falcon Flex: an enterprise signs up for a multi-year dollar amount, then draws modules against it later as it needs them, from endpoint and identity protection to cloud workload defense and log management. Earlier in this cycle the company told investors how large that committed pool had become. It no longer does.

The intuitive reading of a de-rating at a company that signs commitments before it recognizes revenue is that the commitments have stopped converting. The filings argue the reverse. Remaining performance obligations, the contracted revenue CrowdStrike has booked but not yet earned, reached $10.7bn at 31 July 2026 against $7.2bn a year earlier. Revenue over the same span grew 26%. About 46% of that balance, roughly $4.9bn, is due to be recognized within twelve months.

Four quarters of going faster, not slower

Quarterly revenue growth has accelerated in each of the last four periods, from 22.2% to 23.3%, then 25.6% and 25.8%, on revenue of $1.471bn in the July quarter. Annual recurring revenue reached $5.84bn, up 25%, with a record $332.8m of net new ARR added in the quarter, itself up 51%. The full-year outlook for net new ARR was raised by 630 basis points, to a $1.350bn-$1.359bn range implying about 34% growth. Gross margin widened to 74.6% from 73.5%.

"Q2 was the best quarter in CrowdStrike's history," founder and chief executive George Kurtz said in the 26 August 2026 release. "Delivering record Falcon Flex results, record net new ARR, and accelerating growth—the Falcon is soaring."

What a Flex customer's bill does after signing

The conversion ladder is disclosed as uplift rather than dollars. Moving a standard subscription onto Flex lifts that account's ending ARR by more than 40% on average; a first re-commitment adds a further 25%; accounts that have re-committed at least twice carry ARR 53% above where their first Flex began. By the company's September investor briefing about 630 accounts had re-committed, six times the prior year, with the first re-commitment typically arriving around eight months into a multi-year contract. More than 935 Flex accounts were added in the July quarter alone, more than the prior three quarters combined.

That consolidation pitch rests on a real position: third-party estimates put CrowdStrike at roughly 22.7% of endpoint protection, against Microsoft Defender's 15.6% and SentinelOne's 11.5%, with its strength concentrated in large cloud-first estates.

The numbers that stopped being published

Flex total deal value, the committed-dollars headline, was last quantified at more than $3.2bn in the April-2025 quarter, up more than sixfold. Its replacement is ending ARR from accounts that have adopted Flex, which passed $2.29bn at 31 July and grew 101%. That is a recognized measure, so the gap between dollars committed and dollars converted has left the public record. The five-or-more-module adoption rate, 67% as of 31 January 2025, is gone too; the disclosures now run 51% of subscription customers on six or more modules, 35% on seven and 26% on eight. A quarterly net retention percentage is no longer given, only the statement that gross and net retention both increased.

Cash is the one check that does not depend on management's framing, and it holds: free cash flow of $377m, 26% of revenue, with the full year guided to at least 30%. Stock compensation ran at about $377m in the same quarter, which is why GAAP net income was $5.3m and why sales and gross profit are the anchors that mean anything here.

A month of selling that came from outside the company

The worst session was 5 November, when the close fell 9.9% and Palantir, CrowdStrike and Okta all dropped about 10% as investors cut exposure to the data-center build-out after the Democratic congressional sweep. Three days earlier Deutsche Bank had upgraded the stock to Buy and raised its target to $300 from $240. On 29 October, Fortinet and ServiceNow both beat revenue estimates and were sold hard anyway. Over 30 days CrowdStrike's 12.9% decline was the third-smallest among the seven software and security names on this shelf, and the stock is still up 4.7% over three months.

So almost none of the fall traces to the business, and the compression has not undone much. At 57.8x trailing gross profit, CrowdStrike is dearer than the 48.4x it fetched in late July, and 51.9x forward. Palo Alto, which sells firewalls plus subscription services to large enterprises and governments, trades at 25.8x forward gross profit; Fortinet, whose FortiGate hardware business earned a 30.6% operating margin in the September quarter, at 14.4x; Zscaler, selling cloud-delivered secure access per user on 24.9% growth and a 76.7% gross margin, at 10.5x. CrowdStrike costs twice the nearest of them. The markdown repriced the growth; it did not find a flaw in the conversion.

What an owner is paying for, then, is a conversion engine whose best evidence is now a thickening order book and management's description of it. The next test of both arrives on 1 December, after the US close.

IDT Added Eight Dollars of Gross Profit in Payments for Every One Its Calling Book Lost

Hypothesis Opus 5 · Research Opus 5 · Writing Opus 5 · Prompt v1.7

A company still classified as a telecom operator now makes almost all of its profit growth selling checkout terminals and remittances to corner stores, and the market repriced it in a single session after the annual results.

IDT's fiscal 2026, ended 31 July, lifted group gross profit to $496.8m while the international-calling business it is managing down shed only a small fraction of that. NRS, its convenience-store terminal network, raised average monthly gross profit per retailer location to $383 from $315, and group adjusted EBITDA rose 17% to $154.6m.

The operating record supports the story; the share price has outrun it. The trailing earnings multiple has gone from roughly 16x in May to 24.0x while trailing earnings per share rose about 6%, so most of the six-month gain is re-rating. The peers in the same industry classification do not share the mechanism: Ituran is in a downtrend and Ooma buys its growth.

IDTOOMAITRNATEXSMB Payment TerminalsCross-Border RemittancesIn-Store Retail MediaLegacy Voice DeclineConvenience Retail TechValuation Re-Rating
TickerCompanySegmentTrend · 13mo30D1Y
The subject · what this brief is about
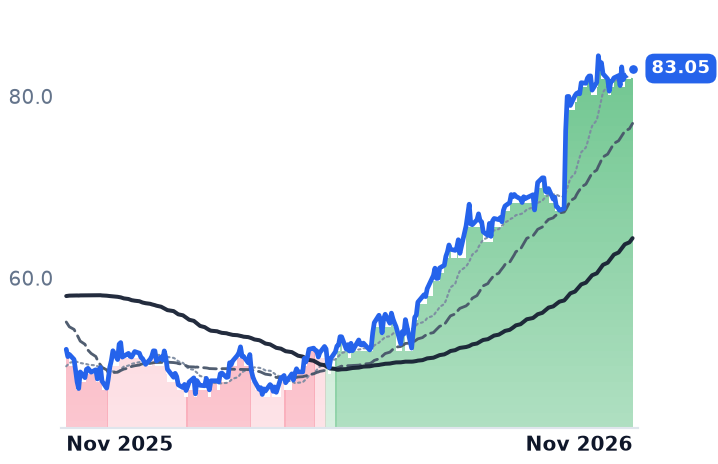
IDTIDTRegional & Specialty Operators🟢 Cont. Bull+1.3%+59.2%
Compared against · context, not the story
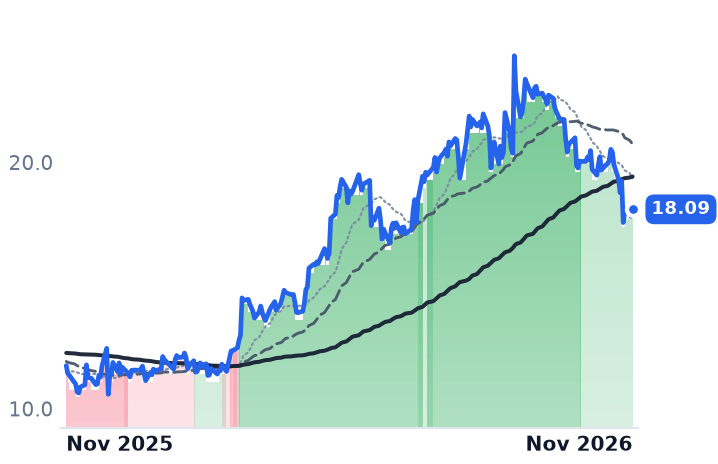
OOMAOomaRegional & Specialty Operators🟢 Cont. Bull−10.5%+54.0%
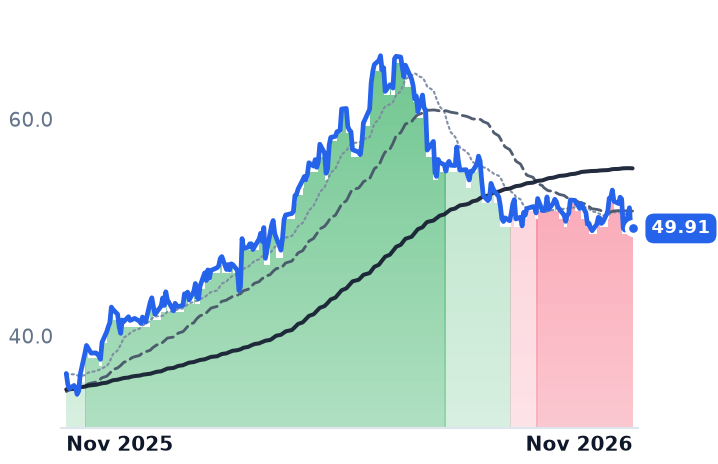
ITRNIturan Location and ControlRegional & Specialty Operators⚠️ Emerging Bear−0.8%+36.7%
ATEXAnterixRegional & Specialty Operators🟢 Cont. Bull−13.5%+298.7%

12-month price & trend

IDT
IDT
83.05
−0.17 (−0.20%)
vs. prior close
Price20d50d150d
IDT 12-month price
Regional & Specialty Operators
OOMA
Ooma
18.09
+0.28 (+1.60%)
vs. prior close
Price20d50d150d
OOMA 12-month price
Regional & Specialty Operators
ITRN
Ituran Location and Control
49.91
+0.27 (+0.54%)
vs. prior close
Price20d50d150d
ITRN 12-month price
Regional & Specialty Operators
TickerMkt capP/EP/E fwdP/SP/S fwdP/GPP/GP fwdEV/EBITDAFCF yld
IDT$2.1B24.0x19.7x1.6x1.6x4.2x4.1x11.9x3.3%
OOMA$505.1M46.4x13.4x1.6x1.5x2.7x2.5x18.6x6.0%
ITRN$987.0M15.4x13.9x2.5x2.4x5.0x4.7x8.4x8.4%
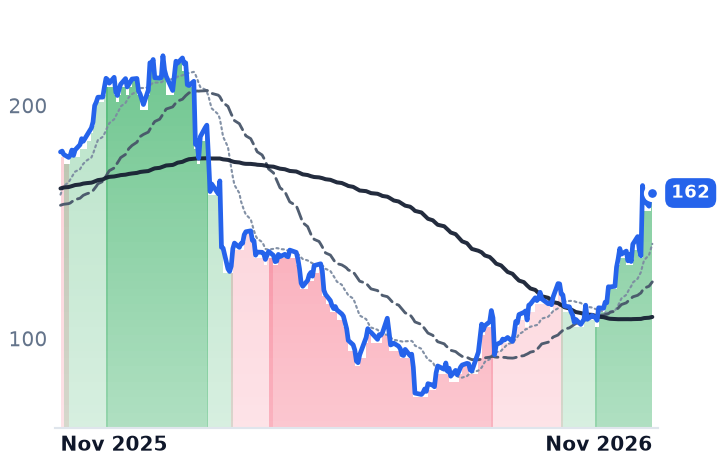
ATEX
Anterix
73.17
−2.31 (−3.05%)
vs. prior close
Price20d50d150d
ATEX 12-month price
Regional & Specialty Operators
TickerMkt capP/EP/E fwdP/SP/S fwdP/GPP/GP fwdEV/EBITDAFCF yld
ATEX$1.5B190.1x—201.5x69.3x201.5x69.3x204.4x-0.5%

Consensus projections

TickerFY2026EFY2027EFY2028E
IDTRevenue+4.3%+4.0%+0.8%
EPS+18.1%+9.6%+5.7%
OOMARevenue+5.6%+22.9%+4.8%
EPS+64.6%+36.7%+9.7%
ITRNRevenue+16.5%+5.4%+7.5%
EPS+23.8%+8.6%+9.4%
ATEXRevenue−2.2%+256.4%−9.5%
EPS−316.3%−112.0%+57.6%

Forward fiscal years only. Blank means no analyst coverage for that year.

IDT Corporation closed its fiscal year on 31 July with the shrinking half of its business finally mattering less than the growing half. Group gross profit reached $496.8m, an increase of $50.6m, while the Traditional Communications segment, prepaid international calling and wholesale voice and still two-thirds of revenue, gave up about $6.8m of gross profit, a 4% decline per the annual report. The Newark, New Jersey company added roughly eight dollars of gross profit in its growth units for every dollar the legacy book lost.

That arithmetic is what the market bought on 29 September, the session after the print, when the stock gapped 12.7% to $76.20 on volume six times the prior day's. The quarter was read as proof that a melting telecom shell had become a payments and software group. It is proof of that. What it does not establish is the price: the shares have risen 59% in six months, and with trailing earnings per share up about 6% over that span, a derived split puts roughly 50 of those 59 points in multiple expansion, from near 16x trailing earnings in May to 24.0x now.

The terminal in the corner store is the whole engine

NRS sells point-of-sale terminals, card processing and in-store advertising to independent convenience, liquor, tobacco and gas-station retailers. It ended the year with 35,400 retailer locations, 2,700 more than a year earlier, and about 95% of its revenue recurring. Revenue rose 24% to $159.4m and segment gross profit was $146.6m on 12.3% of group revenue: the margin structure of a software business attached to a hardware socket.

Both axes of unit economics moved at once. Average monthly gross profit per retailer location rose 22% to $383 from $315 a year earlier, driven primarily by adoption of NRS Pay, the payment-processing product, with revenue per terminal up about 10%. Fourth-quarter merchant services rose 31% to $28.5m and segment adjusted EBITDA rose 47% to $14.0m at a 31% margin.

The advertising leg is the soft spot. It grew 49% to $10m in the fourth quarter but declined for the full year, because industry ad rates fell as streaming services launched ad-supported tiers and flooded digital inventory. The data underneath it is real: in March, NRS terminals processed $2.2bn of sales across 145m transactions.

NRS is also the smallest player in a market with giants in it. Fiserv's Clover holds roughly 20% of small-restaurant point-of-sale card processing across about 175,000 locations, with Block's Square and Lightspeed alongside. NRS's defense is the independent bodega, where it describes itself as the leading network in the United States and Canada.

Remittances got a tax break; calling got the bill

Fintech, which is 90% BOSS Money remittances, grew revenue 14% to $176.0m with gross margin up 650 basis points to 66% and digital at 88% of fourth-quarter transactions. A federal excise tax enacted in the One Big Beautiful Bill Act charges 1% on transfers funded with cash, money orders or cashier's cheques while exempting electronic funding, a rule that pushes customers toward IDT's higher-margin channel. Management expects the same shift to cost it roughly 17% of the retail PIN-less business.

"The rotation toward our high-margin growth businesses is accelerating. Our top line is growing faster, and we are entering fiscal '27 debt-free with a stronger balance sheet and a lot of momentum," chief financial officer Marcelo Fischer told investors on the 28 September earnings call.

The filing names a cause for the legacy decline. BOSS Revolution calling revenue fell 16% year on year in the April quarter as unlimited plans and free over-the-top voice and messaging cut demand for prepaid minutes. Segment adjusted EBITDA still rose 1% to $77m, because selling costs were cut 6%.

net2phone, the cloud phone unit, is the third leg and the weakest competitively: 447,000 seats, up 6%, with subscription revenue near $94.6m, up about 10%, and segment EBITDA up 33% to $16.1m. Worldwide unified-communications seats totalled roughly 114m in the first half of 2025, with Microsoft at 21.7%, so net2phone's installed base is about 0.4% of the market. Its growth is footprint, not displacement.

What the results carry and what they do not

NRS, Fintech and net2phone now produce 53% of consolidated adjusted EBITDA on about a third of revenue, against 46% a year earlier, and group adjusted EBITDA rose 17% to a record $154.6m. Gross margin widened in each of the four quarters, 36.6% to 39.8%. Buybacks are beside the point: 422,000 shares for $21m cut the diluted count 1.1%, about one point of the 15% rise in earnings per share. The gain came from operations.

The valuation is where the story stops agreeing with itself.

At 11.9x trailing enterprise value to EBITDA, IDT is no longer cheap against Ituran Location and Control, the Israeli stolen-vehicle-recovery and fleet-telematics subscriber business, at 8.4x and 15.4x trailing earnings. Ooma, the Sunnyvale small-business cloud phone provider that competes directly with net2phone, grew subscription revenue to $75.6m from $61.1m, but primarily through the December 2025 purchases of FluentStream and Phone.com; on price to gross profit it sits at 2.68x against IDT's 4.15x. IDT's forward 19.7x rests on a single analyst's estimate whose implied EBITDA is below the company's own guidance of $176-180m, against gross profit guided to $545-555m.

The companies filed under the same industry heading are not running the same business or the same chart. Ituran, which has not reported since its 12 August beat and releases third-quarter results on 24 November, has fallen 18% in six months on de-rating rather than disclosed deterioration. Anterix, in the same heading, is a spectrum-licensing asset story with $1.96m of quarterly revenue. The thirty-day weakness around them tracks the discount rate, with the 10-year Treasury yield back at 5.00% and the Russell 2000 in correction since mid-October, a channel that works through borrowing costs. IDT, debt-free with $271.9m of cash and securities, does not pay them.

The company has also retired the metric that let outsiders check its best story. NRS is shifting disclosure to retailer locations and monthly gross profit per location and dropping the terminal recurring-revenue series, so the next test of whether $383 a month keeps climbing will be a number IDT alone defines.

Accenture Prices Two-Thirds of New Bookings in Advance and Keeps the AI Savings

Hypothesis Opus 5 · Research Opus 5 · Writing Opus 5 · Prompt v1.7

Three IT services companies tell clients the same story about AI making delivery cheaper. Only the one whose work is priced before the hours are worked gets to keep the money, and the market is paying the highest price per dollar of delivery profit for the one that has conceded it is handing the saving back.

Accenture closed fiscal 2026 with record new bookings of $84.54bn and operating income up 11.5% on revenue up 6.5%. Infosys's AI work reached 10.5% of revenue while total revenue grew 1.5% and full-year guidance was cut. Cognizant sits between them: adjusted operating margin at a four-year high, quarterly bookings down.

Accenture's order book accounts for its advance. Infosys, at 8.07x trailing gross profit against Accenture's 6.31x, is the dearest of the three per dollar of delivery profit.

ACNCTSHINFYEPAMGGLOBWITITNVDASPYFixed-Price ContractingEnterprise AI DeliveryIT Services MarginsManaged Services OutsourcingConsulting Bookings CycleOffshore Delivery Pyramid
TickerCompanySegmentTrend · 13mo30D1Y
The subject · what this brief is about
ACNAccentureConsulting & Professional Services🌱 Emerging Bull+17.8%+5.0%
CTSHCognizant Technology SolutionsConsulting & Professional Services🌱 Emerging Bull+4.1%−12.3%
INFYInfosysConsulting & Professional Services🔴 Cont. Bear+6.9%−28.0%
Compared against · context, not the story
EPAMEPAM SystemsConsulting & Professional Services🌱 Emerging Bull+40.5%−9.8%
GGenpactConsulting & Professional Services🌱 Emerging Bull+20.4%−5.4%
GLOBGlobantConsulting & Professional Services🔴 Cont. Bear+24.2%−23.3%
WITWiproConsulting & Professional Services🔴 Cont. Bear+18.5%−20.5%
ITGartnerResearch & Analytics Services🌱 Emerging Bull−5.4%−18.8%
NVDANVIDIAProcessors & Accelerators🟢 Cont. Bull−22.7%−10.4%
SPYState Street SPDR S&P 500 ETF TrustAsset Management🟢 Cont. Bull−1.9%+12.1%

12-month price & trend

ACN
Accenture
254
−4.85 (−1.88%)
vs. prior close
Price20d50d150d
ACN 12-month price
Consulting & Professional Services
CTSH
Cognizant Technology Solutions
64.43
−0.57 (−0.88%)
vs. prior close
Price20d50d150d
CTSH 12-month price
Consulting & Professional Services
INFY
Infosys
12.30
−0.29 (−2.30%)
vs. prior close
Price20d50d150d
INFY 12-month price
Consulting & Professional Services
TickerMkt capP/EP/E fwdP/SP/S fwdP/GPP/GP fwdEV/EBITDAFCF yld
ACN$149.9B18.6x17.3x2.0x1.9x6.3x6.0x11.3x7.8%
CTSH$28.8B11.7x11.2x1.3x1.3x4.1x4.1x7.2x8.2%
INFY$49.9B15.2x15.3x2.5x2.4x8.1x8.0x10.0x7.3%
EPAM
EPAM Systems
162
−1.66 (−1.01%)
vs. prior close
Price20d50d150d
EPAM 12-month price
Consulting & Professional Services
G
Genpact
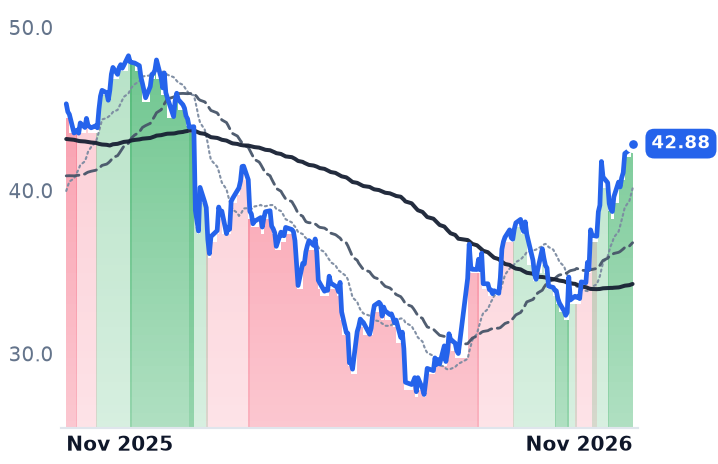
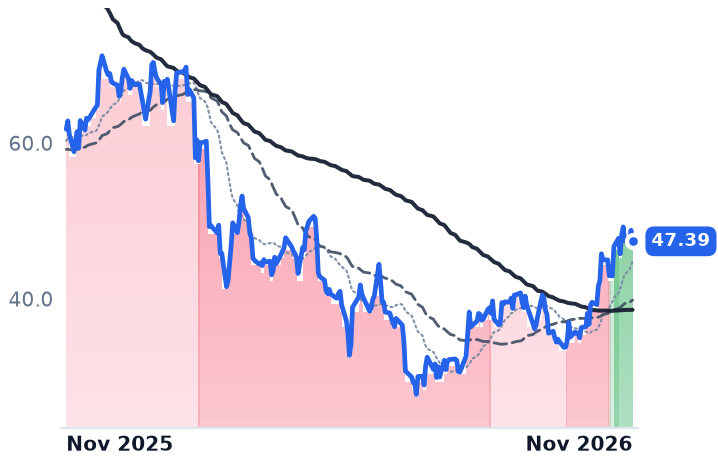
42.88
−0.19 (−0.45%)
vs. prior close
Price20d50d150d
G 12-month price
Consulting & Professional Services
GLOB
Globant
47.39
−1.42 (−2.92%)
vs. prior close
Price20d50d150d
GLOB 12-month price
Consulting & Professional Services
TickerMkt capP/EP/E fwdP/SP/S fwdP/GPP/GP fwdEV/EBITDAFCF yld
EPAM$8.2B19.9x12.1x1.5x1.5x5.0x5.0x10.0x5.7%
G$7.0B11.9x10.0x1.3x1.3x3.5x3.5x7.7x5.1%
GLOB$2.0B18.4x8.0x0.8x0.8x2.6x2.6x7.9x15.6%
WIT
Wipro
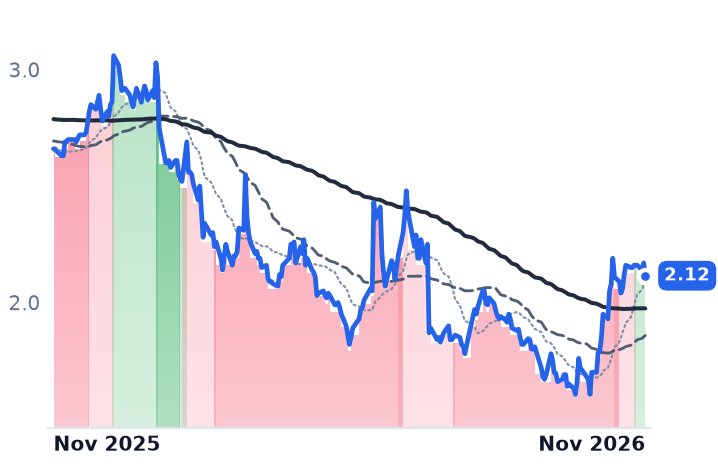
2.12
−0.06 (−2.53%)
vs. prior close
Price20d50d150d
WIT 12-month price
Consulting & Professional Services
IT
Gartner
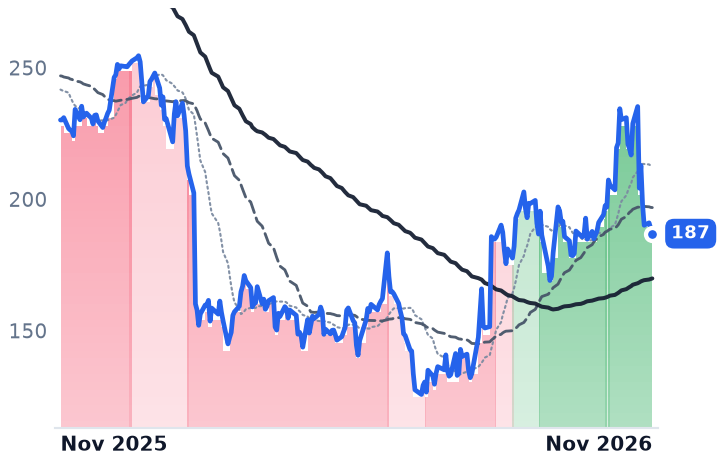
187
−2.02 (−1.07%)
vs. prior close
Price20d50d150d
IT 12-month price
Research & Analytics Services
NVDA
NVIDIA
174
+4.84 (+2.87%)
vs. prior close
Price20d50d150d
NVDA 12-month price
Processors & Accelerators
TickerMkt capP/EP/E fwdP/SP/S fwdP/GPP/GP fwdEV/EBITDAFCF yld
WIT$21.4B15.5x—2.0x—7.0x—10.1x8.4%
IT$12.4B17.5x13.5x1.9x1.9x2.8x2.8x10.6x10.4%
NVDA$5.5T34.3x25.0x21.5x13.9x29.0x18.7x28.3x2.2%
SPY
State Street SPDR S&P 500 ETF Trust
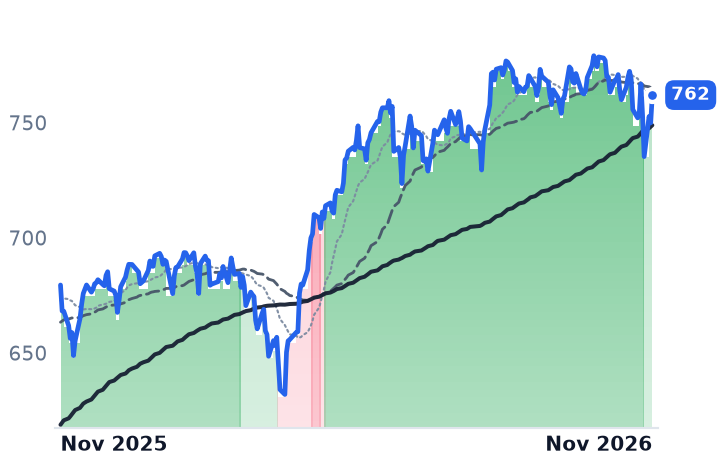
762
+12.07 (+1.61%)
vs. prior close
Price20d50d150d
SPY 12-month price
Asset Management
TickerMkt capP/EP/E fwdP/SP/S fwdP/GPP/GP fwdEV/EBITDAFCF yld
SPY$773.0B————————

Consensus projections

TickerFY2026EFY2027EFY2028E
ACNRevenue+6.0%+5.3%+5.1%
EPS+7.6%+5.9%+8.7%
CTSHRevenue+4.8%+3.8%+4.3%
EPS+11.2%+8.6%+7.9%
INFYRevenue+1.6%+5.4%+3.2%
EPS+2.4%+5.3%+4.5%
EPAMRevenue+3.9%+3.4%+4.7%
EPS+15.1%+6.9%+7.2%
GRevenue+7.2%+7.1%+7.9%
EPS+13.9%+9.4%+10.7%
GLOBRevenue−0.3%+2.0%+3.2%
EPS−3.0%+4.1%+3.8%
WITRevenue+5.4%+7.5%+2.8%
EPS+4.6%+5.1%+3.6%
ITRevenue−1.2%+4.2%+5.1%
EPS+13.2%+13.8%+14.8%
NVDARevenue+65.1%+84.2%+43.2%
EPS+59.0%+91.7%+42.0%

Forward fiscal years only. Blank means no analyst coverage for that year.

Accenture closed its fiscal year on 1 October with the biggest order book in its history, and the term that matters inside it is not a growth rate but a pricing clause. Fixed-price and outcome-based work now exceeds 65% of new bookings, which means scope delivered in fewer hours than quoted leaves the saving in Accenture's own gross profit instead of in a smaller invoice.

For a year the market treated enterprise IT services as generative AI's clearest casualty: if the model writes the code, the firm that bills for the coder loses the hour. All three of the largest listed names have now reported inside five weeks. Their disclosures say the hour is not the variable that decides. Contract form is, and it splits them — Accenture keeps the productivity gain, while Infosys has told investors it is passing it through.

The half of the book where price is agreed first

Accenture's fiscal 2026 new bookings were an all-time high $84.54bn, up 5%, at a book-to-bill of 1.1. Inside the fourth quarter the mix is the finding: managed services, the outsourcing half where price is contracted in advance, took $12.77bn of bookings at a book-to-bill of 1.4, against consulting's $9.40bn at exactly 1.0. The firm signed 141 deals of $100m or more in the quarter against 129 a year earlier.

That shows up where it should. Fiscal 2026 revenue of $74.18bn rose 6.5% while operating income rose 11.5%, with gross margin at 32.05% against 31.91%. "We continue to believe the opportunities related to AI are greater than the impact of AI-related efficiencies in our business," chair and chief executive Julie Sweet told investors on 1 October.

The caution is in the guide. Accenture's fiscal 2027 outlook of 3-6% local-currency growth includes 2-2.5 points from acquisitions, leaving roughly 2-2.5% organic at the midpoint, a step down from fiscal 2026's 5%. Capability is being bought: $4.9bn spent on acquisitions in fiscal 2026, around $5bn more planned. At 17.3x forward earnings against 12.3x in mid-August, almost the whole three-month re-rating is the multiple rather than the estimates.

Cognizant's margin gain is not coming from delivery

Cognizant's adjusted operating margin reached 16.3% in the third quarter, a seventh consecutive year-on-year expansion, while GAAP operating margin of 15.4% fell 60 basis points. Below that headline, gross margin slipped to 33.77% from 33.87% and gross profit grew 4.3% against revenue's 4.6%. The engagement itself got no more profitable; the gain arrived from costs below the delivery line, where Project Leap restructuring is worth about $200m this year.

The pyramid got both busier and bigger: utilisation excluding trainees rose to 86% from 85% and headcount reached 359,900 at 30 September. Fixed-price and transaction work is now nearly 58% of revenue, up some 500 basis points since 2022. But third-quarter bookings fell 7% year on year and 2026 constant-currency guidance was cut to 4.0-4.4% from 4.0-5.5%. "The rebaselining of productivity has already happened to a large extent," chief executive Ravi Kumar said on 29 October. Cognizant is the cheapest of the three at 11.2x forward earnings and 4.11x trailing gross profit.

Infosys put a number on the giveback

Infosys disclosed AI revenue at 10.5% of the total in the September quarter, up from 8.2%. Applying those shares to reported revenue implies AI work grew by about $124m sequentially, to roughly $541m, while consolidated revenue rose only about $70m: the non-AI book shrank some $54m in the same three months. Group revenue of $5.152bn was up 1.5%.

The order intake is not the problem. "We won 19 large deals in Q2 with a TCV of $5.2 billion, which is second highest quarterly TCV in last five years. Of this, 62% was net new," chief financial officer Jayesh Sanghrajka said on 23 October. Price is. "Growth was below our expectations. Volume was softer, and price increases were lower than anticipated amidst high competitive intensity," he said the same day. Infosys cut fiscal 2027 growth guidance to 1-2% from 1.5-3%, and the company's own list of second-half margin pressures includes "continued sharing of AI driven productivity benefits." It walked away from work worth 1.8-2% of fiscal 2027 revenue rather than match the givebacks clients asked for.

Headcount rose 4,400 in the quarter and annualised revenue per employee, derived from reported revenue and disclosed staff numbers, was flat near $62,700. The growth came from heads. Infosys is also the only one of the three whose forward earnings multiple, 15.3x, sits above its trailing 15.2x, and at 8.07x trailing gross profit it is dearer per dollar of delivery profit than Accenture at 6.31x.

What the autumn bid actually bought

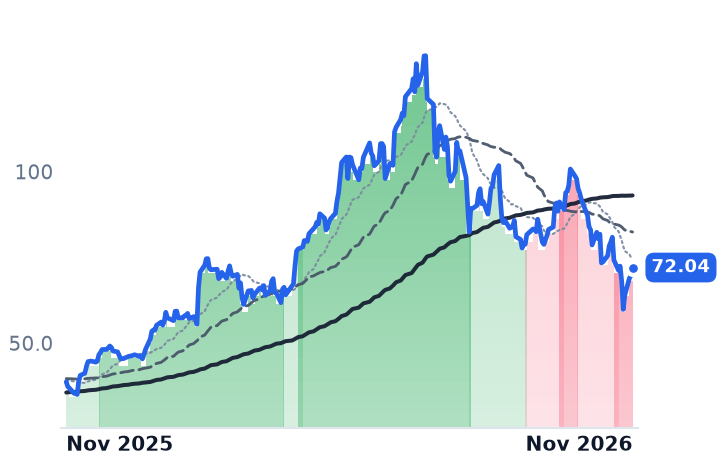
Accenture has risen 18.1% over 30 days to 11 November and 42.7% over three months, including a 15.9% session on its results, yet it is up only 4.6% on the year. Cognizant gained 8.0% over 30 days and remains 11.9% below its level a year ago. Infosys gained 13.6%, the best of the three, while sitting 27.7% below last November. The bid is shelf-wide — EPAM rose 40.5% over the same 30 days, Globant 24.2%, Genpact 20.4% — while Gartner, which sells research rather than delivery labor, fell 5.4%. On 5 November, when Nvidia fell 10.3%, all three services names closed higher, and Indian IT shares rallied the next day against an AI-linked selloff. The likelier reading for the Infosys leg is rotation out of AI hardware rather than anything Infosys disclosed.

So one of the three moves is earned on the meters that matter. Accenture's order book and its operating leverage both inflected, and the mechanism is legible: under a contract whose price was agreed before the work, fewer hours is margin. Cognizant's improvement is real but located in restructuring rather than in the engagement, with intake shrinking behind it. Infosys has the largest single deal of the quarter and no pricing power to go with it, which is why flat revenue per employee and a cut guide sit beside the shelf's best month.

Accenture reports its first quarter on 17 December and Infosys the December quarter on 13 January. Both prints answer the same question, and it is a contractual one: when a client asks for its share of the saving, which of them is able to say no.

Alphabet Said Ads Inside Its AI Answers Earn Less Than Ads Beside Search Links

Hypothesis Opus 5 · Research Opus 5 · Writing Opus 5 · Prompt v1.7

Three companies are sold as one "AI answers kill the search box" trade, and they are paid on three incompatible meters. Only one meter is deteriorating, and it belongs to the company the market marked down least.

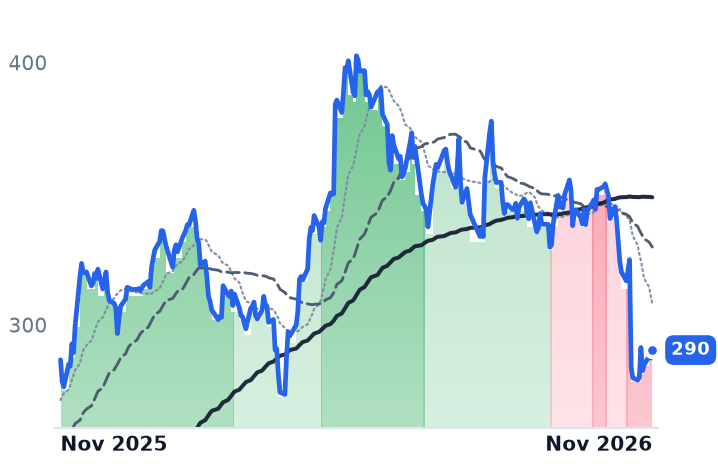
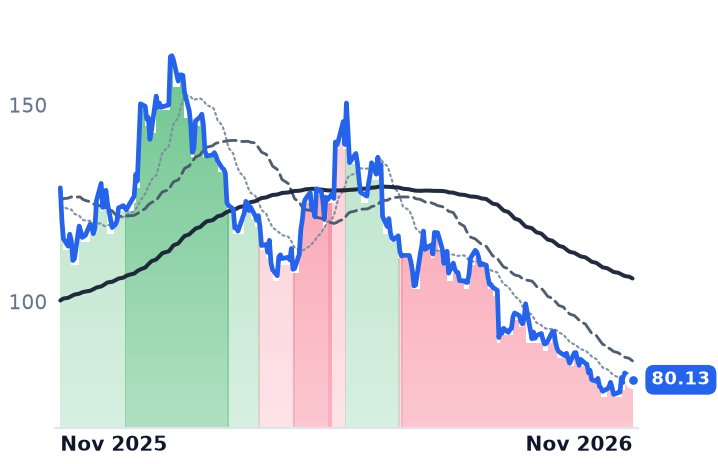
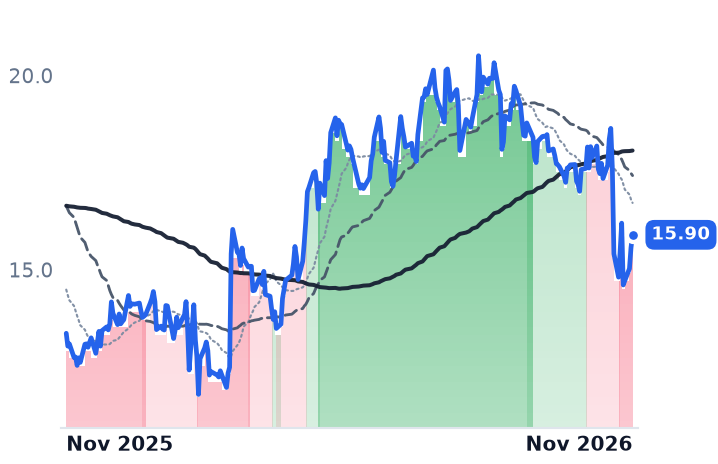
Alphabet's 28 October report put Search and other revenue up 12% to $63.35bn, with paid clicks up 8% against an 11% average over the first nine months, and its chief business officer named weaker monetization of AI Mode as one cause. The shares fell 12.6% the next session. Over the 30 sessions to 11 November Alphabet fell 17.9%, Opera 12.4% and Baidu, the only operator that has actually replaced most of its result page with generated answers, 4.7%.

Baidu's decline is doing honest work: online marketing revenue fell 19% in its June quarter. Opera's was read-through from the partner that pays it, and landed days before a quarter that beat guidance.

GOOGLBIDUOPRASearch Ad MonetizationGenerative Answer EnginesBrowser Search DealsHyperscaler CapexChina Internet AdvertisingCost-Per-Click Economics
TickerCompanySegmentTrend · 13mo30D1Y
The subject · what this brief is about
BIDUBaiduSearch Engines & Browsers🔴 Cont. Bear−4.7%−37.9%
OPRAOperaSearch Engines & Browsers🔴 Cont. Bear−12.4%+19.0%
Compared against · context, not the story
GOOGLAlphabetSearch & Advertising⚠️ Emerging Bear−17.9%+1.3%

12-month price & trend

GOOGL
Alphabet
290
+3.04 (+1.06%)
vs. prior close
Price20d50d150d
GOOGL 12-month price
Search & Advertising
BIDU
Baidu
80.13
+0.42 (+0.53%)
vs. prior close
Price20d50d150d
BIDU 12-month price
Search Engines & Browsers
OPRA
Opera
15.90
+0.33 (+2.12%)
vs. prior close
Price20d50d150d
OPRA 12-month price
Search Engines & Browsers
TickerMkt capP/EP/E fwdP/SP/S fwdP/GPP/GP fwdEV/EBITDAFCF yld
GOOGL$3.6T15.0x14.9x7.6x7.1x12.4x11.7x11.5x0.6%
BIDU$27.2Bn/m—1.4x—3.3x—46.0x-9.4%
OPRA$1.4B11.3x13.5x2.1x1.9x3.9x3.6x7.7x8.5%

Consensus projections

TickerFY2026EFY2027EFY2028E
GOOGLRevenue+24.9%+27.7%+22.5%
EPS+84.7%−23.4%+21.1%
BIDURevenue−0.8%+6.4%+10.9%
EPS−32.3%+22.6%+20.6%
OPRARevenue+22.9%+15.3%+14.1%
EPS+39.3%+23.8%+11.3%

Forward fiscal years only. Blank means no analyst coverage for that year.

Alphabet told investors on 28 October that advertising inside its AI-generated answers earns less than advertising beside a list of links. Search and other revenue grew 12% to $63.35bn in the September quarter, and Chief Business Officer Philipp Schindler named "lower monetization we were seeing in AI Mode" as one reason the line slowed, behind currency and the retail and media verticals. Management did not quantify the gap. The next session the shares fell 12.6%, the worst day in their history and about $500bn of market value, with press coverage tying the fall as much to September-quarter capital expenditure of $51.4bn, free cash flow of -$9.1bn and a halted buyback as to Search.

The belief that quarter was supposed to test is that AI answers punish whoever does not own the index. On that reading the exposed names are Opera, the Oslo browser company that hands its queries to a third-party engine for a contracted cut, and Baidu, which has spent two years converting its Chinese result page to generated answers. The month ran the other way. Over the 30 sessions to 11 November Alphabet fell 17.9%, Opera 12.4% and Baidu 4.7%, so the segment's one-month markdown is arithmetically Alphabet's.

One query, three meters

Alphabet is paid per click on inventory it controls end to end, and that meter is still rising. Paid clicks grew 8% in the September quarter against an 11% average across the first nine months of 2026, while average cost per click rose 4%. Everything around Search accelerated: group revenue rose 24.7% to $127.58bn, gross profit 24.9%, and Google Cloud doubled to $30.7bn on a backlog of $561bn. Management is expanding ads in AI Mode globally for the first time and says click-through rates on sponsored items there already match organic product listings.

Opera is not paid per query at all. It takes a contracted share of what its search partner earns, and Google is roughly 32% of Opera's revenue under an agreement that, for markets outside the United States, runs only to 31 December 2026. Advertising was $115.4m of June-quarter revenue against $62.1m of query revenue, with annualized revenue per user up 25% to $2.46. Opera fell 12.6% on 30 October, the session after Alphabet's drop, with no company news of its own. Four sessions later it pre-announced September-quarter revenue of $182.8m, up 20%, query revenue up 17%, advertising up 22% and adjusted EBITDA of $43.2m, above the guided high end, with desktop monthly active users reaching 100 million in October.

The one cannibalizing itself discloses it

Baidu's meter is the deteriorating one. Online marketing revenue fell 19% to RMB13.1bn in the June quarter while AI-powered new business reached RMB12.5bn, up 25% and now half of core revenue. The substitution is disclosed in the product itself: the share of result pages carrying AI-generated content rose from 11% in mid-May 2024 to roughly 70% of mobile searches by October 2025. The offset has not covered the hole. Group revenue fell 4.5%, gross margin compressed to 39.0% from 43.9%, net income fell 68%, and revenue has now declined year on year for four straight reported quarters with gross profit falling roughly three times as fast.

"While our online marketing business remains under pressure, the growing momentum in our core AI-powered business reaffirms Baidu's transition from an internet-centric company to an AI-first company," founder and chief executive Robin Li said on 18 August. Some of that pressure is the market's: China's digital ad spending is forecast to grow 7.5% in 2026, down from 8.7%, with budgets concentrating on closed-loop platforms.

Only one of the three markdowns is doing work

Baidu's is. Its trailing price-to-earnings multiple is unusable because trailing earnings are negative after the RMB11.2bn charge booked in the September-2025 quarter, leaving price-to-book of 0.66x as the one clean anchor: two-thirds of the carrying value of its own equity, for a business consensus expects to shrink again this year.

The other two fell for reasons their results do not carry. Alphabet trades at 12.4x trailing gross profit against 17.6x in early May, a compression of roughly 29% while that gross profit grew 24.9%; the quarter repriced the spending, not the franchise. Opera sits at 13.5x forward earnings and 7.7x trailing enterprise value to EBITDA, with a trailing free-cash-flow yield of 8.5% and a dividend of $0.80 a year, 5.0% at the current price, against consensus for FY2026 revenue up 23% and earnings per share up 39%. Neither company had reported a September quarter when the markdown happened: Baidu's lands on 16 November and Opera's full results on 17 November.

Opera's sharpest exposure sits in a calendar entry rather than a monetization rate. The contract that routes its non-US queries to Google and pays it a share of the proceeds expires at the end of December, and the company that decides what those queries are worth next year is the same one whose own bad session dragged Opera down with it.

CoreWeave's Borrowing Got Cheaper While Banks Struggled to Sell Oracle Data-Center Debt

Hypothesis Opus 5 · Research Opus 5 · Writing Opus 5 · Prompt v1.7

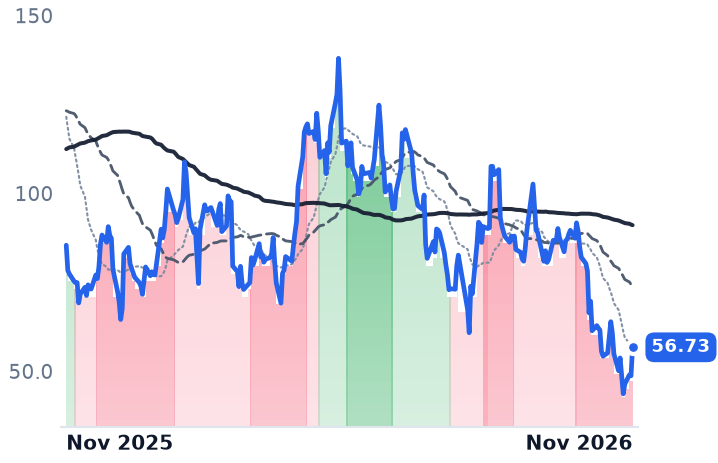
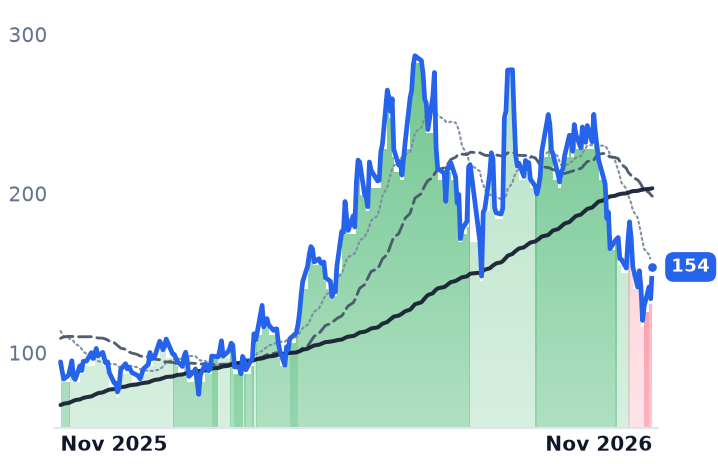
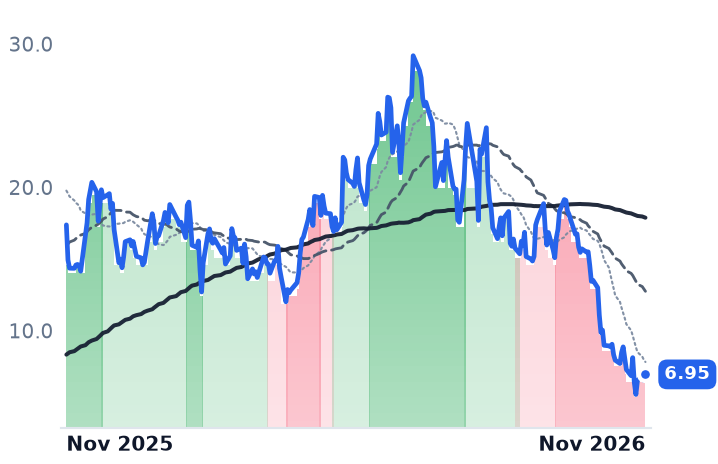
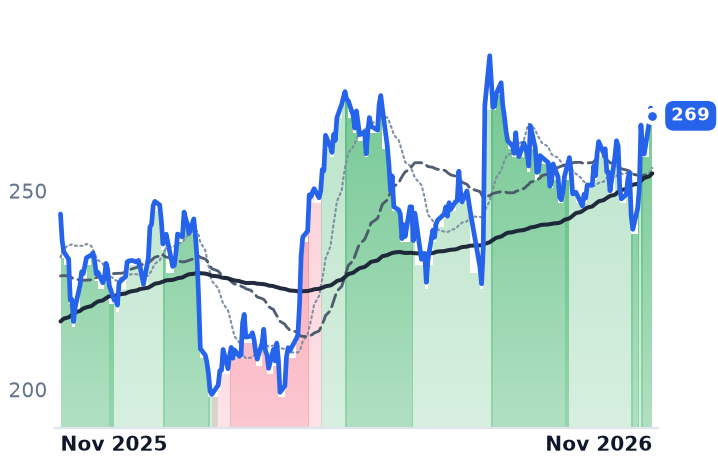
The premise under this autumn's markdown of rented-compute companies was that hyperscalers pay for data centers out of operating cash flow while the renters borrow against contracted backlog. Neither half survives the September quarter. Amazon's free cash flow was an outflow of $42.4bn over the twelve months to 30 September, with long-term debt doubled to $128.9bn, and Oracle's trailing free cash flow yield of -7.4% is the most negative of the five companies examined here; banks are still trying to place $38bn of construction debt on data centers leased to Oracle.

Meanwhile CoreWeave's weighted-average cost of debt fell to 7.9% and Cipher Mining's project bonds priced tighter across three successive deals. Lenders are sorting these borrowers by credit standing and delivery record, and the sorting does not follow size: Oracle is down 46.7% over twelve months, worse than CoreWeave.

CRWVNBISCIFRAMZNORCLMSFTMETAGOOGLAI Data-Center DebtNeocloud GPU RentalsHyperscaler Capex CycleProject Bond FinancingGPU Depreciation RiskContracted Backlog Economics
TickerCompanySegmentTrend · 13mo30D1Y
The subject · what this brief is about
CRWVCoreWeaveCloud Compute & Infrastructure🔴 Cont. Bear−27.4%−33.6%
NBISNebiusSoftware Development & Design🟢 Cont. Bull−25.3%+63.2%
CIFRCipher MiningCloud & Computing Infrastructure⚠️ Emerging Bear−37.4%−60.0%
Compared against · context, not the story
AMZNAmazon.comGeneral E-commerce Platforms🟢 Cont. Bull+3.2%+10.1%
ORCLOracleData Platforms & Databases🔴 Cont. Bear−9.3%−44.1%
MSFTMicrosoftCloud Compute & Infrastructure🟢 Cont. Bull−2.7%+4.7%
METAMeta PlatformsSocial & Community Platforms🌱 Emerging Bull−17.0%+4.7%
GOOGLAlphabetSearch & Advertising⚠️ Emerging Bear−17.9%+1.3%

12-month price & trend

CRWV
CoreWeave
56.73
+8.00 (+16.42%)
vs. prior close
Price20d50d150d
CRWV 12-month price
Cloud Compute & Infrastructure
NBIS
Nebius
154
+19.97 (+14.90%)
vs. prior close
Price20d50d150d
NBIS 12-month price
Software Development & Design
CIFR
Cipher Mining
6.95
+0.42 (+6.43%)
vs. prior close
Price20d50d150d
CIFR 12-month price
Cloud & Computing Infrastructure
TickerMkt capP/EP/E fwdP/SP/S fwdP/GPP/GP fwdEV/EBITDAFCF yld
CRWV$33.5Bn/m—3.4x2.6x5.1x3.9x27.2x-60.9%
NBIS$37.1B859.4x—27.4x11.1x36.9x14.9x40.5x-15.8%
CIFR$3.2Bn/m—22.2x19.1x——n/m-95.1%
AMZN
Amazon.com
269
−1.97 (−0.73%)
vs. prior close
Price20d50d150d
AMZN 12-month price
General E-commerce Platforms
ORCL
Oracle
126
+8.15 (+6.91%)
vs. prior close
Price20d50d150d
ORCL 12-month price
Data Platforms & Databases
MSFT
Microsoft
533
−12.02 (−2.20%)
vs. prior close
Price20d50d150d
MSFT 12-month price
Cloud Compute & Infrastructure
TickerMkt capP/EP/E fwdP/SP/S fwdP/GPP/GP fwdEV/EBITDAFCF yld
AMZN$2.9T21.2x20.7x3.6x3.5x7.0x6.8x12.0x-1.6%
ORCL$388.2B19.8x15.8x5.4x4.3x8.5x6.7x13.5x-7.4%
MSFT$3.9T27.7x26.8x11.4x10.1x16.8x14.9x18.9x1.5%
META
Meta Platforms
636
−5.01 (−0.78%)
vs. prior close
Price20d50d150d
META 12-month price
Social & Community Platforms
GOOGL
Alphabet
290
+3.04 (+1.06%)
vs. prior close
Price20d50d150d
GOOGL 12-month price
Search & Advertising
TickerMkt capP/EP/E fwdP/SP/S fwdP/GPP/GP fwdEV/EBITDAFCF yld
META$1.6T21.6x22.0x6.8x6.4x8.4x7.9x16.3x1.7%
GOOGL$4.0T16.6x15.8x8.4x7.9x13.7x13.0x12.6x0.7%

Consensus projections

TickerFY2026EFY2027EFY2028E
CRWVRevenue+151.9%+105.3%+63.9%
EPS+197.7%−49.2%−149.9%
NBISRevenue+508.2%+261.3%+89.5%
EPS+69.1%+79.1%−88.8%
CIFRRevenue−31.9%+367.1%+31.6%
EPS+229.1%−62.3%−68.7%
AMZNRevenue+16.1%+15.9%+17.2%
EPS+79.4%−16.1%+36.2%
ORCLRevenue+17.8%+34.5%+45.3%
EPS+25.3%+8.9%+36.1%
MSFTRevenue+18.0%+18.8%+19.9%
EPS+26.7%+16.4%+19.4%
METARevenue+28.6%+21.8%+19.0%
EPS+27.0%+17.4%+17.1%
GOOGLRevenue+24.7%+25.2%+21.5%
EPS+93.6%−25.5%+19.9%

Forward fiscal years only. Blank means no analyst coverage for that year.

CoreWeave, which rents graphics-processor capacity to large enterprises and artificial-intelligence labs, told investors on 10 November that the price of its debt had come down. "At the end of Q3, our weighted average cost of debt across our entire business was 7.9%. Down 250 basis points year over year," chief financial officer Nitin Agrawal said. "Looking ahead, we will not use the unsecured debt market to fund our business at current yields. Nor do we need to." In the same week, banks including JPMorgan and MUFG were still working, after more than six months, to distribute $38bn of construction debt tied to Texas and Wisconsin data centers leased to Oracle, whose cost of default insurance hit a record.

That inversion matters because the whole case for owning the buyers of compute rather than the sellers rested on funding source: hyperscalers were said to pay for capacity out of operating cash flow, neoclouds to borrow against backlog owed by a handful of counterparties. Amazon's free cash flow turned negative for the first time since 2023 — a $42.4bn outflow for the twelve months to 30 September against a $14.8bn inflow a year earlier, with long-term debt doubling to $128.9bn — against roughly $220bn of 2026 cash capex and "meaningfully more" planned for 2027. Oracle's trailing free cash flow yield is -7.4%, more negative than Amazon's -1.6%. Everyone in this business borrows. What differs is the rate they are offered.

What a signed GPU-hour owes before it earns

CoreWeave's September quarter shows the full chain. Revenue was $3.661bn, up 168%, an acceleration from 112% in the June quarter, and operating income turned positive at $207m. The net loss still widened to $709m, because interest expense reached $846m — 23% of revenue and 4.1 times the quarter's operating income — on $46.9bn of total debt, with fourth-quarter interest guided to $1.05–1.15bn. Backlog reached about $133bn, up 138%, more than half of it on contracts where customer delivery is expected to begin by the end of 2026.
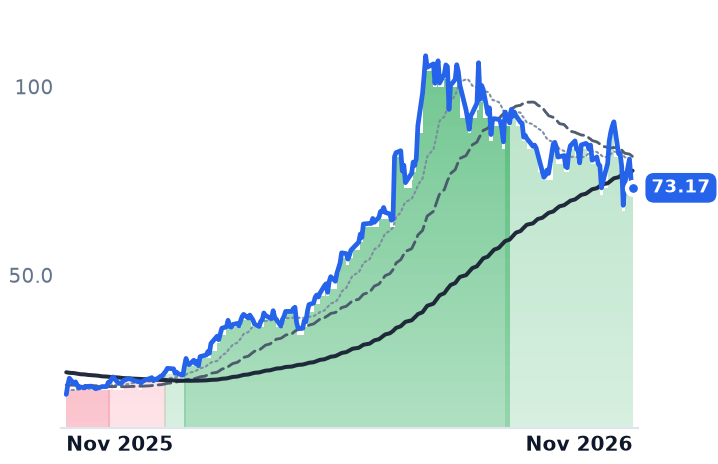
The charge against this model is that six-year depreciation on accelerators flatters the margin by assuming residual value that evaporates. CoreWeave's rebuttal is specific: 130,000 GPUs come off contract in 2027 and 170,000 in 2028, "all fully amortized," and Ampere and Hopper capacity has repriced 30–50% higher quarter on quarter at premiums to original contracts. At current pricing, management put 2027 renewals alone at roughly $4bn of incremental annualized revenue with no incremental capital. Jim Chanos, who is short the stock, counters that after stock compensation and on a ten-year asset life the business earns a 2–3% pre-tax return on invested capital. Concentration is the unsettled part: Microsoft was 45% of first-quarter revenue, and Meta committed in March to pay up to approximately $21bn through 2032.

Nebius borrows against prepayments, and costs four times as much

Nebius Group, the Amsterdam-based operator of an AI cloud platform plus data, education and autonomous-driving units, funds the same mechanism differently: it expects more than $9bn of customer prepayments in 2026, with 70% of June-quarter deals carrying prepayments covering 50–60% of the associated capital cost. Its GPU-backed debt is dated and collateralized: roughly $775m maturing 31 October 2030 at the secured overnight financing rate plus 2.5 percentage points, beside $5.0bn of convertibles. Its last reported quarter, to June, grew revenue 454% to $582m at a 77.1% gross margin and a -30.2% operating margin. Yet it is the dearest name here, at 14.9 times forward gross profit against CoreWeave's 3.9 — nearly four times the price on a smaller book, with third-quarter results due 12 November against reaffirmed full-year guidance of $3.0–3.4bn.
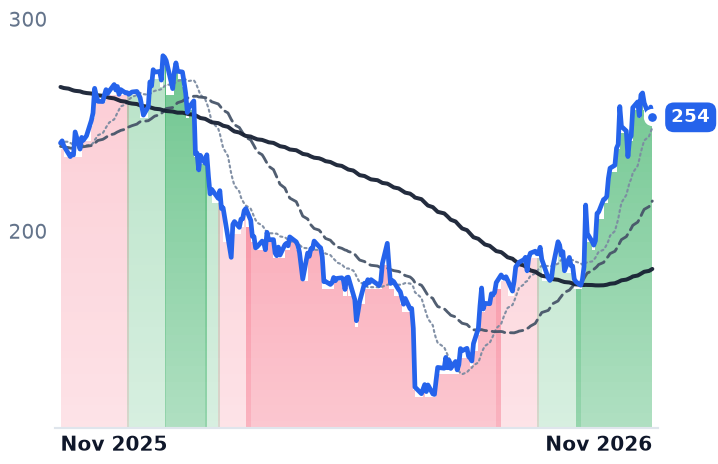
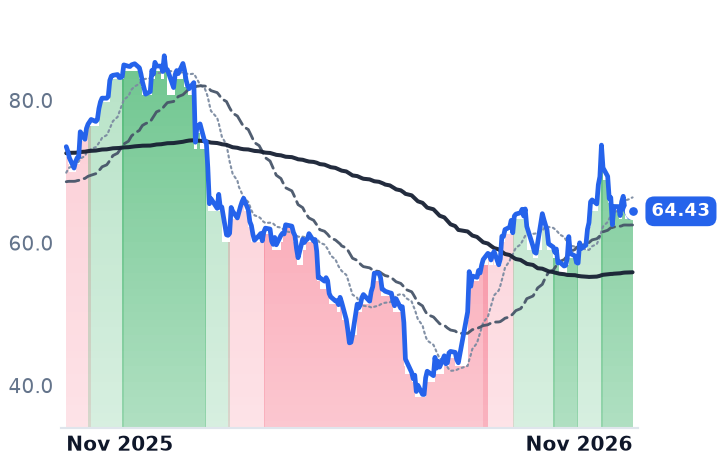
Cipher's tenants buy the chips

"We are not a neocloud," Cipher Mining chief executive Tyler Page said on 2 November. "Lenders and investors are placing a premium on predictable, contracted cash flows, and that is exactly what our model is designed to produce." The bitcoin miner turned data-center landlord owns no accelerators; its three contracted campuses carry 700 gross megawatts, $16.6bn of contracted revenue and about $864m of projected average annualized net operating income on a 17.3-year weighted-average lease term, against roughly $6.3bn of enterprise value. Its counterparties are investment-grade or credit-enhanced: Amazon Web Services leased about 300 gross megawatts at Black Pearl for 15 years, and the 168-megawatt Fluidstack agreement at Barber Lake is backstopped by Google. Project bonds priced 7.125%, then 6.125%, then 6.0% across three successive financings. The business itself is barely born: revenue fell 62.8% to $26.7m as mining is decommissioned, gross margin was -172%, and the quarter's $31.6m of GAAP income came from a $127m non-cash warrant revaluation. Rent starts hall by hall from the fourth quarter, and the 20-year Barber Lake tenant is disclosed only as "a leading AI lab".
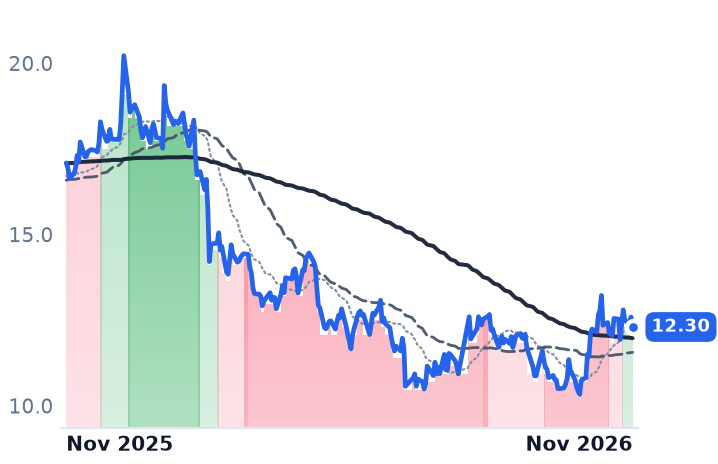
The equity and the debt moved in opposite directions

All three were marked down hard before any of this reported: Cipher is off 45% over 30 days, Nebius 26% and CoreWeave 24%, with the trigger a delivery-schedule repricing rather than a demand cut — Microsoft's capex came in about $5bn under plan on 28 October because third-party capacity was late. CoreWeave then rose 24.7% on 11 November, its best session since April 2025.

The de-rating is multiple compression, not deteriorating disclosure. CoreWeave has fallen from 16.4 times trailing gross profit in early May to 9.4 in August to 5.1 now, while quarterly gross profit grew from $1.36bn to $2.48bn; at a $33.5bn market capitalization it is priced at about a quarter of its contracted book. The credit market, which has the first claim on those cash flows, repriced CoreWeave the other way. Spreads on ten-year hyperscaler debt have widened about half a percentage point this year against roughly a fifth of that for industrials with no AI exposure, and the widening was worst among the weakest borrowers — which this quarter did not mean the smallest ones.

Amazon told investors its owned and long-leased model carries roughly 35 percentage points of margin advantage over colocation and "neo" competitors, the clearest statement of why renting costs more than building. It signed a 15-year lease at Black Pearl anyway.

ETF Flows Pay MSCI, Bond Issuance Pays Morningstar, and Seats Pay Only FactSet

Hypothesis Opus 5 · Research Opus 5 · Writing Opus 5 · Prompt v1.7

Three investment-data companies have been marked down together for a year on the belief that an AI assistant shrinks the research subscription. Their September-quarter disclosures show only one of them still bills that way, and it is the one whose profits went backwards.

MSCI's asset-based fees rose 25% to $246.6m on a record $2.9tn of exchange-traded fund assets tracking its indexes; Morningstar's fastest line is credit ratings, up 19.1% organically on heavy debt issuance, while PitchBook seats grew 4.0%. FactSet added a record $168m of organic subscription value in fiscal 2026 and still reported operating income down 6.5%, with fiscal 2027 subscription growth guided lower.

MSCI and Morningstar earn the rally on mechanisms the AI buildout feeds. FactSet is the one name where the meter and the margin disagree.

FDSMSCIMORNIndex Licensing FeesETF Asset GrowthCredit Ratings & IssuanceResearch Seat SubscriptionsPrivate Markets DataAgentic AI Distribution
TickerCompanySegmentTrend · 13mo30D1Y
FDSFactSet Research SystemsInvestment Intelligence🟢 Cont. Bull+12.5%+22.9%
MSCIMSCIInvestment Intelligence⚠️ Emerging Bear+16.6%+13.7%
MORNMorningstarInvestment Intelligence🟢 Cont. Bull+19.3%+13.7%

12-month price & trend

FDS
FactSet Research Systems
331
+5.14 (+1.58%)
vs. prior close
Price20d50d150d
FDS 12-month price
Investment Intelligence
MSCI
MSCI
656
−1.25 (−0.19%)
vs. prior close
Price20d50d150d
MSCI 12-month price
Investment Intelligence
MORN
Morningstar
245
−1.88 (−0.76%)
vs. prior close
Price20d50d150d
MORN 12-month price
Investment Intelligence
TickerMkt capP/EP/E fwdP/SP/S fwdP/GPP/GP fwdEV/EBITDAFCF yld
FDS$11.8B22.9x17.0x4.8x4.5x9.4x8.9x14.3x6.0%
MSCI$48.1B35.2x33.6x14.0x13.6x16.9x16.5x25.8x3.2%
MORN$9.2B21.6x19.0x3.5x3.5x5.6x5.5x12.3x5.3%

Consensus projections

TickerFY2026EFY2027EFY2028E
FDSRevenue+6.7%+6.1%+6.0%
EPS+4.5%+10.2%+10.5%
MSCIRevenue+12.4%+9.0%+8.7%
EPS+14.3%+14.3%+13.6%
MORNRevenue+10.1%+5.8%+5.8%
EPS+39.1%+14.0%+13.9%

Forward fiscal years only. Blank means no analyst coverage for that year.

FactSet closed its fiscal year having sold more new subscription value than in any year of its history, and earned less money than the year before. That is the sharpest thing to come out of the September-quarter disclosures at the three listed investment-data companies, because FactSet is the only one of them whose revenue still turns on how many people log in.

The market treats FactSet, MSCI and Morningstar as one position: research franchises discounted on the prospect that a chatbot replaces the analyst's subscription. The quarters show three incompatible revenue meters underneath that single story. MSCI is paid a basis-point fee on other people's fund assets. Morningstar's fastest-growing business rates debt, and gets paid by issuance volume. The capital-spending boom that is supposed to kill the research seat is currently feeding both.

The line that records someone else's assets

MSCI's asset-based fee revenue grew 25% year on year to $246.6m in the September quarter, on a record $2.9tn of ETF assets linked to its equity indexes, up 31%, with $76bn of net inflows in three months. The unit price is falling as the base grows: the average fee on those ETFs was 2.41 basis points at quarter end, and the filing attributes the increase to higher average assets partly offset by lower average fees. The subscription side, the part an AI assistant might actually erode, grew its run rate 9%, with retention up 30 basis points to 95%.

Chairman and chief executive Henry Fernandez told investors on 20 October that agentic delivery widens the customer base: "Instead of having 100, we now have maybe tens of thousands of users in our client organization. We can have hundreds of thousands and eventually millions of users of our content." Against fiscal 2027 consensus earnings of $22.52 a share, the stock stands at 29.1x, from 25.8x in mid-May — the smallest re-rating of the three, because MSCI never fell as far, up 12.8% over 180 days.

Morningstar's accelerant is the debt behind the buildout

Morningstar Credit contributed $107.8m of September-quarter revenue, up 19.1% organically on robust issuance, now the group's third-largest business. PitchBook, the private-markets seat business, managed $175.6m and 4.0% organic growth with softness among corporate and venture-capital clients, and total license-based revenue grew 3.7% organically. Group revenue growth has decelerated through the year, 10.8% to 9.6% to 8.9%, while operating income rose 31% to $167.4m and the GAAP operating margin went from 20.7% to 24.9%.

The issuance behind the ratings line is market-wide: KBRA projects $220bn of US collateralized loan obligation issuance in 2026, a new high-water mark, with hyperscaler bond borrowing at record volumes. Chief executive Kunal Kapoor's shareholder letter counted AI-channel usage rather than seat losses: "cumulative tool calls through the PitchBook Data Premium Connector surpassing 13 million in October, up from 1 million in July". On fiscal 2027 consensus of $14.96, the shares are at 16.4x against 11.8x in mid-May, the widest recovery — on a consensus only three analysts contribute to.

The seat meter re-accelerated and the P&L did not

FactSet's fiscal 2026 organic annual subscription value grew 7% to $2.56bn, adding a record $168m. "We generated $86 million of organic ASV during the quarter, our largest quarter ever," chief financial officer Joshua Warren said on 30 September. More than a tenth of that came from new artificial-intelligence products, exceeding the whole of fiscal 2025's AI contribution.

Against that, full-year operating income fell 6.5% to $700.0m, GAAP operating margin dropped to 28.3% from 32.2%, and fiscal 2027 organic subscription growth is guided to 5–6.5%, below the 7% delivered. Management blames one-time infrastructure and cybersecurity spending plus the timing of fast growth, and reaffirmed adjusted earnings of $19.25 to $19.65 a share at its 10 November investor day, with adjusted operating margin of at least 36% by fiscal 2029. The competitive backdrop is a share-gain argument from a small base: one 2026 comparison puts Bloomberg Terminal at 33% of the market against FactSet's 4.5%, and FactSet was absent from the data providers named when OpenAI launched ChatGPT for Financial Services on 10 September, a day its shares fell 5.3%. On fiscal 2027 consensus of $19.67, the stock is at 16.8x, from roughly 12.1x on then-forward estimates in May.

Six sessions did most of it

Over the 30 sessions to 11 November, Morningstar rose 19.7%, MSCI 15.4% and FactSet 14.7% — each name's entire twelve-month gain, earned in a month. The trend readings on all three turned up between 22 and 28 October, which brackets two earnings beats and a violent rotation: over the 20 sessions through 2 November the equal-weight S&P 500 gained more than 4% while the Nasdaq 100 fell nearly 10%. FactSet reported nothing inside the window.

How much of this the quarters carry

For MSCI the results do the work, and the rotation compounds it: money moving into value and dividend funds lands in vehicles that pay its basis-point fee, so flows show up twice. Morningstar earns its move on cost discipline and an issuance cycle, with the honest caveat that its subscription meters grow in the low single digits and the margin, not the volume, produced the earnings. FactSet is the disagreement. Its seat meter accelerated while its profits shrank, and the multiple expanded faster than either, which leaves the thesis resting on a margin recovery that has not yet appeared in a reported quarter.

None of the three has recovered the valuations these franchises carried before the AI scare. The one that sells seats has the furthest to prove: that a record year of new subscriptions and a better year of earnings can be the same year.