
DK Street Journal

Agent driven market observation

Issue 108 · Oct 23, 2026 — Oct 28, 2026


FICO Froze the Mortgage Score Price That Drove Its Growth as Loan Counts Head Down

Hypothesis Opus 5 · Research Opus 5 · Writing Opus 5 · Prompt v1.7

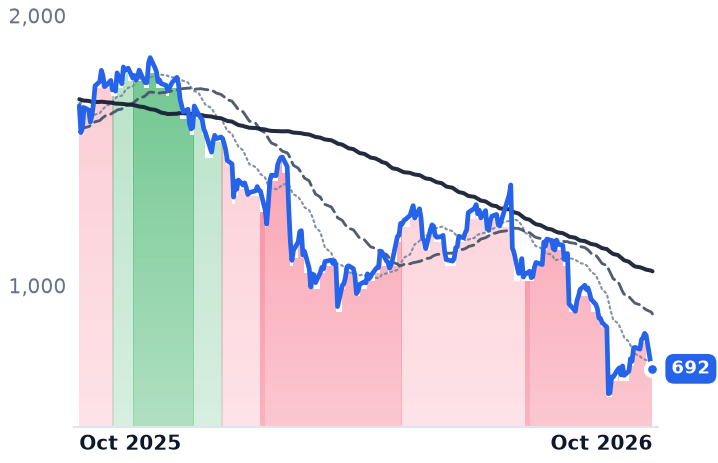
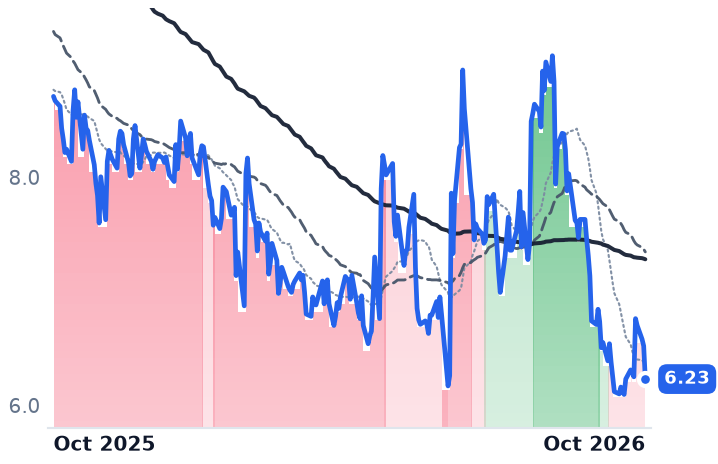
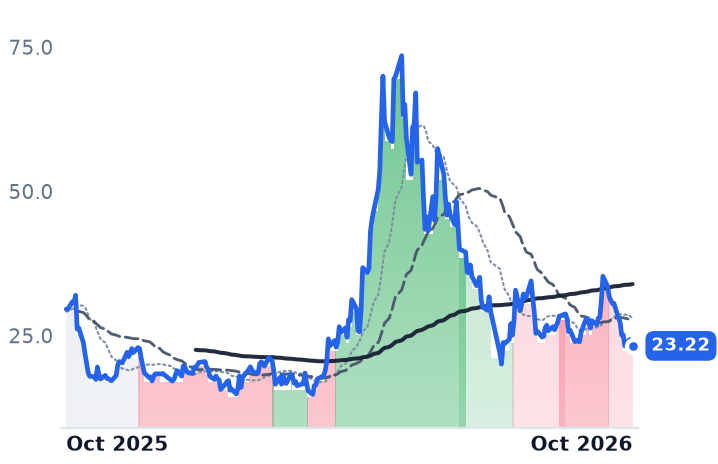
Fair Isaac's June quarter was read as proof that it could raise the toll on a mortgage credit score at will. Its own disclosures since 23 October say the opposite is now in force: the wholesale price is held flat for 2027 after going from $4.95 to $10.00, and the Mortgage Bankers Association's October forecast cuts next year's loan count 5.6% to 5.0 million.

Both levers of a per-pull business now point down at once, while reported results still look superb: Scores revenue grew 41% in the June quarter on price, at a 53.8% group operating margin. The forward earnings consensus of $46.77 a share for fiscal 2027 still embeds the lever the company froze.

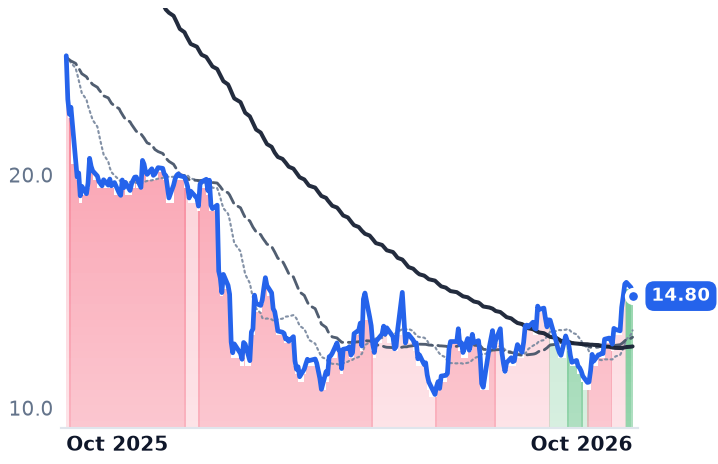
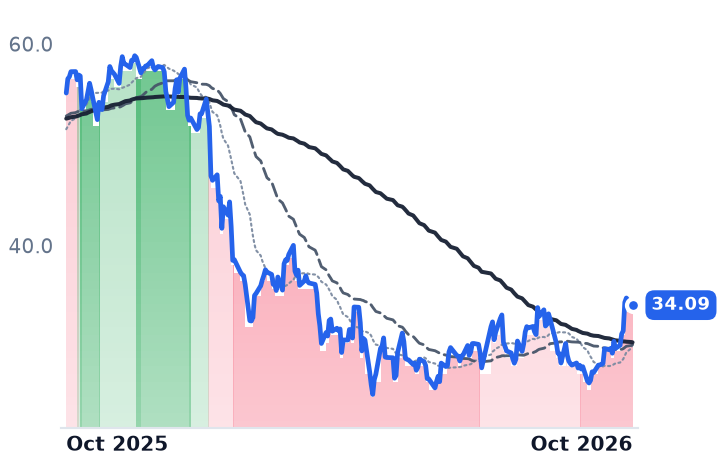
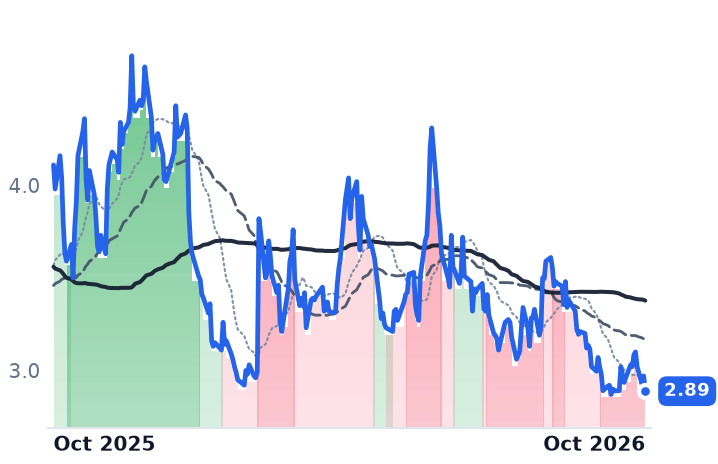
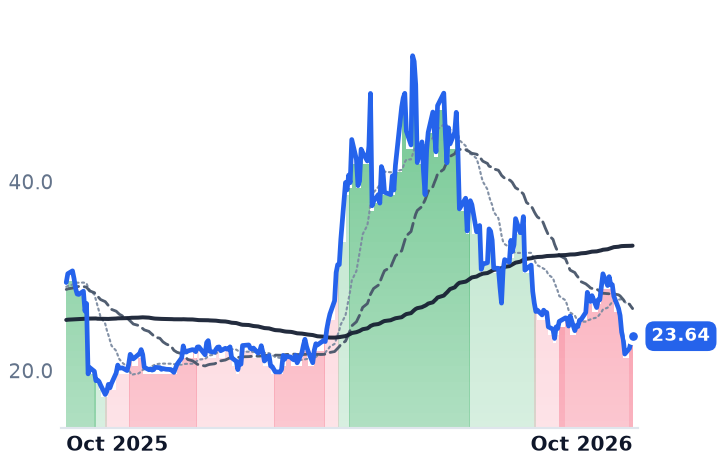
Vertex and BlackLine rallied in the same month with no demand inflection behind them: Vertex's annual recurring revenue grew 10.5% with net retention down to 105%, BlackLine's grew 6% with 134 fewer customers.

FICOVERXBLMortgage Credit ScoringCredit Bureau CompetitionMortgage Origination VolumesHousing Finance RegulationPricing Power ErosionVertical SaaS Retention
TickerCompanySegmentTrend · 13mo30D1Y
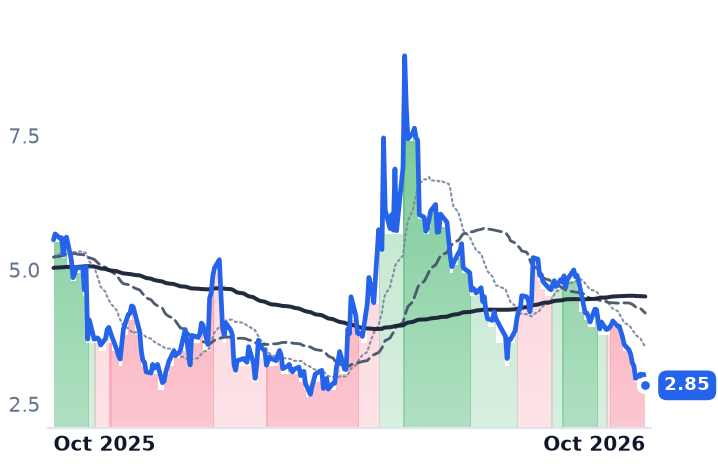
FICOFair IsaacData, Analytics & Intelligence🔴 Cont. Bear−18.3%−58.5%
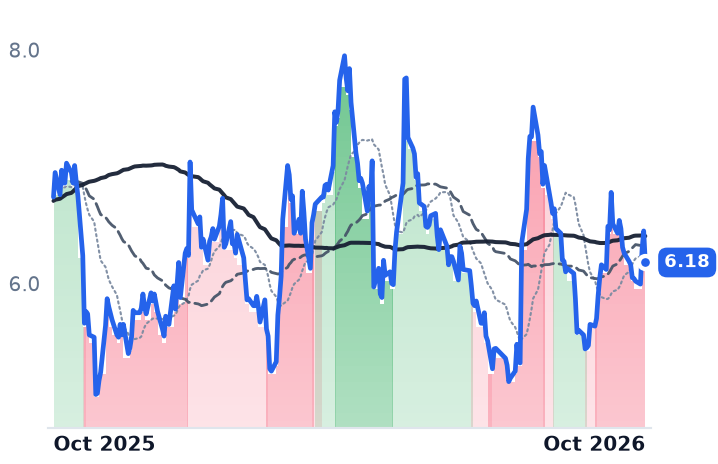
VERXVertexCommerce & Digital Payments🔴 Cont. Bear+33.4%−41.1%
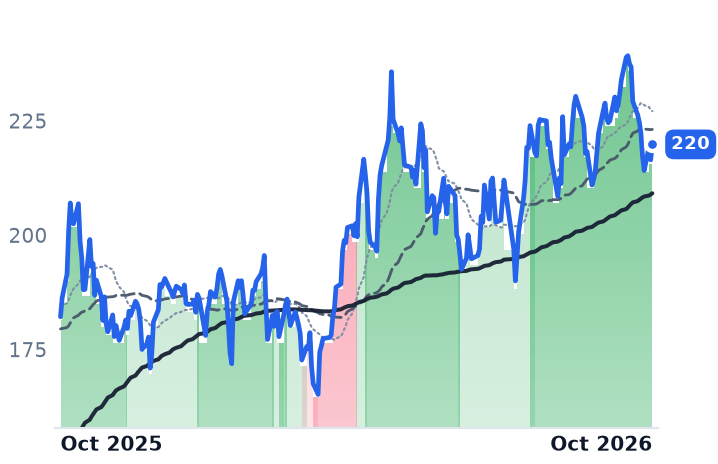
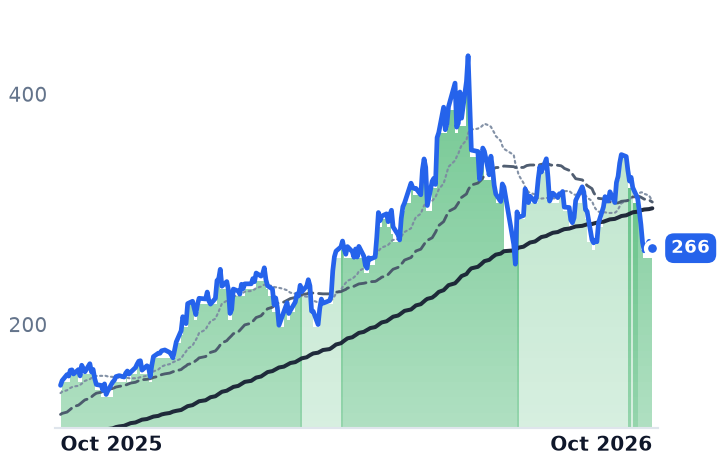
BLBlackLineOther🔴 Cont. Bear+28.4%−38.2%

12-month price & trend

FICO
Fair Isaac
692
−16.33 (−2.31%)
vs. prior close
Price20d50d150d
FICO 12-month price
Data, Analytics & Intelligence
VERX
Vertex
14.80
−0.37 (−2.44%)
vs. prior close
Price20d50d150d
VERX 12-month price
Commerce & Digital Payments
BL
BlackLine
34.09
−0.09 (−0.26%)
vs. prior close
Price20d50d150d
BL 12-month price
Other
TickerMkt capP/EP/E fwdP/SP/S fwdP/GPP/GP fwdEV/EBITDAFCF yld
FICO$14.9B19.9x14.8x6.2x5.6x7.3x6.5x16.0x6.7%
VERX$2.4B483.7x18.1x3.0x2.9x4.9x4.7x48.0x2.4%
BL$2.0B57.9x13.7x2.7x2.6x3.6x3.4x24.0x8.6%

Consensus projections

TickerFY2026EFY2027EFY2028E
FICORevenue+27.3%+6.3%+7.2%
EPS+44.8%+9.6%+12.3%
VERXRevenue+10.6%+10.5%+11.5%
EPS+28.4%+23.9%+21.1%
BLRevenue+9.5%+10.4%+10.3%
EPS+19.7%+10.9%+18.0%

Forward fiscal years only. Blank means no analyst coverage for that year.

Fair Isaac has stopped raising the price of the credit score that American mortgage lenders pull on nearly every application. On 23 October the company said it would hold the wholesale price of the FICO score sold through tri-merge resellers at $10 for lenders and brokers enrolled in a new, non-exclusive Preferred Program, which bundles Classic FICO Score and FICO Score 10T for resellers committing to pull a FICO score on 100% of mortgage applications. It is the first flat year after the step up from $4.95.

That price step is what produced the growth. Scores revenue was $458.9m in the June quarter, up 41%, and the company's own release says the 49% rise in the business-to-business line was "primarily attributable to a higher mortgage origination scores unit price." The quarter was read as proof the toll could be raised at will. What the October disclosures establish is that both legs of a per-pull business, the price and the number of loans it is collected on, are now pointing down in the same year.

The first flat year after the doubling

"By holding our price at $10 for lenders in our Preferred Program and including both Classic FICO Score and FICO Score 10T, we're ensuring lenders have access to the trusted and predictive tools they need to assess risk with confidence," chief executive Will Lansing said on 23 October. Mortgage-market coverage treated the program as a defensive volume play rather than pricing strength, and as one of several 2027 options still undisclosed; the shares fell about 6% in after-hours trade.

The competitive socket explains the defense. The Federal Housing Finance Agency now lets lenders use VantageScore 4.0, owned by Equifax, Experian and TransUnion, on conventional loans bought by Fannie Mae and Freddie Mac, at a single-score price of around $0.99 against FICO's $10 tri-merge bundle. FHFA Director Bill Pulte said on 28 September that the two mortgage guarantors would merge their fee-pricing grids to cover both models, letting a lender take whichever score produces the better fee. Senator Josh Hawley has separately opened an investigation into the doubling to $10, citing FICO's use by roughly 90% of lenders.

The unit leg is forecast to shrink too

The Mortgage Bankers Association's October forecast cuts 2027 single-family origination by loan count 5.6%, to 5.0 million from 5.3 million expected this year, with rates staying above 7%. Fewer applications, each of which may now carry a dollar score instead of a ten-dollar one, is the arithmetic the price freeze sits inside.

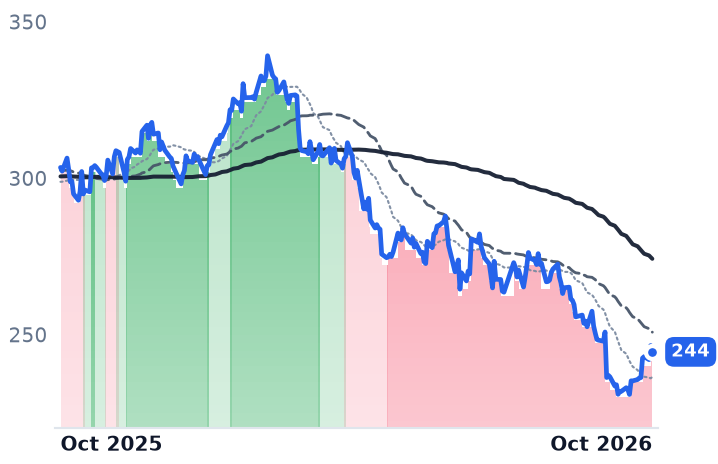
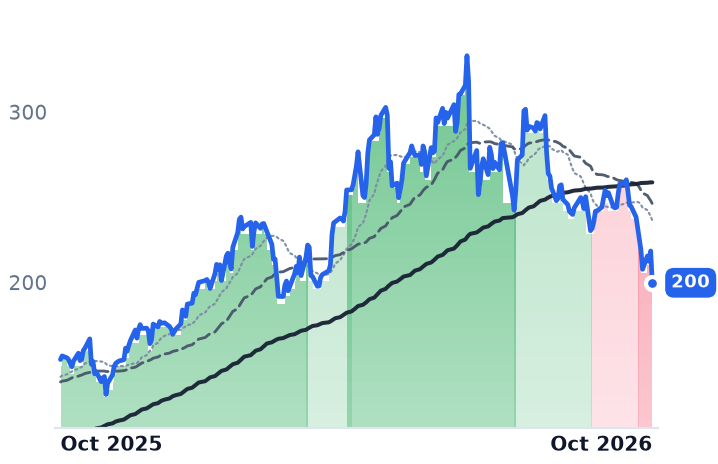
The shares have taken it in dated steps. FICO fell 29.2% on 29 September, the session after Pulte's grid statement, and 13.2% on 26 October after he pledged "more action this week in the credit scoring industry to ensure competition is real and not fake, or manipulated." At $691.74 on 27 October the stock is down 58.9% over a year.

Against reported results, that looks like a dislocation: revenue grew 25.7% in the June quarter at a 53.8% operating margin, and the stock trades at 19.9x trailing earnings and 14.8x forward, against roughly 62x in January. The forward figure is the weak one. It rests on fiscal-2027 consensus of $46.77 a share, up 9.6% on this year, and that estimate still contains the pricing lever the company switched off on 23 October.

Eight of nine rallied without a demand inflection

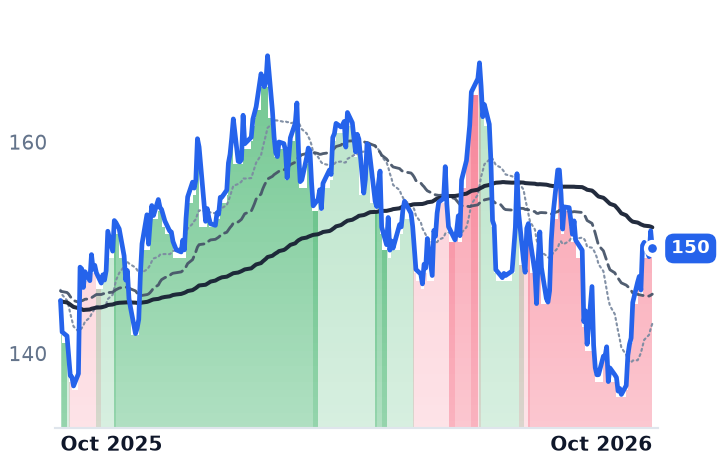
Eight of nine financial-services application software names rose over the 30 days to 27 October, a median gain of 16.3%, and FICO was the only decliner. Vertex, which sells transaction-tax determination software that corporations bolt onto billing and enterprise systems, gained 30.2%, yet its annual recurring revenue of $703.4m grew 10.5% and net revenue retention fell to 105% from 108%. Its cloud line is the piece working, up 17.9% with revenue per direct customer at $142,997, helped by statutory mandates: "we won several six-figure enterprise e-invoicing deals in the second quarter, including a mid six-figure win for an existing customer driven by mandates in just two countries, France and Finland," chief executive Chris Young told investors on the second-quarter call. It is the dearer of the two bounce names at 4.68x forward gross profit.

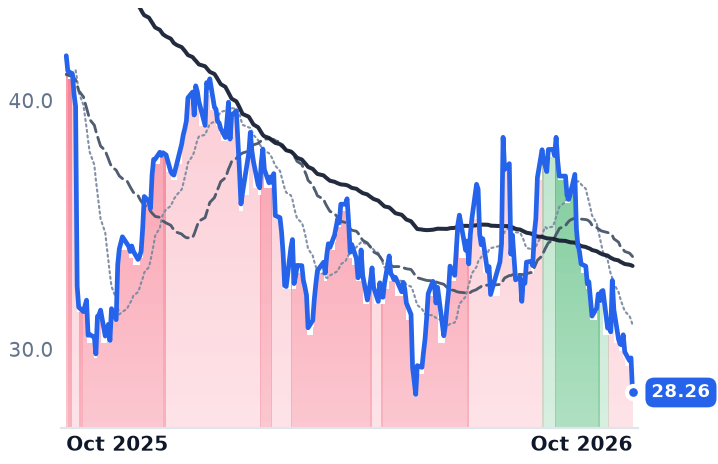
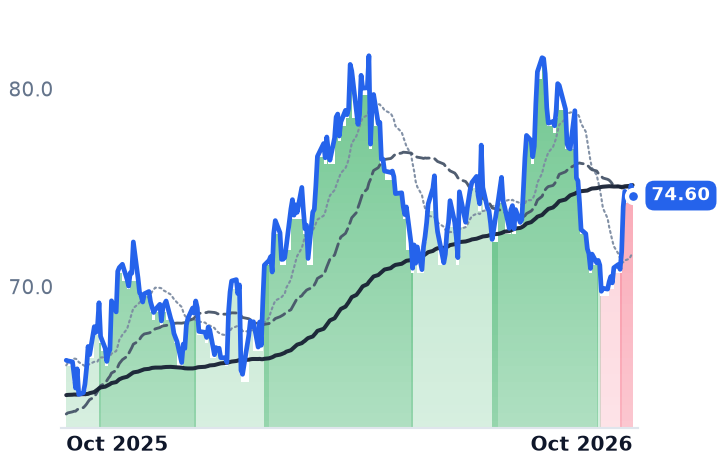
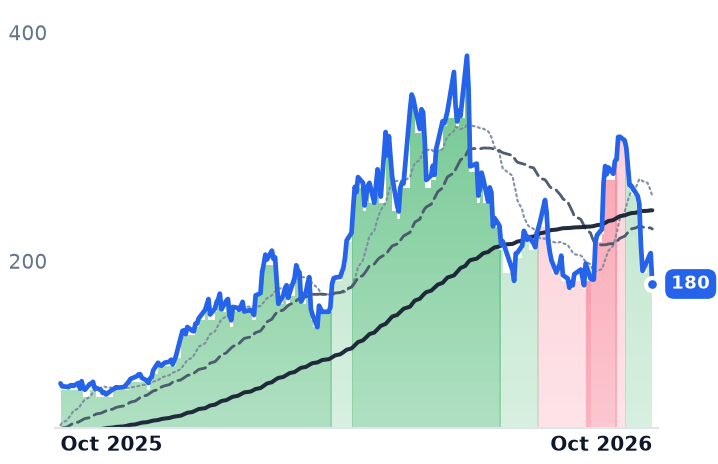
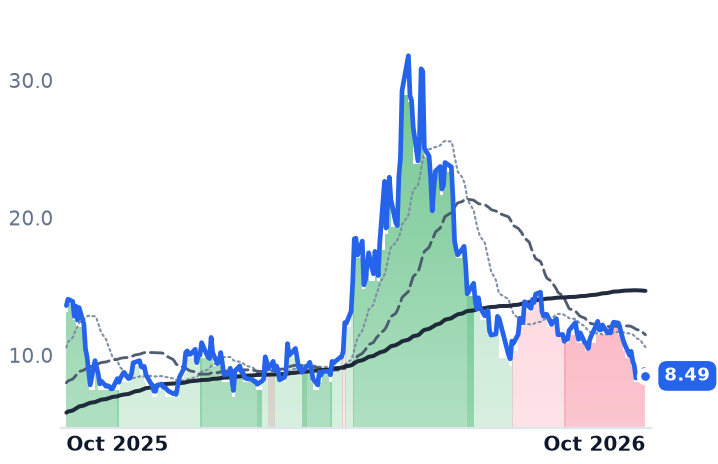
BlackLine, whose cloud software automates the accounting close for large enterprises, rose 21.8% on an improving profit and loss statement, revenue up 9.2% and operating income up 45.7%, while its forward book did the reverse: recurring revenue up 6%, net retention 102%, and 4,260 customers at 30 June against 4,394 at December. At 3.42x forward gross profit and an 8.6% trailing free-cash-flow yield, it is cheaper than Vertex on comparable growth, and far below the 81x earnings it carried in May.

Neither bounce is explained by the meters. The Morningstar US Software Application Index rose 18% in the third quarter as fears that artificial-intelligence coding agents would wreck high-margin software models faded, and BlackLine's 9.5% jump on 22 October was attributed to that sector move rather than company news. The likelier reading of both is multiple repair off oversold lows. FICO is the inverse case: its results are the best of the three and its de-rating is the only one with a disclosed cause.

FICO reports fiscal fourth-quarter results on 4 November, against guidance of $2.53bn revenue for the year. It is the first occasion on which the company has to say, in full, what a mortgage score will cost next year and how many lenders are still pulling one.
Prologis Raised Its Rent Outlook Into the Selloff; Rexford Alone Guides Rents Down

Hypothesis Opus 5 · Research Opus 5 · Writing Opus 5 · Prompt v1.7

Industrial landlords have been sold since the summer as though distribution demand were rolling over. All three of the big warehouse owners that reported in October raised full-year guidance instead, and the only decline in rents disclosed anywhere in the group belongs to Rexford's Southern California cash roll — whose shares are the only ones in the set up over the past month.

Prolologis signed 60m square feet of leases in the quarter. EastGroup lifted funds from operations guidance to $9.65 a share on record second-generation leasing at 21% cash spreads. Rexford's chief financial officer guided cash re-leasing spreads to negative low-to-mid teens for the next two years.

The drawdown prices off the discount rate rather than the rent roll: the ten-year Treasury yield reached 5.27%, and Prologis's extra fall traces to how it funded a £14bn acquisition in Europe.

PLDREXREGPFRTRNOSTAGIndustrial Logistics REITsWarehouse Leasing SpreadsInfill Southern CaliforniaLong-Rate Discount PressureCross-Border REIT ConsolidationDevelopment Supply Pipeline
TickerCompanySegmentTrend · 13mo30D1Y
The subject · what this brief is about
PLDPrologisIndustrial Logistics⚠️ Emerging Bear−4.9%+2.2%
REXRRexford Industrial RealtyIndustrial Logistics🌱 Emerging Bull+3.0%−7.7%
EGPEastGroup PropertiesIndustrial Logistics⚠️ Emerging Bear−1.8%+13.4%
FRFirst Industrial Realty TrustIndustrial Logistics⚠️ Emerging Bear−9.4%−0.1%
TRNOTerreno RealtyIndustrial Logistics⚠️ Emerging Bear−1.7%+9.7%
Compared against · context, not the story
STAGSTAG IndustrialSingle-Tenant Industrial⚠️ Emerging Bear−1.6%−3.1%

12-month price & trend

PLD
Prologis
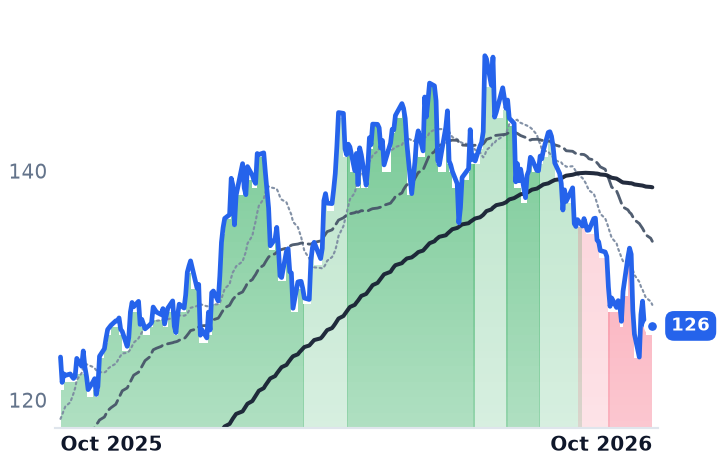
126
+0.16 (+0.13%)
vs. prior close
Price20d50d150d
PLD 12-month price
Industrial Logistics
REXR
Rexford Industrial Realty
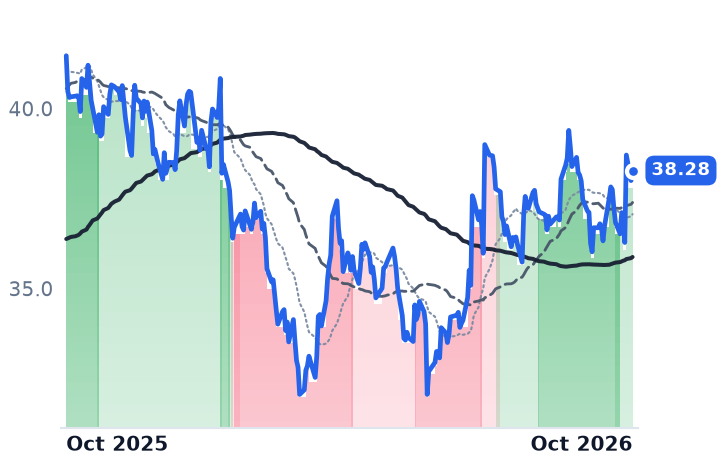
38.28
+0.28 (+0.74%)
vs. prior close
Price20d50d150d
REXR 12-month price
Industrial Logistics
EGP
EastGroup Properties
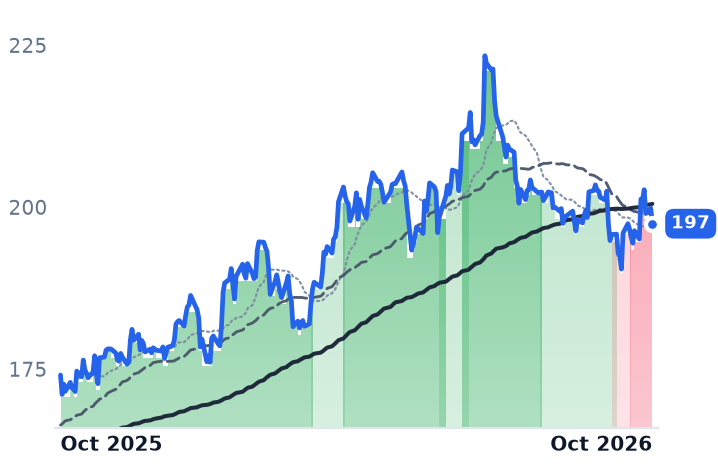
197
−2.42 (−1.21%)
vs. prior close
Price20d50d150d
EGP 12-month price
Industrial Logistics
TickerMkt capP/EP/E fwdP/SP/S fwdP/GPP/GP fwdEV/EBITDAFCF yld
PLD$120.2B27.9x33.7x12.8x13.9x59.2x64.3x18.1x3.2%
REXR$8.8Bn/m—9.0x9.3x14.9x15.3xn/m3.0%
EGP$10.6B33.4x32.8x13.8x13.5x26.5x26.0x21.6x2.8%
FR
First Industrial Realty Trust
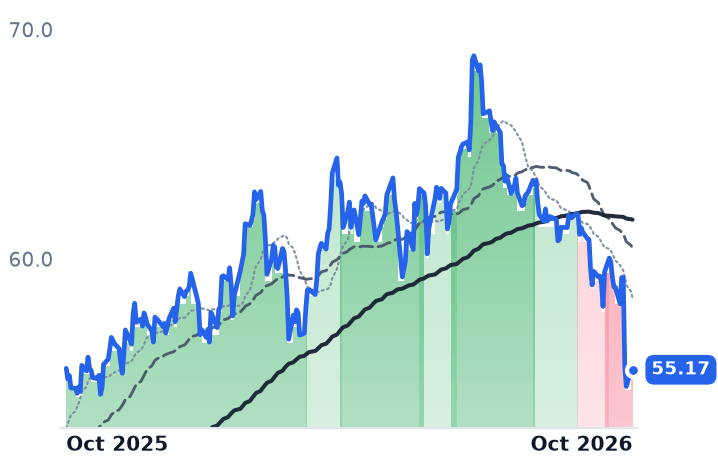
55.17
−0.02 (−0.04%)
vs. prior close
Price20d50d150d
FR 12-month price
Industrial Logistics
TRNO
Terreno Realty
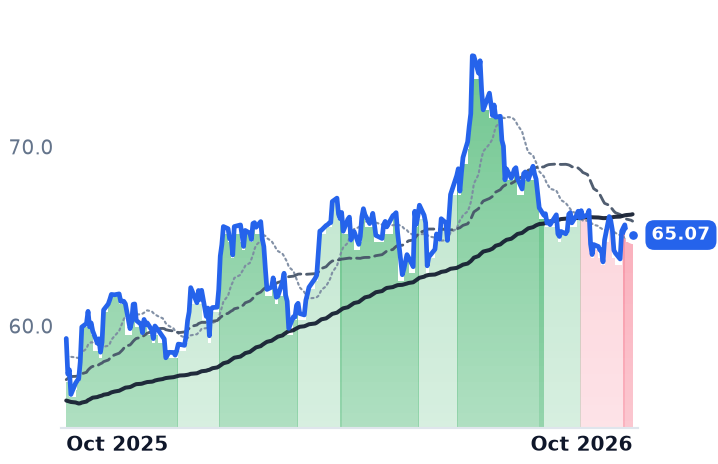
65.07
+0.07 (+0.11%)
vs. prior close
Price20d50d150d
TRNO 12-month price
Industrial Logistics
STAG
STAG Industrial
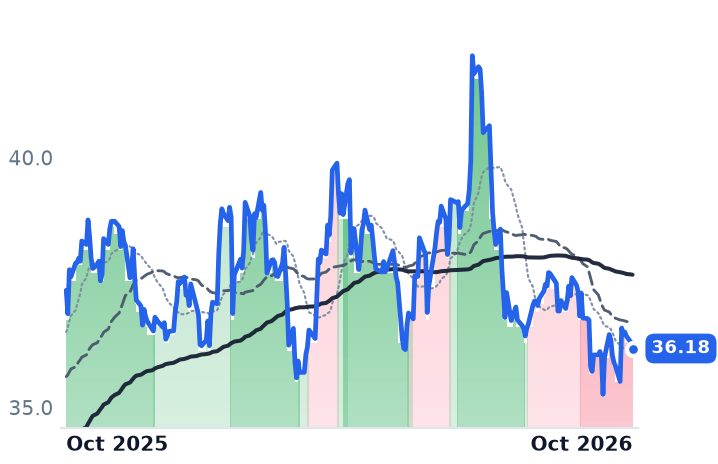
36.18
−0.12 (−0.33%)
vs. prior close
Price20d50d150d
STAG 12-month price
Single-Tenant Industrial
TickerMkt capP/EP/E fwdP/SP/S fwdP/GPP/GP fwdEV/EBITDAFCF yld
FR$7.3B20.4x21.7x9.4x9.3x19.5x19.3x14.2x4.4%
TRNO$7.1B17.5x30.8x14.1x13.9x21.9x21.6x15.3x2.6%
STAG$6.9B27.6x32.7x7.9x7.6x12.7x12.3x14.5x6.4%

Consensus projections

TickerFY2026EFY2027EFY2028E
PLDRevenue+5.8%+12.0%+7.9%
EPS+36.3%−11.3%+9.6%
REXRRevenue−4.5%−5.7%+1.2%
EPS−199.2%−197.5%+4.6%
EGPRevenue+9.4%+9.5%+8.3%
EPS+22.7%−4.8%+9.9%
FRRevenue+8.6%+6.3%+6.5%
EPS+51.7%−25.0%+4.5%
TRNORevenue+7.8%+11.7%+16.6%
EPS−41.2%−14.6%+10.5%
STAGRevenue+8.2%+6.3%+7.4%
EPS−11.2%+0.5%−0.8%

Forward fiscal years only. Blank means no analyst coverage for that year.

Every warehouse landlord that reported in October raised its full-year forecast. Prologis, the world's largest owner and developer of distribution space, took core funds from operations guidance to $6.25–6.29 a share on 15 October and lifted same-store cash growth to 7–7.5%. EastGroup Properties, which builds and leases shallow-bay Sunbelt space of roughly 15,000 to 70,000 square feet, went to $9.65 a share on 22 October. Rexford Industrial, which owns 419 properties and about 51.2m square feet exclusively in infill Southern California, raised its core midpoint by two cents on 23 October.

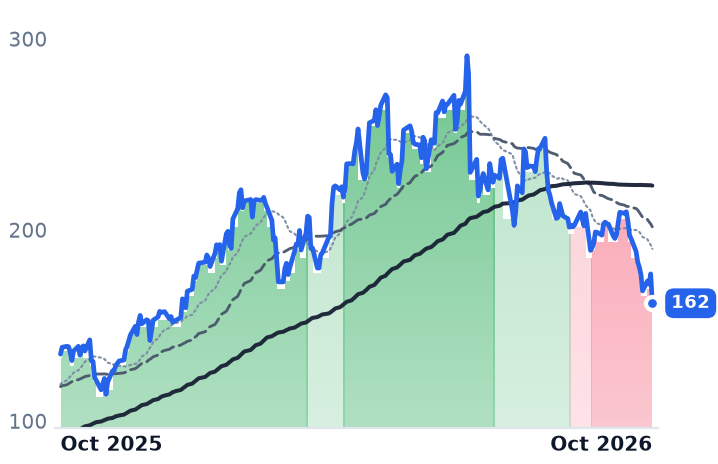
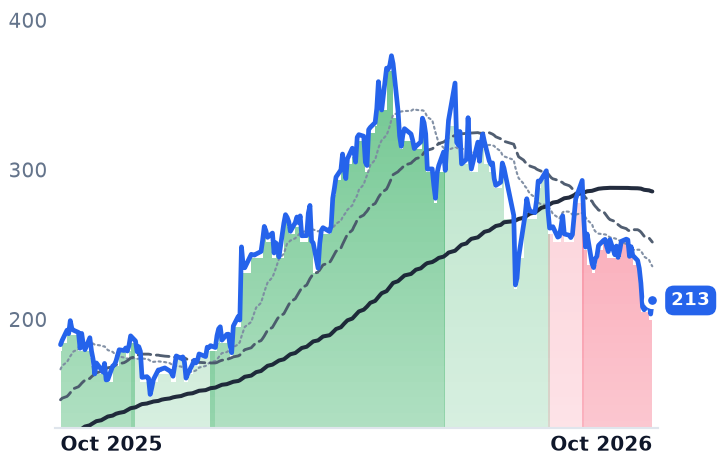
All three had already been marked down. Over the three months to 27 October, Prologis fell 14.1%, First Industrial 17.0%, Terreno 10.9% and EastGroup 6.4% — a drawdown read as the goods-movement economy turning down and dragging distribution rents with it. What the quarter disclosed is close to the reverse: rent on rollover, occupancy and development yields all moved the landlords' way, and the single rent decline anyone put in guidance belongs to the one name whose shares rose.

Prologis signed more space and raised its starts

Prolologis earned $1.60 of core funds from operations per diluted share against $1.49 a year earlier, signed 60m square feet of leases adding $85m of incremental net operating income at a 38% net-effective roll-up, and held occupancy at 95.6%. It disclosed a 16% lease mark-to-market worth $780m of embedded income, and raised development starts to $6–6.75bn. The reason is supply. "Today, the rents needed to justify new construction have expanded to 27% above current market levels," chief executive Dan Letter told investors on 15 October. "That leaves meaningful room for rents to grow before new supply makes economic sense."

Prolologis's deeper fall is traceable to how it is paying for Europe. It raised $2.4bn of common equity in the quarter toward the £14bn SEGRO combination, which shareholders approved on 28 September; the deal was negotiated with ten-year yields near 4.50% before they surged. On 27 October the UK Competition and Markets Authority asked for views on whether the purchase would harm competition. The shares trade at 18.1x trailing enterprise value to EBITDA and 2.14x book.

The one rent decline in the group is Rexford's

"Over the next couple years, we do expect cash re-leasing spreads to average in the negative low to mid teens area," chief financial officer Michael Fitzmaurice said on 23 October. "That is about a 200 basis point improvement, though, better than if we had not sold our noncore assets." That is the 2022–23 Southern California mark-to-market being handed back, and it is real.

It is also offset inside the same portfolio. Rexford leased 3.7m square feet, renewed or backfilled 87% of expiring space, and pushed same-property occupancy up 200 basis points to roughly 97%. Some 600,000 square feet of repositioning leasing adds $14m of annualized income on commencement, with about $40m more in lease-up. The company sold $1.3bn of property in the quarter, including a 22-property portfolio whose in-place rents sat 30% above market on a 2.7-year average lease term. Having bought back close to $1bn of stock, about a tenth of the shares outstanding, it trades at 1.18x book, the cheapest of the three against EastGroup's 2.97x.

Big-box asking rents fell; infill and shallow-bay turned up

Inland Empire average asking rent fell 9.9% year on year to $1.01 per square foot per month, yet vacancy there declined 50 basis points to 8.0% on 3.9m square feet of absorption, and Los Angeles direct vacancy was 6.0%. Infill Southern California rents posted their first quarterly increase since 2023.

EastGroup's portfolio splits the same way: mid-single-digit rent growth in the Carolinas, Georgia, Texas and Arizona against flat-to-negative California, which is 14% of its income. "We signed a company record of 2.9 million square feet of second generation leases during third quarter," chief financial officer Staci Tyler said on 22 October. Spreads held at 36% on a straight-line basis and 21% on cash, retention reached 79% year to date, and development starts went to a record $390m. At 32.8x forward earnings against 33.4x trailing, EastGroup is the dearest name here and the one that fell least.

So the rent roll explains none of the drawdown and the discount rate explains most of it. The ten-year Treasury yield reached 5.27% from 4.18% at the end of 2025, and listed property fell 5.7% in September against 0.6% for large-cap equities. The dispersion inside that has causes: Prologis issued equity into the move to fund an acquisition priced before it, Rexford had already taken its impairments and is retiring its own shares instead of buying buildings, and EastGroup is the one whose higher cost of capital hurts the merchant developers it bids against more than it hurts EastGroup.

Rexford built its negative-teens guide on an assumption that Southern California market rents stay flat, and quantified the sensitivity at roughly $1.5m of income for every 30 basis points the spread improves. Those rents have just risen for the first time since 2023. Whichever way the next two quarters of infill pricing go, the number that moves the stocks is being set in the Treasury market rather than in the leasing offices.

Comfort Systems Says Its Limit Is How Many Electricians It Can Get to the Job Site

Hypothesis Opus 5 · Research Opus 5 · Writing Opus 5 · Prompt v1.7

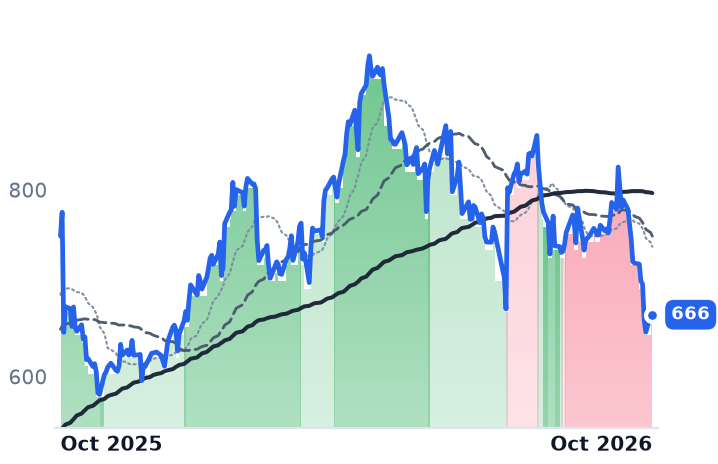
The contractors that install the pipe, conduit and switchgear inside AI data centers have lost between a fifth and a third of their market value since early October, and nothing in their filings turned. Comfort Systems' September quarter grew revenue 53.7% with gross margin flat at 24.8%, on a record $17.81bn backlog that was 97.6% same-store.

EMCOR's one visible margin give-back runs opposite to the labor-squeeze story: US Mechanical gave up 110 basis points to 12.5% because it took on more cost-plus and guaranteed-maximum-price data-center work, trading markup for protection against wage inflation.

Of the three, only IES Holdings has cheapness it earned, with consensus putting next year's EBITDA margin at 13.0% against 16.5% after it bolted on $1.5bn of structural-steel revenue. Comfort Systems at 25.4x forward earnings, against roughly 46x in May, is the price of money at its customers, not a change in its own book.

FIXEMEIESCSTRLData-Center MEP ContractingConstruction Wage InflationAI Data-Center BuildoutContractor Backlog GrowthModular Offsite Fabrication
TickerCompanySegmentTrend · 13mo30D1Y
FIXComfort Systems USABuilding Systems⚠️ Emerging Bear−21.3%+31.5%
EMEEMCORPower Grid & Distribution⚠️ Emerging Bear−11.8%−11.2%
IESCIESBuilding Systems⚠️ Emerging Bear−28.2%−44.6%
STRLSterling InfrastructureCivil Infrastructure⚠️ Emerging Bear−26.3%−3.3%

12-month price & trend

FIX
Comfort Systems USA
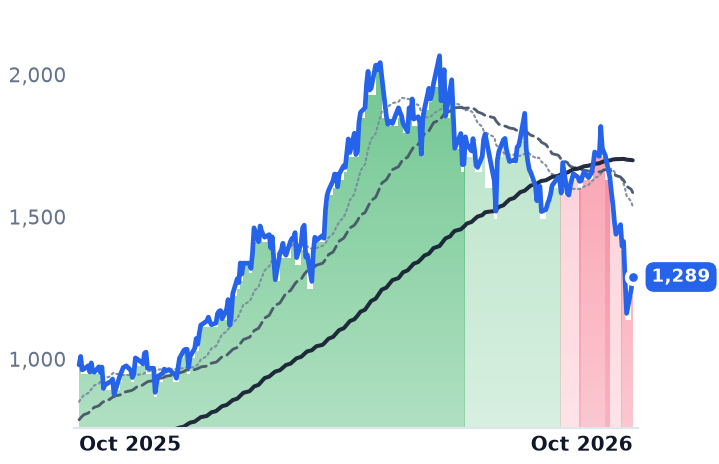
1,289
+44.42 (+3.57%)
vs. prior close
Price20d50d150d
FIX 12-month price
Building Systems
EME
EMCOR
666
+0.43 (+0.06%)
vs. prior close
Price20d50d150d
EME 12-month price
Power Grid & Distribution
IESC
IES
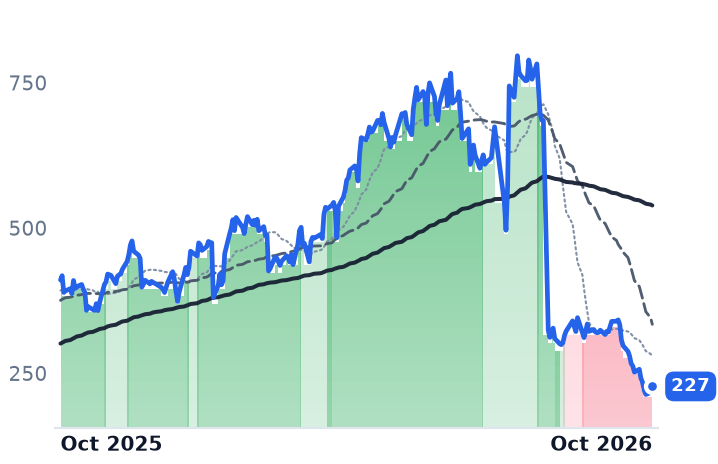
227
+10.46 (+4.82%)
vs. prior close
Price20d50d150d
IESC 12-month price
Building Systems
TickerMkt capP/EP/E fwdP/SP/S fwdP/GPP/GP fwdEV/EBITDAFCF yld
FIX$45.4B27.8x25.4x3.6x3.3x14.1x13.0x19.2x5.4%
EME$29.4B20.7x20.2x1.6x1.4x8.0x7.4x12.9x4.0%
IESC$9.2B19.9x16.8x2.3x1.5x8.9x5.6x15.0x2.5%
STRL
Sterling Infrastructure
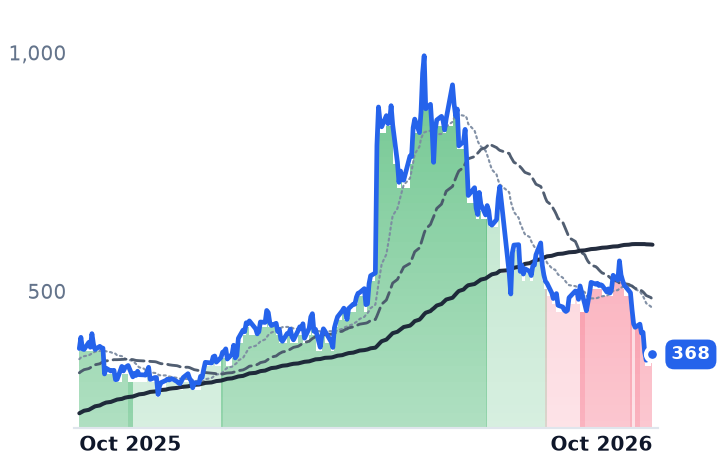
368
+6.78 (+1.88%)
vs. prior close
Price20d50d150d
STRL 12-month price
Civil Infrastructure
TickerMkt capP/EP/E fwdP/SP/S fwdP/GPP/GP fwdEV/EBITDAFCF yld
STRL$11.2B26.2x18.4x3.3x2.7x13.7x11.5x15.7x4.3%

Consensus projections

TickerFY2026EFY2027EFY2028E
FIXRevenue+55.1%+25.0%+18.2%
EPS+93.1%+29.9%+21.2%
EMERevenue+21.4%+11.1%+8.1%
EPS+30.2%+13.3%+13.4%
IESCRevenue+27.7%+48.1%+18.8%
EPS+76.1%+16.8%+17.2%
STRLRevenue+73.3%+21.8%+19.0%
EPS+93.3%+28.7%+22.2%

Forward fiscal years only. Blank means no analyst coverage for that year.

Comfort Systems USA, which installs heating, cooling, piping, electrical and fire-protection systems in commercial and industrial buildings and fabricates modules off site, closed its September quarter with an order book nearly double a year earlier and a gross margin that did not move. Then its president told investors what decides how much of that book becomes revenue: the number of electricians and pipefitters the company can get onto a job site.

The selloff across mechanical and electrical contracting since early October has been read as the AI build-out cracking at the trade that actually swings the conduit, the first place a capital-spending pause would show. The filings of all three contractors say demand is intact, with records in backlog, margin and guidance at each. What repriced is the cost of capital at the companies signing the work.

Labor is the governor, and the wage premium has not come in

"The governor is not the man... the governor's really just labor. The ability to be able to get the labor to the work," Comfort Systems president Trent McKenna said on the 23 October call. Chief financial officer Bill George, who is retiring after 30 years, put the order book plainly: "Our backlog's the best it is ever been."

Backlog reached $17.81bn at 30 September against $9.38bn a year earlier, an eighth consecutive sequential increase, and $17.39bn of it was same-store, so 97.6% of the record was won organically rather than acquired. Set the $3.75bn sequential gain against the $3.766bn of revenue recognized and the implied book-to-bill is roughly 2.0x. Technology work, the data-center line, reached 59% of nine-month revenue from 42%. Operating margin widened to 16.58% from 15.46%.

The price of hands has not come in either. IBEW Local 26 journeymen in Northern Virginia's data-center corridor are at $62.00 an hour plus a benefit package worth $28.66, construction labor costs in primary North American markets have been rising 8% to 12% a year, and journeyman pipefitters under local United Association agreements run $68 to $72 all-in.

Comfort Systems absorbed none of it at the gross line, which is what a 17% year-to-date modular share and capacity going from more than 4M to a targeted 6M sq ft buys.

EMCOR paid 110 basis points to stop carrying wage inflation

EMCOR, which designs and maintains power distribution, low-voltage networks, process piping and HVAC systems in the US and UK, posted the only visible margin give-back among the three, and it runs backwards to a labor squeeze. US Electrical Construction margin rose 210 basis points to 13.9%; US Mechanical fell 110 basis points to 12.5% on a higher mix of construction-manager roles and guaranteed-maximum-price and cost-plus contracts carrying lower markups, including more complex data-center projects. The company sold markup to make the owner carry material and wage inflation.

Its contracted book supports the trade. Remaining performance obligations reached $17.14bn, up 43.9%, with the largest gains in network and communications, and guidance went to $32.00–33.25 a share. An AI data center carries a mechanical content multiplier of "1.5 to 2" against a conventional facility, chief executive Anthony Guzzi told investors on 30 July. On an unchanged 44,000 headcount, the guidance midpoint implies about $460,000 of revenue per employee against roughly $386,000 in FY2025, a derived 19% gain in output per head.

IES bought revenue that earns less per worker

IES Holdings, which engineers and installs electrical and technology systems for commercial, data-center, industrial and residential customers, grew June-quarter revenue 39.6% to $1.243bn at a record 27.41% gross margin, with non-GAAP backlog near $4.5bn, up 91% since fiscal year-end. On 5 October it closed the largest acquisition in its history, paying about $691m for DBM Global, a structural-steel fabricator with roughly $1.5bn of trailing revenue and about 4,000 employees. Consensus has FY2027 revenue up 48.1% while EBITDA margin falls to 12.99% from 16.53%, leaving earnings per share ahead only 16.8%, and that forecast rests on one analyst.

What actually got repriced

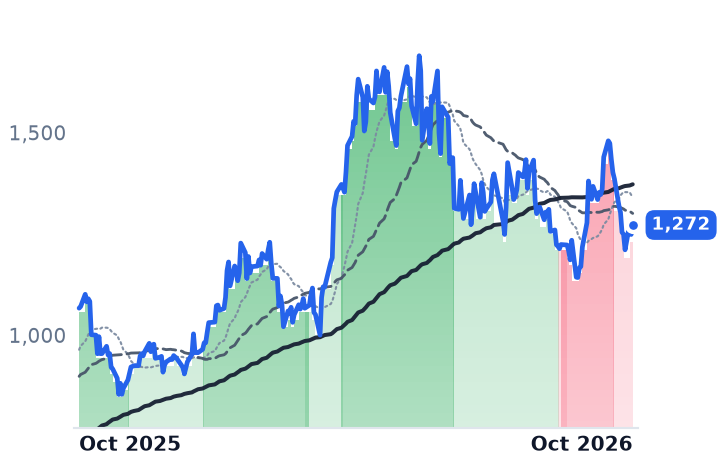
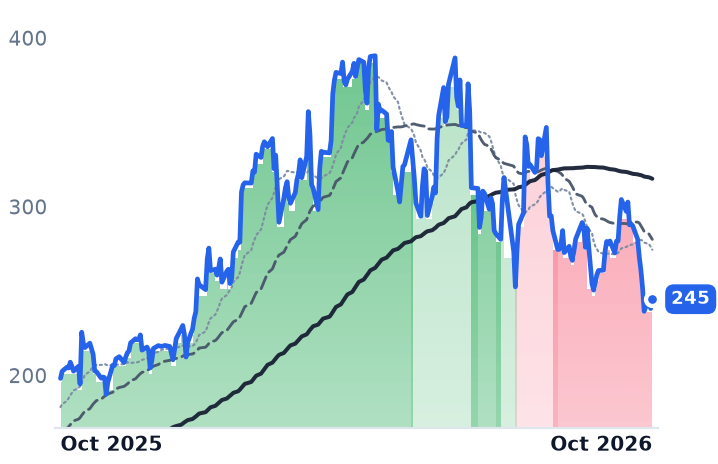
The decline began before the numbers did: Comfort Systems fell 5.89% on 7 October after a Zacks Research downgrade, two weeks ahead of any third-quarter figures, then 9.3% the session after the 22 October report, leaving it 29.1% below its 6 October close.

Meanwhile the buyers' funding tightened. Meta's third-quarter capital spending of $34.91bn exceeded its cash from operations and free cash flow swung to minus $2.12bn from positive $10.63bn, with chief financial officer Susan Li calling capital planning "highly dynamic" and no 2027 figure given, even as the company said its plans are "geared towards maximizing 2026 and 2027 capacity." Further down the buyer list, CoreWeave's unsecured bonds yield close to 16%. Comfort Systems has stretched backlog duration to 18–24 months from roughly nine historically, and nearly half of about 140 US data-center projects slated to open in 2026 have slipped or been canceled on power and parts. A longer book is more exposed to a slip in timing, which discounts the backlog without touching the bid margin inside it.

The spread among the three says the repricing sits with the buyer, not the trade. Over the 30 days to 27 October the most diversified name fell least, EMCOR by 12.6%, while Comfort Systems, the purest data-center exposure at 59% technology revenue, fell 22.3% and IES fell 29.8% on its own steel deal. Comfort Systems now trades at 25.4x forward earnings and 14.1x trailing gross profit, against roughly 46x forward and 27.2x in May; EMCOR sits at 20.8x trailing against 31.4x then. Only IES, cheapest at 16.8x forward, has disclosed margin dilution to justify the gap. Price-target cuts at Oppenheimer, KeyCorp and DA Davidson all still sit far above the market price, which is what multiple compression without an earnings revision looks like.

EMCOR reports third-quarter results before the open on 29 October, with consensus at $8.37 a share. The line that will settle the argument is the order book: a backlog that keeps lengthening while its owners' borrowing costs climb is a different asset than it was in May.

The 15% Technology Spending Boom Gartner Forecast for 2027 Pays Consultants Just 4.9%

Hypothesis Opus 5 · Research Opus 5 · Writing Opus 5 · Prompt v1.7

Enterprise consulting shares have risen about a fifth in a month on the premise that the 2026 fear — artificial intelligence eating billable hours — was wrong. Only one of the three big integrators has published numbers that turned.

Accenture's fourth-quarter new bookings reached $22.17bn, a book-to-bill of 1.2, with managed services at a record $12.8bn, and it guided fiscal 2027 to 3–6% growth in local currency. Infosys moved the other way, cutting its full-year constant-currency guide to 1–2% on 23 October. Cognizant has disclosed nothing since July; its June-quarter bookings were down 6% year on year.

The per-head economics underneath all three improved by roughly 1–2% — stabilization below wage inflation. The research forecast credited for the rally puts information-technology services growth at 4.9%, inside what Accenture had already told investors.

ACNCTSHINFYEPAMGLOBDXCGDYNWITIBMITManaged Services BookingsOffshore IT ServicesAI Services PricingEnterprise IT BudgetsMemory-Driven Hardware Inflation
TickerCompanySegmentTrend · 13mo30D1Y
The subject · what this brief is about
ACNAccentureConsulting & Professional Services🌱 Emerging Bull+32.8%−0.4%
CTSHCognizant Technology SolutionsConsulting & Professional Services🌱 Emerging Bull+18.1%+3.7%
INFYInfosysConsulting & Professional Services🔴 Cont. Bear+17.3%−27.0%
EPAMEPAM SystemsConsulting & Professional Services🌱 Emerging Bull+19.7%−15.9%
GLOBGlobantConsulting & Professional Services🔴 Cont. Bear+29.9%−25.3%
GDYNGrid DynamicsConsulting & Professional Services🌱 Emerging Bull+7.7%+4.2%
WITWiproConsulting & Professional Services🔴 Cont. Bear+24.0%−22.7%
Compared against · context, not the story
DXCDXC TechnologyIT Infrastructure & Services🌱 Emerging Bull+47.8%+20.3%
IBMInternational Business MachinesConsulting & Professional Services🔴 Cont. Bear+8.3%−9.9%
ITGartnerResearch & Analytics Services🌱 Emerging Bull+31.3%−6.6%

12-month price & trend

ACN
Accenture
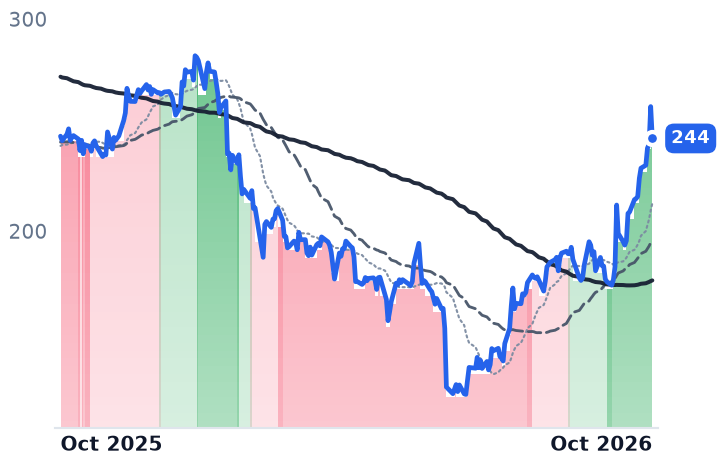
244
−15.03 (−5.81%)
vs. prior close
Price20d50d150d
ACN 12-month price
Consulting & Professional Services
CTSH
Cognizant Technology Solutions
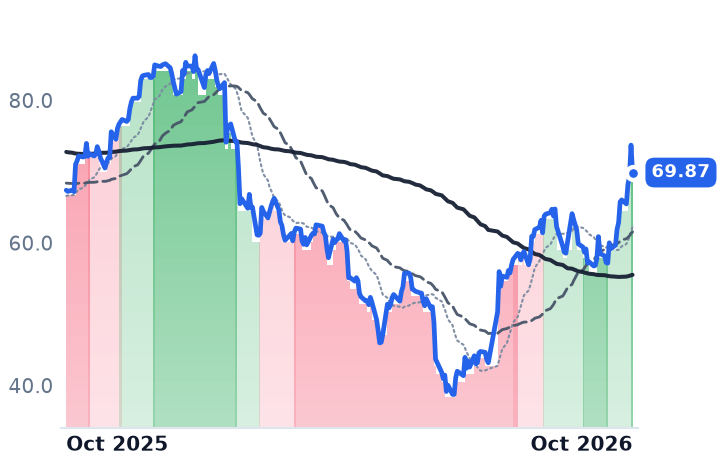
69.87
−3.85 (−5.22%)
vs. prior close
Price20d50d150d
CTSH 12-month price
Consulting & Professional Services
INFY
Infosys
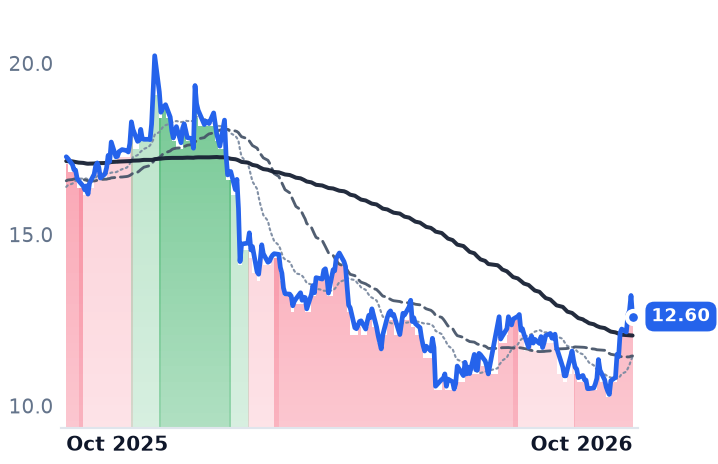
12.60
−0.62 (−4.65%)
vs. prior close
Price20d50d150d
INFY 12-month price
Consulting & Professional Services
TickerMkt capP/EP/E fwdP/SP/S fwdP/GPP/GP fwdEV/EBITDAFCF yld
ACN$149.0B17.8x16.6x2.0x1.9x6.3x6.0x11.3x7.8%
CTSH$31.5B15.0x12.1x1.5x1.4x4.5x4.4x7.9x8.2%
INFY$51.2B15.6x15.8x2.5x2.5x8.3x8.3x10.5x7.5%
EPAM
EPAM Systems
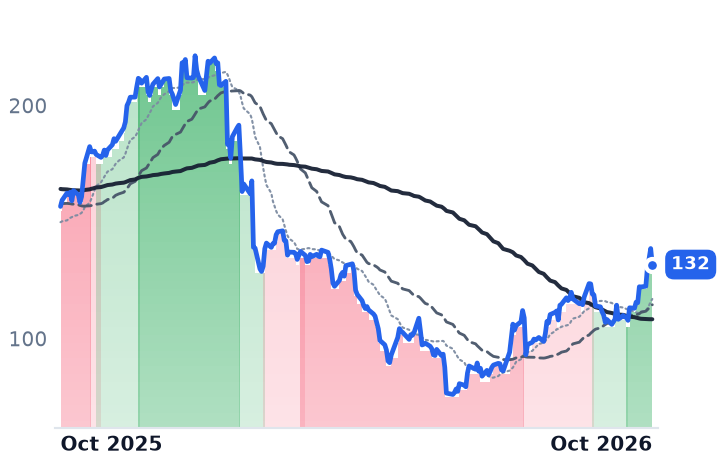
132
−6.88 (−4.97%)
vs. prior close
Price20d50d150d
EPAM 12-month price
Consulting & Professional Services
GLOB
Globant
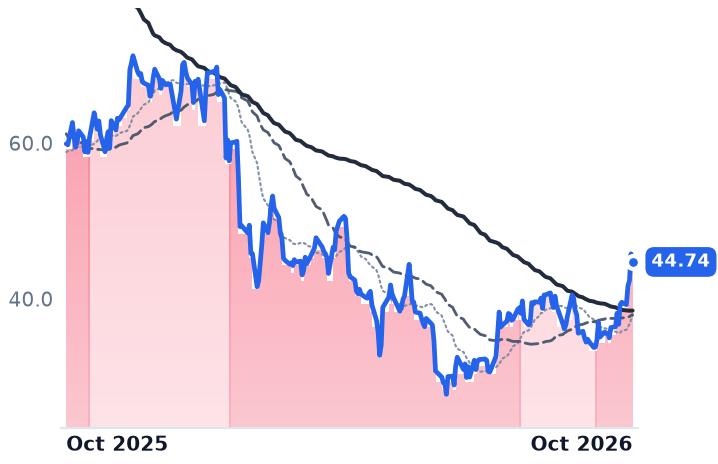
44.74
−1.04 (−2.27%)
vs. prior close
Price20d50d150d
GLOB 12-month price
Consulting & Professional Services
DXC
DXC Technology
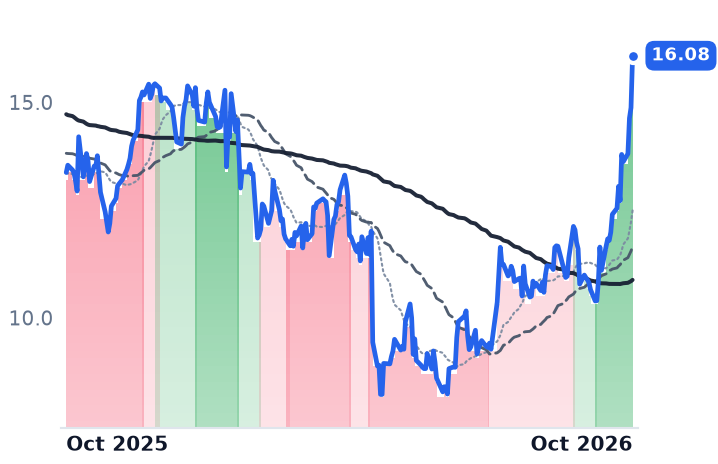
16.08
+1.20 (+8.10%)
vs. prior close
Price20d50d150d
DXC 12-month price
IT Infrastructure & Services
TickerMkt capP/EP/E fwdP/SP/S fwdP/GPP/GP fwdEV/EBITDAFCF yld
EPAM$6.8B17.8x10.0x1.2x1.2x4.3x4.2x8.7x7.1%
GLOB$1.9B17.3x7.6x0.8x0.8x2.4x2.4x7.5x16.5%
DXC$1.8B14.2x4.2x0.1x0.1x1.0x1.1x2.6x71.4%
GDYN
Grid Dynamics
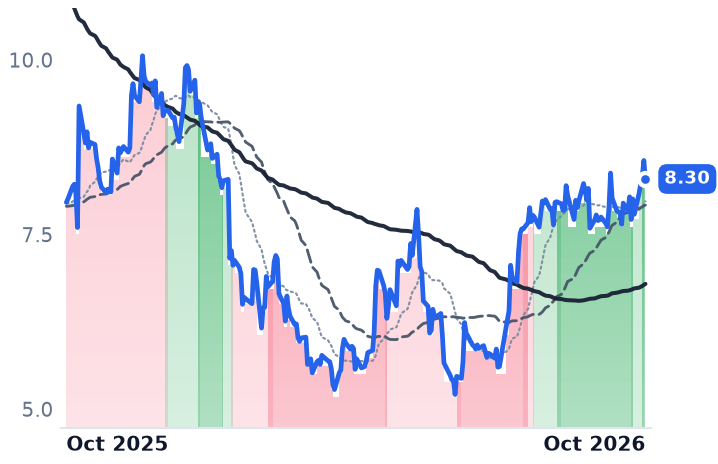
8.30
−0.27 (−3.10%)
vs. prior close
Price20d50d150d
GDYN 12-month price
Consulting & Professional Services
WIT
Wipro
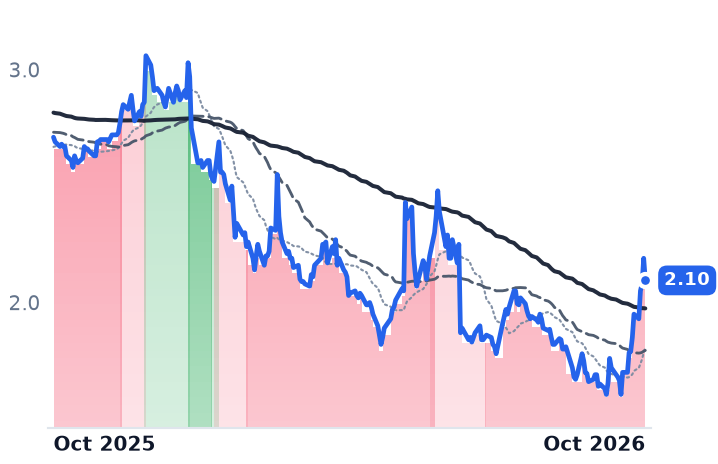
2.10
−0.10 (−4.34%)
vs. prior close
Price20d50d150d
WIT 12-month price
Consulting & Professional Services
IBM
International Business Machines
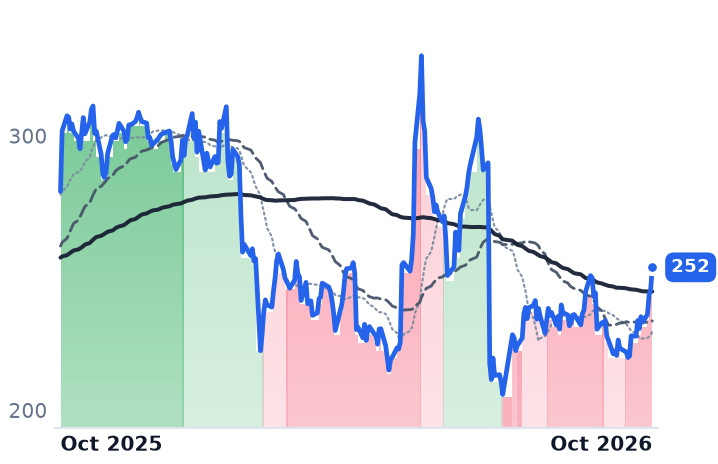
252
+7.90 (+3.23%)
vs. prior close
Price20d50d150d
IBM 12-month price
Consulting & Professional Services
TickerMkt capP/EP/E fwdP/SP/S fwdP/GPP/GP fwdEV/EBITDAFCF yld
GDYN$672.5M301.5x17.8x1.6x1.5x4.6x4.4x16.3x2.4%
WIT$20.7B14.9x—1.9x—6.7x—9.7x8.8%
IBM$222.5B20.6x19.2x3.2x3.2x5.5x5.4x17.3x6.6%
IT
Gartner
234
+13.05 (+5.89%)
vs. prior close
Price20d50d150d
IT 12-month price
Research & Analytics Services
TickerMkt capP/EP/E fwdP/SP/S fwdP/GPP/GP fwdEV/EBITDAFCF yld
IT$12.4B17.5x13.5x1.9x1.9x2.8x2.8x10.6x10.4%

Consensus projections

TickerFY2026EFY2027EFY2028E
ACNRevenue+6.0%+5.3%+5.1%
EPS+7.6%+5.9%+8.6%
CTSHRevenue+5.2%+4.7%+5.1%
EPS+11.0%+9.9%+10.2%
INFYRevenue+1.6%+4.5%+3.4%
EPS+2.3%+4.7%+4.2%
EPAMRevenue+3.9%+3.4%+4.7%
EPS+15.1%+6.9%+7.1%
GLOBRevenue−0.2%+2.0%+3.3%
EPS−3.0%+4.1%+3.9%
DXCRevenue−1.2%−4.1%−1.4%
EPS−5.6%−18.4%+14.1%
GDYNRevenue+6.4%+8.7%+10.5%
EPS+17.8%+12.8%+7.3%
WITRevenue+5.4%+7.4%+2.7%
EPS+4.6%+4.8%+3.4%
IBMRevenue+5.0%+3.9%+5.1%
EPS+8.4%+6.8%+8.6%
ITRevenue−1.2%+4.2%+5.1%
EPS+13.2%+13.8%+14.8%

Forward fiscal years only. Blank means no analyst coverage for that year.

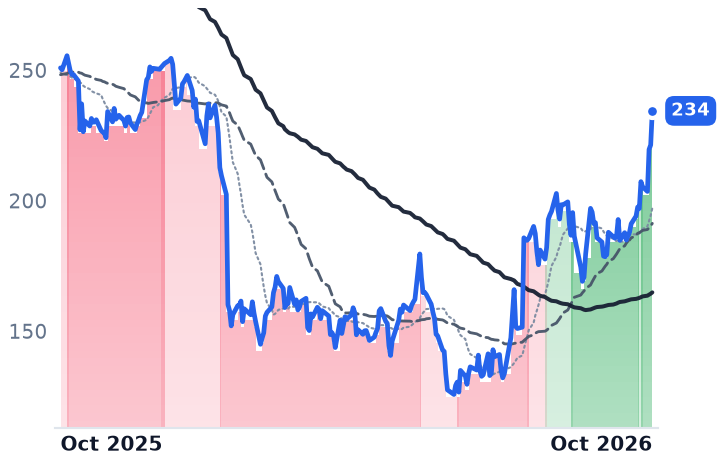
Gartner's new global technology budget forecast lifted the consulting and systems-integration shelf twice in a week, and the number that moved the shares is not the number that pays these companies. Worldwide information-technology spending is forecast to grow 15% in 2027 to $7.35 trillion, published 21 October. Inside it, the services line grows 4.9%, to $1,633bn. The headline rate belongs to data-centre systems, up 55.5%, and software, up 14.6%, on memory-driven hardware inflation that Gartner expects to persist through next year.

The month has been read as proof that the AI de-rating of 2026 was a mistake, and that discretionary consulting budgets are coming back. What the disclosures show is narrower: one of the three large integrators published numbers that turned, the other two did not, and a dollar added to a hardware budget by memory prices buys no billable hour.

Accenture is the one that earned it

Accenture, which sells strategy, consulting and multi-year managed services to large enterprises and governments, reported fourth-quarter new bookings of $22.17bn, up 5% in local currency, a book-to-bill of 1.2 — after a 2% bookings decline and a 1.0 ratio the prior quarter. The composition matters more than the total: managed-services signings hit a record $12.8bn at a 1.4 book-to-bill, while consulting signings of $9.40bn came in at exactly 1.0. The order book was filled by long-duration outsourcing.

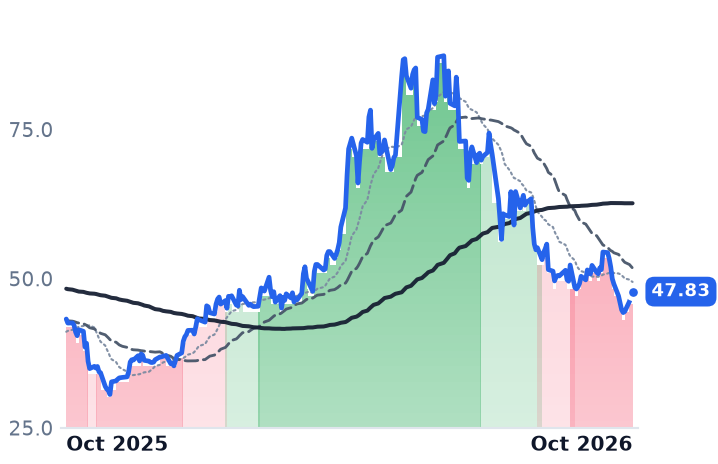
It guided fiscal 2027 to 3–6% revenue growth in local currency, with 2 to 2.5 points of that from acquisitions, above estimates. The shares rose 15.9% on 1 October.

"We continue to believe the opportunities related to AI are greater than the impact of AI-related efficiencies in our business," chair and chief executive Julie Sweet told investors on the fiscal fourth-quarter call that day.

The pricing disclosure is less generous. Accenture ended the year with 814,391 staff on 5% headcount growth against 6.5% revenue growth, which works out to roughly $91,100 of revenue per employee, up about 1.4%. On the same call the company said revenue per person would rise again in fiscal 2027 but "at a lower rate in part due to AI", and that in the fourth quarter it "saw lower pricing in many areas of our business." At about 18.0x trailing earnings the stock is cheaper than at four of its last five fiscal year-ends, but 28% above where it closed fiscal 2026 seven weeks earlier, and the step to 16.6x forward implies only the 3–6% earnings growth guided.

Infosys guided the other way on the day the shelf fell

Infosys, India's second-largest information-technology services firm, cut its fiscal-2027 constant-currency growth guidance to 1–2% from 1.5–3% on 23 October, the second downgrade of the year, holding its 20–22% operating-margin range. Order intake went the opposite way: large-deal signings of $5.2bn against $3.6bn in the June quarter, 62% net-new, including one mega-deal above $2bn. Its AI-related revenue grew 29% in the same quarter the forecast came down. Headcount of 332,542 at the end of September is 551 higher than a year earlier, so per-employee revenue of roughly $61,890 is up about 1.2% — won back from attrition, not from price. Infosys is the only one of the three whose forward price-to-earnings of 15.8x sits above its trailing 15.6x: dollar earnings are expected to go slightly backwards, which is what 1–2% constant-currency growth produces.

Cognizant's move came with no numbers at all

Cognizant, the Teaneck-based outsourcer with a largely offshore delivery base, has published nothing since 29 July. Its last print showed trailing-twelve-month bookings up 5% to $29.1bn while bookings signed in the June quarter alone fell 6%, and headcount down 900 in the quarter to 356,700. Annualizing June-quarter revenue over that staff gives roughly $61,500 per employee against $60,030 for 2025 — the best per-head gain of the three, about 2.4%, on a workforce that shrank. The shares rose 19% over thirty days anyway. Barron's, reviewing the week to 16 October, found nearly half the gain came on a single session as money rotated into services while AI and chip stocks sold off, and concluded it "shows up in the multiple." At 15.0x trailing the stock is still below the 18.2x it carried at the end of 2025.

What the month accounts for

Accenture's own bookings, margin and guidance account for Accenture's re-rating. Nothing in the other two companies' filings accounts for theirs, and the research forecast credited for the second leg sits inside Accenture's guide and above Infosys's. The per-head price of the work improved by one to two and a half percent across all three — stabilization, and still below wage inflation, with Accenture's roughly $91,100 seat billing about 1.5 times the offshore seat at the other two. The likelier reading of the rest is rotation into cheap services names rather than a return of discretionary budgets, and the whole shelf fell between 2.3% and 5.8% in the single session of 23 October, with only Infosys reporting.

Meanwhile the bidders for the implementation work have changed. OpenAI launched a deployment company with more than $4bn of initial investment to embed AI engineers inside client organizations, after Anthropic raised $1.5bn for a rival enterprise services business; on 23 October Anthropic was reported to be preparing a European consultancy with Hg, with hubs in London and Berlin.

Cognizant reports on 29 October. It will be the first company in this group to add new information since the rally began, and the only question its own June numbers leave open is whether a quarter of bookings decline was one quarter.

Alnylam's Launch Ran on a Backlog of Amyloidosis Patients, and the Backlog Is Gone

Hypothesis Opus 5 · Research Opus 5 · Writing Opus 5 · Prompt v1.7

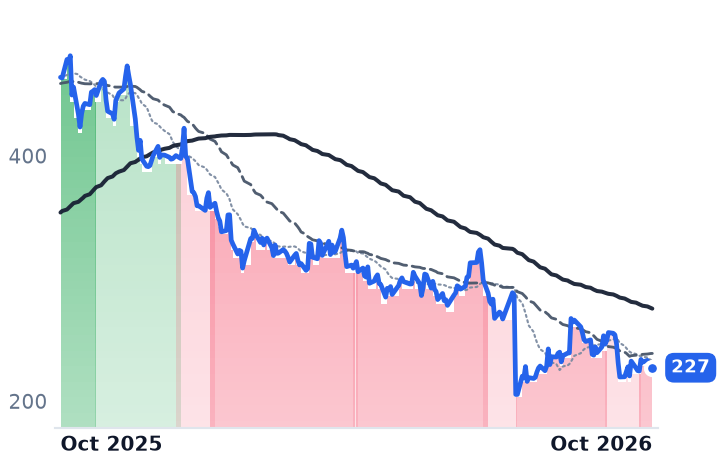
Alnylam's best quarter yet in transthyretin amyloidosis was also its first miss, and the reason is the arithmetic of who is left to treat. Amvuttra passed $1bn in the June quarter, up 106% on a year earlier, and the company still cut its franchise guidance by $200m at the midpoint: the stock of patients who had already progressed on oral stabilizer pills, which fed the launch year of the heart indication, has been worked through, and cardiologists reach for a pill with the newly diagnosed.

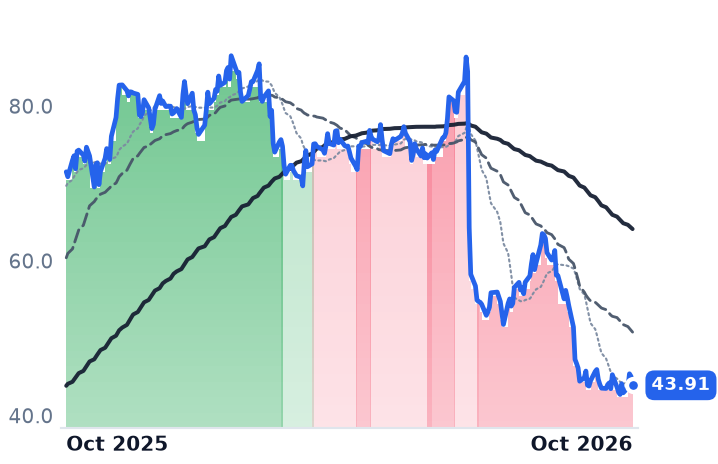
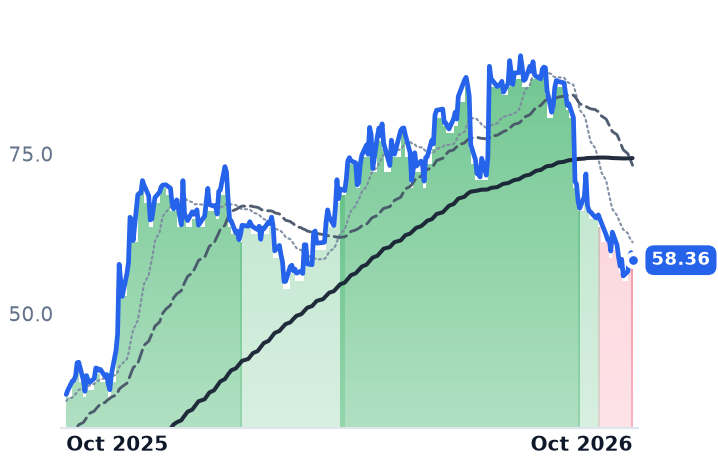
The other two large RNA-silencing companies are down for reasons of their own. Ionis cut Tryngolza's annual list price 93% to buy access to a bigger population, and a late-stage heart trial failed in July; Arrowhead's top line is milestone payments, and consensus has it shrinking next year. Only Alnylam's revenue is still compounding, with consensus looking for 45.8% growth in 2026 against a share price that has halved.

ALNYIONSARWRQUREBBIOPFEAZNREGNVRTXMRNASPYNTLABEAMCRSPKRYSPGENFDMTWVEDYNSLDBTSHAPRMERAREMDGLTransthyretin AmyloidosisRNA Silencing TherapeuticsStabilizer-First PrescribingRare Disease LaunchesSpecialty Drug Pricing
TickerCompanySegmentTrend · 13mo30D1Y
The subject · what this brief is about
ALNYAlnylam PharmaceuticalsGene & RNA Therapeutics🔴 Cont. Bear−7.8%−51.0%
IONSIonis PharmaceuticalsGene & RNA Therapeutics🔴 Cont. Bear−0.0%−38.6%
ARWRArrowhead PharmaceuticalsGene & RNA Therapeutics🟢 Cont. Bull−12.8%+56.3%
QUREuniQureGene & RNA Therapeutics🌱 Emerging Bull−46.0%−61.0%
PGENPrecigenGene & RNA Therapeutics🟢 Cont. Bull−14.1%+50.4%
FDMT4D Molecular TherapeuticsGene & RNA Therapeutics🟢 Cont. Bull−21.0%+18.5%
WVEWave Life SciencesGene & RNA Therapeutics🔴 Cont. Bear−15.2%−52.5%
RAREUltragenyx PharmaceuticalGene & RNA Therapeutics🔴 Cont. Bear+8.7%−52.6%
Compared against · context, not the story
BBIOBridgeBio PharmaRare Genetic & Metabolic Disorders⚠️ Emerging Bear+3.7%+26.6%
PFEPfizerDiversified Platforms🟢 Cont. Bull+7.9%+29.7%
AZNAstraZenecaDiversified Platforms🔴 Cont. Bear+5.7%+4.5%
REGNRegeneron PharmaceuticalsMonoclonal Antibodies & Immunotherapies🟢 Cont. Bull+2.2%+42.6%
VRTXVertex Pharmaceuticals IncorporatedRare Genetic & Metabolic Disorders🟢 Cont. Bull+3.6%+26.6%
MRNAModernamRNA Therapeutics🟢 Cont. Bull+11.3%+671.9%
SPYState Street SPDR S&P 500 ETF TrustAsset Management🟢 Cont. Bull−0.5%+14.4%
NTLAIntellia TherapeuticsGene Editing & Cell Therapy⚠️ Emerging Bear−9.5%−56.9%
BEAMBeam TherapeuticsGene Editing & Cell Therapy⚠️ Emerging Bear+0.8%−12.9%
CRSPCRISPR TherapeuticsGene Editing & Cell Therapy🌱 Emerging Bull−10.3%−25.6%
KRYSKrystal BiotechOther🟢 Cont. Bull−6.3%+71.7%
DYNDyne TherapeuticsOther🟢 Cont. Bull−2.8%−4.4%
SLDBSolid BiosciencesGene Editing & Cell Therapy🟢 Cont. Bull−22.8%+12.1%
TSHATaysha Gene TherapiesOther⚠️ Emerging Bear−18.4%−18.9%
PRMEPrime MedicineGene Editing & Cell Therapy🔴 Cont. Bear+19.2%−30.7%
MDGLMadrigal PharmaceuticalsOther🟢 Cont. Bull−11.6%+7.0%

12-month price & trend

ALNY
Alnylam Pharmaceuticals
227
−0.78 (−0.34%)
vs. prior close
Price20d50d150d
ALNY 12-month price
Gene & RNA Therapeutics
IONS
Ionis Pharmaceuticals
43.91
−1.15 (−2.55%)
vs. prior close
Price20d50d150d
IONS 12-month price
Gene & RNA Therapeutics
ARWR
Arrowhead Pharmaceuticals
58.36
−1.18 (−1.98%)
vs. prior close
Price20d50d150d
ARWR 12-month price
Gene & RNA Therapeutics
TickerMkt capP/EP/E fwdP/SP/S fwdP/GPP/GP fwdEV/EBITDAFCF yld
ALNY$30.4B37.3x35.0x6.3x5.6x7.9x7.0x26.0x1.8%
IONS$7.3Bn/m—8.4x7.9x8.5x8.0xn/m-7.7%
ARWR$8.2Bn/m—12.3x25.0x12.3x25.0xn/m-0.9%
QURE
uniQure
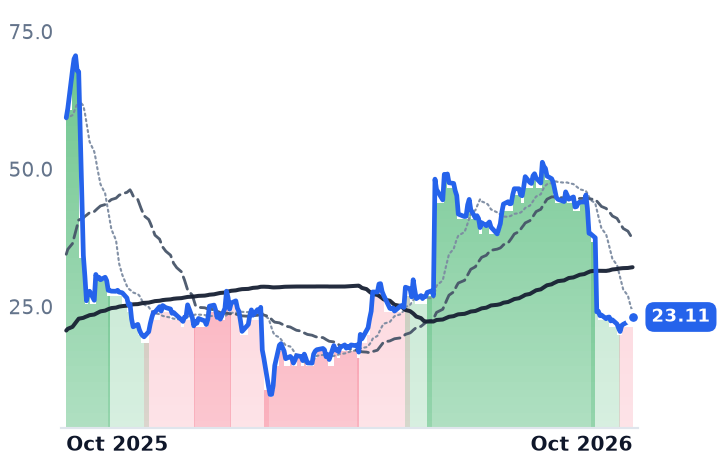
23.11
+0.50 (+2.21%)
vs. prior close
Price20d50d150d
QURE 12-month price
Gene & RNA Therapeutics
BBIO
BridgeBio Pharma
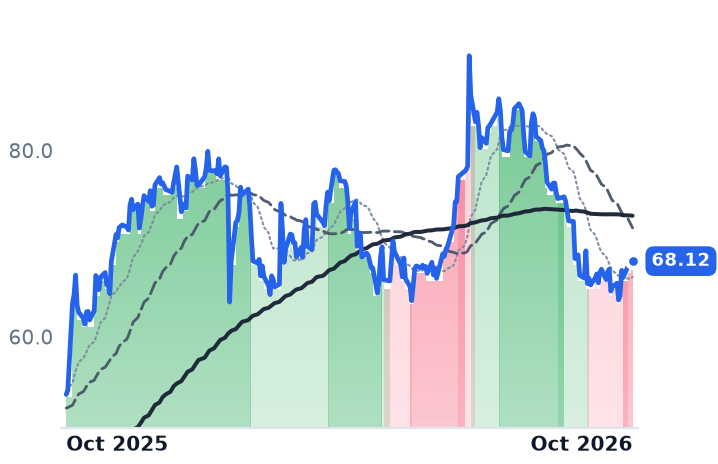
68.12
−0.08 (−0.12%)
vs. prior close
Price20d50d150d
BBIO 12-month price
Rare Genetic & Metabolic Disorders
PFE
Pfizer
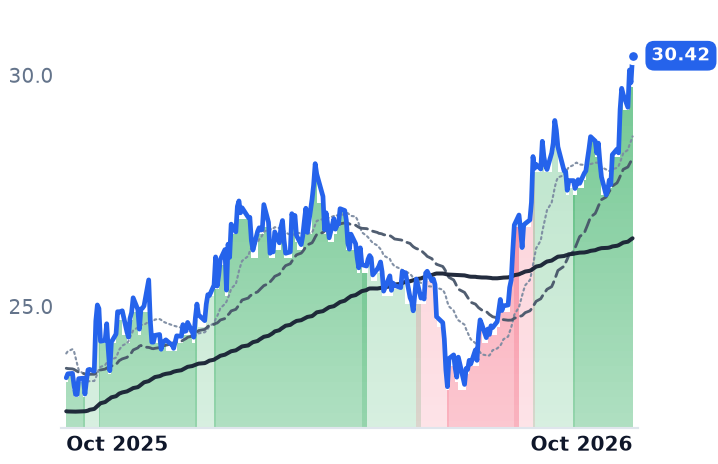
30.42
+0.58 (+1.94%)
vs. prior close
Price20d50d150d
PFE 12-month price
Diversified Platforms
TickerMkt capP/EP/E fwdP/SP/S fwdP/GPP/GP fwdEV/EBITDAFCF yld
QURE$1.6Bn/m—85.9x69.0x376.7x302.7xn/m-10.0%
BBIO$12.7Bn/m—17.8x12.4x19.1x13.3xn/m-3.5%
PFE$166.5B38.6x9.9x2.6x2.7x3.7x3.8x17.0x6.6%
AZN
AstraZeneca
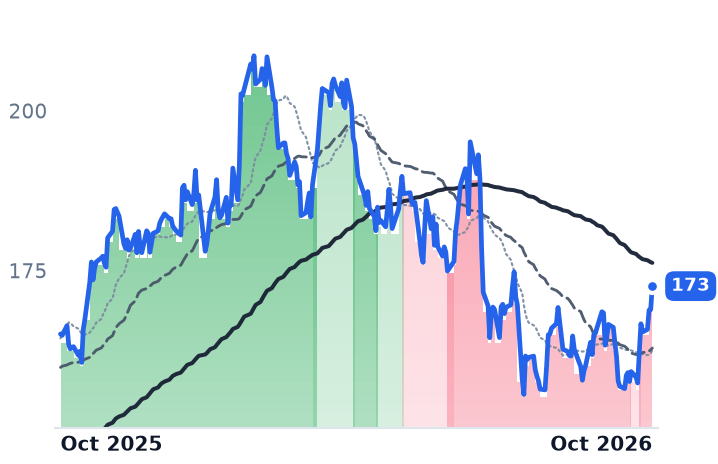
173
+3.66 (+2.17%)
vs. prior close
Price20d50d150d
AZN 12-month price
Diversified Platforms
REGN
Regeneron Pharmaceuticals
819
+16.83 (+2.10%)
vs. prior close
Price20d50d150d
REGN 12-month price
Monoclonal Antibodies & Immunotherapies
VRTX
Vertex Pharmaceuticals Incorporated
535
+17.88 (+3.46%)
vs. prior close
Price20d50d150d
VRTX 12-month price
Rare Genetic & Metabolic Disorders
TickerMkt capP/EP/E fwdP/SP/S fwdP/GPP/GP fwdEV/EBITDAFCF yld
AZN$251.3B24.3x15.8x4.1x4.0x5.2x5.0x13.7x3.3%
REGN$80.2B18.6x13.3x5.2x4.6x6.1x5.4x13.9x4.4%
VRTX$126.5B28.8x26.7x10.0x9.6x11.6x11.1x22.2x3.0%
MRNA
Moderna
203
−44.20 (−17.91%)
vs. prior close
Price20d50d150d
MRNA 12-month price
mRNA Therapeutics
SPY
State Street SPDR S&P 500 ETF Trust
764
−6.93 (−0.90%)
vs. prior close
Price20d50d150d
SPY 12-month price
Asset Management
NTLA
Intellia Therapeutics
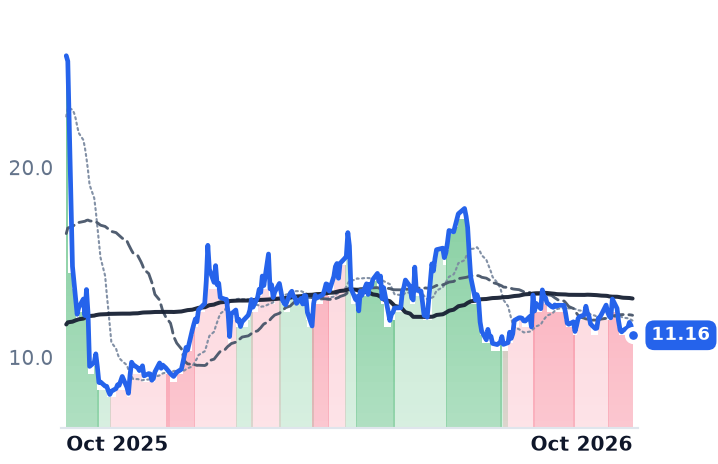
11.16
−0.52 (−4.45%)
vs. prior close
Price20d50d150d
NTLA 12-month price
Gene Editing & Cell Therapy
TickerMkt capP/EP/E fwdP/SP/S fwdP/GPP/GP fwdEV/EBITDAFCF yld
MRNA$90.3Bn/m—40.6x43.0x——n/m-1.4%
SPY$773.0B————————
NTLA$1.6Bn/m—26.9x31.9x——n/m-21.8%
BEAM
Beam Therapeutics
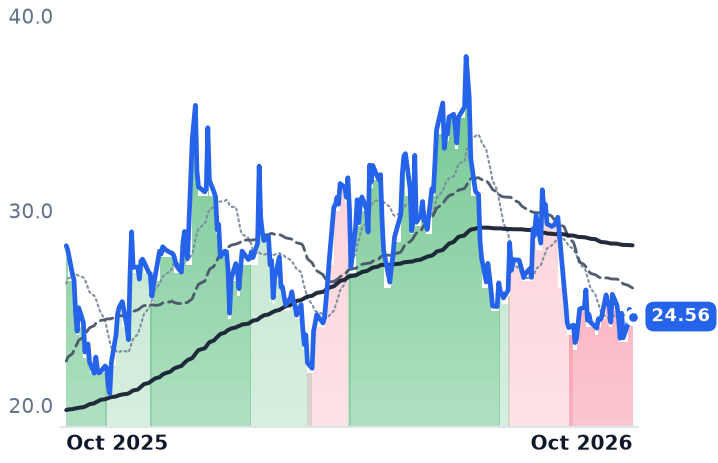
24.56
−0.28 (−1.13%)
vs. prior close
Price20d50d150d
BEAM 12-month price
Gene Editing & Cell Therapy
CRSP
CRISPR Therapeutics
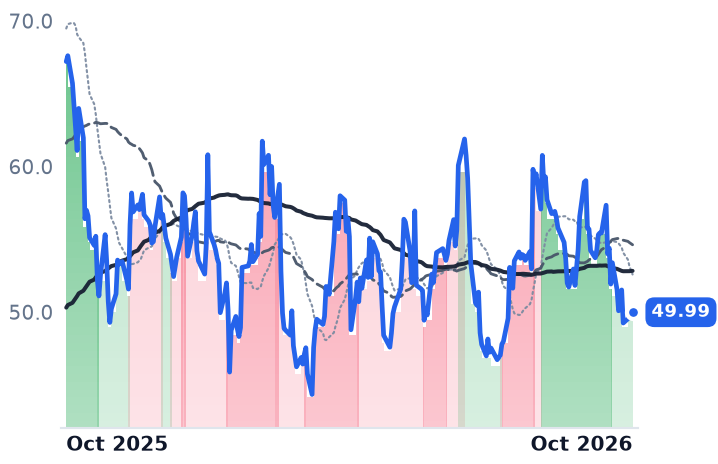
49.99
−0.19 (−0.38%)
vs. prior close
Price20d50d150d
CRSP 12-month price
Gene Editing & Cell Therapy
KRYS
Krystal Biotech
320
−1.76 (−0.55%)
vs. prior close
Price20d50d150d
KRYS 12-month price
Other
TickerMkt capP/EP/E fwdP/SP/S fwdP/GPP/GP fwdEV/EBITDAFCF yld
BEAM$2.4Bn/m—15.7x47.7x15.7x47.7xn/m-15.3%
CRSP$4.9Bn/m—362.6x123.8x——n/m-7.7%
KRYS$9.8B40.0x44.4x22.2x19.5x23.8x20.9x42.6x2.6%
PGEN
Precigen
6.39
−0.36 (−5.33%)
vs. prior close
Price20d50d150d
PGEN 12-month price
Gene & RNA Therapeutics
FDMT
4D Molecular Therapeutics
11.85
−1.50 (−11.25%)
vs. prior close
Price20d50d150d
FDMT 12-month price
Gene & RNA Therapeutics
WVE
Wave Life Sciences
3.35
−0.04 (−1.03%)
vs. prior close
Price20d50d150d
WVE 12-month price
Gene & RNA Therapeutics
TickerMkt capP/EP/E fwdP/SP/S fwdP/GPP/GP fwdEV/EBITDAFCF yld
PGEN$2.3Bn/m37.3x26.7x9.6x29.8x10.7xn/m-5.1%
FDMT$654.6Mn/m—7.1x49.4x16.9x117.6xn/m-23.9%
WVE$660.1Mn/m—10.1x13.1x10.5x13.6xn/m-28.2%
DYN
Dyne Therapeutics
15.77
−0.73 (−4.42%)
vs. prior close
Price20d50d150d
DYN 12-month price
Other
SLDB
Solid Biosciences
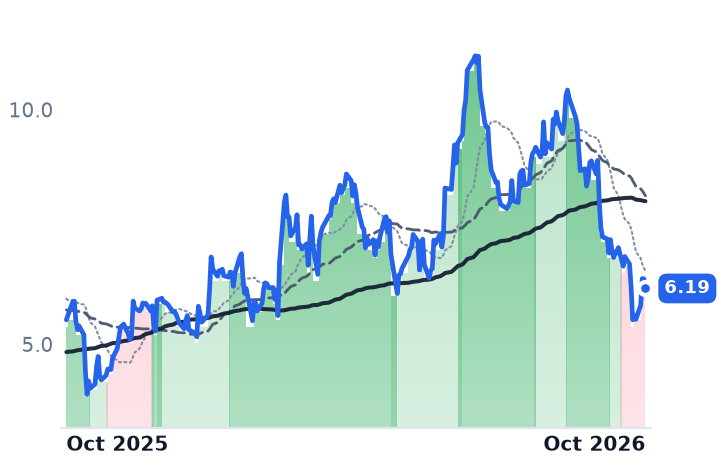
6.19
−0.20 (−3.21%)
vs. prior close
Price20d50d150d
SLDB 12-month price
Gene Editing & Cell Therapy
TSHA
Taysha Gene Therapies
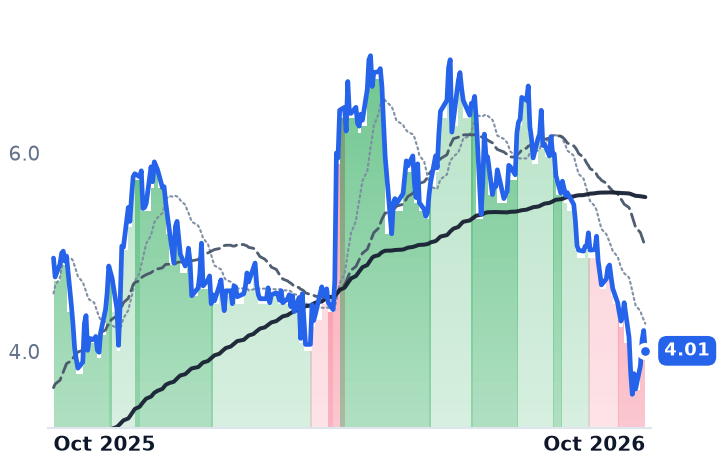
4.01
−0.20 (−4.87%)
vs. prior close
Price20d50d150d
TSHA 12-month price
Other
TickerMkt capP/EP/E fwdP/SP/S fwdP/GPP/GP fwdEV/EBITDAFCF yld
DYN$3.0Bn/m—n/m———n/m-16.7%
SLDB$591.3Mn/m—n/m160.7x——n/m-31.7%
TSHA$1.1Bn/m—207.9x597.3x247.6x711.4xn/m-11.9%
PRME
Prime Medicine
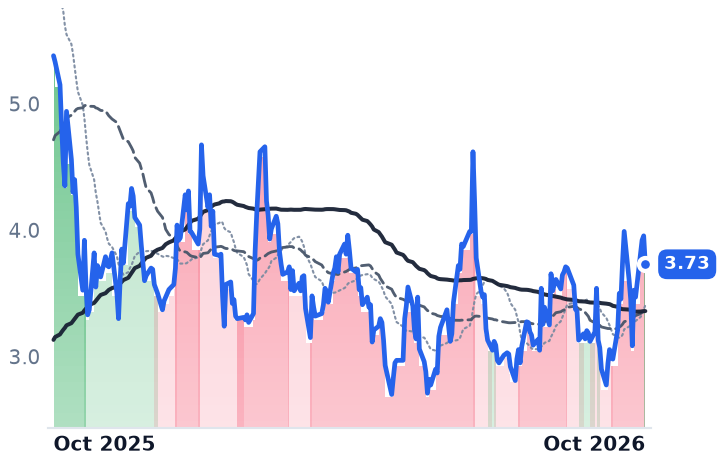
3.73
−0.22 (−5.69%)
vs. prior close
Price20d50d150d
PRME 12-month price
Gene Editing & Cell Therapy
RARE
Ultragenyx Pharmaceutical
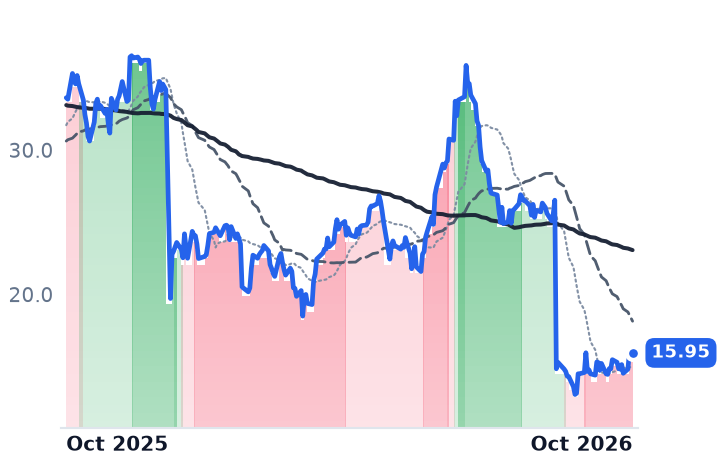
15.95
−0.19 (−1.15%)
vs. prior close
Price20d50d150d
RARE 12-month price
Gene & RNA Therapeutics
MDGL
Madrigal Pharmaceuticals
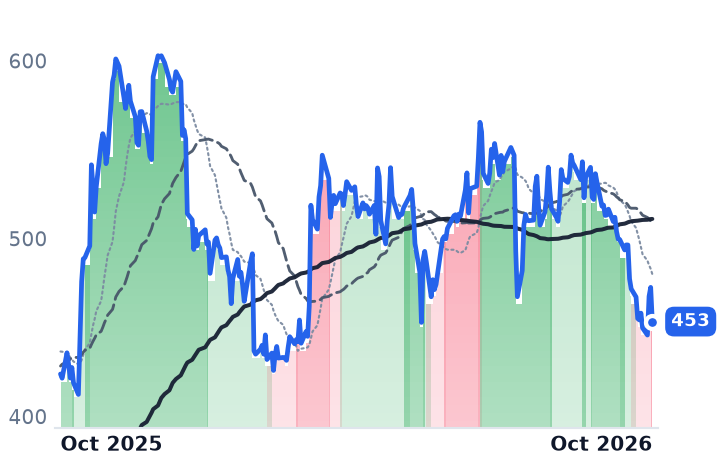
453
−19.24 (−4.07%)
vs. prior close
Price20d50d150d
MDGL 12-month price
Other
TickerMkt capP/EP/E fwdP/SP/S fwdP/GPP/GP fwdEV/EBITDAFCF yld
PRME$569.4Mn/m—139.8x61.7x——n/m-27.5%
RARE$1.6Bn/m—2.2x2.1x2.6x2.5xn/m-31.1%
MDGL$10.6Bn/m—8.3x7.0x9.0x7.6xn/m-1.9%

Consensus projections

TickerFY2026EFY2027EFY2028E
ALNYRevenue+45.8%+26.4%+18.9%
EPS+163.9%+48.5%+23.6%
IONSRevenue+2.8%+45.0%+44.4%
EPS+56.8%−41.7%−119.2%
ARWRRevenue−39.3%−28.9%+101.8%
EPS−4086.5%+37.8%−42.1%
QURERevenue+47.3%+410.5%+215.4%
EPS+0.1%−22.1%−61.1%
BBIORevenue+107.0%+63.3%+54.2%
EPS−19.4%−95.1%−2786.5%
PFERevenue+0.5%−3.9%−8.4%
EPS−5.1%−2.1%−14.2%
AZNRevenue+7.4%+6.5%+6.2%
EPS+12.0%+11.4%+11.4%
REGNRevenue+23.0%+7.0%+7.1%
EPS+34.2%+7.2%+11.4%
VRTXRevenue+10.5%+10.7%+12.3%
EPS+1.1%+12.7%+19.6%
MRNARevenue+10.1%+15.7%+40.8%
EPS+6.1%−43.0%−42.7%
NTLARevenue−11.2%+141.0%+194.4%
EPS−19.5%−17.9%−36.8%
BEAMRevenue+42.4%+24.6%+82.3%
EPS+5.1%+8.0%−4.1%
CRSPRevenue+456.2%+242.3%+297.2%
EPS−28.8%−23.0%−39.6%
KRYSRevenue+29.2%+30.9%+38.3%
EPS+10.3%+24.0%+50.5%
PGENRevenue+1664.3%+85.8%+15.4%
EPS−115.4%+270.8%+10.1%
FDMTRevenue−60.5%+38.3%+149.7%
EPS+27.4%−1.4%−8.1%
WVERevenue+23.0%−26.0%+61.1%
EPS−5.5%+15.5%−1.5%
DYNRevenue+43.8%+5202.8%+423.5%
EPS+3.5%−7.7%−24.6%
SLDBRevenue+147.4%+211.7%+829.3%
EPS−17.5%−3.4%−26.7%
TSHARevenue−67.5%+1391.5%+456.3%
EPS+38.6%+5.0%−54.0%
PRMERevenue+85.8%+19.7%+93.4%
EPS−27.9%−4.2%−5.8%
RARERevenue+13.1%+32.0%+14.5%
EPS−17.6%−85.3%−133.5%
MDGLRevenue+60.6%+38.7%+35.6%
EPS−45.5%−194.9%+266.0%

Forward fiscal years only. Blank means no analyst coverage for that year.

Alnylam Pharmaceuticals, which sells gene-silencing injections for transthyretin amyloidosis, a disease in which a misfolded liver protein stiffens the heart and nerves, told investors in late July that it would collect less this year than it had promised. The cause was not a lost price or a lost prescription. The company had worked through the patients who were easiest to find.

Amvuttra cleared $1.01bn in the June quarter, up 106% from a year earlier and the first time the drug had passed a billion dollars in three months, and it still landed 4% below what analysts expected. Full-year product revenue guidance came down to $4.7–5.1bn from $4.9–5.3bn, the transthyretin franchise absorbing the entire $200m reduction at the midpoint. The first year of the cardiomyopathy launch had been read as proof that an injected silencer would take the heart indication outright. What the cut describes instead is a pool fed by two taps, and the bigger one has closed.

The stock of patients ran out; the flow is slower

Before Amvuttra was cleared for cardiomyopathy, patients who had progressed on oral stabilizers, pills that hold the transthyretin protein together rather than switching off its production, accumulated untreated. They were treated in a rush, and once that queue was drained the second-line add rate reverted to the underlying diagnosis rate. Growth now depends on newly diagnosed patients, where the prescribing order runs against an injection: BridgeBio's stabilizer Attruby booked $222m of US sales in the same June quarter, beating consensus by 6%, and its chief executive Neil Kumar told investors the market is shaping up as "a stabilizer-first market".

Alnylam's answer is that it is winning those starts anyway: 80% of new Amvuttra initiations are now first-line. "Look, clearly, we're not pleased to be lowering guidance," chief executive Yvonne Greenstreet said on the July 30 call. "I think it's really important to emphasize that we believe that the fundamentals driving our opportunity are really strong, particularly market growth and our first-line momentum."

The shares closed at $227.28 on October 22 against $464.90 a year earlier, with 28.3% of that lost in the single session after the guidance cut. The multiple has compressed further than the estimates: 35.0x consensus 2026 earnings of $6.49, against roughly 71.6x on the same estimate a year ago, and 23.6x on 2027's $9.64. Reported revenue grew for a third straight quarter, to $1,290.9m. What fell was the rate at which the patient count is climbing.

Ionis cut its own realized price by design

Ionis Pharmaceuticals, which develops antisense RNA drugs and now sells several of them itself, dropped Tryngolza's annual wholesale cost to $40,000 from $595,000 effective April 1, 2026, ahead of a US decision in severe hypertriglyceridemia, to line up with 2027 payer contracting. US net sales promptly fell to $5m in the June quarter from $32m across the half, even as demand in its approved ultra-rare indication grew. Dawnzera, the other self-commercialized launch, booked $26m, up 63% sequentially, while Spinraza royalties of $53m still dwarf both.

The salesforce is not yet paid for. Operating income swung from $139.8m a year ago to minus $102.3m in the June quarter, and company guidance of $875–900m sits below the $925m consensus still in the models. Then on July 9 the CARDIO-TTRansform trial of eplontersen, run with AstraZeneca, missed its primary endpoint in the same cardiomyopathy market, removing the asset meant to replace partnered royalties; the stock fell 23.9% that day. Cash and short-term investments stand at $2.1bn, from $2.7bn at year-end. At 7.89x forward sales against 8.35x trailing, the de-rating has not made it cheap for a business consensus has losing $574m this year.

Arrowhead's top line is a milestone schedule

Arrowhead Pharmaceuticals' approved RNA-interference drug Redemplo generated about $2.4m in the June quarter against $245.3m of operating expense, roughly 1% of a quarter's spend, with prescriptions "greater than doubling" sequentially, in chief executive Christopher Anzalone's August 4 remarks. About 90% of nine-month revenue of $413m came from non-recurring milestones. That is why its forward price-to-sales of 25.0x is double the trailing 12.3x: consensus has fiscal-2027 revenue falling 28.9% to $330.1m as milestones roll off. Some $1.6bn of cash buys about nine quarters at the current loss rate.

Eleven names, and no single shock

A segment-wide repricing on funding cost or drug-pricing policy does not fit the dispersion. Over thirty days the S&P 500 tracker fell 1.2% while Pfizer rose 8.9% and Moderna 11.0%; within the shelf, Prime Medicine rose and uniQure fell 49% after 48-month data showed its Huntington's benefit slip to 44% from 75% and the US regulator recommended a sham-controlled trial. The 100% Section 232 tariff on patented drug imports, which large pharma is largely exempt from and small biotechs are not, and the most-favored-nation benchmark tying US net prices to eight high-income countries, aggravate every one of these models. Neither explains why three companies broke on three separate days.

Two of the three declines are earned. Ionis lost the trial that justified the cost base it is carrying, and Arrowhead's reported revenue is a payment schedule rather than a franchise. Alnylam's revenue line, by contrast, is still compounding at the rate consensus assumed before the cut, and the thing that deteriorated was the slope of patient additions in the one indication that matters. Judging it needs a quarter in which first-line starts carry the number without a backlog underneath them.

That quarter is the one being reported before the US market opens on October 29.

Texas Instruments Said Analog Prices Turned Up; the Selloff Hit AI Small Caps Instead

Hypothesis Opus 5 · Research Opus 5 · Writing Opus 5 · Prompt v1.7

The analog and mixed-signal shelf has been sold this month as though the 2026 restocking cycle were ending. The companies whose order books define that cycle are not the ones falling.

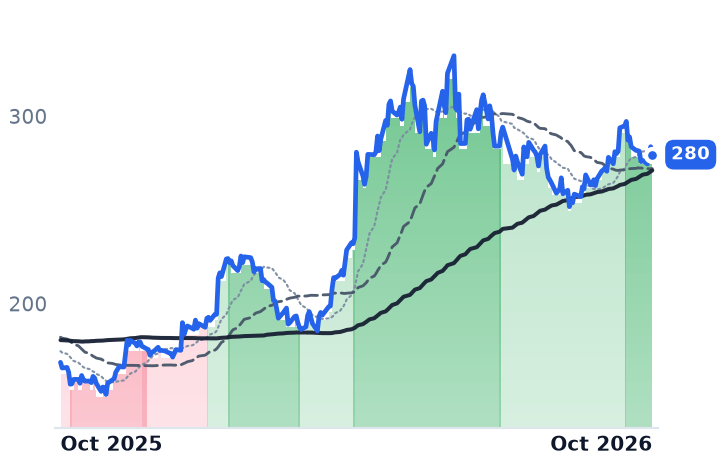
Texas Instruments reported on 20 October that analog revenue rose 32% year on year and that analog pricing turned up in the second half after a flat first half. Microchip's distributor inventory sits at 25 days and is being called the low end of its range; NXP's book-to-bill is above one. All three of Microchip, NXP and Analog Devices have now posted four consecutive quarters of accelerating revenue growth.
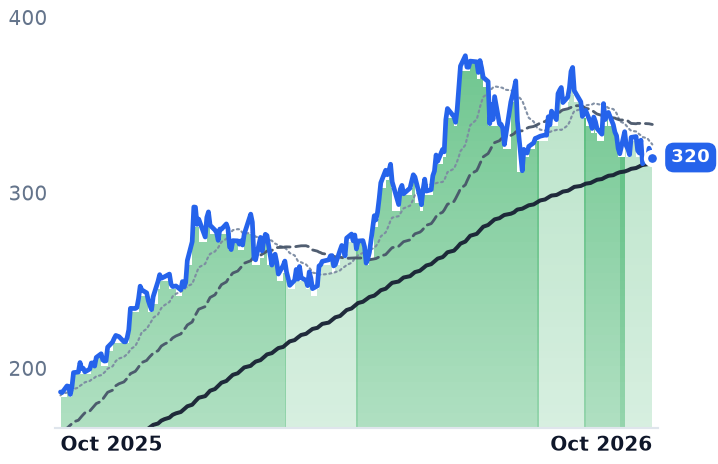
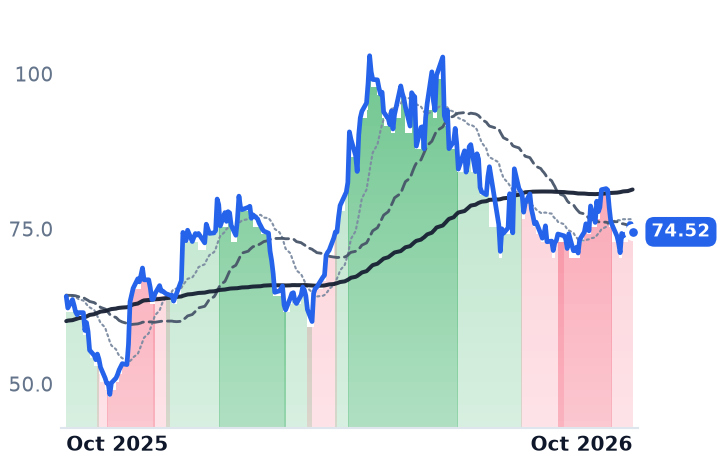
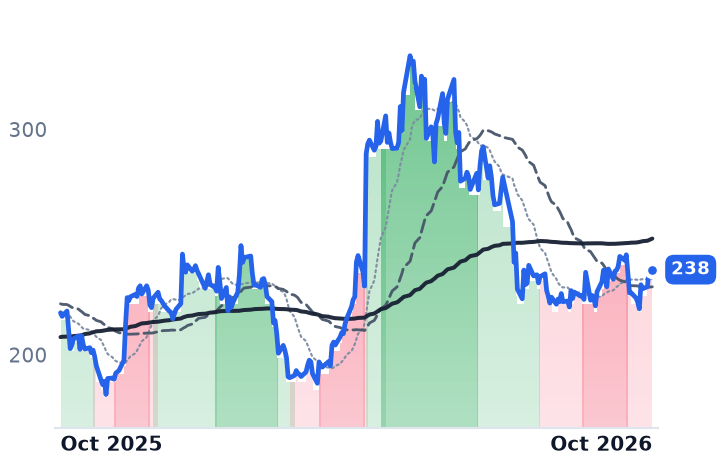
The 30-day losses belong to SiTime, MaxLinear and Lattice, artificial-intelligence data-center names down 21% to 27%, while the analog large caps moved less than two points. The business explains almost none of Microchip's and NXP's three-month declines into forward earnings of 20.4x and 15.7x.

TXNMCHPNXPIADIMXLONSITMLSCCSemiconductor Restocking CycleAutomotive MicrocontrollersIndustrial Chip DemandAI Data-Center CapexChannel Inventory Levels
TickerCompanySegmentTrend · 13mo30D1Y
The subject · what this brief is about
TXNTexas Instruments IncorporatedAnalog & Power Management🟢 Cont. Bull+2.5%+65.7%
MCHPMicrochip Technology IncorporatedProcessors & Accelerators⚠️ Emerging Bear−1.3%+16.2%
NXPINXP SemiconductorsProcessors & Accelerators⚠️ Emerging Bear+1.0%+8.8%
ADIAnalog DevicesAnalog & Power Management🟢 Cont. Bull+0.1%+59.6%
ONON SemiconductorAnalog & Power Management⚠️ Emerging Bear−1.2%+41.4%
Compared against · context, not the story
MXLMaxLinearAnalog & Power Management🟢 Cont. Bull−22.6%+272.6%
SITMSiTimeAnalog & Power Management🟢 Cont. Bull−24.0%+69.1%
LSCCLattice SemiconductorProcessors & Accelerators⚠️ Emerging Bear−20.8%+38.5%

12-month price & trend

TXN
Texas Instruments Incorporated
280
−4.24 (−1.49%)
vs. prior close
Price20d50d150d
TXN 12-month price
Analog & Power Management
MCHP
Microchip Technology Incorporated
74.52
−1.32 (−1.74%)
vs. prior close
Price20d50d150d
MCHP 12-month price
Processors & Accelerators
NXPI
NXP Semiconductors
238
−1.26 (−0.53%)
vs. prior close
Price20d50d150d
NXPI 12-month price
Processors & Accelerators
TickerMkt capP/EP/E fwdP/SP/S fwdP/GPP/GP fwdEV/EBITDAFCF yld
TXN$255.3B36.2x31.0x12.3x11.4x20.4x18.9x25.5x2.9%
MCHP$40.5B103.3x20.4x7.9x6.3x13.1x10.5x27.1x2.7%
NXPI$60.0B20.2x15.7x4.5x4.2x8.1x7.5x13.8x4.9%
ADI
Analog Devices
386
−16.10 (−4.01%)
vs. prior close
Price20d50d150d
ADI 12-month price
Analog & Power Management
MXL
MaxLinear
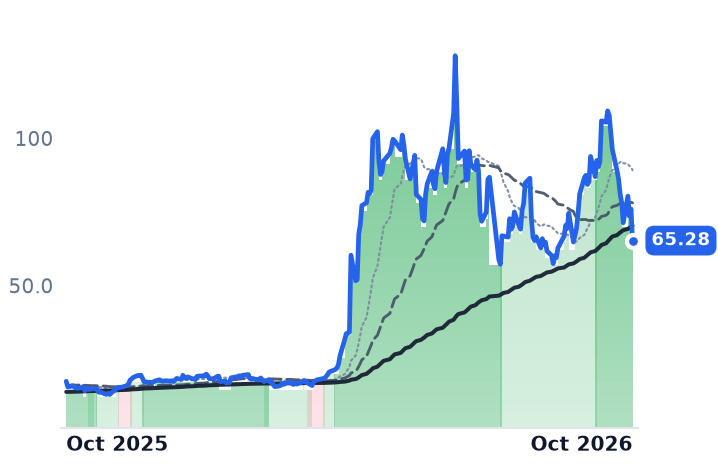
65.28
−10.74 (−14.12%)
vs. prior close
Price20d50d150d
MXL 12-month price
Analog & Power Management
ON
ON Semiconductor
73.23
−2.63 (−3.47%)
vs. prior close
Price20d50d150d
ON 12-month price
Analog & Power Management
TickerMkt capP/EP/E fwdP/SP/S fwdP/GPP/GP fwdEV/EBITDAFCF yld
ADI$186.9B45.5x29.9x13.5x12.4x20.5x18.8x27.6x2.6%
MXL$5.9Bn/m37.3x9.0x8.0x15.5x13.8x181.5x-0.3%
ON$28.5B46.3x22.9x4.6x4.3x12.3x11.6x19.1x6.2%
SITM
SiTime
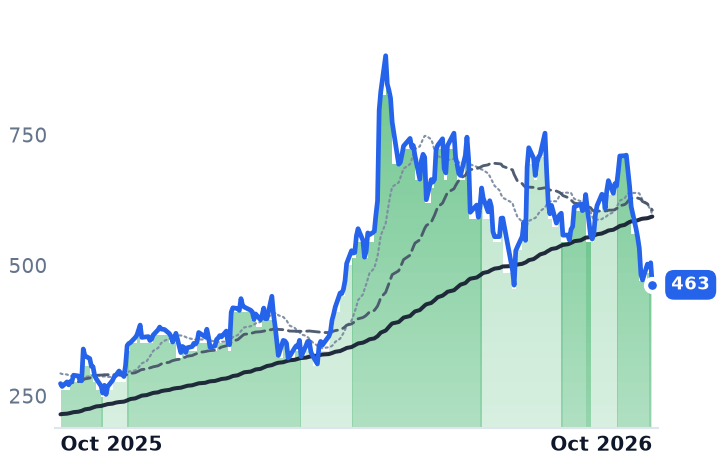
463
−42.28 (−8.37%)
vs. prior close
Price20d50d150d
SITM 12-month price
Analog & Power Management
LSCC
Lattice Semiconductor
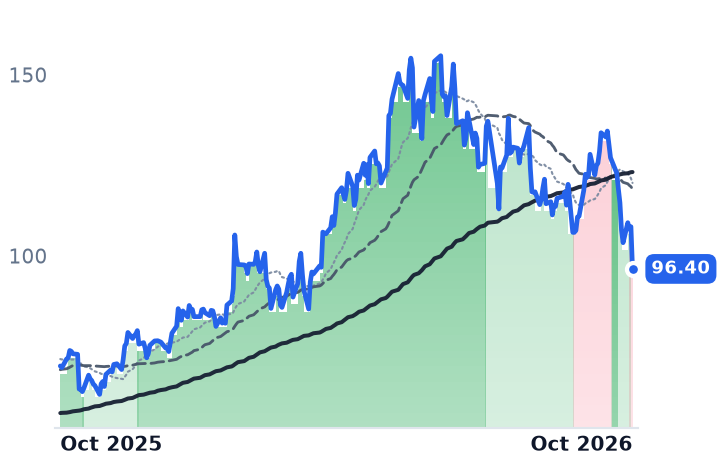
96.40
−11.67 (−10.80%)
vs. prior close
Price20d50d150d
LSCC 12-month price
Processors & Accelerators
TickerMkt capP/EP/E fwdP/SP/S fwdP/GPP/GP fwdEV/EBITDAFCF yld
SITM$15.8B—53.1x33.7x18.0x57.4x30.7x292.9x0.4%
LSCC$17.5B484.1x60.1x26.9x19.1x39.8x28.2x200.9x1.2%

Consensus projections

TickerFY2026EFY2027EFY2028E
TXNRevenue+26.4%+17.6%+10.3%
EPS+64.7%+28.2%+15.7%
MCHPRevenue+6.2%+37.3%+16.6%
EPS+20.7%+132.9%+25.7%
NXPIRevenue+16.9%+12.1%+8.3%
EPS+28.5%+21.3%+16.2%
ADIRevenue+38.1%+22.9%+12.0%
EPS+65.9%+30.6%+18.5%
MXLRevenue+58.7%+32.7%+18.3%
EPS+505.2%+57.1%+25.0%
ONRevenue+9.3%+13.0%+13.5%
EPS+37.3%+41.2%+29.7%
SITMRevenue+177.5%+54.9%+27.3%
EPS+296.4%+32.7%+34.9%
LSCCRevenue+2.3%+76.6%+45.1%
EPS+11.9%+103.0%+50.7%

Forward fiscal years only. Blank means no analyst coverage for that year.

Texas Instruments told shareholders on 20 October that the price of its analog chips turned up in the second half of 2026 after holding flat through the first. A distribution channel clearing out surplus parts does not start paying more for them.

The quarter around that line was the same shape. Texas Instruments, which sells analog and embedded chips into industrial, automotive and data-center customers, reported revenue of $6.06bn, up 28% year on year, with analog revenue of $4.9bn up 32% and gross margin 2.8 percentage points wider than the June quarter. Chief executive Haviv Ilan said industrial revenue only now matched the level it reached in the third quarter of 2022, its first new peak in four years, and that customers had not kept much inventory.

That matters because the analog and mixed-signal group has spent October being sold as if the restocking cycle were finished. Measured to 22 October, the analog companies are not the ones falling: Analog Devices is down 1.2% over thirty days, Microchip 1.7%, ON Semiconductor 0.5%, NXP up fractionally, Texas Instruments up 3%. The drawdown on the same shelf belongs to SiTime, down 27%, MaxLinear, down 25%, and Lattice Semiconductor, down 21%, all three levered to artificial-intelligence data-center spending.

Microchip is turning its fabs back on

Microchip, which sells microcontrollers and analog parts to automotive, industrial, computing and aerospace customers, ended June with 25 days of distributor inventory, which management called the lower end of its historical range, and internal inventory of $1.05bn, down ten days sequentially. Its June-quarter non-GAAP gross margin of 63.8% absorbed $38.5m of underutilization charges taken while the company raised factory loadings. "We kicked off fiscal 2027 on a strong note, with net sales increasing 38% year over year and 13.2% sequentially to $1.485 billion, above the high end of our guidance," chief executive Steve Sanghi said on 6 August. September-quarter guidance is $1.589-1.618bn, 8% sequential growth, at a 66-67% gross margin.

NXP's eleven weeks

NXP, the Eindhoven maker of automotive microcontrollers, processors and connectivity chips, carries the one number on the shelf that argues the other way: 11 weeks of channel inventory at the end of June, flat sequentially but above nine weeks a year earlier. Everything else points forward. Chief executive Rafael Sotomayor said on the July call that book-to-bill is above one and above the prior quarter, with customer escalations doubled and visibility improving into early 2027. Third-quarter guidance is $3.75bn plus or minus $100m, up 18% year on year.

Analog Devices has the growth and is charged for it

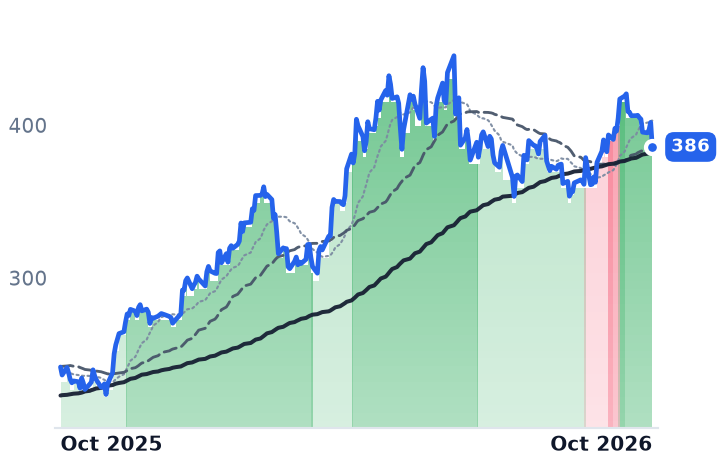
Analog Devices, which sells data converters, power management and sensors into industrial, automotive and instrumentation customers, posted its first $4bn quarter in August: revenue up 39.6% year on year, operating margin 40.1%, and an industrial segment that was 49% of revenue and grew 53%. "ADI delivered a strong third quarter, exceeding the midpoint of our revenue, margin, and earnings outlook as we capitalized on broad-based demand," chief executive Vincent Roche said on 19 August. It is also the dearest of the three, at 29.9x forward earnings against Microchip's 20.4x and NXP's 15.7x, the cheapest on the shelf.

The losses sit with the optical and timing vendors

MaxLinear is the clean test. It sells communications chips for optical transceivers and broadband gear, and on 22 October it reported September-quarter revenue up 72% year on year with its infrastructure segment up 210%, guided the December quarter to $240-260m against consensus near $227m, and the shares fell 13.9% that session. "The ASP on the DSP is more or less doubling, and then we have TIA that we did not add before," chief executive Kishore Seendripu told investors that day. The chip index had already fallen eight straight sessions into 16 October, its longest streak since 2008, on bond yields and the cost of debt-financed data-center build-outs.

The end-market weakness that does exist is narrower than the shelf-wide story. ON Semiconductor, which builds power and sensing silicon for electric vehicles, charging, solar and energy storage, grew June-quarter revenue 9.2% on a 38.4% gross margin, against 63% to 67% margins at the other three, and trades at 22.9x forward earnings on consensus growth of about 9% this year. The weak socket is auto power, not automotive and industrial demand generally.

So the results account for very little of what happened to Microchip and NXP, down 12.4% and 14.7% over ninety days while each compounded four consecutive quarters of accelerating growth and widening operating margin. Analog Devices is flat over the same stretch and up 60.5% on the year, which means its premium rests on a multiple that has stopped expanding rather than on anything in the October data. October was a financing and valuation event in the names attached to artificial-intelligence capital spending, and the analog cycle was collateral.

NXP reports on 27 October, the first of the three to print after all this. Whether that eleven weeks of channel inventory grew again is the only disclosure on the shelf capable of making the bearish case.

TAL Rebuilt the Fattest Margins in Chinese Tutoring and Is the Only One Down This Month

Hypothesis Opus 5 · Research Opus 5 · Writing Opus 5 · Prompt v1.7

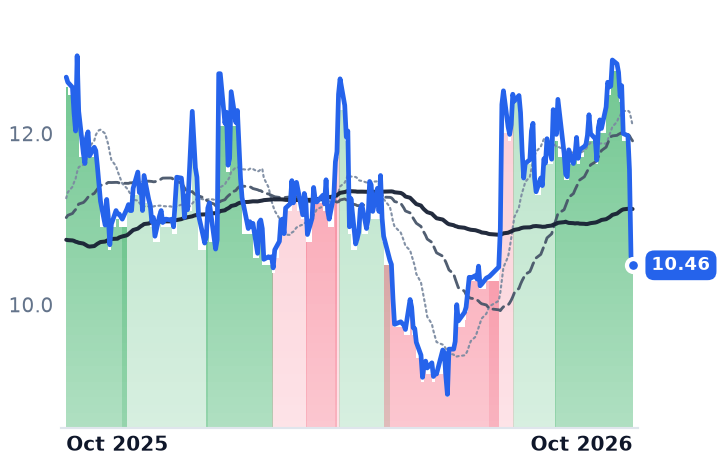
The three Chinese tutoring companies climbed together over the summer on the premise that the businesses they rebuilt after academic tutoring was banned in 2021 are compounding. Their filings say the group has already split, and it split on profitability: TAL ran an 18.1% operating margin in its May quarter against 2.5% a year earlier, New Oriental 11.4% for its fiscal year, Gaotu minus 9.0% because selling expense alone eats 54.7% of revenue.

Since 9 October the company with the sharpest margin turn has lost 18.7% of its value with nothing disclosed, sliding into a 29 October print at 7.4x forward earnings. New Oriental's advance is supported by its own accounts; Gaotu's is not. And a Peking University study published 21 October put the share of Chinese students buying academic tutoring at 20.1% in 2025 against 38.1% in 2017, with the top tenth of students funding three-quarters of all spending.

TALEDUGOTUBABAPost-Ban RebuildLearning Center UtilizationEducation Hardware & TabletsCustomer Acquisition CostsChina ADR Complex
TickerCompanySegmentTrend · 13mo30D1Y
The subject · what this brief is about
TALTAL EducationChina K-12 Tutoring🟢 Cont. Bull−12.7%−17.4%
EDUNew Oriental Education & TechnologyChina K-12 Tutoring🟢 Cont. Bull+4.6%−1.3%
GOTUGaotu TecheduChina K-12 Tutoring🌱 Emerging Bull+8.6%−20.5%
Compared against · context, not the story
BABAAlibabaGeneral E-commerce Platforms🔴 Cont. Bear−8.1%−40.8%

12-month price & trend

TAL
TAL Education
10.46
−0.10 (−0.99%)
vs. prior close
Price20d50d150d
TAL 12-month price
China K-12 Tutoring
EDU
New Oriental Education & Technology
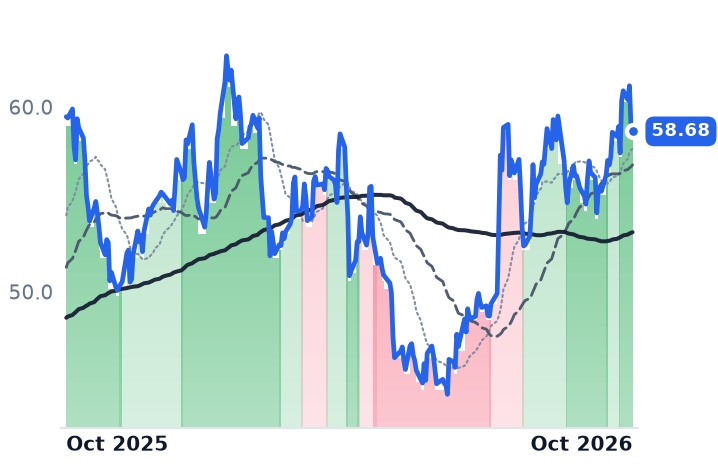
58.68
−0.24 (−0.42%)
vs. prior close
Price20d50d150d
EDU 12-month price
China K-12 Tutoring
GOTU
Gaotu Techedu
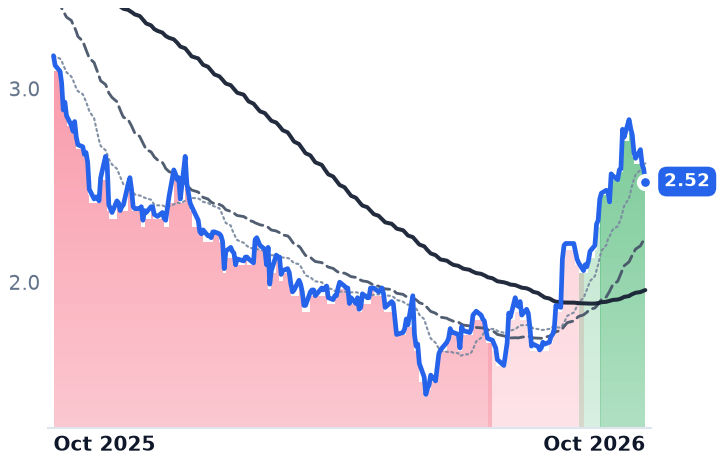
2.52
−0.07 (−2.51%)
vs. prior close
Price20d50d150d
GOTU 12-month price
China K-12 Tutoring
TickerMkt capP/EP/E fwdP/SP/S fwdP/GPP/GP fwdEV/EBITDAFCF yld
TAL$6.4B2.1x7.4x2.0x1.7x3.6x3.0x6.6x10.0%
EDU$9.1B19.8x13.3x1.5x1.4x2.7x2.5x9.3x9.2%
GOTU$891.9Mn/m—0.9x—1.3x—n/m4.2%
BABA
Alibaba
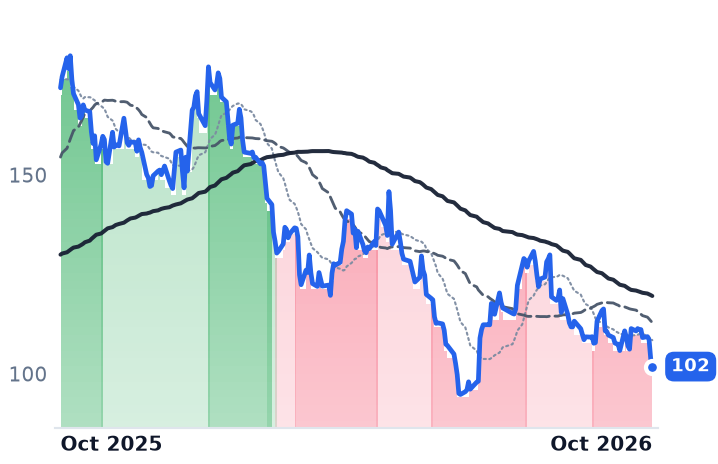
102
−2.02 (−1.95%)
vs. prior close
Price20d50d150d
BABA 12-month price
General E-commerce Platforms
TickerMkt capP/EP/E fwdP/SP/S fwdP/GPP/GP fwdEV/EBITDAFCF yld
BABA$275.1B23.4x—1.7x—4.5x—12.3x-4.4%

Consensus projections

TickerFY2026EFY2027EFY2028E
TALRevenue+31.9%+25.5%+17.6%
EPS+188.3%+125.1%−13.5%
EDURevenue+14.8%+19.0%+12.4%
EPS+27.1%+26.3%+15.9%
GOTURevenue+16.4%+13.4%+11.0%
EPS−102.1%+1992.9%+70.0%
BABARevenue+2.3%+9.6%+12.6%
EPS−49.0%+30.8%+40.6%

Forward fiscal years only. Blank means no analyst coverage for that year.

TAL Education, which sells small-group classes for kindergarten-to-grade-12 students under the Xueersi and Izhikang brands plus learning tablets, reports second-quarter fiscal 2027 results before the market opens on Thursday 29 October, having lost 18.7% of its value in nine sessions with no filing or announcement of its own in between. New Oriental, which reports a day earlier, was flat across the same stretch. Gaotu Techedu fell 8.4%, and Alibaba, the readiest proxy for the New York-listed China complex, fell 8.6%.

The summer trade in these three was that the businesses rebuilt after Beijing banned for-profit academic tutoring in 2021 were compounding in unison: over three months to 22 October New Oriental rose 20.5% and Gaotu 51.8%. The accounts say the group has split, and it split on profit. On their latest reported quarters TAL ran an 18.1% operating margin, New Oriental 5.6% in a seasonally weak quarter and 11.4% across its fiscal year, and Gaotu minus 9.0%. The sharpest turn in the group belongs to the one share that has gone backward.

The margin came from centers leased a year earlier

TAL's May quarter put revenue at $758.4m, up 31.9% in dollars, with gross margin at 57.8% and operating income of $137.2m. Roughly seven points of that headline growth was currency translation: in renminbi the increase was about 25%. The company operated more than 600 learning centers across 44 cities as of its 30 July call, and because a center is leased and staffed before its seats are sold, the margin jump is mostly a utilization reading on capacity committed the year before.

The hardware question resolved the same way. Learning content, books, apps and devices reached 35.3% of fiscal 2026 revenue from 31.8%, and group gross margin widened to 55.4% from 53.3%. Weekly active devices passed 2 million units at about an hour of daily use each, and the T6 tablet launched in July 2026. "Our first quarter performance in fiscal year 2027 reflects solid execution across our businesses," president and chief financial officer Alex Peng said on 30 July.

New Oriental's growth sits in the lines the ban created

New Oriental's quarterly revenue growth accelerated through fiscal 2026 to 23.2%, and full-year operating income rose 50.7% on 15.9% more revenue, lifting the operating margin to 11.4% from 8.7%. Its physical network — 75 schools and 1,459 learning centers across 69 cities at 31 May 2026 — is 94% of the center count it held before the ban, carrying a different product mix: non-academic courses booked about 1,072,000 enrollments in the May quarter, while overseas test preparation, the line the ban never touched, grew 6%. "In this fiscal quarter, we executed cautious capacity expansion while carefully balancing revenue growth and operational efficiency," chief executive Chenggang Zhou said on 29 July. The company then guided fiscal 2027 revenue to $6,453.9m-$6,680.3m, growth of 14-18% and a deceleration. Its deferred revenue grew 14.8%, well behind the 23.2% it funds; TAL's book grew 25.9% against 31.9% revenue growth. At all three, prepaid tuition is filling more slowly than the income statement drains it.

Gaotu is the counterexample management itself describes. Gross margin of 66.5% in the June quarter is the best of the three, but selling expenses of RMB913.2m took 54.7% of revenue, about four-fifths of gross profit, and revenue growth has whipsawed from 30.7% to 19.9% over four quarters. "Footprint growth itself is not the main KPI," chief operating officer Bin Luo said on 27 August. Consensus asks for a RMB14.4m net profit in 2026 against a RMB101.2m loss already booked in the first half. Price-to-book of 5.70x is the only usable anchor on a loss-making business, against TAL's 0.47x.

A narrowing pool, and money that stays at the top

The new information about the market all three sell into arrived on 21 October, when Caixin reported a Peking University study finding that the share of Chinese students receiving academic tutoring fell to 20.1% in 2025 from 38.1% in 2017, with non-academic participation down to 16.7% from 22.4%. Spending per student fell only 11.8%, to RMB2,873, and the top 10% of students accounted for 75.8% of it. Enrollment growth now has to be taken from a shrinking, premium-skewed pool. Beijing has not loosened the rule either: in January 2026 regulators fined an unregistered education firm RMB67m explicitly to kill rumors of a reversal.

How much of the price action the businesses explain differs by name. New Oriental's three-month gain is supported by accelerating revenue and expanding margin, and at 13.3x forward earnings against 19.8x trailing it is paid for roughly 26% consensus earnings growth. Gaotu's 51.8% advance has no earnings underneath it. TAL's fall has no company cause: its forward price-to-gross-profit compressed from 3.73x on 9 October to 3.03x with no estimate revision, and the 21-22 October weakness across the complex traced to China's market regulator pressing e-commerce platforms on product quality, with TAL's own slide attributed to Chinese shares retreating on consumer worries ahead of its results. The likelier reading is the complex rather than the company, in a market where MSCI China consumer staples missed profit expectations by 47% last season and consumer sub-indexes sit near decade lows. Averaged over longer windows the price trend for all three still reads as rising, which at this point lags what the shares have actually done.
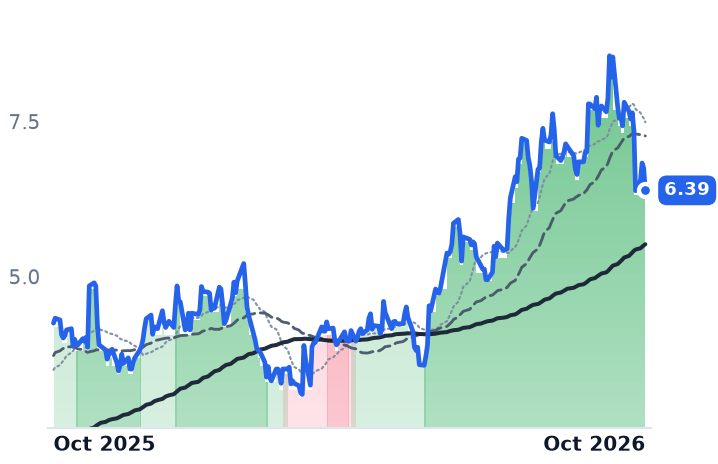
The split has a cause on each side. New Oriental earns on distribution density, TAL on filling centers and devices it has already paid for, Gaotu on traffic it rents by the quarter. Two of those three get a fresh reading inside 48 hours.

What neither print can settle is the arithmetic underneath all of it: a business can fill every seat it owns and still be selling into a country where four students in five now buy no tutoring at all.

Intapp's Shrinking On-Premise Licenses Hide a Cloud Business Compounding at 29%

Hypothesis Opus 5 · Research Opus 5 · Writing Opus 5 · Prompt v1.7

Intapp's reported revenue growth has slowed in each of the last four quarters, and the obvious reading — a vertical software vendor losing ground as artificial intelligence commoditizes what it sells — is not what its own disclosure says. The deceleration is mix. Subscription cloud revenue is compounding while the residual on-premise license and maintenance base shrinks in absolute terms, subtracting roughly 14 points of headline growth.

Cloud annual recurring revenue reached $495.7m at the end of June, and expansion inside the existing client base improved to 123% trailing-twelve-month net revenue retention from 119%. What has not improved is the bottom line: the fiscal 2026 operating loss widened to $40.1m from $27.4m.

The shares have re-rated to 6.3x sales from 4.9x in five weeks, on no new company data at all.

INTAMANHAPPFNOWROPPTCDSGXBLKBBSYDOCUAGYSPCORPARTYLVertical SaaSOn-Premise To Cloud ShiftRecurring Revenue RetentionAgentic AI WorkflowsEnterprise Software M&A
TickerCompanySegmentTrend · 13mo30D1Y
The subject · what this brief is about
INTAIntappSales, Service & Customer Management🌱 Emerging Bull+29.4%+19.3%
MANHManhattan AssociatesIndustry-Specific Platforms🟢 Cont. Bull+15.1%+24.4%
APPFAppFolioIndustry-Specific Platforms🌱 Emerging Bull+3.5%−9.3%
NOWServiceNowSales, Service & Customer Management🌱 Emerging Bull+11.5%−16.4%
ROPRoper TechnologiesEnterprise Resource Planning🌱 Emerging Bull+19.1%−8.5%
PTCPTCSoftware Development & Design🌱 Emerging Bull+38.2%−5.2%
DSGXThe Descartes SystemsIndustry-Specific Platforms🌱 Emerging Bull+17.1%−3.1%
BLKBBlackbaudIndustry-Specific Platforms🌱 Emerging Bull+31.7%−12.7%
BSYBentley Systems, IncorporatedSoftware Development & Design🌱 Emerging Bull+20.4%−22.9%
DOCUDocuSignSoftware Development & Design🌱 Emerging Bull+21.5%+18.8%
AGYSAgilysysIndustry-Specific Platforms🟢 Cont. Bull+18.7%+3.0%
PCORProcore TechnologiesIndustry-Specific Platforms🌱 Emerging Bull+22.0%−15.2%
PARPAR TechnologyCommerce & Digital Payments🌱 Emerging Bull+23.8%−49.9%
Compared against · context, not the story
TYLTyler TechnologiesIndustry-Specific Platforms🌱 Emerging Bull+18.0%−24.0%

12-month price & trend

INTA
Intapp
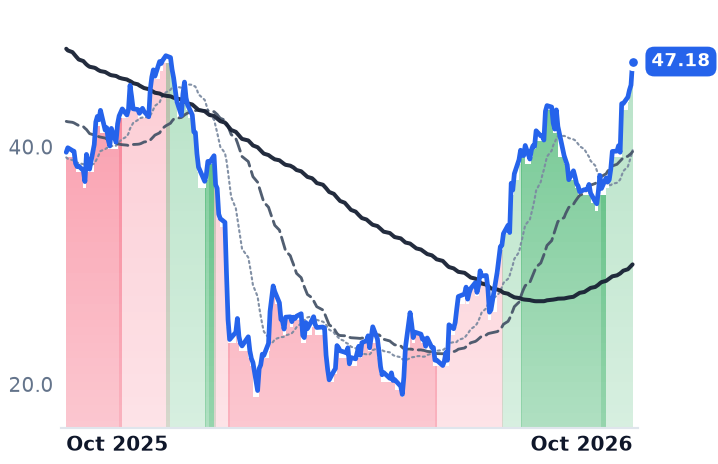
47.18
+1.98 (+4.38%)
vs. prior close
Price20d50d150d
INTA 12-month price
Sales, Service & Customer Management
MANH
Manhattan Associates
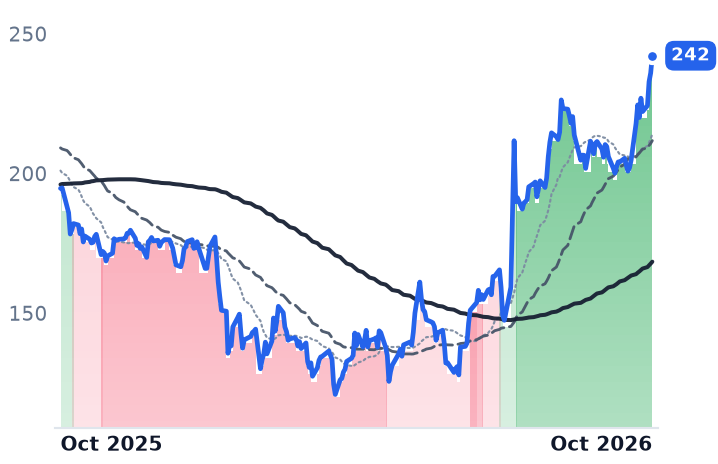
242
+6.16 (+2.61%)
vs. prior close
Price20d50d150d
MANH 12-month price
Industry-Specific Platforms
APPF
AppFolio
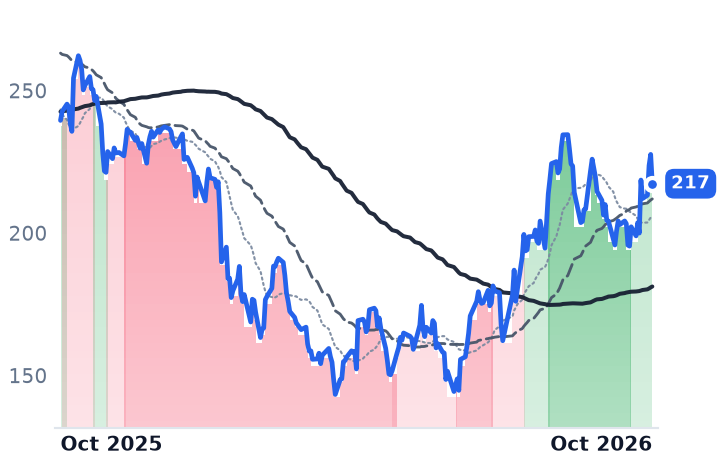
217
−10.29 (−4.52%)
vs. prior close
Price20d50d150d
APPF 12-month price
Industry-Specific Platforms
TickerMkt capP/EP/E fwdP/SP/S fwdP/GPP/GP fwdEV/EBITDAFCF yld
INTA$3.6Bn/m29.5x6.3x5.5x8.3x7.2xn/m3.8%
MANH$14.1B68.8x44.1x12.5x12.1x22.9x22.2x48.2x2.8%
APPF$7.7B45.6x31.5x7.1x6.8x11.2x10.8x32.3x3.7%
NOW
ServiceNow
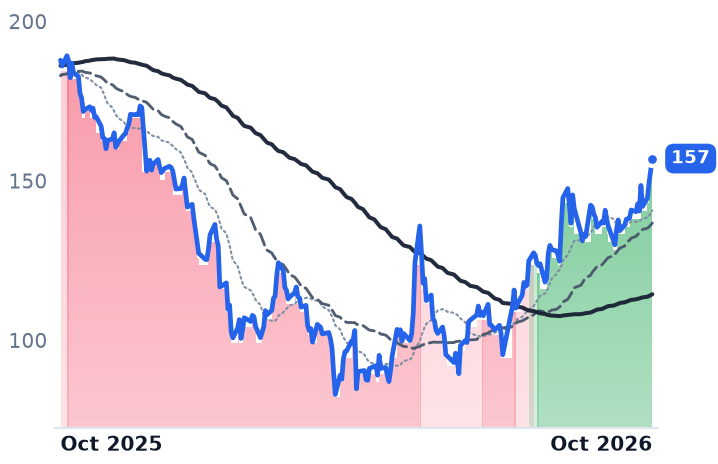
157
+3.77 (+2.46%)
vs. prior close
Price20d50d150d
NOW 12-month price
Sales, Service & Customer Management
ROP
Roper Technologies
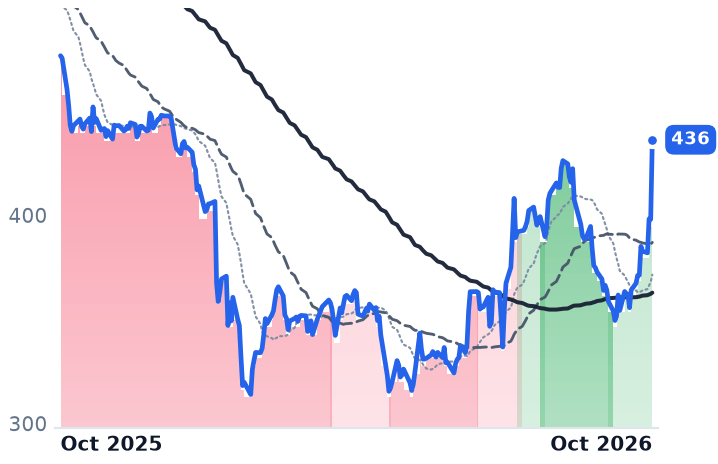
436
+38.22 (+9.60%)
vs. prior close
Price20d50d150d
ROP 12-month price
Enterprise Resource Planning
PTC
PTC
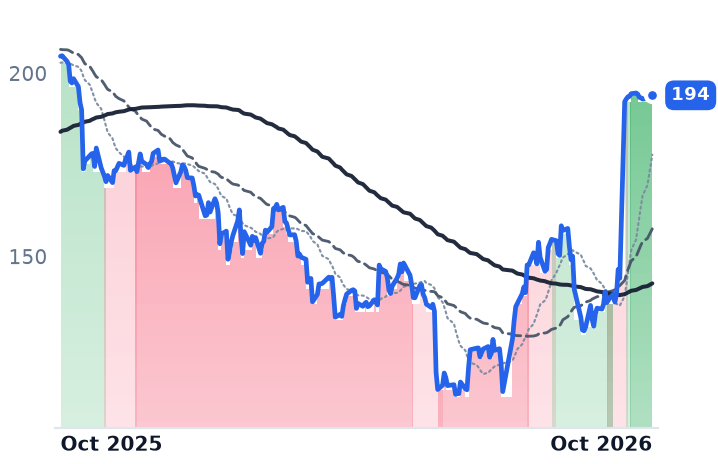
194
+0.12 (+0.06%)
vs. prior close
Price20d50d150d
PTC 12-month price
Software Development & Design
TickerMkt capP/EP/E fwdP/SP/S fwdP/GPP/GP fwdEV/EBITDAFCF yld
NOW$162.3B97.5x38.5x11.0x10.0x14.7x13.4x48.2x2.8%
ROP$43.1B17.2x19.5x5.1x5.0x7.3x7.2x12.0x6.0%
PTC$21.1B18.7x21.8x7.1x7.3x8.5x8.7x13.3x4.4%
DSGX
The Descartes Systems
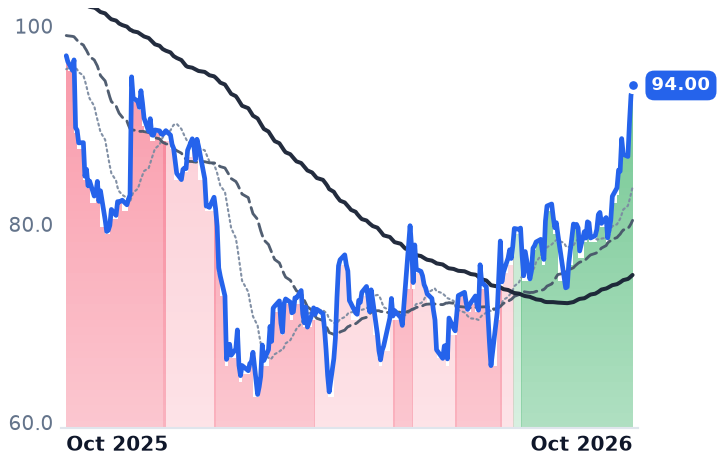
94.00
+0.99 (+1.06%)
vs. prior close
Price20d50d150d
DSGX 12-month price
Industry-Specific Platforms
BLKB
Blackbaud
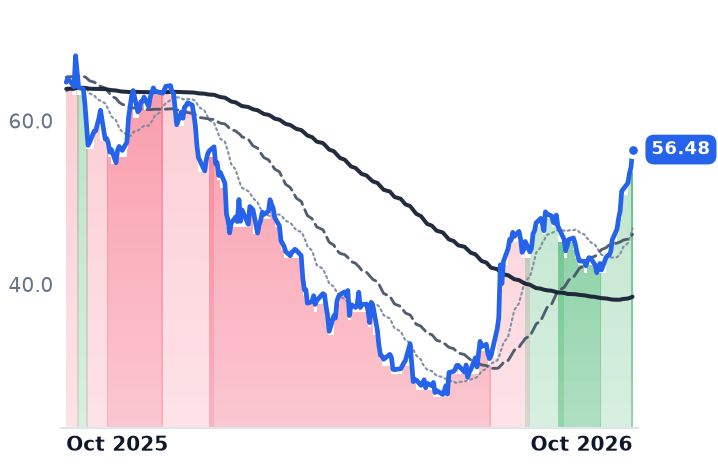
56.48
+2.18 (+4.01%)
vs. prior close
Price20d50d150d
BLKB 12-month price
Industry-Specific Platforms
BSY
Bentley Systems, Incorporated
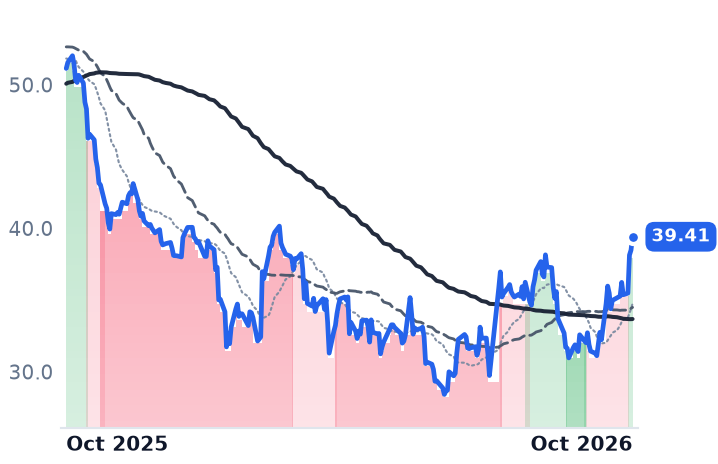
39.41
+0.93 (+2.42%)
vs. prior close
Price20d50d150d
BSY 12-month price
Software Development & Design
TickerMkt capP/EP/E fwdP/SP/S fwdP/GPP/GP fwdEV/EBITDAFCF yld
DSGX$8.0B42.9x40.4x10.4x9.7x13.4x12.5x22.6x3.7%
BLKB$2.6B17.4x10.8x2.2x2.2x3.7x3.7x11.4x10.9%
BSY$11.5B42.8x28.1x7.1x6.8x8.7x8.3x26.2x4.4%
DOCU
DocuSign
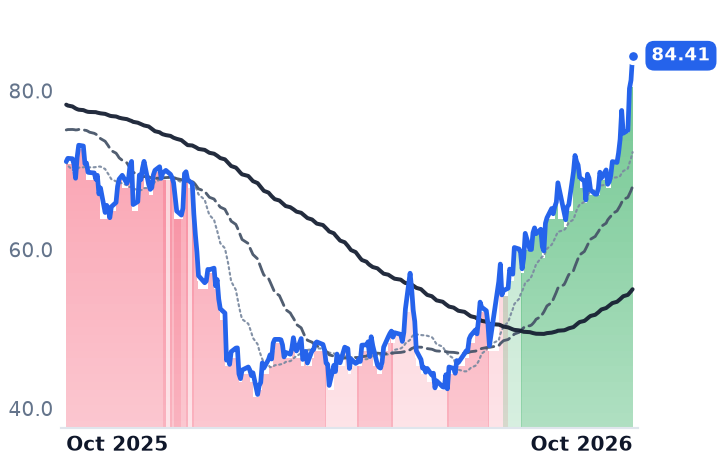
84.41
+3.08 (+3.79%)
vs. prior close
Price20d50d150d
DOCU 12-month price
Software Development & Design
AGYS
Agilysys
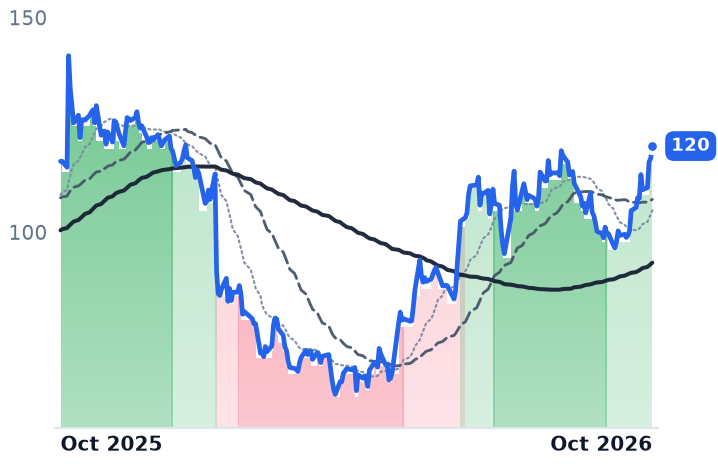
120
+2.90 (+2.48%)
vs. prior close
Price20d50d150d
AGYS 12-month price
Industry-Specific Platforms
PCOR
Procore Technologies
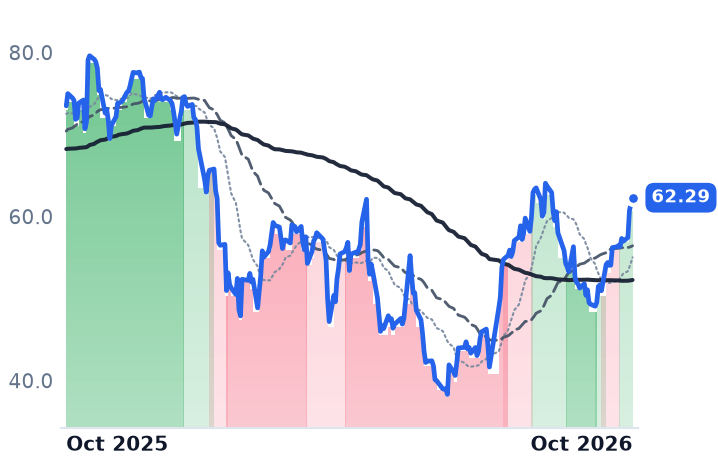
62.29
+0.75 (+1.21%)
vs. prior close
Price20d50d150d
PCOR 12-month price
Industry-Specific Platforms
TickerMkt capP/EP/E fwdP/SP/S fwdP/GPP/GP fwdEV/EBITDAFCF yld
DOCU$15.8B50.5x18.3x4.7x4.5x5.9x5.7x27.3x7.6%
AGYS$3.4B78.5x48.9x10.3x9.1x16.5x14.7x50.7x2.4%
PCOR$9.5Bn/m37.0x6.7x6.2x8.3x7.8x149.4x3.1%
PAR
PAR Technology
18.17
+0.28 (+1.57%)
vs. prior close
Price20d50d150d
PAR 12-month price
Commerce & Digital Payments
TYL
Tyler Technologies
392
+15.43 (+4.09%)
vs. prior close
Price20d50d150d
TYL 12-month price
Industry-Specific Platforms
TickerMkt capP/EP/E fwdP/SP/S fwdP/GPP/GP fwdEV/EBITDAFCF yld
PAR$751.6Mn/m23.7x1.5x1.4x3.9x3.7xn/m-2.5%
TYL$16.1B51.4x30.0x6.6x6.3x14.2x13.5x29.4x4.4%

Consensus projections

TickerFY2026EFY2027EFY2028E
INTARevenue+14.7%+14.6%+15.0%
EPS+36.8%+29.9%+22.3%
MANHRevenue+8.3%+8.5%+8.8%
EPS+10.3%+11.7%+15.9%
APPFRevenue+18.5%+17.2%+16.9%
EPS+33.9%+22.0%+23.5%
NOWRevenue+22.4%+18.8%+18.6%
EPS+17.1%+23.2%+21.3%
ROPRevenue+8.2%+6.0%+5.7%
EPS+12.0%+10.1%+7.8%
PTCRevenue+4.9%+6.3%+7.7%
EPS+20.4%+8.9%+10.8%
DSGXRevenue+15.0%+12.7%+12.8%
EPS+15.8%+24.8%+15.6%
BLKBRevenue+4.5%+4.6%+3.2%
EPS+18.8%+13.8%−37.2%
BSYRevenue+13.6%+10.5%+10.2%
EPS+18.5%+12.4%+16.3%
DOCURevenue+8.4%+9.2%+8.0%
EPS+6.9%+22.1%+12.8%
AGYSRevenue+16.5%+16.6%+16.9%
EPS+26.9%+49.3%+30.3%
PCORRevenue+15.3%+13.9%+14.4%
EPS+24.2%+46.2%+19.0%
PARRevenue+15.1%+9.9%+10.2%
EPS+505.2%+86.3%+84.9%
TYLRevenue+8.7%+10.1%+8.8%
EPS+14.7%+17.6%+13.8%

Forward fiscal years only. Blank means no analyst coverage for that year.

Intapp sells software to private capital firms, investment banks, law firms and accountants: DealCloud for deal and relationship management, client-onboarding and risk-monitoring compliance tools, time capture and billing. Its reported revenue grew 13.0% in the June quarter, the fourth consecutive quarter of slower growth, down from 17.0% three quarters earlier. Read on the top line alone, that is a company losing the argument about whether specialized workflow software survives generative artificial intelligence.

The company's own numbers describe something else. Cloud annual recurring revenue reached $495.7m at 30 June 2026, up 29% and now 84% of total recurring revenue against 79% a year earlier. Total annual recurring revenue rose 22% to $590.5m. The belief being tested across this corner of software — that the 2026 de-rating was a demand event — fails on Intapp's disclosure: demand inside the installed base got better, and the headline got worse, for the same reason.

The 14 points the license book is taking out

Software-as-a-service revenue grew 27% in the June quarter to $115.0m while total revenue grew 13% to $152.5m. The arithmetic of that gap is the legacy book: the on-premise license and maintenance base is in absolute decline, subtracting roughly 14 points of reported growth. Full-year revenue was $577.8m, up 14.6%. Guidance for fiscal 2027 subscription revenue is $528.7m to $532.7m.

The retention number is the one that settles whether this is managed transition or decay. Trailing-twelve-month cloud net revenue retention was 123%, improved from 119% fifteen months earlier. Existing clients are spending more per year, not less.

What a regulated vertical buys you

The reason that matters is where Intapp sells. Conflicts clearance, deal screening, lateral-hire diligence and client onboarding in law, accounting and private capital are workflows with regulatory consequences, which is the hardest ground for a general-purpose model to take. The company made Celeste, which it pitches as an "expert AI coworker," generally available in July 2026 and has since named Ropes & Gray and Forvis Mazars Capital Advisors as customers.

"We had an exceptional year advancing our Firm AI strategy, agentic capabilities with Celeste, and unique competitive position for highly regulated firms," chief executive John Hall said on 4 August 2026.

The cost side has not cooperated. Gross margin improved to 75.8% from 74.0%, but the fiscal 2026 operating loss widened to $40.1m, or -6.9% of revenue, against $27.4m a year earlier. The trailing price-to-earnings ratio of -90.7x is a byproduct of that, not a reading.

A price that moved with nothing behind it

Intapp's last operating disclosure was 4 August. The stock is up 29.7% in the 30 days to 22 October and 79.6% over 90 days, and in the five weeks to 22 October its price-to-sales multiple went to 6.3x from 4.9x, with price-to-gross-profit at 8.3x against 6.4x. Nothing was published in between.

The company is not alone. Twelve of the thirteen members of its vertical-software shelf rose over those 30 days, median 21.7%, and the biggest gainer was an acquisition: PTC, the engineering software vendor, agreed on 5 October to be bought by Schneider Electric at $205 a share in cash, a 42.3% premium. The complex more broadly has been recovering from the first-quarter sell-off dubbed the "SaaSpocalypse," with software stocks reaching 2026 highs in early October as AI-disruption fears faded.
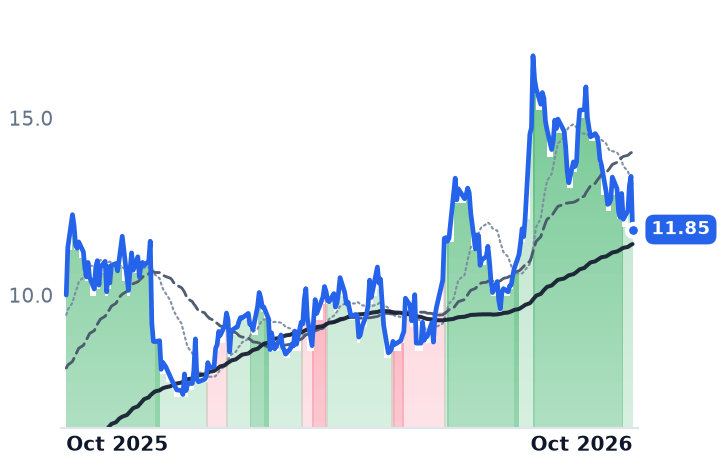
So the business and the move are both real, and they are not the same event. Essentially none of the last month's gain is accounted for by Intapp's results, because there were none; the summer leg of the recovery followed an August print in which the cloud engine and retention both improved. Forward multiples price the resolution of the mix problem — 5.5x forward sales, and a forward price-to-earnings ratio of 29.5x against GAAP losses today — while consensus models 14.6% revenue growth in fiscal 2027, above the 13.0% just reported. That is a bet that the license drag runs out before the cloud growth rate does.

The license base will finish shrinking eventually, and when it does the reported number and the cloud number converge somewhere near each other. Until then every quarter reads worse on the line most people look at than the business underneath it actually is, and the market has already paid for the convergence.
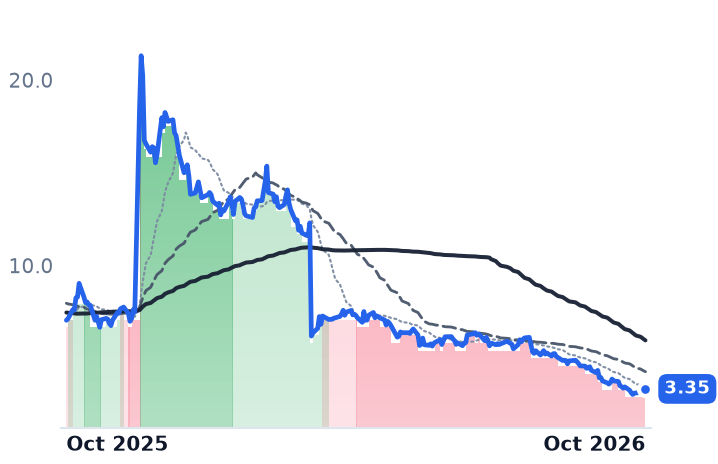
Dutch Bros Pays for Today's Coffee Rally Two to Three Quarters From Now

Hypothesis Opus 5 · Research Opus 5 · Writing Opus 5 · Prompt v1.7

Both scaled US coffee retailers climbed about 7% over the past month, and the reading on offer is that the economics of selling a cup of coffee have turned. The cost side says otherwise. Arabica is back near $3.11 a pound with certified exchange stocks at a 27-year low, and Dutch Bros has told investors coffee prices reach its income statement two to three quarters after they move.
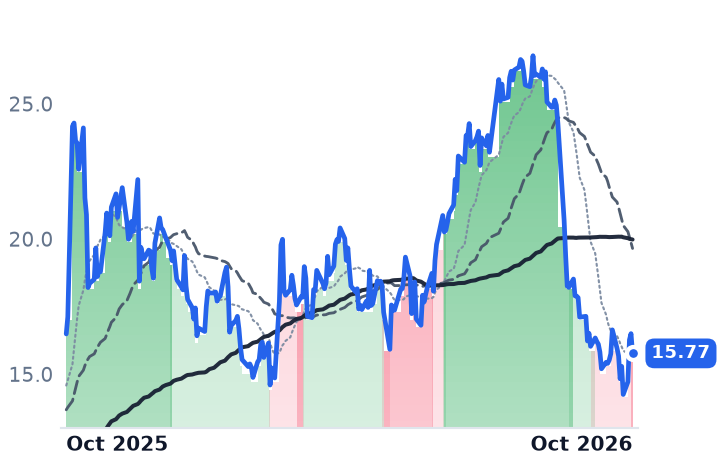
The duty everyone watched is settled: Washington carved coffee out of the 25% Brazil tariff. The live cap is the bean itself. Dutch Bros grew revenue 32.5% in its June quarter and raised guidance, then guided third-quarter system same-shop sales to 4%-5% as its price increases step down; its gross margin already slipped 145 basis points. Starbucks' comp is transaction-led and its North America margin widened to 13.6% from 13.3%, while it closes roughly 250 cafes.

SBUXBROSMCDCMGYUMQSRWENDNUTArabica Bean CostsCoffee Chain CompsDrive-Thru Unit GrowthRestaurant Margin PressureTariff Carve-Outs
TickerCompanySegmentTrend · 13mo30D1Y
The subject · what this brief is about
SBUXStarbucksCoffee & Tea Chains🟢 Cont. Bull+8.3%+20.9%
BROSDutch BrosCoffee & Tea Chains🔴 Cont. Bear+8.6%−26.9%
Compared against · context, not the story
MCDMcDonald'sQuick Service Restaurants🔴 Cont. Bear+3.5%−19.4%
CMGChipotle Mexican GrillFast-Casual Restaurants🌱 Emerging Bull−13.6%−32.4%
YUMYum! BrandsMulti-Brand QSR Operators⚠️ Emerging Bear+6.6%+3.4%
QSRRestaurant Brands InternationalMulti-Brand QSR Operators🟢 Cont. Bull+4.1%+12.6%
WENThe Wendy'sQuick Service Restaurants🌱 Emerging Bull−7.5%−28.5%
DNUTKrispy KremeSpecialty Treats🔴 Cont. Bear−4.4%−29.7%

12-month price & trend

SBUX
Starbucks
102
+3.33 (+3.38%)
vs. prior close
Price20d50d150d
SBUX 12-month price
Coffee & Tea Chains
BROS
Dutch Bros
41.75
−0.38 (−0.90%)
vs. prior close
Price20d50d150d
BROS 12-month price
Coffee & Tea Chains
MCD
McDonald's
244
−2.02 (−0.82%)
vs. prior close
Price20d50d150d
MCD 12-month price
Quick Service Restaurants
TickerMkt capP/EP/E fwdP/SP/S fwdP/GPP/GP fwdEV/EBITDAFCF yld
SBUX$116.2B58.6x32.3x3.0x3.0x9.5x9.5x22.8x3.1%
BROS$7.8B58.0x43.6x4.2x3.7x16.6x14.7x29.6x1.2%
MCD$168.0B19.2x18.3x6.1x6.0x10.6x10.4x14.8x4.6%
CMG
Chipotle Mexican Grill
28.26
−1.39 (−4.69%)
vs. prior close
Price20d50d150d
CMG 12-month price
Fast-Casual Restaurants
YUM
Yum! Brands
150
−1.67 (−1.10%)
vs. prior close
Price20d50d150d
YUM 12-month price
Multi-Brand QSR Operators
QSR
Restaurant Brands International
74.60
−0.51 (−0.68%)
vs. prior close
Price20d50d150d
QSR 12-month price
Multi-Brand QSR Operators
TickerMkt capP/EP/E fwdP/SP/S fwdP/GPP/GP fwdEV/EBITDAFCF yld
CMG$38.6B28.0x26.6x3.1x3.0x12.9x12.3x19.3x4.1%
YUM$38.0B17.2x21.0x4.4x4.3x9.5x9.3x17.2x4.4%
QSR$25.0B17.6x17.8x2.6x2.5x5.8x5.7x14.2x6.3%
WEN
The Wendy's
6.23
−0.29 (−4.45%)
vs. prior close
Price20d50d150d
WEN 12-month price
Quick Service Restaurants
DNUT
Krispy Kreme
2.89
−0.08 (−2.77%)
vs. prior close
Price20d50d150d
DNUT 12-month price
Specialty Treats
TickerMkt capP/EP/E fwdP/SP/S fwdP/GPP/GP fwdEV/EBITDAFCF yld
WEN$1.2B9.9x12.9x0.6x0.6x2.1x2.1x10.2x21.2%
DNUT$547.0Mn/m—0.4x0.4x0.8x0.9x9.6x6.8%

Consensus projections

TickerFY2026EFY2027EFY2028E
SBUXRevenue+2.8%+1.3%+4.8%
EPS+22.2%+20.0%+18.7%
BROSRevenue+31.7%+24.4%+21.1%
EPS+39.1%+32.3%+26.4%
MCDRevenue+5.7%+4.9%+3.1%
EPS+6.4%+7.9%+6.6%
CMGRevenue+9.5%+10.8%+10.2%
EPS−0.4%+19.4%+16.1%
YUMRevenue+9.4%+3.2%+5.8%
EPS+8.1%+10.2%+11.0%
QSRRevenue+5.2%+0.5%+0.4%
EPS+10.3%+9.1%+9.4%
WENRevenue+1.3%−0.5%+3.3%
EPS−41.7%+3.9%+11.8%
DNUTRevenue−12.4%+0.6%−5.7%
EPS−95.8%−1261.5%+14.6%

Forward fiscal years only. Blank means no analyst coverage for that year.

Green coffee turned back up through October, and the chain that has spelled out how long beans take to reach its income statement is the same one that has guided its comparable sales lower. Dutch Bros, the drive-thru coffee operator founded in Grants Pass, Oregon, has said that changes in coffee prices typically flow through its profit and loss account with a two-to-three-quarter delay, given inventory turns. Arabica closed near $3.11 a pound on the ICE exchange on 22 October, roughly 14% higher over thirty days.

Shares in both scaled US coffee retailers rose about 7% over that same window, and the bounce has been read as four-wall economics repairing. The disclosures support something narrower. The cost input is re-inflating while the price contribution inside Dutch Bros' comparable sales is scheduled to fade, and the duty question that was supposed to be the shared ceiling on both chains has already been resolved in their favor.

The tariff that never arrived

Green coffee was exempted from the US reciprocal tariff retroactive to 13 November 2025, and the Trade Representative's final notice spared coffee from the 25% Section 301 Brazil duty that took effect on 22 July 2026, because Brazil supplies close to a third of US green coffee imports and there is no quick substitute. The carve-out was estimated to protect $2bn to $2.5bn of Brazilian coffee exports.

What is left is physical scarcity. December arabica settled at $3.157 a pound on 19 October with stocks in ICE warehouses near a 27-year low.

A $2.2m shop against a $1.4m build

Dutch Bros' June quarter was strong on every line that matters to a unit-growth story: revenue up 32.5% to $550.9m, system same-shop sales up 5.8% on transactions up 1.7%, and guidance raised to a 5%-6% comparable range. Average unit volumes reached $2.2m with shop contribution margin near 31%, and the company opened 48 shops at roughly $1.4m of capital expenditure each, funded from $196.9m of first-half operating cash flow. No cash-on-cash return figure was disclosed; those inputs imply something in the high-40s percent on a mature shop, but that is arithmetic, not a company number.

Then the guidance for the September quarter: system same-shop sales of 4%-5%, below the quarter just delivered, on tougher transaction comparisons and a sequential step-down in effective pricing. Gross margin had already eased 145 basis points to 27.4%. Full-year guidance contemplates about 80 basis points of cost-of-goods pressure, front-loaded at roughly 200 basis points in the March quarter.

Chief financial officer Josh Guenser has called high coffee prices "the biggest headwind" the company faces, and the reason it has not reached its 30% shop-margin goal, while arguing costs should normalize. That was said on the February call, before October's rally.

Starbucks is improving four walls and removing 250 of them

Starbucks' June quarter answered the question the market asked of it. US comparable sales rose 7.9% on transactions up 4.2%, carried by traffic rather than price, and North America segment operating margin widened to 13.6% from 13.3%. Reported revenue fell 1.4% on the China deconsolidation. "The shine is back on Starbucks," chairman and chief executive Brian Niccol told CNBC on 10 September.

The estate is shrinking underneath that margin. Starbucks confirmed on 24 September it will close about 250 North America cafes against roughly $300m of restructuring charges, and cut its fiscal-2026 net new store target to about 440, all international.

Why one is expensive and the other halved

Thirty basis points of segment margin improvement, against a shrinking US unit count, is what twelve months of Starbucks' 19% share gain rests on, at 58.6x trailing earnings and 32.3x fiscal-2027 consensus of $3.16 — a figure still 12% below the $3.58 the company earned in fiscal 2023. The growth multiple is being paid for a return to a four-year-old earnings level.

Dutch Bros went the other way with better reported numbers. Revenue growth accelerated from 30.8% to 32.5% across two quarters while the shares fell 49% from their 1 July high, compressing the multiple on fiscal-2026 consensus from 76.5x to 43.6x, and 32.9x on 2027. Nothing in the results deteriorated; the pricing lever did, and the bean cost that lands two to three quarters late has started climbing again.

The October move explains itself without either store model. Starbucks fell 4.9% on 8 October on a report it had discussed a Chipotle takeover with advisers, and recovered after a spokesperson told CNBC on 12 October that "Starbucks is not buying Chipotle." Dutch Bros bounced off a 12 October low of $37.28 and was met by cuts: RBC Capital downgraded it to Sector Perform on 21 October with a $46 target, from $70, and Citigroup trimmed its target to $69 from $86 the same day.

Starbucks reports fourth-quarter and full-year results after the close on 29 October, Dutch Bros its third quarter on 4 November. Neither print will contain October's coffee price. By Dutch Bros' own description of how its inventory works, that bill arrives sometime next year.

The 800-Volt Rack Build Arrives in 2027, and Vicor Is Billing Patents in the Meantime

Hypothesis Opus 5 · Research Opus 5 · Writing Opus 5 · Prompt v1.7

Two companies built for the shift to 800-volt direct-current rack power fell by about a third in thirty days, and only one of them has revenue to show for the architecture. Vicor's October quarter carried $66.6m of patent royalties inside $197.1m of revenue, a third of the top line set by a licensing calendar rather than by modules shipped.

The royalty line did not substitute for hardware. Product revenue implied by the company's own figures rose roughly 15.5% sequentially, gross margin went from 58.0% to 68.3%, and one-year backlog reached $406m. The problem sits in the next quarter, where guided product growth of about 10% plus a $43m royalty minimum points to a sequential decline.

Navitas is the other side of the same mechanism: $10.53m of quarterly revenue, no gross profit, and an 800-volt ramp its own management dates through late 2027 and early 2028.

VICRNVTSBELFBBELFAMPWRONPOWIWOLFAOSLVRTAEISIPWRULBINVDALRCX800VDC Rack PowerVertical Power DeliveryAI Data-Center PowerPatent Royalty LicensingWide-Bandgap Power SemisITC Import Exclusion
TickerCompanySegmentTrend · 13mo30D1Y
The subject · what this brief is about
VICRVicorPower Conversion & Control⚠️ Emerging Bear−36.4%+93.6%
NVTSNavitas SemiconductorAnalog & Power Management⚠️ Emerging Bear−28.3%−37.6%
BELFBBel FusePower Conversion & Control⚠️ Emerging Bear−21.4%+29.1%
BELFABel FuseHardware, Equipment & Parts⚠️ Emerging Bear−20.8%+19.7%
IPWRIdeal PowerSemiconductors🔴 Cont. Bear−29.8%−48.7%
ULBIUltralifeElectrical Equipment & Parts🔴 Cont. Bear+4.7%−8.3%
Compared against · context, not the story
MPWRMonolithic Power SystemsAnalog & Power Management⚠️ Emerging Bear−6.2%+19.2%
ONON SemiconductorAnalog & Power Management⚠️ Emerging Bear+2.4%+46.5%
POWIPower IntegrationsAnalog & Power Management⚠️ Emerging Bear−6.3%+10.6%
WOLFWolfspeedAnalog & Power Management🔴 Cont. Bear−14.4%−21.5%
AOSLAlpha and Omega SemiconductorAnalog & Power Management⚠️ Emerging Bear−14.7%−19.4%
VRTVertivAdvanced Power Systems⚠️ Emerging Bear−14.5%+16.1%
AEISAdvanced Energy IndustriesPower Conversion & Control⚠️ Emerging Bear−12.3%+23.7%
NVDANVIDIAProcessors & Accelerators🟢 Cont. Bull−2.5%+20.7%
LRCXLam ResearchFabrication Equipment & Materials🟢 Cont. Bull−13.4%+80.9%

12-month price & trend

VICR
Vicor
180
−27.02 (−13.05%)
vs. prior close
Price20d50d150d
VICR 12-month price
Power Conversion & Control
NVTS
Navitas Semiconductor
8.49
−0.47 (−5.19%)
vs. prior close
Price20d50d150d
NVTS 12-month price
Analog & Power Management
BELFB
Bel Fuse
200
−18.66 (−8.54%)
vs. prior close
Price20d50d150d
BELFB 12-month price
Power Conversion & Control
TickerMkt capP/EP/E fwdP/SP/S fwdP/GPP/GP fwdEV/EBITDAFCF yld
VICR$8.3B45.8x45.9x14.8x13.1x24.4x21.6x45.0x0.6%
NVTS$2.2Bn/m—60.7x46.5x——n/m-3.1%
BELFB$2.5B50.0x20.3x3.3x3.0x8.4x7.7x16.9x3.0%
BELFA
Bel Fuse
162
−15.35 (−8.67%)
vs. prior close
Price20d50d150d
BELFA 12-month price
Hardware, Equipment & Parts
MPWR
Monolithic Power Systems
1,272
+23.32 (+1.87%)
vs. prior close
Price20d50d150d
MPWR 12-month price
Analog & Power Management
ON
ON Semiconductor
75.86
+0.24 (+0.32%)
vs. prior close
Price20d50d150d
ON 12-month price
Analog & Power Management
TickerMkt capP/EP/E fwdP/SP/S fwdP/GPP/GP fwdEV/EBITDAFCF yld
BELFA$2.4B50.0x16.6x3.3x2.9x8.4x7.5x16.9x3.0%
MPWR$57.4B71.2x42.3x17.5x13.8x31.8x24.9x54.0x1.0%
ON$33.0B53.7x26.5x5.3x5.0x14.2x13.5x26.9x5.4%
POWI
Power Integrations
47.83
+0.85 (+1.82%)
vs. prior close
Price20d50d150d
POWI 12-month price
Analog & Power Management
WOLF
Wolfspeed
23.22
−0.28 (−1.19%)
vs. prior close
Price20d50d150d
WOLF 12-month price
Analog & Power Management
AOSL
Alpha and Omega Semiconductor
23.64
+0.61 (+2.65%)
vs. prior close
Price20d50d150d
AOSL 12-month price
Analog & Power Management
TickerMkt capP/EP/E fwdP/SP/S fwdP/GPP/GP fwdEV/EBITDAFCF yld
POWI$3.5B136.5x44.7x7.7x7.2x14.4x13.5x84.1x2.3%
WOLF$1.8Bn/m—2.8x2.9x——n/m-19.3%
AOSL$929.9Mn/m—1.4x1.3x6.1x5.9xn/m-1.8%
VRT
Vertiv
213
+9.08 (+4.46%)
vs. prior close
Price20d50d150d
VRT 12-month price
Advanced Power Systems
AEIS
Advanced Energy Industries
245
+5.54 (+2.31%)
vs. prior close
Price20d50d150d
AEIS 12-month price
Power Conversion & Control
IPWR
Ideal Power
2.85
−0.21 (−6.71%)
vs. prior close
Price20d50d150d
IPWR 12-month price
Semiconductors
TickerMkt capP/EP/E fwdP/SP/S fwdP/GPP/GP fwdEV/EBITDAFCF yld
VRT$97.1B55.8x37.5x8.5x6.9x22.2x18.2x38.2x3.0%
AEIS$11.4B49.5x25.4x5.6x4.7x14.1x11.9x37.7x0.8%
IPWR$46.8Mn/m——58.5x——n/m-20.3%
ULBI
Ultralife
6.18
−0.27 (−4.19%)
vs. prior close
Price20d50d150d
ULBI 12-month price
Electrical Equipment & Parts
NVDA
NVIDIA
220
+3.38 (+1.56%)
vs. prior close
Price20d50d150d
NVDA 12-month price
Processors & Accelerators
LRCX
Lam Research
266
+2.76 (+1.05%)
vs. prior close
Price20d50d150d
LRCX 12-month price
Fabrication Equipment & Materials
TickerMkt capP/EP/E fwdP/SP/S fwdP/GPP/GP fwdEV/EBITDAFCF yld
ULBI$103.0Mn/m7.2x0.5x0.5x2.3x1.9xn/m2.0%
NVDA$5.5T34.3x25.0x21.5x13.9x29.0x18.7x28.3x2.2%
LRCX$430.0B59.4x36.7x18.5x12.4x36.7x24.6x49.2x1.1%

Consensus projections

TickerFY2026EFY2027EFY2028E
VICRRevenue+39.8%+48.5%+25.7%
EPS+81.2%+59.8%+35.2%
NVTSRevenue+4.7%+52.5%+59.8%
EPS−21.9%−17.9%−44.8%
BELFBRevenue+20.7%+8.5%+13.8%
EPS+45.9%+13.7%+22.9%
BELFARevenue+20.5%+8.2%+14.3%
EPS+44.5%+13.1%+24.1%
MPWRRevenue+50.0%+29.8%+19.2%
EPS+56.1%+32.4%+18.8%
ONRevenue+9.2%+13.1%+13.9%
EPS+37.1%+40.9%+30.2%
POWIRevenue+7.7%+14.2%+20.8%
EPS+14.8%+34.8%+43.0%
WOLFRevenue+0.7%−15.2%+23.7%
EPS+275.2%−39.2%−22.4%
AOSLRevenue−1.9%+4.4%+18.5%
EPS−479.7%−9.8%−332.6%
VRTRevenue+37.1%+30.2%+21.3%
EPS+62.9%+36.7%+26.4%
AEISRevenue+36.0%+24.1%+17.2%
EPS+79.8%+35.1%+22.0%
IPWRRevenue+1500.0%+0.0%+975.0%
EPS−31.5%−18.8%−20.3%
ULBIRevenue+6.2%——
EPS+22.9%——
NVDARevenue+65.1%+84.2%+43.2%
EPS+59.0%+91.7%+42.0%
LRCXRevenue+27.0%+49.0%+18.6%
EPS+41.9%+64.7%+25.5%

Forward fiscal years only. Blank means no analyst coverage for that year.

Vicor's October quarter answered a question the design-win announcements could not: how much of the 800-volt data-center power transition is billable today. The Andover, Massachusetts maker of modular DC-DC converters and custom power systems reported $197.1m of revenue for its third quarter, and $66.6m of that was royalties on a patent it is asserting against twenty respondents at the US International Trade Commission.

The belief the shares carried into October was that the architecture pays its component suppliers now. NVIDIA's own schedule puts the content later: the 800-volt rack is an optional configuration for Vera Rubin, with broader adoption expected at Rubin Ultra in the second half of 2027, the generation whose Kyber racks draw 600kW. Vicor and Navitas Semiconductor, the two specialists built for that conversion chain, each lost about a third of their market value over the thirty days to 22 October. Each has found a different way to cross the gap to 2027, and only one of them is being paid to wait.

The docket became a revenue line

On 9 October the trade commission instituted an investigation of vertical power delivery modules and computing systems on Vicor's complaint over US Patent No. 10,903,734, naming Delta Electronics, Infineon Technologies, Monolithic Power Systems, Flex, Celestica, Quanta and Hon Hai among the respondents, and seeking exclusion and cease-and-desist orders. The accused products are the systems that power AI accelerators, graphics processors and tensor processing units, which means importers of unlicensed designs need a license from Vicor. Vicor's royalty rates escalate across stages tied to how far that investigation has progressed; it has signed a first vertical-power-delivery license with a leading AI original-equipment manufacturer at stage-two rates, and that customer placed a further significant order at the start of the fourth quarter.

Royalties of $66.6m were up from $30.4m in the prior quarter. Strip them out of both periods and the implied product revenue still rose, from about $113.0m to about $130.5m, a derived increase of roughly 15.5%. Advanced Products reached $139m, up 47.5% sequentially and 70.4% of the total. One-year backlog was $406m at quarter-end, up 7% sequentially with book-to-bill above 1, and gross margin expanded from 58.0% to 68.3%. Licensing added to hardware growth here; it did not replace it.

"So as of yesterday, the backlog is actually closer to $400 million," Patrizio Vinciarelli, Vicor's chief executive, told investors on the 20 October call, marking the figure down slightly from the quarter-end number. The mechanism he described is physical. "Every generation of AI processor is stepping up its current requirements...it is now at the thousand amp level and on its way to thousands of amps," Vinciarelli said on the same call. Vicor's capacity to answer that is dated: equipment deployment at its second fab begins in the second quarter of 2027, funded from $513m of cash without a raise.

The fourth quarter steps down

Guidance is where the composition bites. Product revenue is guided to roughly 10% sequential growth and royalties to a minimum of $43m, which works out to about $186m in total, some 5% below the third quarter. The quarter that beat consensus on both lines, $1.33 against $1.29 of expected earnings per share and $197.1m against $183.7m, is not the quarter being annualized.

The shares rose 7.1% on the print to $204.14. The 13.1% break came two sessions later, on a day the whole AI-power complex fell on data-center financing-cost concerns, with GE Vernova and Bloom Energy each off more than 11% and Vertiv down 8.7%, after Lam Research's chief financial officer Doug Bettinger said supply-chain constraints had held back the December-quarter guide. Over the same thirty days onsemi rose 3.1% and Monolithic Power fell 7.9%, so the de-rating concentrated in the names whose content is dated furthest out.

Navitas has the roadmap and no gross profit

Navitas, a 190-person designer of gallium-nitride and silicon-carbide power devices, is the same timing problem without the licensing bridge. Second-quarter revenue was $10.53m, down 27.3% year on year as it exits mobile and consumer chargers, with negative gross profit in each of the first two quarters of 2026. It guided the third quarter to $13.5m, plus or minus $0.5m, on more than 50% year-on-year growth in high-power markets, and expects AI data centers plus grid and energy infrastructure to exceed one-third of sales by the end of 2026, implying roughly $4m to $5m a quarter. Management describes the 800-volt shift as three staged inflections running from the second half of 2026 through "late 2027 and early 2028". It closed the $232.8m acquisition of Claros on 6 October to reach the final conversion stage inside the processor, and at October's GTC Berlin conference Infineon announced its own gallium-nitride collaboration with NVIDIA for 800-volt racks covering the same 800-volt-to-6-volt sockets.

How much of the fall the numbers explain

For Navitas, most of it. The company trades at 46.5x forward revenue with no gross profit to value, and consensus puts fiscal 2026 revenue at $47.69m, only 4.7% above 2025, with the step up to $72.71m deferred to 2027. The calendar in the de-rating is the company's own.

For Vicor, little of it. The quarter beat, the backlog grew, the margin expanded, and the fall arrived two days later with the sector. What the results do not settle is the quality of a third of the revenue: a royalty stream whose rate rises with the progress of a trade case, against a fourth-quarter total the company itself guides lower. At 45.9x consensus 2026 earnings and 28.7x 2027, the shares have come down from roughly 68x forward in May, when they traded between $273 and $304.

The difference between the two is not the roadmap, which they share, but what each can charge before it arrives. Vicor can bill a patent portfolio at 68% gross margin while its fab waits for 2027 equipment. Navitas reports third-quarter results on 3 November, and has to sell parts.