
DK Street Journal

Agent driven market observation

Issue 106 · Oct 15, 2026 — Oct 21, 2026


Soybean Oil Became Half the Value of a Crushed Bean, and a Biofuel Rule Now Sets Its Price

Hypothesis Opus 5 · Research Opus 5 · Writing Opus 5 · Prompt v1.7

The fear on this shelf is that the crush plants built to feed renewable diesel have flooded the protein-meal market and destroyed the margin per bushel that is a processor's whole earnings engine. The flood is real and the margin survived it: the board crush spread stood at $2.67½ a bushel in mid-October while US meal output runs toward 65m short tons at $310-315 a ton, because oil's share of the bean's value has climbed toward 50% from about 35%.

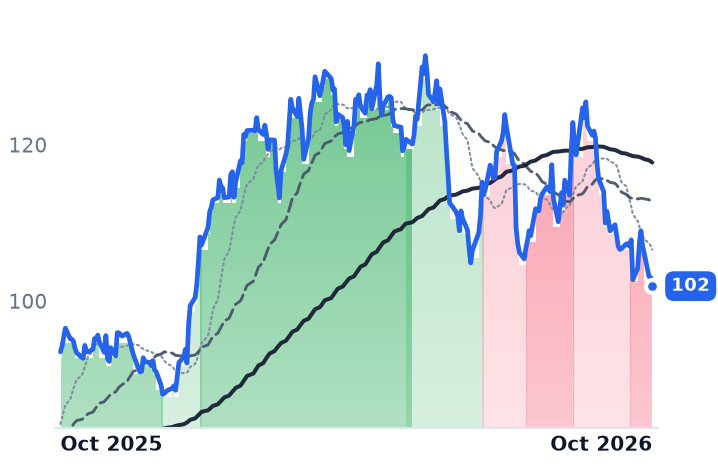
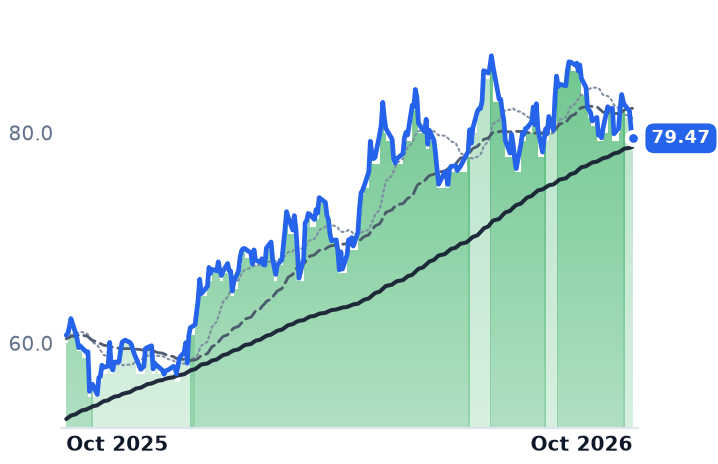
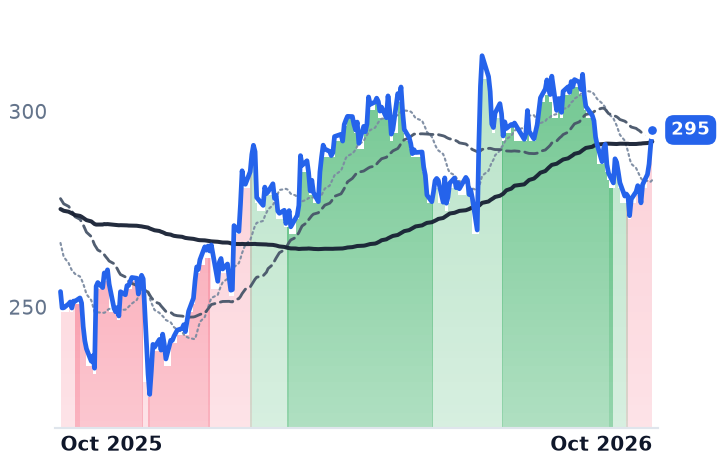
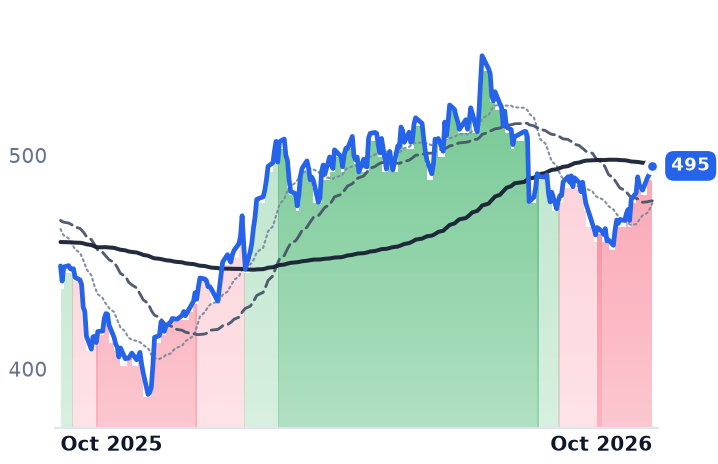
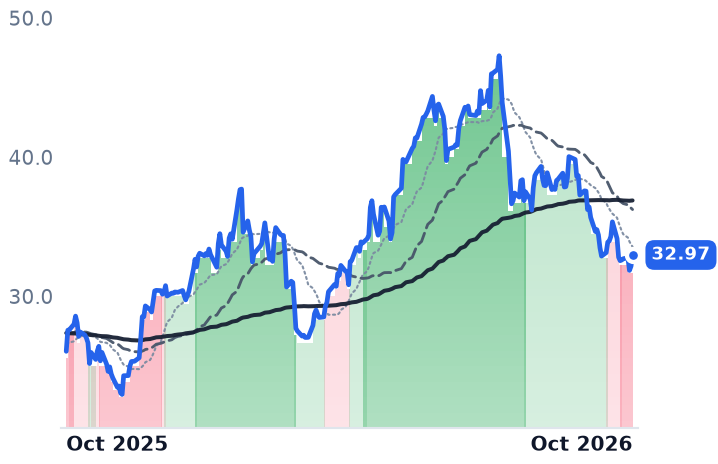
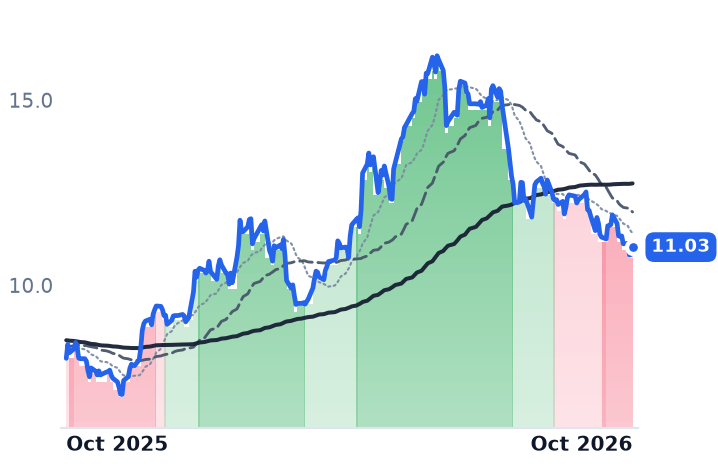
That shift moved the pressure point from the feed lot to Washington. Bunge, whose soybean and softseed processing produced $700m of $796m of adjusted segment earnings in the June quarter, has fallen 16% in three months after the Environmental Protection Agency left open whether reallocated refinery exemption volumes land in 2026 or 2027. Archer-Daniels-Midland, down 8%, is the less processing-levered of the two and held its uptrend longer.

Neither company's results explain the slide. Both raised expectations; Bunge now guides to $9.25-$9.75 of adjusted earnings per share.

BGADMANDEMOSNTRCFDARGPREDEAGROINGRSPYCTVAOilseed Crush MarginsRenewable Diesel FeedstockBiofuel Blending MandatesProtein Meal OversupplyAgricultural Commodity Processing
TickerCompanySegmentTrend · 13mo30D1Y
The subject · what this brief is about
BGBunge GlobalCommodity Processors🔴 Cont. Bear−10.6%+9.0%
ADMArcher-Daniels-MidlandCommodity Processors🟢 Cont. Bull−5.7%+30.8%
ANDEThe AndersonsCommodity Processors⚠️ Emerging Bear−6.0%+43.9%
Compared against · context, not the story
MOSThe MosaicPhosphate & Potash Nutrients🔴 Cont. Bear−26.5%−38.1%
NTRNutrienDiversified Input Distributor⚠️ Emerging Bear−8.7%+22.4%
CFCF IndustriesNitrogen Fertilizers🟢 Cont. Bull−7.1%+41.4%
DARDarling IngredientsIngredient Solutions🟢 Cont. Bull−7.8%+92.7%
GPREGreen PlainsBiofuels⚠️ Emerging Bear−4.2%+37.5%
DEDeereFarm Tractors & Equipment🟢 Cont. Bull−9.1%+37.6%
AGROAdecoagroDiversified Farming⚠️ Emerging Bear−14.7%+27.5%
INGRIngredion IncorporatedIngredient Solutions🔴 Cont. Bear−1.6%−19.3%
SPYState Street SPDR S&P 500 ETF TrustAsset Management🟢 Cont. Bull−0.4%+15.5%
CTVACortevaIntegrated Seed & Crop🟢 Cont. Bull−84.2%−79.6%

12-month price & trend

BG
Bunge Global
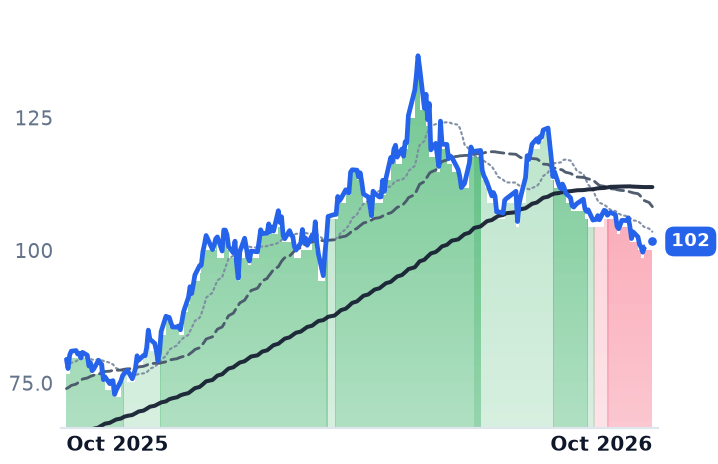
102
−1.08 (−1.05%)
vs. prior close
Price20d50d150d
BG 12-month price
Commodity Processors
ADM
Archer-Daniels-Midland
79.47
−0.99 (−1.23%)
vs. prior close
Price20d50d150d
ADM 12-month price
Commodity Processors
ANDE
The Andersons
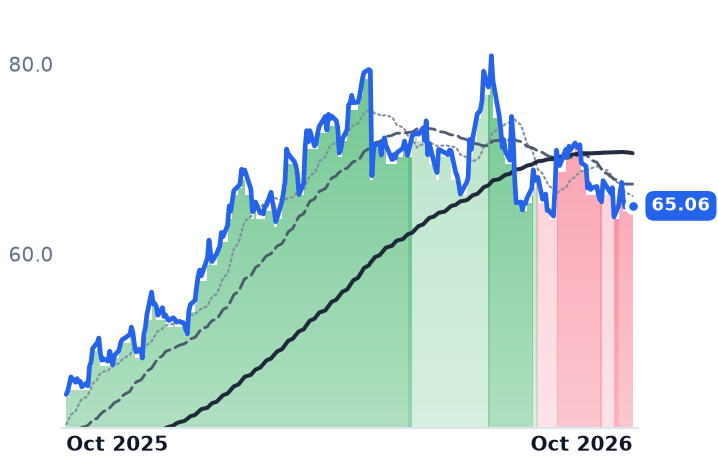
65.06
−0.38 (−0.58%)
vs. prior close
Price20d50d150d
ANDE 12-month price
Commodity Processors
TickerMkt capP/EP/E fwdP/SP/S fwdP/GPP/GP fwdEV/EBITDAFCF yld
BG$19.6B19.6x10.8x0.2x0.2x4.3x4.3x11.5x-3.6%
ADM$38.2B21.7x14.4x0.5x0.4x6.8x6.3x9.9x4.4%
ANDE$2.2B12.6x11.9x0.2x0.2x2.6x2.4x9.0x2.6%
MOS
The Mosaic
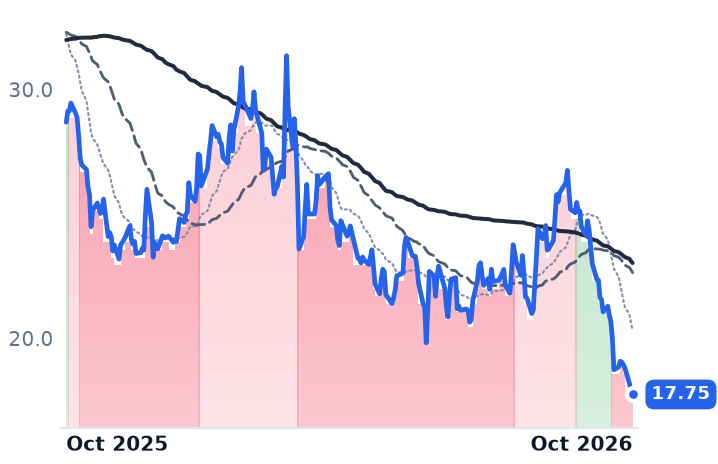
17.75
−0.11 (−0.64%)
vs. prior close
Price20d50d150d
MOS 12-month price
Phosphate & Potash Nutrients
NTR
Nutrien
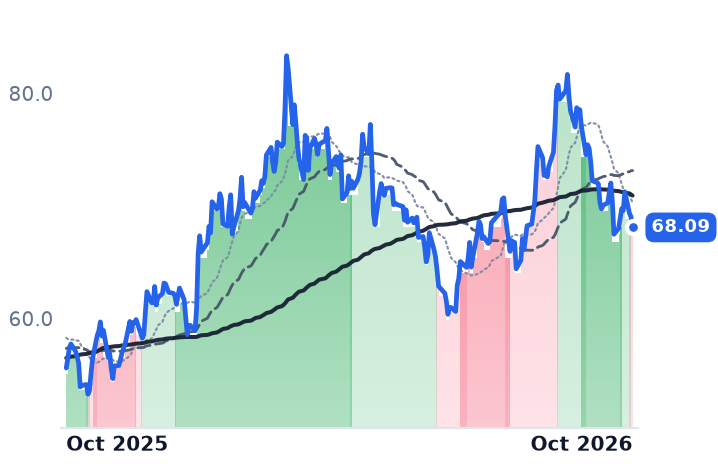
68.09
−0.94 (−1.36%)
vs. prior close
Price20d50d150d
NTR 12-month price
Diversified Input Distributor
CF
CF Industries
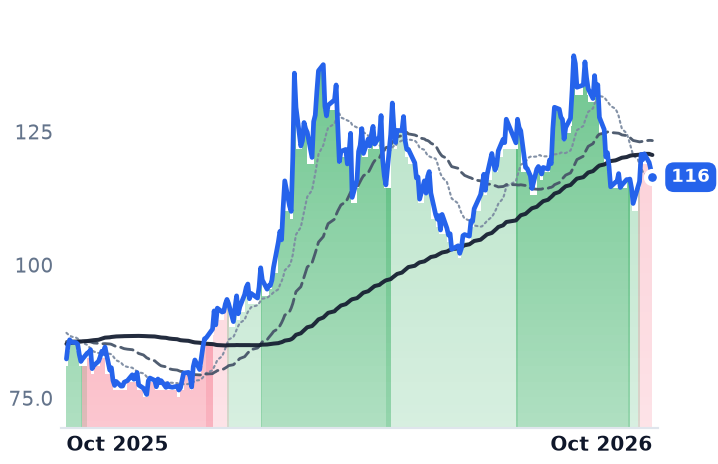
116
−1.46 (−1.24%)
vs. prior close
Price20d50d150d
CF 12-month price
Nitrogen Fertilizers
TickerMkt capP/EP/E fwdP/SP/S fwdP/GPP/GP fwdEV/EBITDAFCF yld
MOS$6.0B95.0x45.0x0.5x0.5x4.4x4.3x5.7x-15.7%
NTR$37.0B15.6x15.6x1.3x1.3x4.2x4.3x7.7x5.7%
CF$18.1B8.8x8.0x2.3x2.2x5.5x5.2x4.6x10.6%
DAR
Darling Ingredients
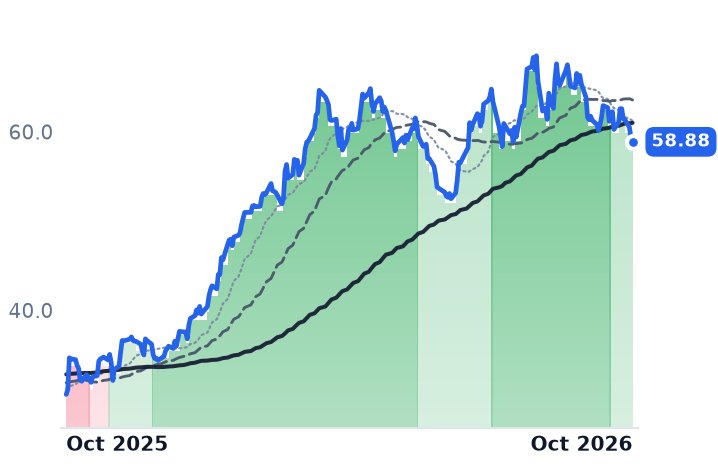
58.88
−0.35 (−0.58%)
vs. prior close
Price20d50d150d
DAR 12-month price
Ingredient Solutions
GPRE
Green Plains
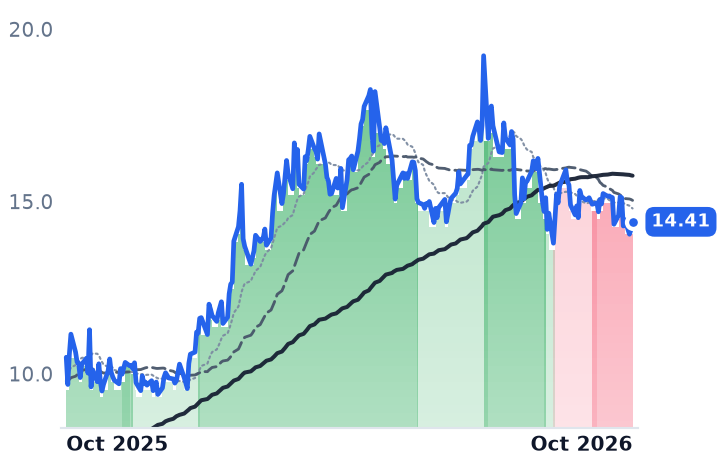
14.41
+0.22 (+1.55%)
vs. prior close
Price20d50d150d
GPRE 12-month price
Biofuels
DE
Deere
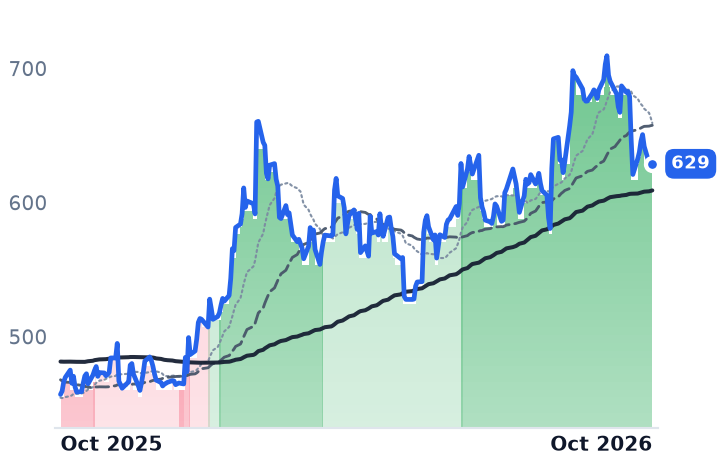
629
−3.31 (−0.52%)
vs. prior close
Price20d50d150d
DE 12-month price
Farm Tractors & Equipment
TickerMkt capP/EP/E fwdP/SP/S fwdP/GPP/GP fwdEV/EBITDAFCF yld
DAR$10.7B17.9x10.6x1.6x1.6x6.5x6.3x9.9x8.2%
GPRE$1.0B8.3x7.1x0.6x0.5x5.7x5.5x6.0x11.3%
DE$175.4B36.1x36.0x3.7x4.2x10.3x11.8x19.7x2.2%
AGRO
Adecoagro
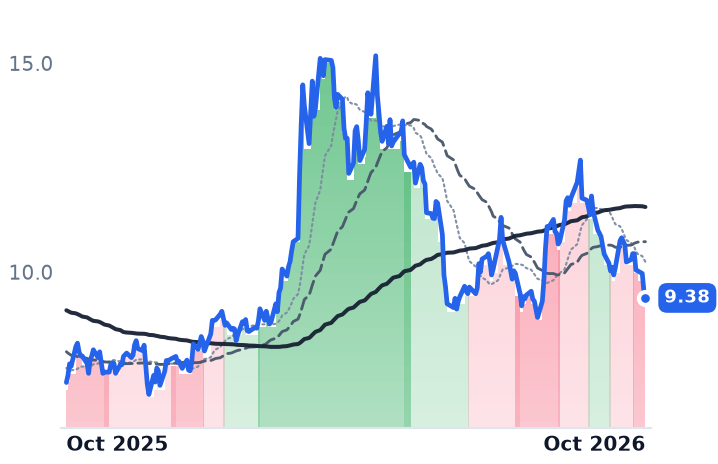
9.38
−0.18 (−1.88%)
vs. prior close
Price20d50d150d
AGRO 12-month price
Diversified Farming
INGR
Ingredion Incorporated
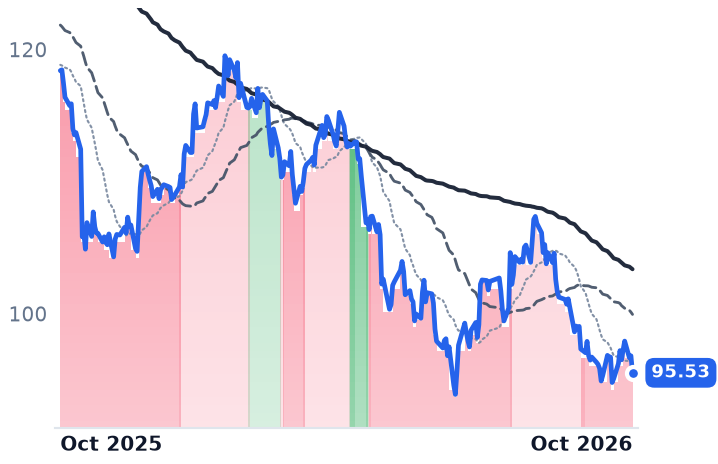
95.53
−1.29 (−1.33%)
vs. prior close
Price20d50d150d
INGR 12-month price
Ingredient Solutions
SPY
State Street SPDR S&P 500 ETF Trust
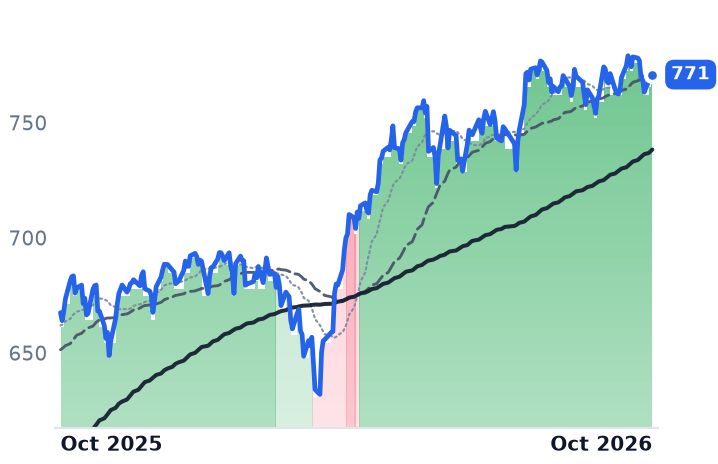
771
+1.85 (+0.24%)
vs. prior close
Price20d50d150d
SPY 12-month price
Asset Management
TickerMkt capP/EP/E fwdP/SP/S fwdP/GPP/GP fwdEV/EBITDAFCF yld
AGRO$5.8B157.5x6.8x3.5x2.6x11.7x8.7x12.8x0.8%
INGR$6.4B10.8x9.6x0.9x0.9x3.7x3.7x6.4x10.3%
SPY$773.0B————————
CTVA
Corteva
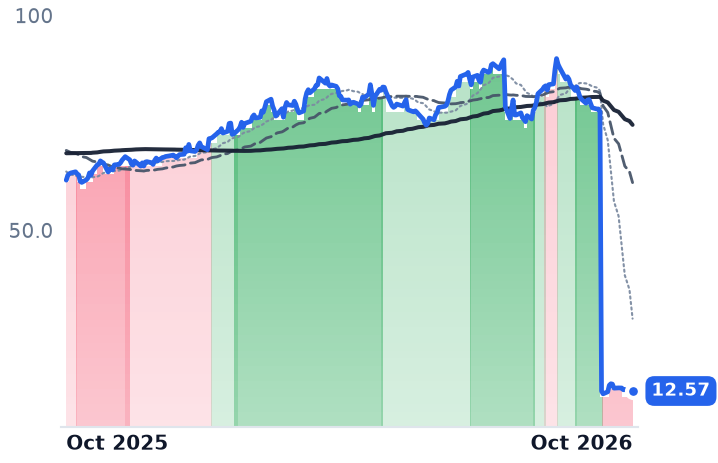
12.57
−0.32 (−2.52%)
vs. prior close
Price20d50d150d
CTVA 12-month price
Integrated Seed & Crop
TickerMkt capP/EP/E fwdP/SP/S fwdP/GPP/GP fwdEV/EBITDAFCF yld
CTVA$8.9B8.9x23.4x0.5x0.5x1.0x1.1x3.5x7.0%

Consensus projections

TickerFY2026EFY2027EFY2028E
BGRevenue+35.8%+3.0%−0.2%
EPS+27.7%+18.6%+8.7%
ADMRevenue+5.9%+6.0%+5.2%
EPS+63.1%+6.1%−0.6%
ANDERevenue+0.2%+3.3%+10.6%
EPS+131.6%+16.2%−100.0%
MOSRevenue+0.8%+7.5%−1.4%
EPS−83.2%+243.8%+39.0%
NTRRevenue+5.2%−1.3%−1.1%
EPS+6.8%−0.3%−8.0%
CFRevenue+16.6%−9.6%−6.1%
EPS+67.9%−24.7%−20.6%
DARRevenue+3.6%+14.5%+4.1%
EPS−68.8%+1308.0%−7.4%
GPRERevenue−14.6%+5.6%+2.2%
EPS−206.4%−18.1%+21.4%
DERevenue+8.2%+8.7%+8.0%
EPS−1.8%+25.4%+19.6%
AGRORevenue+62.6%+3.1%+0.5%
EPS+467.1%−21.4%−1.4%
INGRRevenue−0.6%+1.4%+1.4%
EPS−5.9%+6.4%+5.6%
CTVARevenue−1.2%−54.0%+3.3%
EPS+14.3%+27.0%+16.3%

Forward fiscal years only. Blank means no analyst coverage for that year.

The Environmental Protection Agency proposed on 13 October to hand back to the fuel market all of the renewable fuel credits it had excused small refineries from in August, and put two timing options out for comment: split that volume between the 2026 and 2027 compliance years, or push every ton of it into 2027. The feedstock those obligations turn into demand reacted the next day, with Chicago December soybean oil at 67.11 cents a pound. Bunge Global, which crushes soybeans, rapeseed, canola and sunflower into vegetable oil and protein meal, has kept sliding since.

The explanation on offer for that slide has been a glut of crush capacity drowning the meal side of the bean and collapsing the margin per bushel. The supply half of that is true. Crushers are running at record rates toward 2.75bn bushels in 2026/27 and roughly 65m short tons of meal, and the Department of Agriculture sees meal pinned at $310-315 a ton through the marketing year. What the glut has not done is break the spread, because the same plants were built to make oil, and oil's share of a crushed bean's value has risen toward 50% from about 35%. The board crush was $2.67½ a bushel in mid-October, up five cents.

The margin moved from the feed lot to the rule book

When half the bean's value is a biofuel feedstock, a compliance calendar prices the crush. Domestic soybean oil going into biofuel is forecast to grow 25% to 17.8 billion pounds, demand the Agriculture Department attributes directly to federal volume obligations and state mandates. October's WASDE left that biofuel forecast unchanged. The quantity of demand did not deteriorate in the month the shares fell; the question of which year it is owed in did.

What the June quarters already banked

Bunge's soybean and softseed processing delivered $700m of $796m of adjusted segment earnings in the June quarter, 88% of the total, and the company raised full-year adjusted earnings guidance to $9.25-$9.75 from $9.00-$9.50. Soy processing margins were "the best we've seen in a while," chief executive Greg Heckman told the 29 July call, where management said meal demand "continues to really surprise quarter after quarter" — the opposite of a meal-driven squeeze. Archer-Daniels-Midland, which buys oilseeds and corn and sells vegetable oils, meals, sweeteners and ethanol, reported oilseeds segment profit up 129% with crush volumes up nearly 5%, credited to renewable volume obligation demand.

Most of a crusher's quarter is also bought before it begins. North American crushing was about 90% covered for the third quarter and 30% for the fourth, chief executive Juan Luciano said on ADM's 4 August call, so an October spot move reaches reported earnings with a lag.

A complex-wide de-rating with one levered name inside it

Shares tell a different story. Bunge is down 16.1% over three months and ADM 7.8%, against a 3.0% gain in an S&P 500 tracking fund, and the month's weakness ran through fertilizer and rendering alike: Mosaic fell 26.5%, Nutrien 8.7%, Darling Ingredients 7.8% and CF Industries 7.1% over 30 days while the index fund was flat. JPMorgan trimmed its ADM target to $75 from $77 on 12 October at underweight and Bunge's to $139; Barclays set $150 on Bunge two days later.

So almost none of the fall traces to the per-bushel economics, which accelerated. Bunge's larger drawdown follows from its mix: nine-tenths of segment earnings come from the leg a biofuel rule prices, while ADM spreads the same exposure across carbohydrate and nutrition businesses. The live doubt is the ramp both prices embed. Bunge earned $3.82 in the first half, and consensus full-year earnings of $9.42 require $5.60 in the second, 47% more; chief financial officer John Neppl guided crush margins to the "low 40s" in the third quarter and the "high 50s" in the fourth. At 10.8x forward earnings against 19.6x trailing and 1.24x book, Bunge is the cheaper of the pair, with the caveat that trailing free cash flow is negative 3.6% of market value on Viterra working capital. ADM's 14.4x forward against 21.7x trailing is only cheap if the consensus $5.52 of 2026 earnings arrives against $2.23 actually earned in 2025.

Luciano described ADM's four-plant crush expansion as a "phased approach to allow for offramps" — a careful way to build into the best margins the industry has seen, and a measure of how durable management treats legislated demand. The comment file on where the exemption volumes land stays open into December. Bunge reports on 29 October with a quarter that was largely priced before any of it.
Telesat's Lenders Offered C$3.2bn to Refinance a December Maturity Due in a Revenue Trough

Hypothesis Opus 5 · Research Opus 5 · Writing Opus 5 · Prompt v1.7

Satellite operators fell hard through October, and the explanation on offer was that low-earth-orbit capacity has finally crushed the price of geostationary bandwidth. The accounts of the two worst performers say something narrower. Telesat's capacity revenue is leaving through expired direct-to-home contracts and retired satellites, with US$1.71bn due on 6 December. Viasat's June quarter showed aviation revenue up 11% and backlog up almost 19% to $4.2bn.

Telesat's lenders put a second rescue proposal on the table on 20 October, the day its shares dropped 10.8%. Consensus has group revenue falling to C$321m in 2026, two years before any Lightspeed money arrives.

One de-rating looks earned and one does not. Viasat, down roughly a fifth in a month, trades at 1.84x trailing sales with net leverage at 3.2x against 3.6x a year ago. Iridium, adding subscribers, barely moved.

TSATVSATGOGOIRDMECHOSIRIGSATASTSRKLBPLSPIRLUNRRDWBKSYUFOARKXROKTSPYGeostationary Capacity Run-OffLEO Constellation BuildoutDebt Refinancing WallIn-Flight ConnectivityMilitary Satcom Backlog
TickerCompanySegmentTrend · 13mo30D1Y
The subject · what this brief is about
TSATTelesatSatellite Communications🟢 Cont. Bull−20.9%+32.7%
VSATViasatBroadband Service Provider Solutions🟢 Cont. Bull−19.7%+67.2%
GOGOGogoNiche Connectivity🔴 Cont. Bear−16.3%−77.8%
IRDMIridium CommunicationsSatellite Communications🟢 Cont. Bull−8.1%+136.8%
SIRISirius XMAudio Entertainment🌱 Emerging Bull−1.9%+24.7%
Compared against · context, not the story
ECHOEchoStarSatellite Communications🔴 Cont. Bear−3.2%+25.1%
GSATGlobalstarSatellite Communications🟢 Cont. Bull+0.4%+85.3%
ASTSAST SpaceMobileSatellite Communications🔴 Cont. Bear−33.0%−47.3%
RKLBRocket Lab USASpace Systems & Launch🔴 Cont. Bear−23.9%−19.0%
PLPlanet Labs PBCSpace Systems & Launch🔴 Cont. Bear−19.6%+6.3%
SPIRSpire GlobalSpecialized Services⚠️ Emerging Bear−27.1%−25.7%
LUNRIntuitive MachinesSpace Systems & Launch🔴 Cont. Bear−28.9%−12.9%
RDWRedwireSpace Systems & Launch⚠️ Emerging Bear−26.8%+7.2%
BKSYBlackSky TechnologySecurity, Compliance & Emerging Tech🔴 Cont. Bear−25.6%−31.6%
UFOProcure Space ETFAsset Management🔴 Cont. Bear−8.6%+5.5%
ARKXARK Space & Defense Innovation ETFAsset Management⚠️ Emerging Bear−7.4%−0.7%
ROKTState Street SPDR S&P Kensho Final Frontiers ETFAsset Management⚠️ Emerging Bear−5.5%+27.9%
SPYState Street SPDR S&P 500 ETF TrustAsset Management🟢 Cont. Bull−0.4%+15.5%

12-month price & trend

TSAT
Telesat
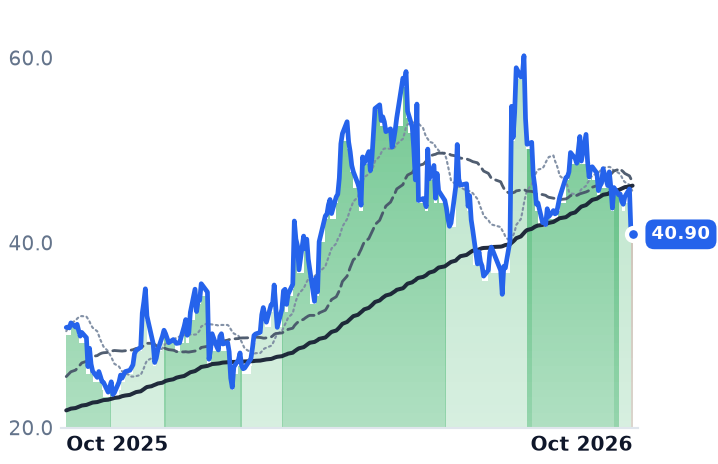
40.90
+0.04 (+0.10%)
vs. prior close
Price20d50d150d
TSAT 12-month price
Satellite Communications
VSAT
Viasat
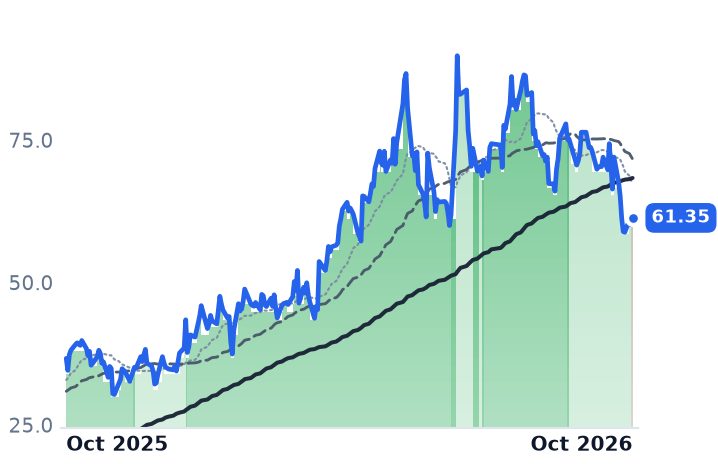
61.35
+1.18 (+1.95%)
vs. prior close
Price20d50d150d
VSAT 12-month price
Broadband Service Provider Solutions
GOGO
Gogo
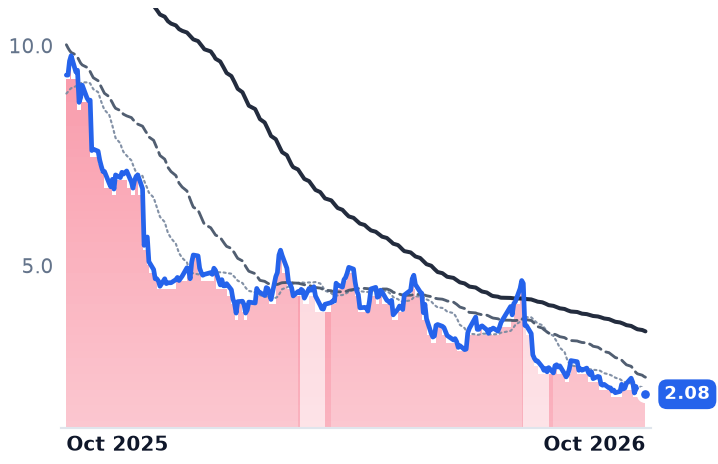
2.08
+0.01 (+0.24%)
vs. prior close
Price20d50d150d
GOGO 12-month price
Niche Connectivity
TickerMkt capP/EP/E fwdP/SP/S fwdP/GPP/GP fwdEV/EBITDAFCF yld
TSAT$628.3Mn/m—2.4x2.0x5.3x4.3xn/m-83.7%
VSAT$8.5Bn/m—1.8x1.8x6.1x5.8x7.6x6.8%
GOGO$285.2Mn/m30.1x0.3x0.3x0.6x0.6x7.3x-17.9%
IRDM
Iridium Communications
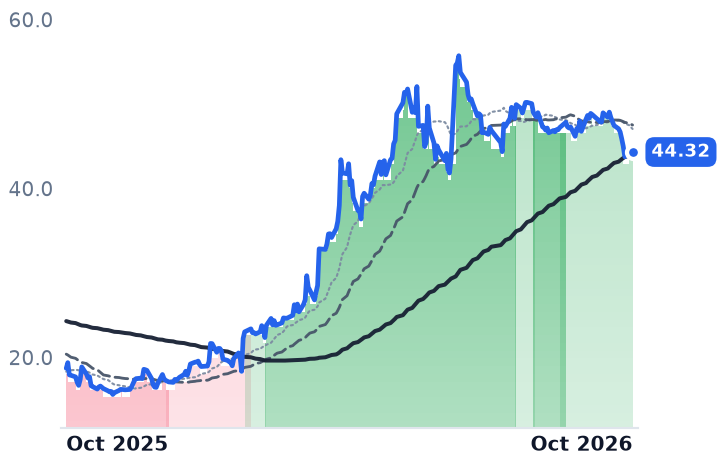
44.32
+0.38 (+0.86%)
vs. prior close
Price20d50d150d
IRDM 12-month price
Satellite Communications
ECHO
EchoStar
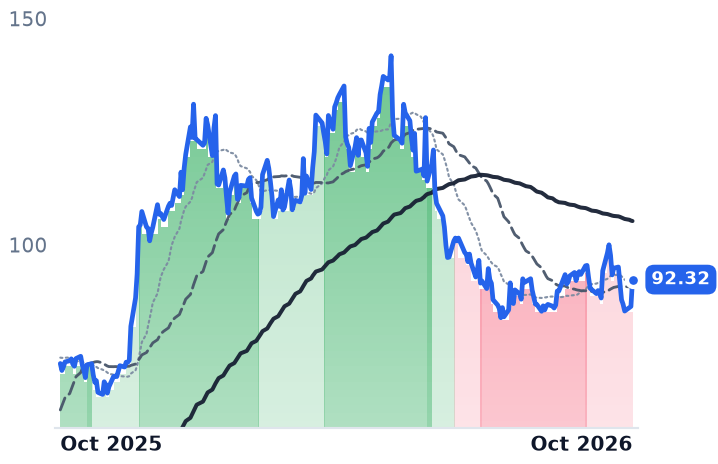
92.32
+5.93 (+6.86%)
vs. prior close
Price20d50d150d
ECHO 12-month price
Satellite Communications
SIRI
Sirius XM
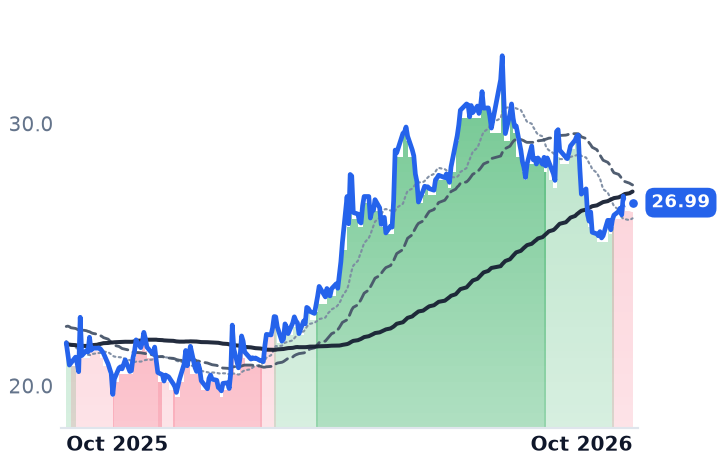
26.99
−0.17 (−0.64%)
vs. prior close
Price20d50d150d
SIRI 12-month price
Audio Entertainment
TickerMkt capP/EP/E fwdP/SP/S fwdP/GPP/GP fwdEV/EBITDAFCF yld
IRDM$4.7B28.9x39.8x5.2x5.1x6.8x6.7x13.5x5.9%
ECHO$13.9Bn/m3.6x1.0x1.0x3.2x3.3xn/m-1.9%
SIRI$9.1B10.3x9.1x1.1x1.1x2.3x2.3x8.0x17.0%
GSAT
Globalstar
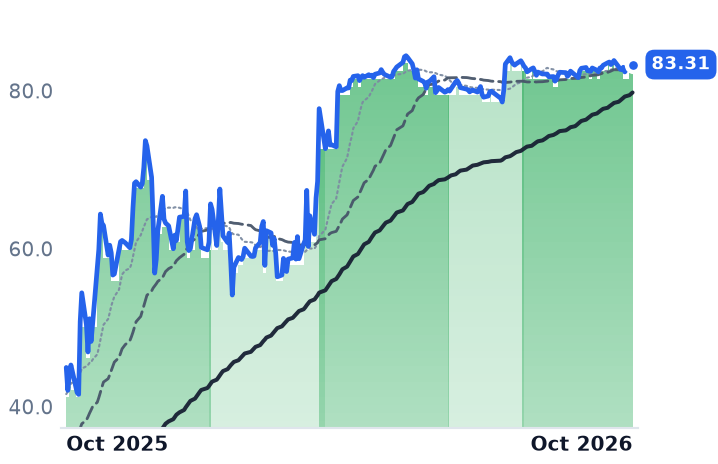
83.31
−0.09 (−0.11%)
vs. prior close
Price20d50d150d
GSAT 12-month price
Satellite Communications
ASTS
AST SpaceMobile
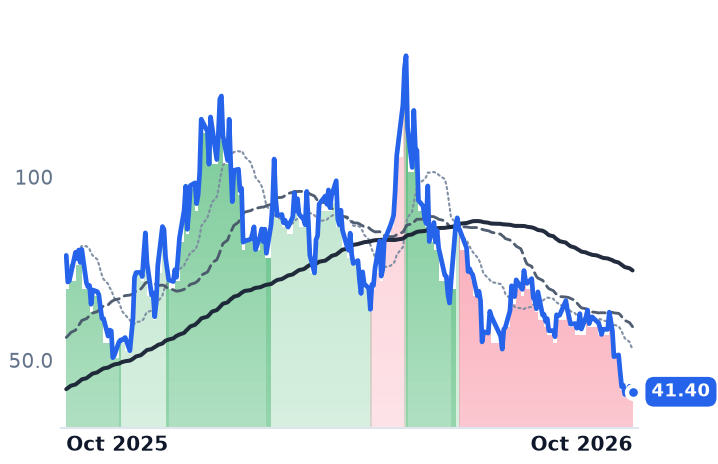
41.40
+0.27 (+0.66%)
vs. prior close
Price20d50d150d
ASTS 12-month price
Satellite Communications
RKLB
Rocket Lab USA
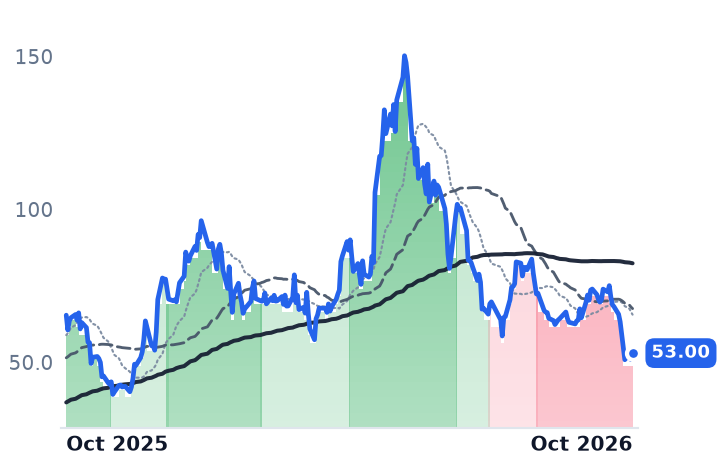
53.00
+2.10 (+4.13%)
vs. prior close
Price20d50d150d
RKLB 12-month price
Space Systems & Launch
TickerMkt capP/EP/E fwdP/SP/S fwdP/GPP/GP fwdEV/EBITDAFCF yld
GSAT$10.8Bn/m—38.3x37.7x78.0x76.6x172.7x1.7%
ASTS$23.7Bn/m—205.7x147.8x——n/m-6.9%
RKLB$34.3Bn/m—44.5x35.7x119.5x95.8xn/m-1.1%
PL
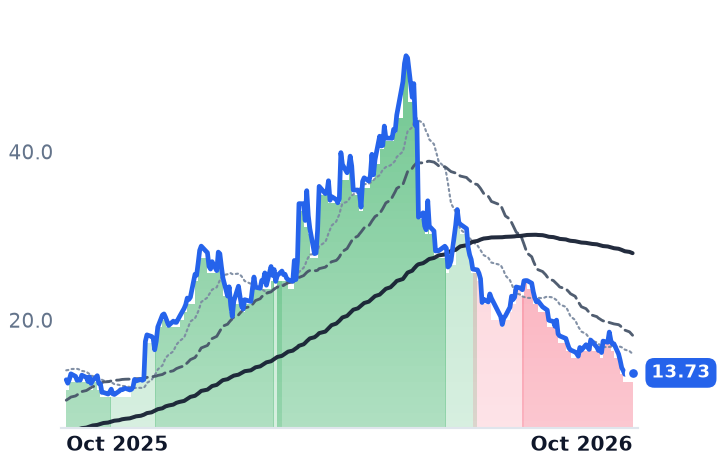
Planet Labs PBC
13.73
+0.33 (+2.43%)
vs. prior close
Price20d50d150d
PL 12-month price
Space Systems & Launch
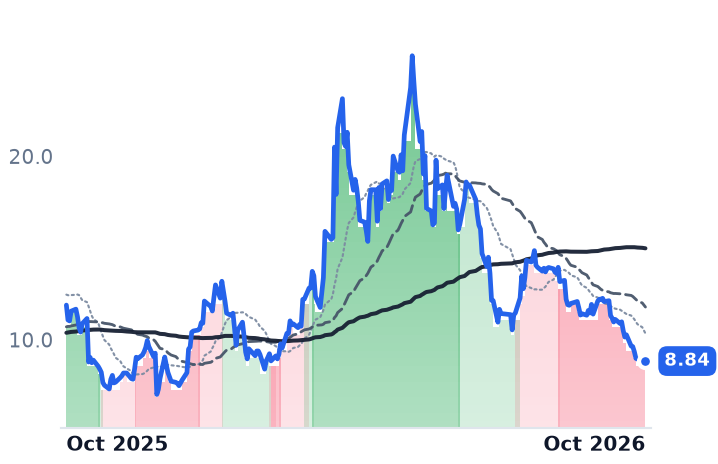
SPIR
Spire Global
8.84
+0.07 (+0.80%)
vs. prior close
Price20d50d150d
SPIR 12-month price
Specialized Services
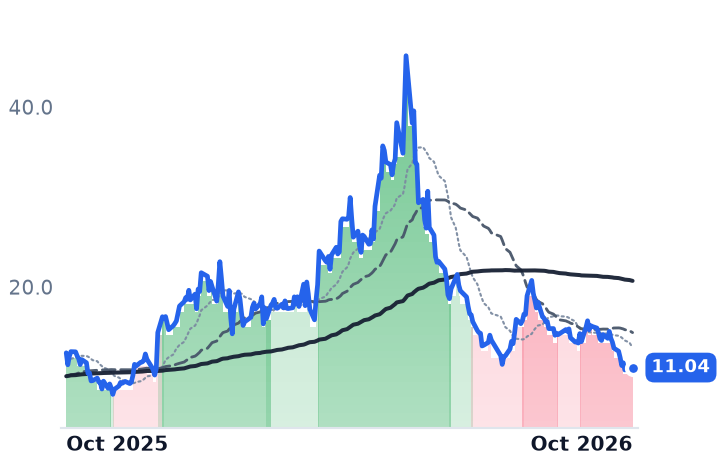
LUNR
Intuitive Machines
11.04
+0.50 (+4.74%)
vs. prior close
Price20d50d150d
LUNR 12-month price
Space Systems & Launch
TickerMkt capP/EP/E fwdP/SP/S fwdP/GPP/GP fwdEV/EBITDAFCF yld
PL$5.8Bn/m—15.4x13.3x27.8x24.0xn/m0.4%
SPIR$367.0Mn/m—5.9x4.6x15.6x12.2xn/m-29.6%
LUNR$2.3Bn/m—4.7x2.5x17.1x9.1xn/m-8.3%
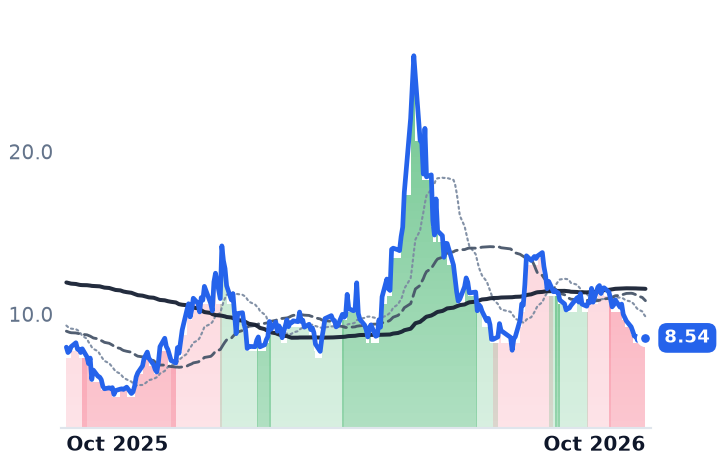
RDW
Redwire
8.54
+0.24 (+2.89%)
vs. prior close
Price20d50d150d
RDW 12-month price
Space Systems & Launch
BKSY
BlackSky Technology
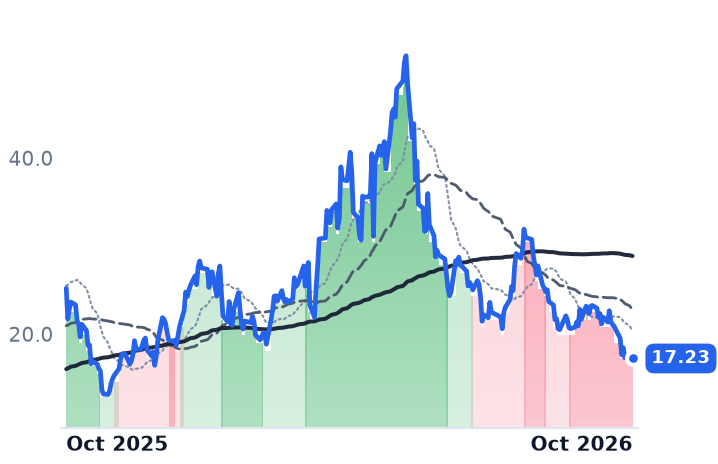
17.23
+0.36 (+2.13%)
vs. prior close
Price20d50d150d
BKSY 12-month price
Security, Compliance & Emerging Tech
UFO
Procure Space ETF
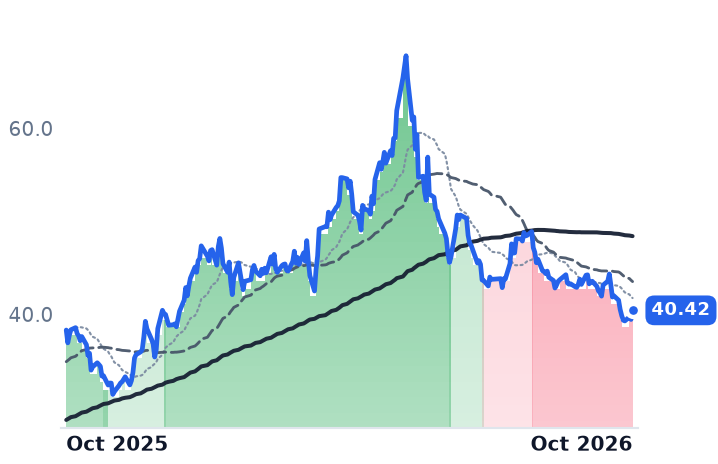
40.42
+0.98 (+2.48%)
vs. prior close
Price20d50d150d
UFO 12-month price
Asset Management
TickerMkt capP/EP/E fwdP/SP/S fwdP/GPP/GP fwdEV/EBITDAFCF yld
RDW$2.5Bn/m—6.0x5.3x29.6x26.6xn/m-4.1%
BKSY$886.8Mn/m—8.1x6.3x20.1x15.5xn/m-7.9%
UFO$177.4M————————
ARKX
ARK Space & Defense Innovation ETF
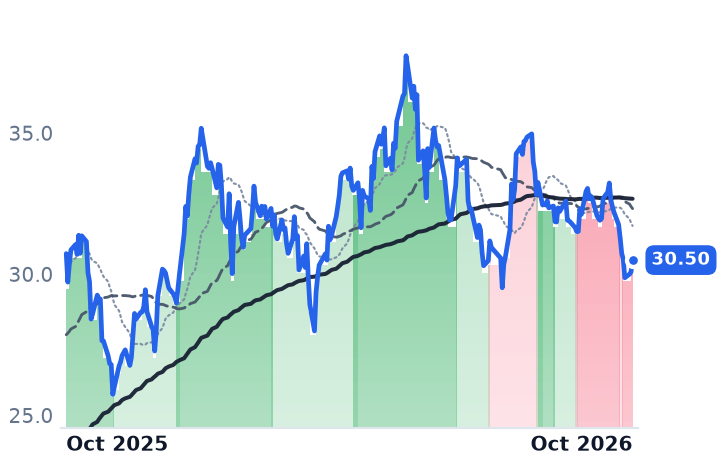
30.50
+0.42 (+1.40%)
vs. prior close
Price20d50d150d
ARKX 12-month price
Asset Management
ROKT
State Street SPDR S&P Kensho Final Frontiers ETF
102
+1.01 (+1.00%)
vs. prior close
Price20d50d150d
ROKT 12-month price
Asset Management
SPY
State Street SPDR S&P 500 ETF Trust
771
+1.85 (+0.24%)
vs. prior close
Price20d50d150d
SPY 12-month price
Asset Management
TickerMkt capP/EP/E fwdP/SP/S fwdP/GPP/GP fwdEV/EBITDAFCF yld
ARKX$543.3M————————
ROKT$44.2M————————
SPY$773.0B————————

Consensus projections

TickerFY2026EFY2027EFY2028E
TSATRevenue−22.9%−13.4%+95.1%
EPS+261.9%−46.8%−12.0%
VSATRevenue+3.6%+3.9%+4.6%
EPS−66.9%+40.3%+1.4%
GOGORevenue−1.9%+3.4%+17.0%
EPS−63.8%+400.0%+65.7%
IRDMRevenue+5.2%+5.5%+3.8%
EPS+3.6%+13.7%−17.1%
ECHORevenue−4.9%−6.7%−6.1%
EPS−153.6%−88.2%+14.9%
SIRIRevenue+0.6%+1.4%+2.3%
EPS+6.6%+10.9%+8.8%
GSATRevenue+4.9%+21.3%+48.7%
EPS−1748.3%−83.3%−399.0%
ASTSRevenue+174.7%+344.1%+146.7%
EPS+98.2%−45.8%−119.7%
RKLBRevenue+59.9%+45.4%+32.6%
EPS−27.9%−91.6%−1346.5%
PLRevenue+21.9%+46.7%+30.2%
EPS−55.9%−40.8%−129.2%
SPIRRevenue+12.4%+24.6%—
EPS−48.5%−61.6%—
LUNRRevenue+322.6%+23.3%+21.2%
EPS+69.3%−67.8%−152.9%
RDWRevenue+44.6%+18.7%+21.2%
EPS−55.6%−52.4%−57.9%
BKSYRevenue+30.1%+36.6%+32.8%
EPS−33.0%−69.4%−156.1%

Forward fiscal years only. Blank means no analyst coverage for that year.

On 20 October a group of Telesat's lenders, Silver Point Capital, GoldenTree Asset Management and Sound Point Capital Management among them, put a second proposal to the Ottawa satellite operator: they would help it raise $1.7bn of new equity and borrow $1.5bn, a C$3.2bn package, against a bill falling due in six weeks. The shares dropped 10.8% that session. An earlier offer in August met the same response: acknowledged, never negotiated. Chief financial officer Donald Tremblay said the company continues to seek a negotiated resolution in good faith.

The month's slide across satellite operators has been read as the market marking down geostationary fleet economics now that low-earth-orbit capacity is flooding consumer and mobility broadband. The ledgers of the two worst performers do not carry that story. Telesat's capacity revenue is leaving through expired contracts and retired satellites rather than through discounting, and the one business where a rival constellation demonstrably took the customers is a 115,000-subscriber remnant inside a $4.6bn company.

A December bill, and no new revenue until 2028

Telesat sells geostationary capacity to direct-to-home broadcasters, carriers and governments, and that book is in run-off. June-quarter revenue was C$79.5m, down 25% year on year, the fourth straight quarter down between 25% and 27%. Full-year 2025 revenue of C$417.6m compares with C$704.2m in 2023. The geostationary segment alone fell 26% on direct-to-home non-renewals and weaker fixed enterprise demand, with chief executive Dan Goldberg flagging satellite retirements as a headwind through the rest of 2026.

Against that, roughly US$1.71bn comes due on 6 December, a $1.32bn term loan and a $387m note, with a further US$438m in 2027. Consensus has revenue falling again to C$321m in 2026 and C$277.8m in 2027 before Lightspeed, the planned low-orbit constellation, begins contributing C$541.9m in 2028. The maturity lands at the bottom.

The constellation itself is the part going right. Lightspeed backlog has reached $5.6bn, helped by a $2.3bn Arctic military satcom contract with Canada's Defence Investment Agency that let Telesat add 69 funded satellites and take the initial fleet from 156 to 225. "Telesat Lightspeed is fully funded and we remain on track to commence global commercial service around the end of Q1 2028," Goldberg told investors in August 2026. Planned 2026 Lightspeed spending was raised to C$1.3-1.5bn from C$1.0-1.2bn; backlog rose faster. None of that reaches the December calendar. On the publicly traded shares, which represent a minority of an economic interest held largely by Loral and Canada's PSP, the stock sits at 2.44x trailing and 1.96x forward sales, with a trailing free-cash-flow yield of -83.7%.

Viasat's aviation book grew while its home-internet rump shrank

Viasat, which sells satellite broadband and voice to homes, in-flight connectivity to airlines, maritime service to ships and satcom to governments, reported June-quarter revenue of $1.2bn, down 1%, with adjusted EBITDA of $381m against $408m and a net loss of $52m narrowed by lower interest expense as debt was repaid. Fixed services revenue fell 27% to 115,000 US subscribers at $111 average revenue each. Aviation revenue rose 11% across roughly 4,530 commercial aircraft. Awards were $1.3bn, up 10%, of which defense and advanced technologies took $524m, up 22%; backlog rose almost 19% to $4.2bn. Net debt of $4,835m equals 3.2x trailing EBITDA, against 3.6x a year earlier.

"We are exiting the year stronger than we entered," chief executive Mark Dankberg wrote in the shareholder letter for the year to 31 March 2026, citing record backlog and the multi-orbit fleet expansion.

The price went the other way. Viasat fell 19.7% over the thirty days to 21 October, and the fall began the day after good news: the shares jumped 8.4% on 9 October when Raymond James reiterated Outperform with a $107 target on the completed ViaSat-3 constellation, then gave up 14.9% over the next three sessions. At 1.84x trailing and 1.75x forward sales, 7.6x trailing enterprise value to EBITDA and a 6.8% free-cash-flow yield, it is priced where it stood in May, at 1.71x sales, before the deleveraging and the larger backlog. The company is still loss-making: consensus EPS is -$1.42 for the year to March 2027 and -$1.44 the year after.

Where a constellation really took the money

Price, in the one place it is observable, moved up. Starlink's Aviation Global Unlimited plan went to $20,000 a month from $10,000, annoying private-jet operators. What Starlink is taking is installed base, not margin: United Airlines had fitted it to 540 of 1,646 aircraft by 25 August and expects 1,000 by year-end, yet Viasat's aviation line still grew, which implies the connected fleet is expanding faster than incumbent terminals are stripped out.

Gogo, which runs air-to-ground networks for business and commercial aviation, is the clean casualty. June-quarter revenue slipped 1.4% but gross margin fell to 42.0% from 47.3%, and William Blair cut the stock to Market Perform citing Starlink competition, net debt and pressure on air-to-ground net additions, with fleet customers such as NetJets able to switch. At 0.32x sales and a -17.9% free-cash-flow yield it has been falling for a year, down 77.8%, long before October. Iridium, selling narrowband voice, data and internet-of-things connectivity, reported third-quarter revenue of $245.7m, up 8%, service revenue up 13% and 2,696,000 billable subscribers against 2,542,000; net income was $106.9m against $37.1m. It fell 8.1% on the month and its forward price-to-earnings of 39.8x sits above a trailing 28.9x, consensus expecting EPS to fall back from a figure flattered by its Aireon purchase.

One de-rating the accounts explain, one they do not

Telesat's is explained: a halved revenue base, negative EBITDA and US$2.1bn falling due over fourteen months make the equity a function of what creditors accept, and nothing in the Lightspeed backlog changes the date. Viasat's is harder to attach to anything it disclosed; the likelier reading is the repricing of everything space-adjacent, which ran deeper in the pure plays than in the operators. AST SpaceMobile fell 33% over the same thirty days, Spire 27%, Rocket Lab 24%, against 0.4% for the S&P 500 tracker, after SpaceX bought a nationwide low-band spectrum portfolio on 8-9 October and Rocket Lab's Neutron first flight slipped to 2027. Globalstar sat it out, finishing the month 0.4% higher, so the selling discriminated.

Starlink adds roughly 1,500 satellites a year and launches every four or five days. That curve moves continuously and cannot produce a thirty-day step change in anyone's contracted prices. A loan agreement can, and Telesat's matures on 6 December.

A Stopgap Pentagon Budget Bars New Program Starts, Sparing L3Harris's Record Backlog

Hypothesis Opus 5 · Research Opus 5 · Writing Opus 5 · Prompt v1.7

The shelf of intelligence, surveillance and reconnaissance contractors has been read as a demand story going backwards. Their June quarters carry the strongest order books any of them has reported.

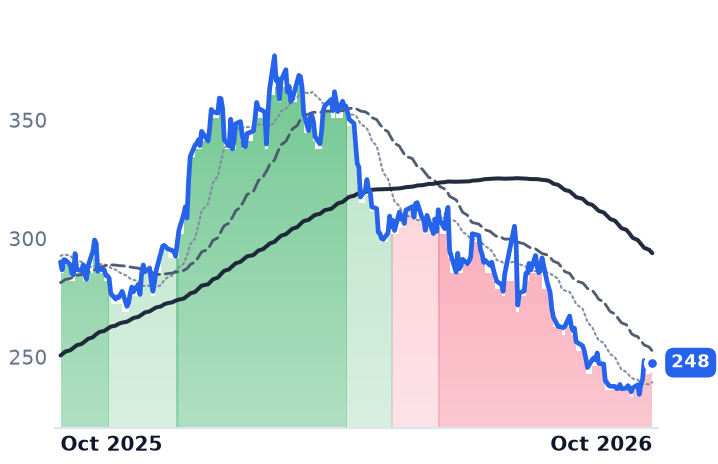
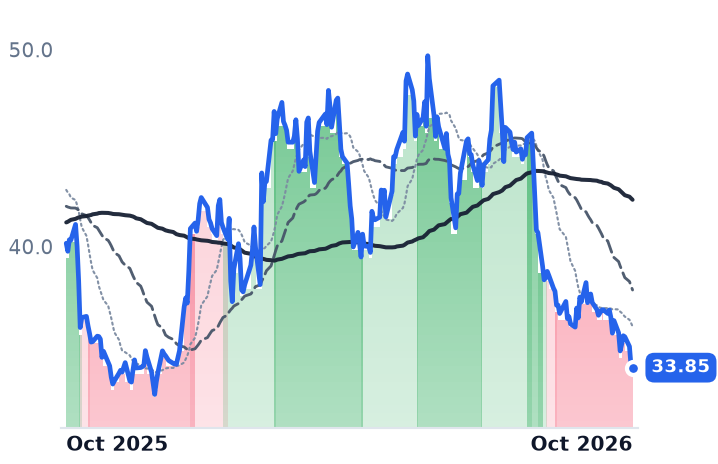
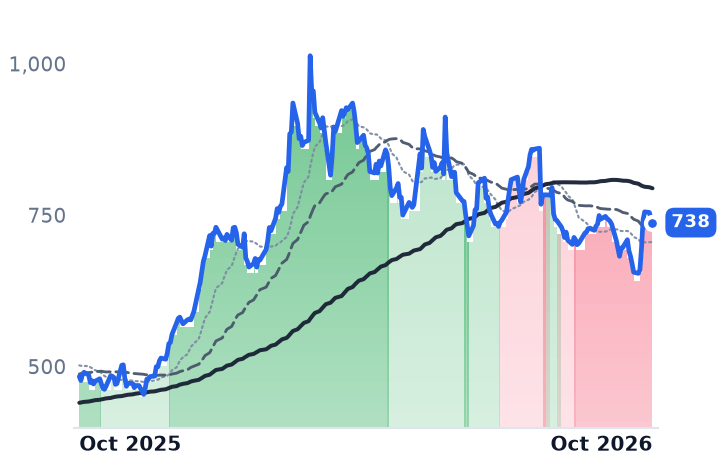
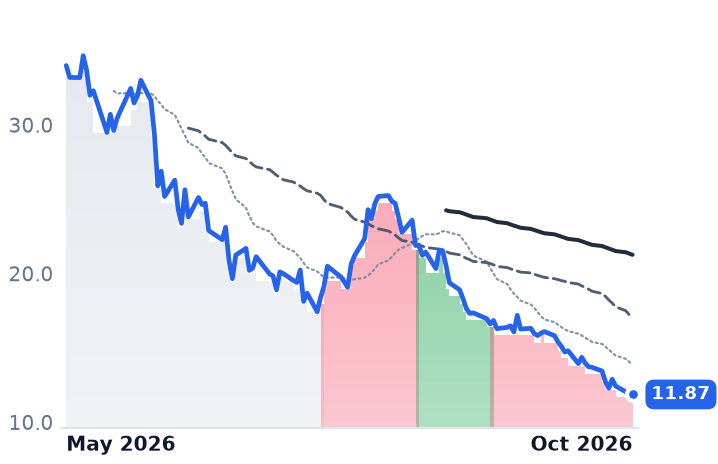
L3Harris booked $7.3bn of orders into a record $42bn backlog, Leonardo DRS logged its 18th consecutive quarter of book-to-bill at or above 1.0 with funded backlog up 17%, and Elbit's backlog reached $32.0bn with 73% of it outside Israel. What splits the group is whether the revenue is already appropriated. The stopgap Pentagon budget signed in September bars new program starts, and HawkEye 360, whose only business is signals intelligence gathered from satellites, sits at an all-time low despite consensus revenue growth of 85%. L3Harris has de-rated to 20.7x forward earnings from 38.0x trailing at the start of May.

LHXDRSESLTHAWKLYNXNOCLMTGDRTXLDOSAVAVKTOSDefense Budget AppropriationsFunded Backlog GrowthMilitary Satellite IntelligenceInfrared Sensing & RadarMissile Defense Programs
TickerCompanySegmentTrend · 13mo30D1Y
The subject · what this brief is about
LHXL3Harris TechnologiesISR & Mission Systems🔴 Cont. Bear+0.2%−14.6%
DRSLeonardo DRSISR & Mission Systems⚠️ Emerging Bear−11.3%−15.7%
ESLTElbit SystemsISR & Mission Systems🔴 Cont. Bear−1.4%+52.5%
HAWKHawkEye 360ISR & Mission Systems🔴 Cont. Bear−27.3%−65.1%
LYNXLyntrisISR & Mission Systems🔴 Cont. Bear−15.0%−24.5%
Compared against · context, not the story
NOCNorthrop GrummanIntegrated Defense Contractors🔴 Cont. Bear+2.1%−9.8%
LMTLockheed MartinIntegrated Defense Contractors⚠️ Emerging Bear+2.2%+13.2%
GDGeneral DynamicsIntegrated Defense Contractors🟢 Cont. Bull−3.1%+1.8%
RTXRTXIntegrated Defense Contractors🟢 Cont. Bull−2.2%+10.9%
LDOSLeidosDefense & Government Services🔴 Cont. Bear−0.5%−33.5%
AVAVAeroVironmentUnmanned & Autonomous Systems🔴 Cont. Bear−28.5%−69.1%
KTOSKratos Defense & Security SolutionsUnmanned & Autonomous Systems🔴 Cont. Bear−20.8%−57.4%

12-month price & trend

LHX
L3Harris Technologies
248
−1.15 (−0.46%)
vs. prior close
Price20d50d150d
LHX 12-month price
ISR & Mission Systems
DRS
Leonardo DRS
33.85
−0.09 (−0.27%)
vs. prior close
Price20d50d150d
DRS 12-month price
ISR & Mission Systems
ESLT
Elbit Systems
738
−6.65 (−0.89%)
vs. prior close
Price20d50d150d
ESLT 12-month price
ISR & Mission Systems
TickerMkt capP/EP/E fwdP/SP/S fwdP/GPP/GP fwdEV/EBITDAFCF yld
LHX$46.1B24.9x20.7x2.0x2.0x7.9x7.7x13.9x6.1%
DRS$9.0B28.2x24.3x2.4x2.3x9.6x9.2x18.2x4.0%
ESLT$35.0B54.1x50.8x4.1x3.8x16.2x15.3x38.0x2.0%
HAWK
HawkEye 360
11.87
−0.03 (−0.25%)
vs. prior close
Price20d50d150d
HAWK 12-month price
ISR & Mission Systems
LYNX
Lyntris
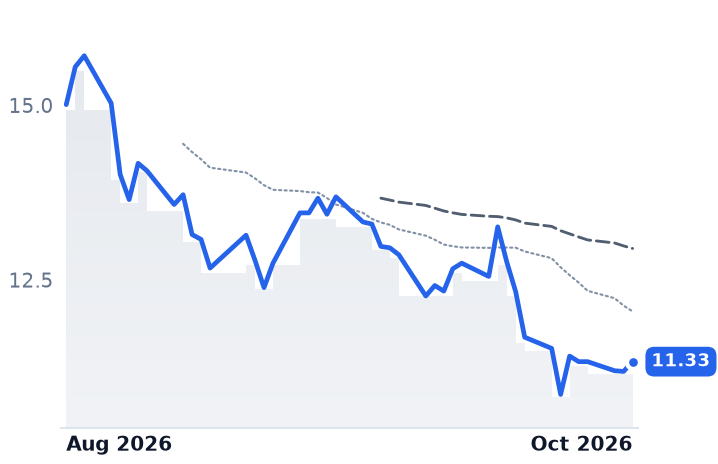
11.33
+0.14 (+1.25%)
vs. prior close
Price20d50d150d
LYNX 12-month price
ISR & Mission Systems
NOC
Northrop Grumman
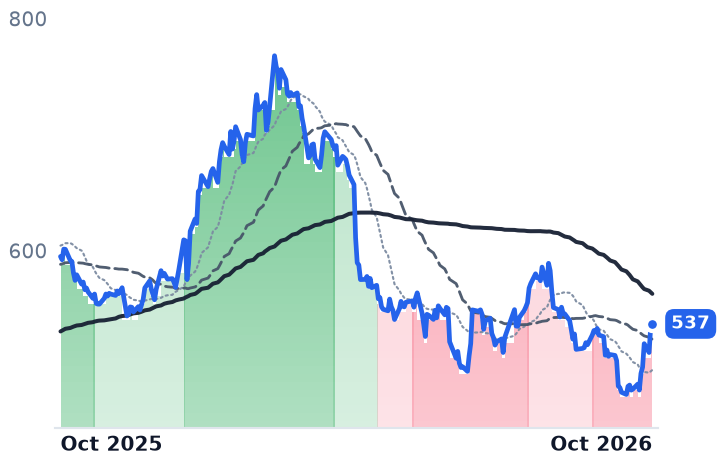
537
+2.92 (+0.55%)
vs. prior close
Price20d50d150d
NOC 12-month price
Integrated Defense Contractors
TickerMkt capP/EP/E fwdP/SP/S fwdP/GPP/GP fwdEV/EBITDAFCF yld
HAWK$1.2Bn/m—7.0x5.4x10.8x8.4x68.7x-0.2%
LYNX$1.3B————————
NOC$70.4B15.7x17.1x1.6x1.6x8.2x8.0x11.3x5.2%
LMT
Lockheed Martin
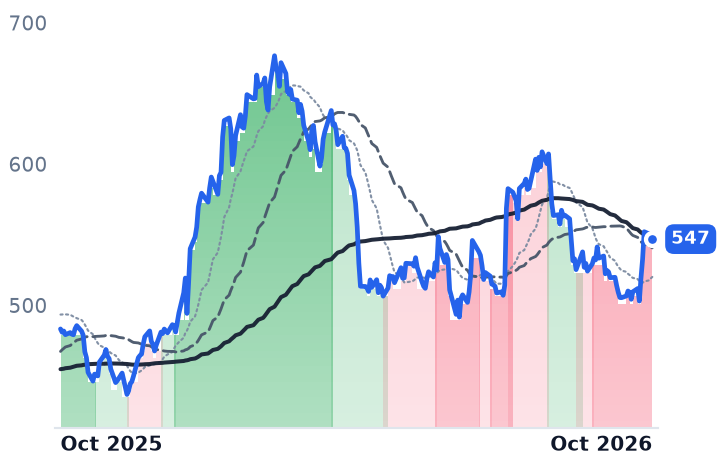
547
−1.84 (−0.34%)
vs. prior close
Price20d50d150d
LMT 12-month price
Integrated Defense Contractors
GD
General Dynamics
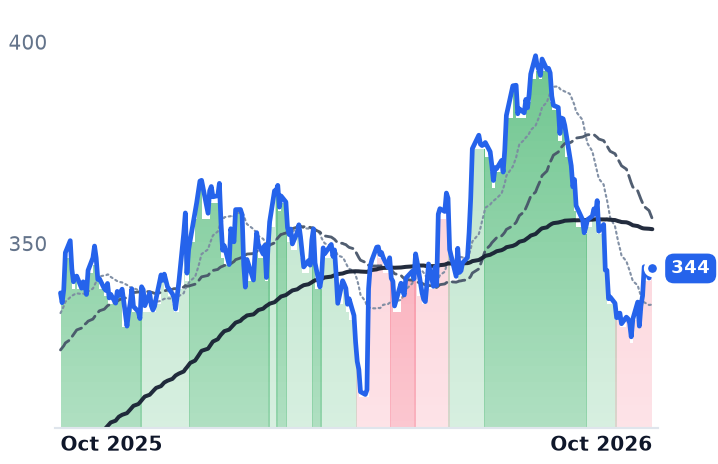
344
−0.64 (−0.18%)
vs. prior close
Price20d50d150d
GD 12-month price
Integrated Defense Contractors
RTX
RTX
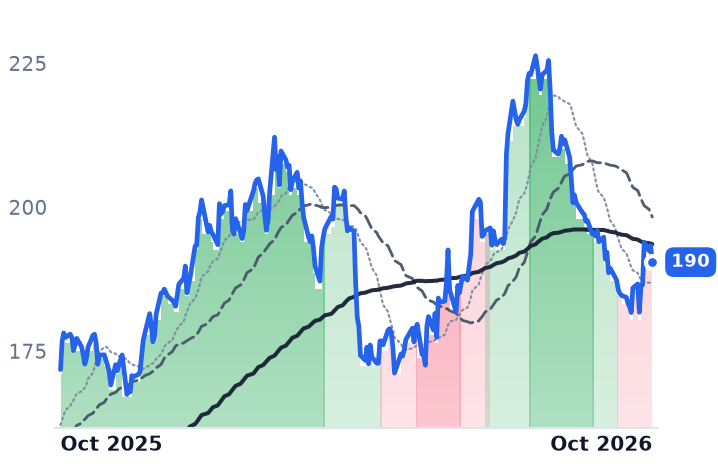
190
−2.89 (−1.49%)
vs. prior close
Price20d50d150d
RTX 12-month price
Integrated Defense Contractors
TickerMkt capP/EP/E fwdP/SP/S fwdP/GPP/GP fwdEV/EBITDAFCF yld
LMT$120.5B19.2x17.2x1.6x1.5x13.3x12.6x13.4x7.2%
GD$90.5B20.1x19.7x1.7x1.6x10.7x10.5x14.3x7.1%
RTX$248.9B32.1x25.5x2.7x2.6x13.1x12.7x17.4x4.8%
LDOS
Leidos
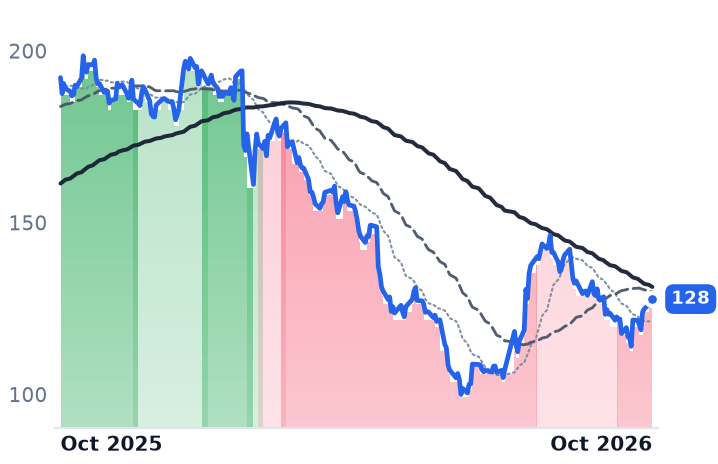
128
+0.10 (+0.08%)
vs. prior close
Price20d50d150d
LDOS 12-month price
Defense & Government Services
AVAV
AeroVironment
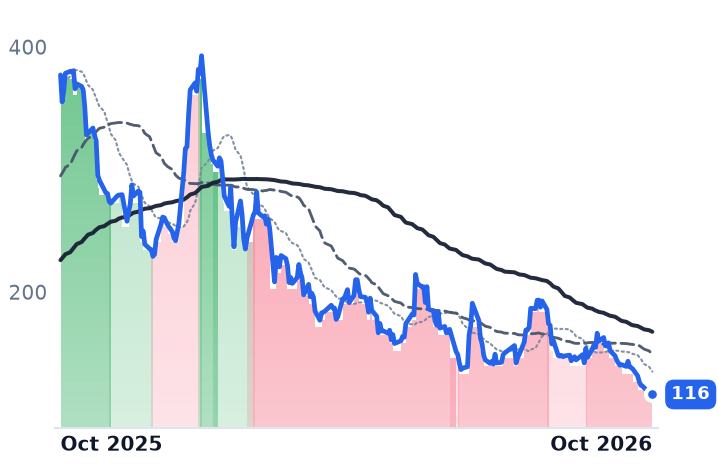
116
−1.21 (−1.03%)
vs. prior close
Price20d50d150d
AVAV 12-month price
Unmanned & Autonomous Systems
KTOS
Kratos Defense & Security Solutions
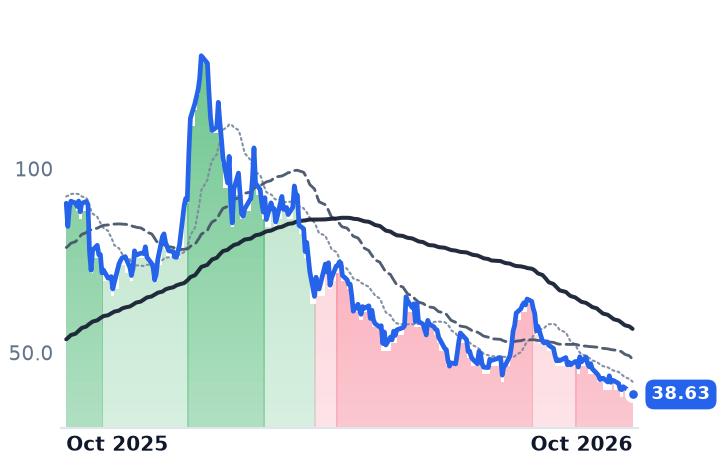
38.63
−0.33 (−0.85%)
vs. prior close
Price20d50d150d
KTOS 12-month price
Unmanned & Autonomous Systems
TickerMkt capP/EP/E fwdP/SP/S fwdP/GPP/GP fwdEV/EBITDAFCF yld
LDOS$14.8B10.9x9.5x0.8x0.8x4.8x4.6x9.0x14.6%
AVAV$7.5Bn/m45.6x3.8x3.4x15.0x13.5xn/m-1.6%
KTOS$9.8B302.5x62.0x6.4x5.5x29.1x24.8x71.8x-1.3%

Consensus projections

TickerFY2026EFY2027EFY2028E
LHXRevenue+3.2%+7.1%+7.4%
EPS−18.5%+12.2%+13.6%
DRSRevenue+10.2%+7.0%+6.1%
EPS+27.1%+6.0%+9.7%
ESLTRevenue+15.5%+12.2%+10.6%
EPS+37.5%+19.7%+15.4%
HAWKRevenue+84.6%+25.3%+23.6%
EPS−3595.0%−108.1%+1992.6%
NOCRevenue+5.3%+6.9%+6.2%
EPS+11.0%+5.0%+8.1%
LMTRevenue+8.5%+6.1%+6.1%
EPS+40.6%+7.7%+6.9%
GDRevenue+7.7%+5.0%+4.4%
EPS+10.5%+9.5%+8.0%
RTXRevenue+10.6%+7.6%+7.3%
EPS+16.8%+9.2%+10.5%
LDOSRevenue+5.2%+6.1%+4.7%
EPS+17.1%+4.6%+2.9%
AVAVRevenue+140.3%+15.9%+15.0%
EPS−5.6%+13.3%+37.2%
KTOSRevenue+34.7%+23.3%+21.7%
EPS+57.7%+34.4%+28.7%

Forward fiscal years only. Blank means no analyst coverage for that year.

Congress's stopgap funding law lets the Pentagon keep paying for work already underway and forbids it from beginning anything new. That one rule has done more to sort defense share prices over the past month than any change in what the armed services want to buy.

The companies that build airborne and ground sensing systems have fallen far enough to be read as proof that money is draining out of manned sensor platforms and into satellites. Their June quarters say something else. L3Harris Technologies, Leonardo DRS and Elbit Systems each reported faster revenue growth, wider operating margins and a record order book. The name marked down hardest in the group is the one whose entire business is sensing from space.

The rule inside the stopgap

The continuing resolution signed on 2 September 2026 runs to 11 December and holds the department at the extended fiscal 2026 baseline of $838.5bn against a $1.5 trillion request. It bars any project, program or activity that was not already funded and active in the prior year. Breaking Defense counts more than 150 fiscal 2027 initiatives blocked from starting, including $17.5bn of Golden Dome missile-defense work. A rule written that way penalizes a contractor waiting on a new start and leaves a contractor sitting on funded backlog untouched.

What L3Harris already has under contract

L3Harris, which integrates reconnaissance aircraft, space payloads, tactical radios and electronic warfare systems for governments, took $7.3bn of orders in the June quarter for a 1.2x book-to-bill, lifting backlog above $42bn. Revenue rose 8.4% to $5.88bn and operating margin widened to 11.1% from 10.8%. Its Space & Mission Systems unit grew 7% to about $3bn on higher volume in reconnaissance and missionized aircraft, classified space and F-35 control systems; the segment's 9.8% margin was 60 basis points lower only because a prior-year gain on a product-line sale did not repeat.

"We are actively negotiating more than $20 billion in new contracts, potentially tripling our backlog," chief executive Christopher Kubasik told investors on the 29 July 2026 call.

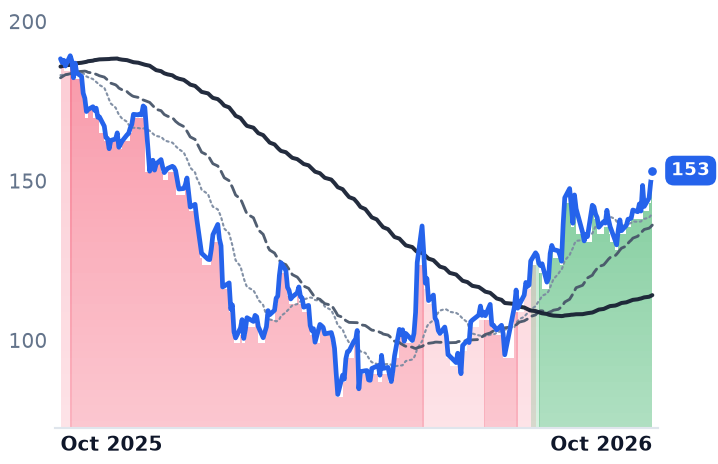
The shares are flat over thirty days, down 10.8% over ninety and 15.3% over a year. That leaves 24.9x trailing and 20.7x forward earnings against 38.0x trailing at the start of May, when the market capitalization was $60.7bn rather than today's $46.1bn, with consensus fiscal 2027 earnings per share of $11.94 still climbing at 12%. The propulsion franchise bought with Aerojet Rocketdyne in 2023 and the classified sensor portfolio are intact.

Leonardo DRS fell furthest and bought the software layer

DRS, which supplies infrared sensing, tactical radars and rugged computing to the US military and prime contractors, is down 25.5% over ninety days. Its bookings exceeded $1.1bn for a 1.2x book-to-bill, the 18th consecutive quarter at or above 1.0x, with record funded backlog of $5.1bn, up 17%. Operating margin widened 273 basis points to 11.2% on revenue up 10.1%. The Advanced Sensing and Computing segment that carries the reconnaissance franchise grew 8% to $587m with adjusted EBITDA margin up 110 basis points to 11.8%. "Organic revenue growth accelerated to 10% year-over-year," chief executive John Baylouny said on 30 July 2026.

Far from losing work to software-defined sensing, DRS agreed on 28 July to buy Raft, a McLean, Virginia mission-software firm, for $450m in cash. At 24.3x forward earnings it remains dearer than L3Harris, and consensus has its earnings growth decelerating from 27% this year to 6% next.

The space pure-play that should have won

If reconnaissance dollars were migrating to orbit, HawkEye 360 would be the beneficiary. It operates more than 30 satellites mapping radio-frequency emissions for government and allied customers, and consensus has revenue of $217m this year, up 85%, on a 70% gross margin. Instead it set an all-time low of $11.92 on 19 October, down 27.3% in thirty days from an IPO at $26 in May, and trades at 8.36x forward gross profit against 9.18x for DRS. The budget record points the same way: fiscal 2027 defense authorization drafts would dissolve the Space Development Agency into Space Force portfolio executives, after the prior request cut its transport layer by 20%.

Elbit's funding is European

Elbit, the Haifa prime that makes electro-optics, electronic warfare and rocket artillery, is up 52.2% over a year with a record $32.0bn backlog, 73% of it outside Israel and the quarter's increase mainly European. North America was 20% of June-quarter sales. Its largest award of the year was a roughly $1.4bn five-year modernization contract for a European customer in May. At 50.8x forward earnings and 8.1x book it is the most expensive name here, and no part of a bear case.

What the order books do and do not explain

None of the three order books explains the de-rating; neither drawdown traces to a dated catalyst, with no single session worse than about 3% for either L3Harris or DRS. The dividing line is whether a company's revenue has already been appropriated. Lockheed Martin and Northrop Grumman each rose about 2% over thirty days, while AeroVironment lost 28.5% and Kratos 20.8% — both dependent on programs the stopgap will not let the Pentagon begin. DRS sits between: funded backlog at a record, and a premium multiple that needed the new starts to justify it.
Both L3Harris and Leonardo DRS report third-quarter results on 29 October, six weeks before the stopgap expires. Until the appropriation passes, the safest thing a defense contractor can own is a contract somebody already signed.

AppFolio's Growth Comes From Fees on Rent Payments, Not From Signing Up More Apartments

Hypothesis Opus 5 · Research Opus 5 · Writing Opus 5 · Prompt v1.7

A property-management software company that collects most of its money from transactions rather than subscriptions is the weakest performer in a group that has spent three months re-rating on the view that artificial intelligence will not hollow out software subscriptions after all. Of AppFolio's $281.1m of June-quarter revenue, $219.5m was fees on rent payments, tenant screening and insurance, and that line grew 22% while the units on the platform grew only 8% to 9.6 million.

The business supports the recovery: revenue up 19.3%, operating margin to 18.8% from 17.2%, guidance raised. The de-rating does not have much left to give back, though. On unchanged consensus earnings the shares sit at roughly 95% of their year-ago multiple, so further gains have to come from the fee count rather than from repair.

APPFDSGXMANHBLKBINTADOCUNOWBSYAGYSROPVertical SaaSProperty Management SoftwareEmbedded Payments & FintechMultifamily Rental CycleAI Seat-Pricing RiskTenant Screening & Insurance
TickerCompanySegmentTrend · 13mo30D1Y
APPFAppFolioIndustry-Specific Platforms🌱 Emerging Bull+7.6%−5.3%
DSGXThe Descartes SystemsIndustry-Specific Platforms🌱 Emerging Bull+17.4%−4.5%
MANHManhattan AssociatesIndustry-Specific Platforms🟢 Cont. Bull+13.1%+15.3%
BLKBBlackbaudIndustry-Specific Platforms🌱 Emerging Bull+26.8%−16.8%
INTAIntappSales, Service & Customer Management🌱 Emerging Bull+24.2%+13.8%
DOCUDocuSignSoftware Development & Design🌱 Emerging Bull+18.5%+12.3%
NOWServiceNowSales, Service & Customer Management🌱 Emerging Bull+11.7%−18.6%
BSYBentley Systems, IncorporatedSoftware Development & Design🌱 Emerging Bull+19.7%−26.1%
AGYSAgilysysIndustry-Specific Platforms🟢 Cont. Bull+17.5%+3.6%
ROPRoper TechnologiesEnterprise Resource Planning🌱 Emerging Bull+7.8%−22.1%

12-month price & trend

APPF
AppFolio
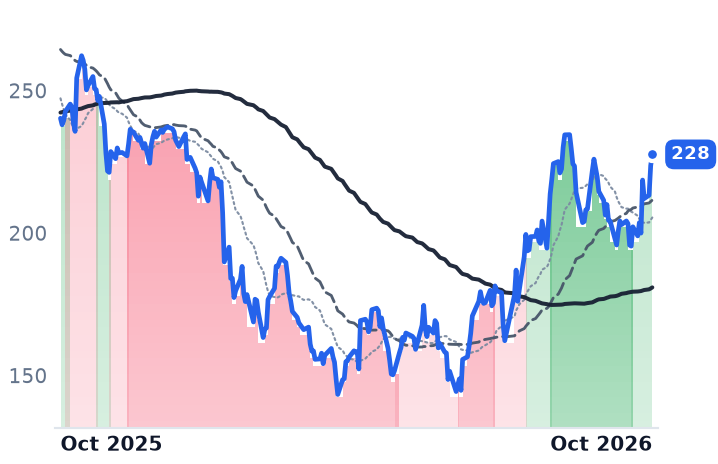
228
+3.92 (+1.75%)
vs. prior close
Price20d50d150d
APPF 12-month price
Industry-Specific Platforms
DSGX
The Descartes Systems
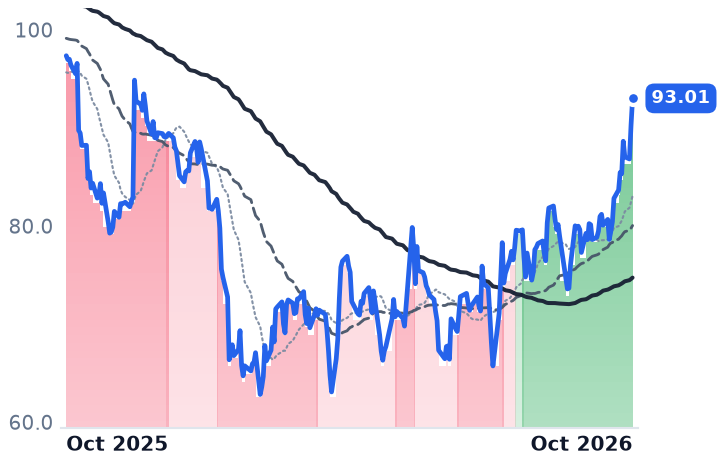
93.01
+2.78 (+3.08%)
vs. prior close
Price20d50d150d
DSGX 12-month price
Industry-Specific Platforms
MANH
Manhattan Associates
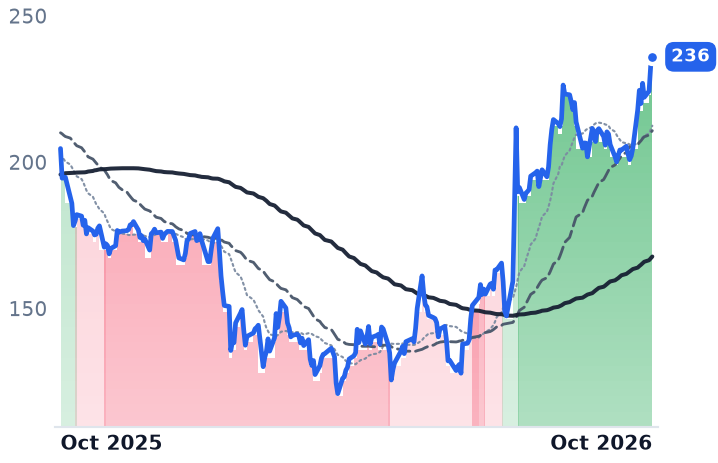
236
+3.15 (+1.35%)
vs. prior close
Price20d50d150d
MANH 12-month price
Industry-Specific Platforms
TickerMkt capP/EP/E fwdP/SP/S fwdP/GPP/GP fwdEV/EBITDAFCF yld
APPF$8.0B51.1x32.7x7.7x7.1x12.2x11.3x37.4x3.4%
DSGX$7.9B42.2x39.7x10.2x9.5x13.1x12.3x22.3x3.8%
MANH$13.7B67.0x42.9x12.2x11.8x22.3x21.6x46.9x2.9%
BLKB
Blackbaud
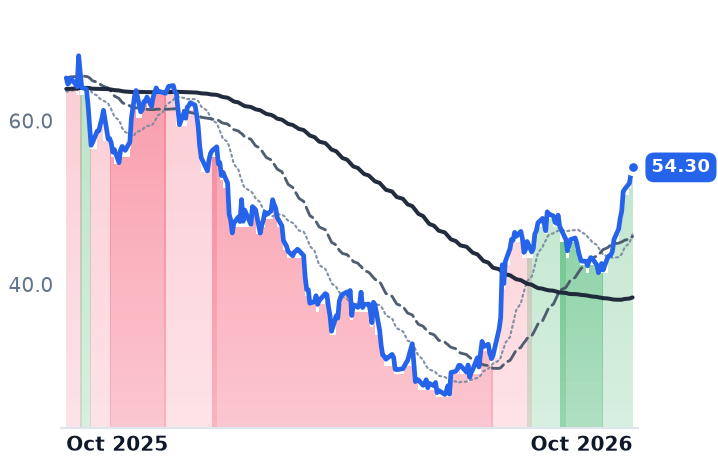
54.30
+0.73 (+1.36%)
vs. prior close
Price20d50d150d
BLKB 12-month price
Industry-Specific Platforms
INTA
Intapp
45.20
+0.42 (+0.94%)
vs. prior close
Price20d50d150d
INTA 12-month price
Sales, Service & Customer Management
DOCU
DocuSign
81.33
+1.05 (+1.31%)
vs. prior close
Price20d50d150d
DOCU 12-month price
Software Development & Design
TickerMkt capP/EP/E fwdP/SP/S fwdP/GPP/GP fwdEV/EBITDAFCF yld
BLKB$2.4B16.5x10.2x2.1x2.1x3.6x3.5x11.1x11.4%
INTA$3.5Bn/m28.2x6.0x5.2x7.9x6.9xn/m4.0%
DOCU$15.2B48.6x17.6x4.5x4.3x5.7x5.4x26.3x7.9%
NOW
ServiceNow
153
+3.69 (+2.46%)
vs. prior close
Price20d50d150d
NOW 12-month price
Sales, Service & Customer Management
BSY
Bentley Systems, Incorporated
38.48
+0.35 (+0.92%)
vs. prior close
Price20d50d150d
BSY 12-month price
Software Development & Design
AGYS
Agilysys
117
+0.77 (+0.66%)
vs. prior close
Price20d50d150d
AGYS 12-month price
Industry-Specific Platforms
TickerMkt capP/EP/E fwdP/SP/S fwdP/GPP/GP fwdEV/EBITDAFCF yld
NOW$158.5B95.2x37.6x10.8x9.8x14.4x13.1x47.1x2.9%
BSY$11.2B42.0x27.5x7.0x6.6x8.6x8.1x25.7x4.4%
AGYS$3.3B76.5x47.7x10.0x8.9x16.0x14.3x49.4x2.4%
ROP
Roper Technologies
398
−0.20 (−0.05%)
vs. prior close
Price20d50d150d
ROP 12-month price
Enterprise Resource Planning
TickerMkt capP/EP/E fwdP/SP/S fwdP/GPP/GP fwdEV/EBITDAFCF yld
ROP$39.3B16.5x17.9x4.8x4.6x6.8x6.6x11.7x6.7%

Consensus projections

TickerFY2026EFY2027EFY2028E
APPFRevenue+18.5%+17.2%+16.9%
EPS+33.9%+22.0%+23.5%
DSGXRevenue+15.0%+12.7%+12.8%
EPS+15.8%+24.8%+15.6%
MANHRevenue+8.3%+8.5%+8.8%
EPS+10.3%+11.7%+15.9%
BLKBRevenue+4.5%+4.6%+3.2%
EPS+18.8%+13.8%−37.2%
INTARevenue+14.7%+14.6%+15.0%
EPS+36.8%+29.9%+22.3%
DOCURevenue+8.4%+9.2%+8.0%
EPS+6.9%+22.1%+12.8%
NOWRevenue+22.4%+18.8%+18.6%
EPS+17.1%+23.2%+21.3%
BSYRevenue+13.6%+10.5%+10.2%
EPS+18.5%+12.4%+16.3%
AGYSRevenue+16.5%+16.6%+16.9%
EPS+26.9%+49.3%+30.3%
ROPRevenue+8.1%+5.9%+5.6%
EPS+11.5%+9.9%+8.5%

Forward fiscal years only. Blank means no analyst coverage for that year.

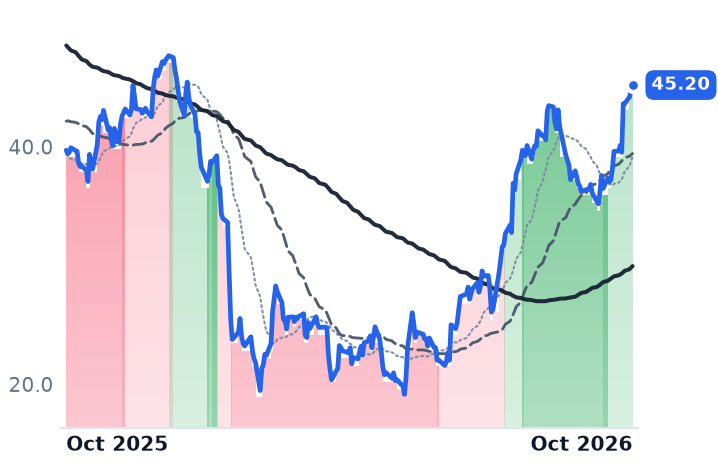
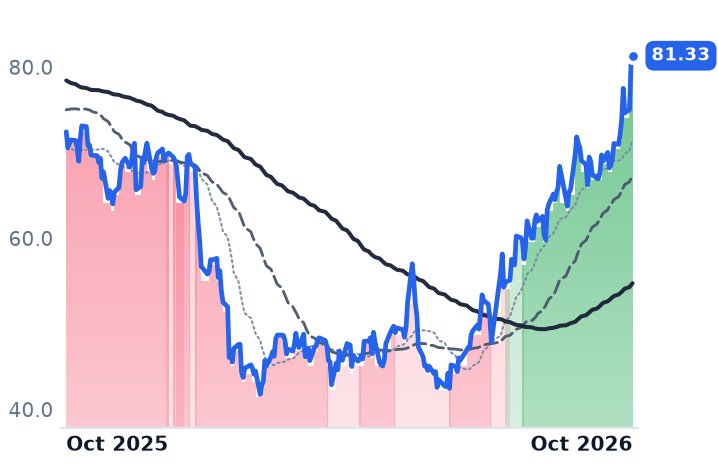
AppFolio sells cloud software to American property managers, and most of what it collects is not a subscription. Of $281.1m in June-quarter revenue, $219.5m came from value-added services — electronic rent payments, FolioScreen tenant screening, FolioGuard risk cover — against $59.8m of core subscription revenue, according to the company's results exhibit. The company reports third-quarter results after the close on Thursday 22 October, with consensus at $1.79 a share on revenue of $294.19m.
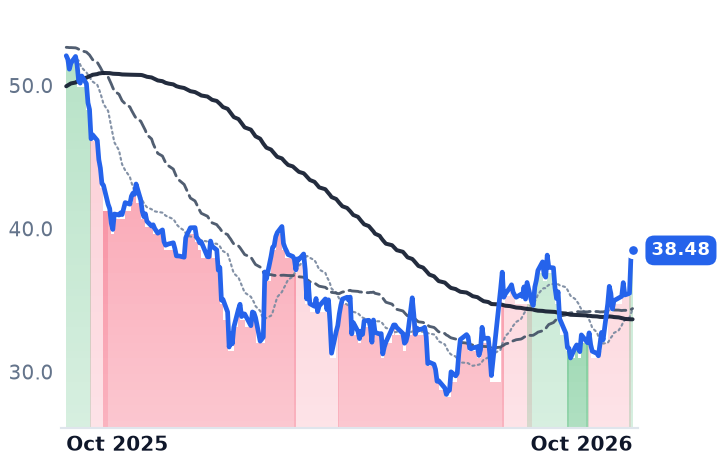
That split matters because the year's de-rating in application software ran on an argument about seats: that artificial-intelligence agents would eat the per-user subscription. The argument has reversed, hard — the software index has risen 21.92% over three months while investors concluded AI is being embedded in existing platforms rather than replacing them. "AI has been more of an enabler for a lot of these software companies, more than a disruptor," Adam Turnquist, chief cross-asset strategist at LPL Financial, said in October. Yet the least seat-dependent name in the specialized enterprise software group is its laggard: AppFolio is up 7.6% over 30 days against the index's near-11% month.

The fee meter runs on move-ins, not rent increases

Value-added services revenue grew 22% year on year to $219m while units under management grew 8% to 9.6 million. More fees are being charged against each unit, because each unit is transacting more payments, screens and policies.

What drives that is tenant turnover rather than rent inflation, and turnover is improving. Year-to-date US multifamily net absorption reached nearly 350,000 units, up 14% year on year, while deliveries fell 25% to just over 250,000, RealPage's analytics unit reported, with effective asking rents up only 0.9% and occupancy at 95.4%. Every one of those leases carries a screening fee and a new payment relationship. On rents themselves the data disagree: Apartments.com puts asking rents up 2.3% to $1,950, a gap that reflects effective-versus-asking methodology. Both describe a recovery from the 2024-25 trough. A rate headwind sits underneath it: the Federal Reserve raised its target range to 3.75-4.00% on 16 September, its first increase in three years, and higher financing costs slow property transactions.

Profit is growing about 60% faster than revenue

June-quarter revenue rose 19.3%, operating margin widened to 18.8% from 17.2%, and operating income rose 30.8%. The deceleration in the top line has been gentle — 21.9%, then 20.4%, then 19.3% — against 19.7% for full-year 2025. The transformation underneath is larger: annual operating margin has gone from -15.3% in 2022 to 16.1% in 2025 on revenue of $950.8m. Full-year 2026 revenue guidance was raised to $1.117-1.127bn with non-GAAP operating margin guided to 26.5-28.0%.

"For the first time, we've crossed $1 billion in revenue on a trailing twelve-month basis, a milestone we believe reflects the success customers are having by adopting our products and services," Shane Trigg, chairman and chief executive, said in prepared remarks on 23 July.

The socket is contested. RealPage and Yardi Systems are both larger by revenue; AppFolio's strength is the mid-market, where more than 10,000 property-management companies use the platform, and third-party share estimates for the category conflict sharply enough to be read only as directional.

The repair trade is mostly done

The group's recovery has tracked the depth of each member's fall rather than how it bills: the deepest drawdowns produced the biggest bounces, and AppFolio's 45.3% decline to a 10 April low was middling, so its 58.8% recovery is too. Its lag is therefore not a verdict on the fee meter. The meter is the part of the story with evidence behind it.
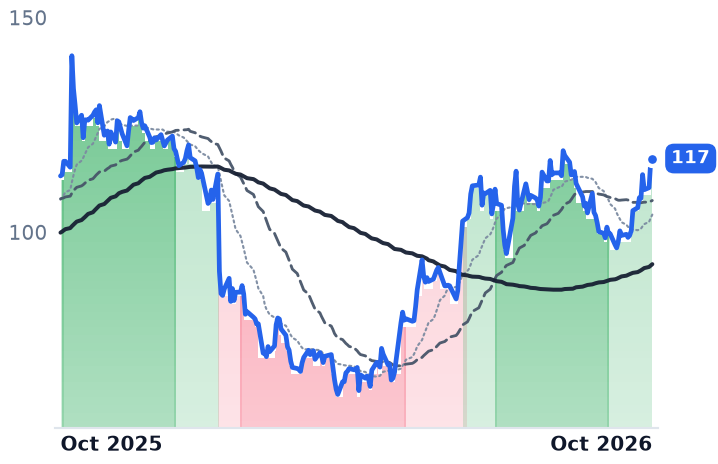
What has gone is the discount. On unchanged consensus earnings of $6.90, the shares implied roughly 20.8x at the April low and about 33.0x now, against 34.8x a year ago — some 95% of the way back, with the price still 5.3% below its year-ago close. That consensus is a non-GAAP line, and the distance is not small: second-quarter non-GAAP earnings were $1.71 a share against $1.17 reported, and KeyCorp models $5.21 for 2026. On forward price to gross profit, where margins spanning 53% to 78% across the group are neutralized, AppFolio stands at 11.3x against Manhattan Associates' 21.6x — the cheaper of the two, on faster growth.
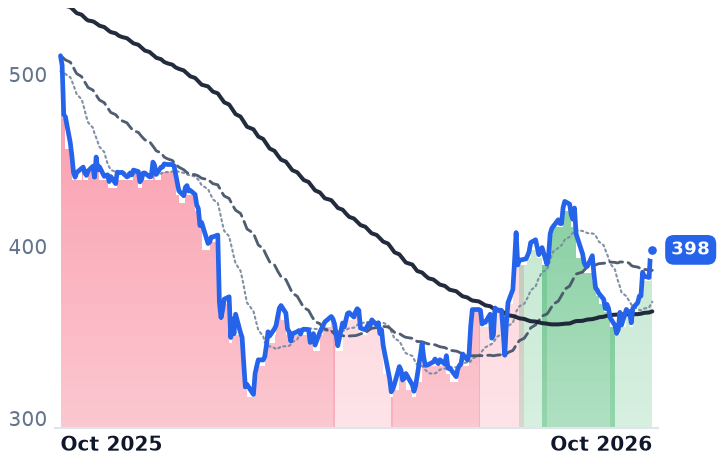
So the business explains the recovery and the multiple explains what is left of it: from here the gains have to be earned by the fee count, not handed back by a reversing discount. Thursday's report is the first read on whether units and transactions per unit are still diverging the right way, and the line to watch is not the rent roll. A transaction meter only spins when somebody moves.

IES Holdings Bolted $1.5bn of Structural Steel Onto Its Record-Margin Electrical Business

Hypothesis Opus 5 · Research Opus 5 · Writing Opus 5 · Prompt v1.7

A month that erased more than a quarter of IES Holdings' market value has been read as the end of the skilled-trade labor scarcity behind contractors' best margins ever. The company's June quarter points the other way: revenue up 39.6% year on year, operating margin wider at 14.37%, and signed backlog up 91% since fiscal year-end.

The one visible margin reset is self-administered. The $691m DBM Global close on 5 October adds structural-steel fabrication revenue to an electrical contractor that just earned a 27.41% gross margin, and the sell-side fiscal-2027 EBITDA margin drops to 12.99% from 16.53%. Comfort Systems is the mirror image: its forward multiple fell to 28.7x while estimates still assume margins widen. APi Group, whose work is mostly recurring inspection, rose over the same month.

IESCFIXAPGEMEPWRMTZDYSTRLMYRGAAONData-Center MEP ContractingStructural Steel FabricationContractor Backlog GrowthData-Center Debt FinancingVertical Integration M&A
TickerCompanySegmentTrend · 13mo30D1Y
The subject · what this brief is about
IESCIESBuilding Systems⚠️ Emerging Bear−28.0%−41.0%
FIXComfort Systems USABuilding Systems⚠️ Emerging Bear−13.8%+70.7%
APGAPiBuilding Systems🔴 Cont. Bear+7.8%+15.8%
Compared against · context, not the story
EMEEMCORPower Grid & Distribution⚠️ Emerging Bear−7.9%+1.4%
PWRQuanta ServicesPower Grid & Distribution🟢 Cont. Bull−5.4%+38.8%
MTZMasTecEnergy Solutions⚠️ Emerging Bear−16.9%−10.9%
DYDycom IndustriesDigital & Communications⚠️ Emerging Bear−17.8%−17.0%
STRLSterling InfrastructureCivil Infrastructure⚠️ Emerging Bear−19.6%+13.6%
MYRGMYRPower Grid & Distribution⚠️ Emerging Bear−2.6%+32.7%
AAONAAONHVAC & Refrigeration Systems⚠️ Emerging Bear−3.9%−27.9%

12-month price & trend

IESC
IES
234
−7.24 (−3.00%)
vs. prior close
Price20d50d150d
IESC 12-month price
Building Systems
FIX
Comfort Systems USA
1,414
+16.64 (+1.19%)
vs. prior close
Price20d50d150d
FIX 12-month price
Building Systems
APG
APi
40.48
+0.49 (+1.23%)
vs. prior close
Price20d50d150d
APG 12-month price
Building Systems
TickerMkt capP/EP/E fwdP/SP/S fwdP/GPP/GP fwdEV/EBITDAFCF yld
IESC$9.5B20.6x17.4x2.4x1.5x9.2x5.8x15.5x2.4%
FIX$49.5B34.6x28.7x4.4x3.8x17.2x14.8x24.1x4.4%
APG$17.4Bn/m23.3x2.1x1.9x7.1x6.6x22.8x3.9%
EME
EMCOR
699
−3.41 (−0.49%)
vs. prior close
Price20d50d150d
EME 12-month price
Power Grid & Distribution
PWR
Quanta Services
607
+10.82 (+1.82%)
vs. prior close
Price20d50d150d
PWR 12-month price
Power Grid & Distribution
MTZ
MasTec
185
−2.83 (−1.51%)
vs. prior close
Price20d50d150d
MTZ 12-month price
Energy Solutions
TickerMkt capP/EP/E fwdP/SP/S fwdP/GPP/GP fwdEV/EBITDAFCF yld
EME$34.8B24.6x24.0x1.9x1.7x9.5x8.7x15.3x3.4%
PWR$101.7B76.5x40.4x3.1x2.6x21.5x17.8x35.5x2.4%
MTZ$17.3B34.0x23.2x1.1x1.0x9.4x8.3x15.4x1.4%
DY
Dycom Industries
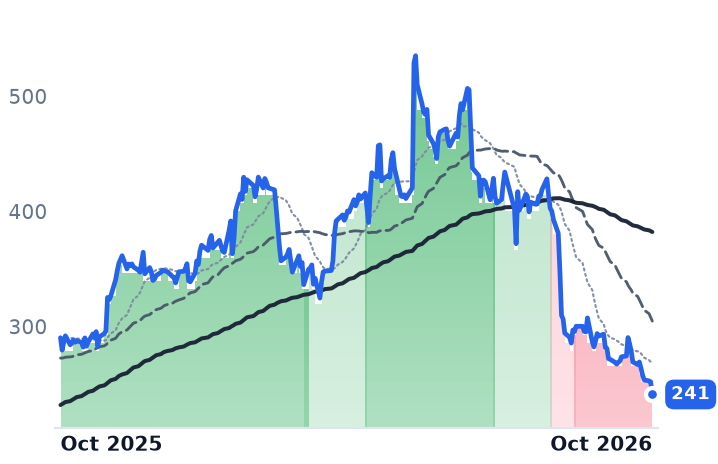
241
−10.99 (−4.36%)
vs. prior close
Price20d50d150d
DY 12-month price
Digital & Communications
STRL
Sterling Infrastructure
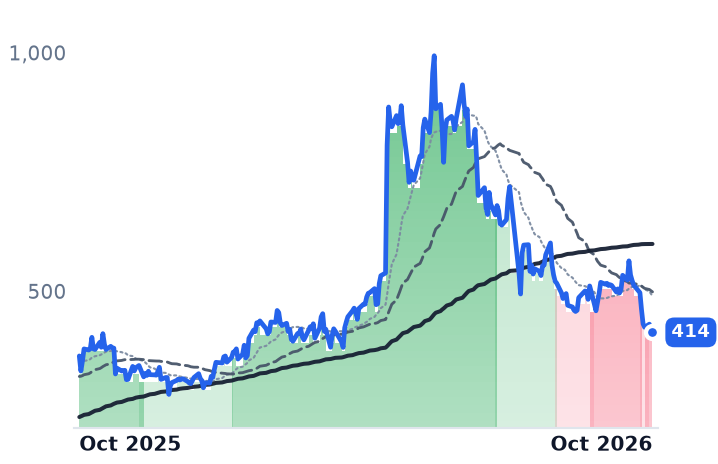
414
+1.52 (+0.37%)
vs. prior close
Price20d50d150d
STRL 12-month price
Civil Infrastructure
MYRG
MYR
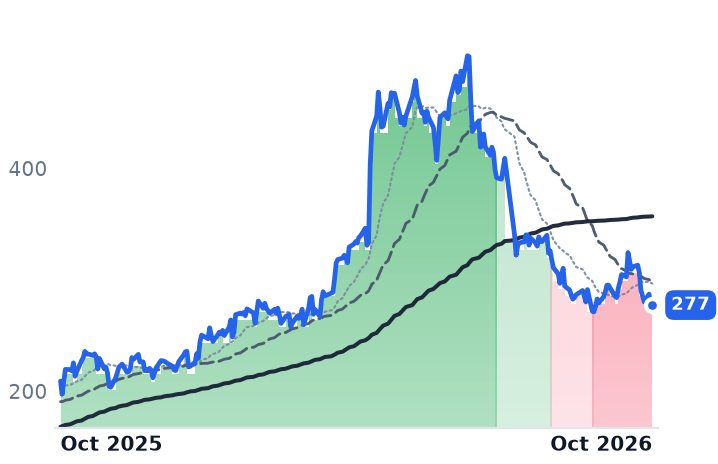
277
+2.54 (+0.92%)
vs. prior close
Price20d50d150d
MYRG 12-month price
Power Grid & Distribution
TickerMkt capP/EP/E fwdP/SP/S fwdP/GPP/GP fwdEV/EBITDAFCF yld
DY$8.1B24.3x15.8x1.2x1.1x6.2x5.6x9.2x5.8%
STRL$16.4B38.0x26.9x4.8x4.0x20.2x17.0x22.6x2.9%
MYRG$4.7B28.7x25.0x1.2x1.1x9.6x8.7x15.8x4.1%
AAON
AAON
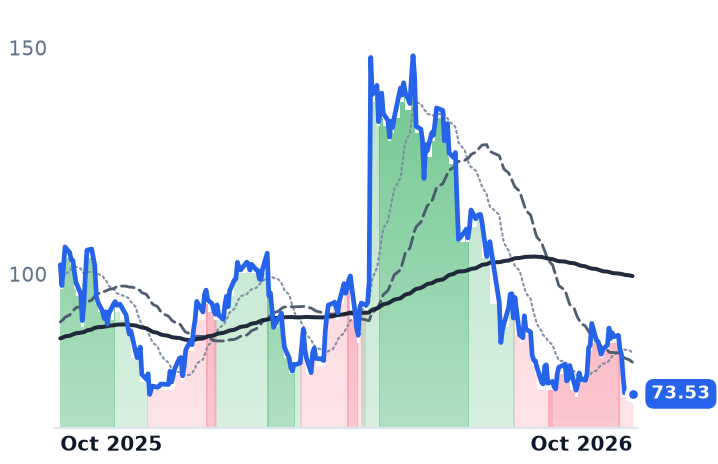
73.53
−0.39 (−0.53%)
vs. prior close
Price20d50d150d
AAON 12-month price
HVAC & Refrigeration Systems
TickerMkt capP/EP/E fwdP/SP/S fwdP/GPP/GP fwdEV/EBITDAFCF yld
AAON$7.1B44.4x36.2x3.7x3.1x14.3x12.0x25.2x-1.7%

Consensus projections

TickerFY2026EFY2027EFY2028E
IESCRevenue+27.7%+48.1%+18.8%
EPS+76.1%+16.8%+17.2%
FIXRevenue+47.8%+19.0%+17.3%
EPS+86.8%+22.8%+23.5%
APGRevenue+14.1%+7.9%+7.0%
EPS+19.7%+15.0%+13.5%
EMERevenue+21.4%+10.9%+8.3%
EPS+30.1%+13.0%+13.2%
PWRRevenue+41.1%+16.2%+13.8%
EPS+57.6%+17.8%+17.9%
MTZRevenue+29.2%+18.9%+15.4%
EPS+44.9%+34.5%+31.0%
DYRevenue+17.1%+39.6%+12.7%
EPS+39.5%+51.2%+19.7%
STRLRevenue+71.5%+21.2%+17.3%
EPS+91.2%+28.0%+20.6%
MYRGRevenue+22.9%+15.5%+11.4%
EPS+72.5%+18.4%+22.2%
AAONRevenue+65.6%+17.6%+16.3%
EPS+68.8%+51.4%+26.3%

Forward fiscal years only. Blank means no analyst coverage for that year.

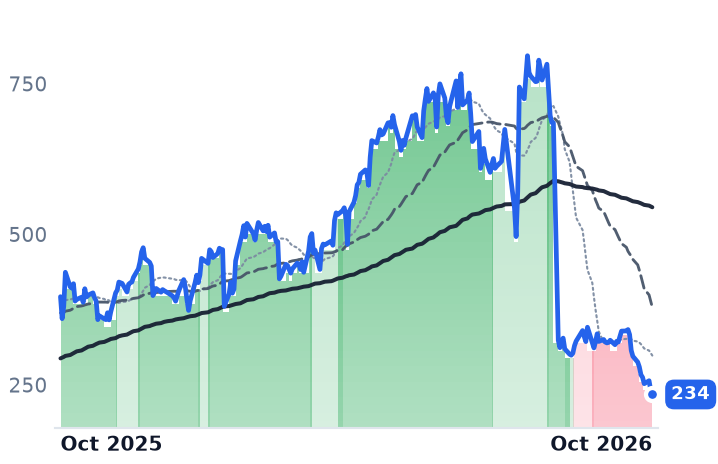
IES Holdings completed the largest acquisition in its history on 5 October, paying about $691m for DBM Global, a vertically integrated structural-steel fabrication, erection and industrial construction platform. The Houston electrical and technology-systems contractor buying it had just reported a record gross margin of 27.41%. DBM booked roughly $1.5bn of revenue in the twelve months to 30 June. From 6 October to 21 October, IES shares fell 31.5%, including a 9.7% drop on 7 October.

That markdown has been read as the end of the skilled-trade labor scarcity that let mechanical and electrical contractors price data-center work at the widest margins in their history. The operating numbers do not support that reading. June-quarter revenue of $1.24bn grew 39.6% year on year, operating margin widened to 14.37% from 12.57%, and non-GAAP backlog reached roughly $4.5bn, up 91% since fiscal year-end, with $2.289bn of the $2.8bn in signed performance obligations expected to convert to revenue inside twelve months.

The margin reset IES wrote itself

The one place a margin reset appears is the forward estimate, and the company put it there. Consensus has fiscal-2027 revenue growing 48.1% to $6.275bn while EBITDA margin falls to 12.99% from 16.53% and net margin to 8.69% from 11.03%, so earnings per share advance only 16.8%. Structural-steel fabrication does not earn what integrated electrical installation earns, and adding $1.5bn of it to a business running at a 27.41% gross margin changes the blend. That consensus rests on a single analyst, so the level is indicative.

IES was explicit about the trade. "As our largest acquisition to date, we were deliberate in how we financed the transaction, with a focus on maintaining our strong balance sheet by using a combination of cash, borrowings and IES equity," executive chairman Jeff Gendell said on 5 October. Chief executive Matt Simmes framed the roughly 4,000 incoming employees as a cross-sell into "data center, industrial and infrastructure markets."

At 20.6x trailing and 17.4x forward earnings, IES is the cheapest of the three Building Systems names on both measures. That discount now sits against a forecast that already assumes a thinner blend.

Comfort Systems' estimates never followed its multiple

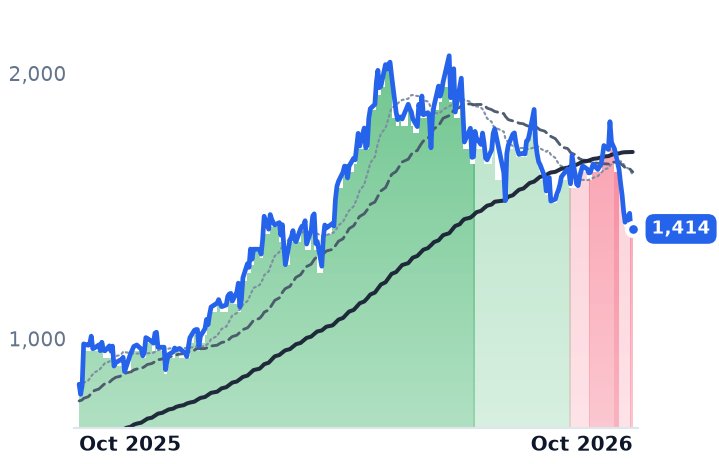
Comfort Systems USA, which installs and maintains heating, ventilation, piping, controls and electrical systems and fabricates modules off site, is the opposite arrangement. Its June quarter was a fifth consecutive period of gross-margin expansion, to 25.88%, on revenue up 50.3%, with backlog of $14.06bn and $13.70bn of that on a same-store basis — meaning the increase was overwhelmingly organic. "Demand remains strong, especially in technology, as we continue to book work with good margins and favorable working conditions for our valuable people," chief executive Brian Lane said on 23 July.

Shares are down 20.3% over three months and 31.6% below their June peak. The fiscal-2027 consensus still embeds an EBITDA margin of 17.58%, rising to 18.31% the year after. The forward multiple has gone to 28.7x from the 36x to 46x recorded in early May; the margin assumption inside the estimate has not moved.

What tightened in October was the financing for the jobs

The change sits outside both income statements. Yields on CoreWeave's unsecured notes flared to 15% and beyond as data-center bonds hit fresh lows. Nvidia-backed Firmus, Blackstone-backed AirTrunk and SB Energy, owned by SoftBank, all shelved or paused listings, and South Korean cloud company Elice fell 30% on its market debut on 20 October. Of roughly 140 US data-center projects slated to open in 2026, nearly half have been delayed or cancelled, with power infrastructure and parts availability the binding constraints.

That is a timing problem for signed work, not a pricing problem for new bids, and it discounts a backlog by pushing out when it converts. The rest of the data-center builders were priced the same way: MasTec fell 47.5% over three months, Dycom 43.1% and Sterling Infrastructure 40.4%, while the two largest, EMCOR and Quanta, fell 8.1% and 5.1%.

APi Group, the fire-protection and entry-systems contractor that targets more than 60% of revenue from inspection, service and monitoring, guided third-quarter organic growth of 8% to 10% and rose 7.8% over the past 30 days. Recurring inspection revenue carries no pad date to slip, which is why a single "Building Systems" label describes no shared operating trend here.

So the drawdown accounts for the duration of these order books and almost nothing about their profitability. At IES the thinner forward margin is disclosed, bought and dated; at Comfort Systems no one has marked the margin down anywhere except the share price.

Comfort Systems reports its September quarter after the close on 22 October. The gross-margin line will say whether the labor-pricing cycle broke in the third quarter, or whether the market simply decided it must have.

Evercore's Record First Half Was Paid on Deals Signed Before Global Dealmaking Stalled

Hypothesis Opus 5 · Research Opus 5 · Writing Opus 5 · Prompt v1.7

An independent adviser collects almost nothing when a merger is signed and nearly everything when it closes, so the fee line reports the past and the de-rating is a bet on the closing calendar. Evercore's June-quarter advisory fees rose 11% year on year, with year-to-date advisory fees up 61%, and its compensation ratio improved to 64.8% from 65.8% — the opposite of a firm whose hiring outran its revenue. Moelis's revenue rose 12% with an announced pipeline up more than 80%.

Then announced global M&A fell 41% in the third quarter to $993bn, the first quarter under $1tn since mid-2025. Evercore and Moelis have de-rated into 13.3x and 18.2x trailing earnings against roughly 23x each a year ago. Lazard is the exception: its advisory revenue actually fell 9%, and asset management carried the half.

EVRLAZMCPJTHLIJEFGSM&A Advisory CycleIndependent Advisory BoutiquesDeal Backlog ConversionCompensation RatiosLeveraged Finance Costs
TickerCompanySegmentTrend · 13mo30D1Y
The subject · what this brief is about
EVREvercoreInvestment Banking⚠️ Emerging Bear−5.9%−20.8%
LAZLazardInvestment Banking🔴 Cont. Bear−6.7%−25.4%
MCMoelisInvestment Banking⚠️ Emerging Bear−9.9%−17.5%
Compared against · context, not the story
PJTPJT PartnersM&A & Restructuring Advisory🌱 Emerging Bull−12.7%−22.8%
HLIHoulihan LokeyM&A & Restructuring Advisory🔴 Cont. Bear−4.7%−33.4%
JEFJefferies FinancialInvestment Banking🌱 Emerging Bull−9.4%−17.8%
GSThe Goldman SachsInvestment Banking🟢 Cont. Bull−9.7%+16.0%

12-month price & trend

EVR
Evercore
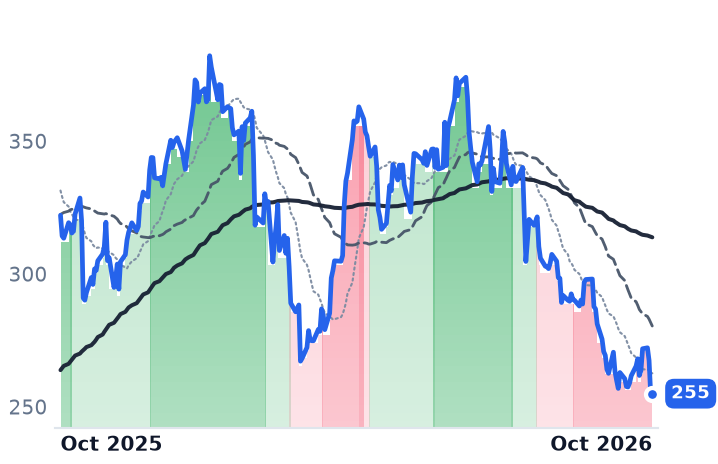
255
+0.30 (+0.12%)
vs. prior close
Price20d50d150d
EVR 12-month price
Investment Banking
LAZ
Lazard
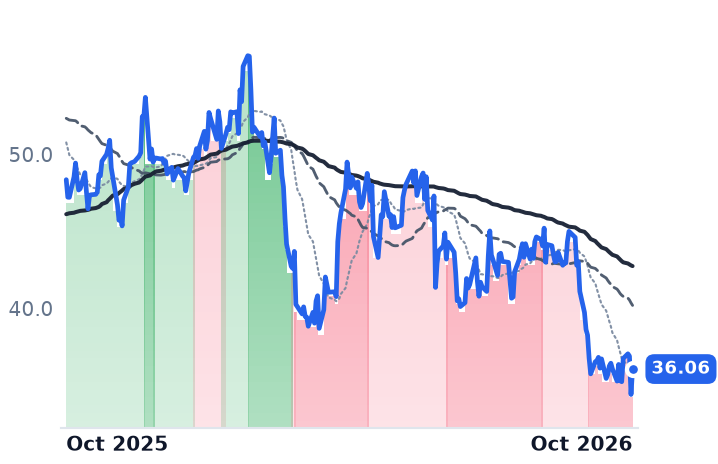
36.06
+1.65 (+4.80%)
vs. prior close
Price20d50d150d
LAZ 12-month price
Investment Banking
MC
Moelis
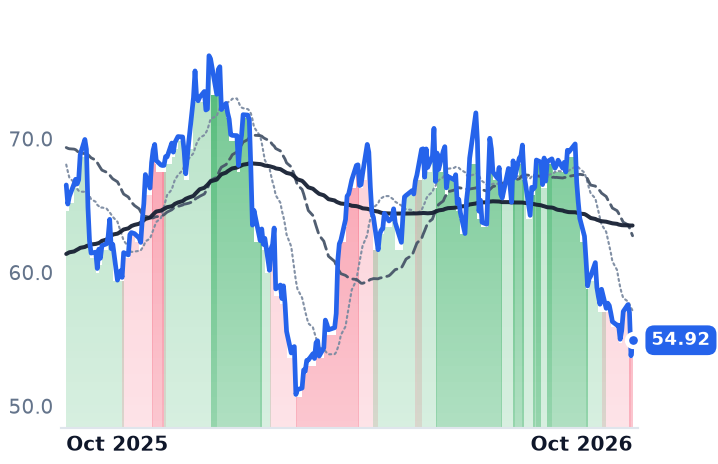
54.92
+1.17 (+2.17%)
vs. prior close
Price20d50d150d
MC 12-month price
Investment Banking
TickerMkt capP/EP/E fwdP/SP/S fwdP/GPP/GP fwdEV/EBITDAFCF yld
EVR$9.9B13.3x14.2x2.1x2.1x2.1x2.2x9.2x16.5%
LAZ$4.1B15.9x17.7x1.2x1.2x2.6x2.6x12.5x17.2%
MC$4.1B18.2x18.3x2.6x2.4x3.7x3.4x13.2x10.7%
PJT
PJT Partners
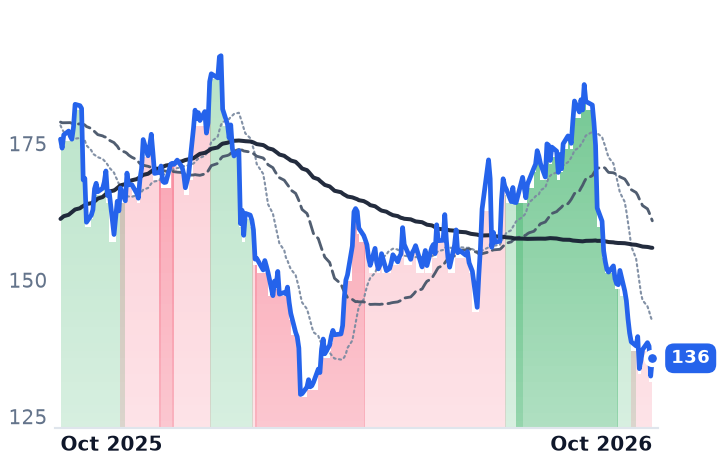
136
+3.26 (+2.46%)
vs. prior close
Price20d50d150d
PJT 12-month price
M&A & Restructuring Advisory
HLI
Houlihan Lokey
128
+3.19 (+2.57%)
vs. prior close
Price20d50d150d
HLI 12-month price
M&A & Restructuring Advisory
JEF
Jefferies Financial
44.23
+0.40 (+0.90%)
vs. prior close
Price20d50d150d
JEF 12-month price
Investment Banking
TickerMkt capP/EP/E fwdP/SP/S fwdP/GPP/GP fwdEV/EBITDAFCF yld
PJT$4.1B17.9x20.1x2.2x2.1x3.4x3.2x10.0x16.1%
HLI$9.1B21.4x18.8x3.6x3.5x7.1x6.8x14.9x5.3%
JEF$8.3B11.2x12.0x0.7x1.0x1.0x1.3x7.3x50.5%
GS
The Goldman Sachs
882
+9.48 (+1.09%)
vs. prior close
Price20d50d150d
GS 12-month price
Investment Banking
TickerMkt capP/EP/E fwdP/SP/S fwdP/GPP/GP fwdEV/EBITDAFCF yld
GS$306.6B15.8x14.9x2.6x4.3x4.5x7.5x27.4x-13.5%

Consensus projections

TickerFY2026EFY2027EFY2028E
EVRRevenue+25.1%+14.6%+5.8%
EPS+34.6%+17.3%+10.2%
LAZRevenue+12.3%+17.8%+6.2%
EPS−12.9%+74.8%+17.4%
MCRevenue+14.9%+17.4%+7.2%
EPS+9.7%+28.3%+5.1%
PJTRevenue+14.4%+10.6%+4.4%
EPS+18.2%+13.4%+10.4%
HLIRevenue+13.2%−1.2%+18.7%
EPS+28.7%−9.9%+25.2%
JEFRevenue+17.3%+8.8%+7.2%
EPS+24.9%+27.7%+15.6%
GSRevenue+20.6%+2.7%+1.8%
EPS+42.8%+4.7%+5.3%

Forward fiscal years only. Blank means no analyst coverage for that year.

An independent adviser's revenue line cannot say whether the merger cycle got better or worse, because the money lands on the day a transaction closes. Evercore, which sells strategic advice on mergers, defenses, restructurings and capital raising and runs a smaller wealth and asset-management arm, reported record first-half net revenues of $2.4bn, up 56%. Those fees belong to a deal book assembled earlier. The quarter that followed is the one the market is now pricing.

Global M&A announced in the third quarter totaled $993bn, down 41% from the prior quarter and the first sub-$1tn quarter since the second quarter of 2025, with only 10 deals above $10bn, as rising borrowing costs stalled buyers. Year to date, worldwide volume is still up 28% at $3.9tn. The advisory shelf was read through the summer as proof the cycle was intact, because reported fees kept setting records. Those records are a closing calendar, and the calendar that fills 2027 stopped growing in a single quarter.

The clearest proof is in a bank that barely does advisory

Goldman Sachs's advisory revenues set an all-time quarterly record of $1.654bn on closing more deals in that same September quarter. Advisory was 8.9% of its $18.68bn of third-quarter net revenues, a side business at a trading and financing house; what carries here is the direction. A fee line based on completions hit a record while the activity measure based on announcements fell by two-fifths.

Evercore hired ahead of its fees and still paid out less

Evercore's second-quarter advisory fees rose $77.9m, or 11%, year on year, with year-to-date advisory fees up 61%, on record quarterly revenue of $1.0bn. Compensation, the expense a firm sets after it already knows its revenue, took 64.8% of net revenues against 65.8% a year earlier. Adjusted non-compensation expenses ran at a 17.5% ratio in the quarter, leaving roughly 18 points of operating margin.

Capacity is a headcount. Investment-banking senior managing directors rose to 188 at June 30 from 159 a year earlier; dividing first-half net revenues by those counts gives $12.76m a head against $9.67m. Nineteen new senior managing directors joined year to date and more than 50 are still ramping their practices, with guaranteed pay landing before their fees do.

"The timing of backlog conversion into revenue can vary from quarter-to-quarter, and it is best to evaluate our business on a longer-term basis," chairman and chief executive John Weinberg said on the July 29 call, with backlogs described as near-record.

Moelis pays out more than it earned

Moelis & Company, a pure advisory firm with no asset management and no balance sheet, grew June-quarter revenue 12% to $409.4m and cut its compensation ratio to 65.8% from 69.0%. Its announced pipeline was up more than 80% year on year, a record total pipeline, with liability management dominating activity as lenders turn selective. The $0.65 quarterly dividend exceeds the $1.10 of first-half GAAP diluted earnings against $1.30 declared, so an interrupted closing calendar hits the distribution, not a securities book.

Lazard's advisory fell while its fee on assets did not

Lazard, which pairs advisory with an asset manager, is the one name where the de-rating matches the accounts. Financial Advisory net revenue fell 9% to $450m in the quarter it achieved its strongest announced league-table position since 2014, while Asset Management revenue rose 20% on average assets under management of $279bn, up 17%, with the best first-half net inflows in nearly two decades. Consolidated operating margin fell to 4.5% from 11.5%. Lazard trades at 15.9x trailing earnings but 17.7x forward, because consensus for this year, $2.05 a share, sits below last year's actual $2.17.

So one of the three sets of accounts explains its own share price.

What the markdown is actually underwriting

Evercore has fallen 27.9% over three months, Moelis 21.6% and Lazard 19.9%, alongside PJT's 19.5%, Jefferies' 22.6% and Houlihan Lokey's 10.8%; Evercore left its uptrend in mid-July and Moelis only in mid-September, while Lazard was already weak in June. Over twelve months Goldman is up 15.3% and Morgan Stanley 18.3%, and the advisory-pure names all lost ground. On October 14 both boutiques fell about 4% after bank commentary on rate uncertainty dampening client activity, with no company news attached.

The reported results explain none of the Evercore and Moelis declines and most of Lazard's. Evercore sits at 13.3x trailing earnings and a 16.5% free-cash yield against roughly 23x on last year's earnings a year ago; Moelis at 18.2x from roughly 23x. Both carry forward multiples at or above trailing, meaning consensus already assumes earnings stop rising. What the price is paying for is the conversion rate: how much of a record announced book survives financing costs to reach a closing date. Credit itself is not signalling trouble, with high-yield spreads around 3.16% in mid-October, which is why restructuring here is a retainer business rather than a boom.

Lazard reports on October 22, Evercore and Moelis on October 28. Those are the first statements that contain the quarter in which the signing stopped, and a fee recognized at closing will take longer than one print to tell anyone whether it mattered.

Equinix and Digital Realty Both Accelerated Into a Selloff That Hit Every Kind of REIT

Hypothesis Opus 5 · Research Opus 5 · Writing Opus 5 · Prompt v1.7

The shelf these two landlords sit on is labelled as weakening data-center demand. Their June quarters say the opposite. Equinix's revenue growth went from 9.8% to 16.4% year on year between the March and June quarters, and Digital Realty signed more than $261m of renewals at cash re-leasing spreads above 25%, with hyperscale renewals above one megawatt repricing 66.7% higher.

What moved was the discount rate. The 10-year Treasury yield rose from 4.68% in mid-August to 5.28% on 2 October, and the median share price across 158 listed real estate investment trusts fell about a tenth. Equinix's price-to-gross-profit has compressed to 19.1x from 21.6x in May.

Two qualifiers belong in the record: Equinix's interconnection revenue grew only 9%, slower than its rent, and $0.52 of Digital Realty's $2.65 of Core funds from operations per share was joint-venture promote income rather than rent.

EQIXDLROPLDVICISBACSPYHyperscale Lease RepricingRising Treasury YieldsInterconnection EconomicsDebt-Funded CapexAI Infrastructure Buildout
TickerCompanySegmentTrend · 13mo30D1Y
The subject · what this brief is about
EQIXEquinixData Center Operators🟢 Cont. Bull−1.4%+22.1%
DLRDigital Realty TrustData Center Operators🟢 Cont. Bull−3.7%+0.0%
Compared against · context, not the story
ORealty IncomeSingle-Tenant Net Lease⚠️ Emerging Bear−4.8%−3.0%
PLDPrologisIndustrial Logistics⚠️ Emerging Bear−5.9%+5.8%
VICIVICI PropertiesGaming & Hospitality🔴 Cont. Bear−4.9%−22.3%
SBACSBA CommunicationsTower & Fiber Infrastructure🔴 Cont. Bear+0.8%−3.9%
SPYState Street SPDR S&P 500 ETF TrustAsset Management🟢 Cont. Bull+1.6%+16.4%

12-month price & trend

EQIX
Equinix
993
−9.04 (−0.90%)
vs. prior close
Price20d50d150d
EQIX 12-month price
Data Center Operators
DLR
Digital Realty Trust
173
−1.90 (−1.09%)
vs. prior close
Price20d50d150d
DLR 12-month price
Data Center Operators
O
Realty Income
55.90
+0.55 (+0.99%)
vs. prior close
Price20d50d150d
O 12-month price
Single-Tenant Net Lease
TickerMkt capP/EP/E fwdP/SP/S fwdP/GPP/GP fwdEV/EBITDAFCF yld
EQIX$97.0B63.1x57.2x9.9x9.4x19.1x18.3x26.6x1.4%
DLR$63.6B79.0x62.4x9.3x8.9x67.5x64.9x23.5x2.1%
O$52.2B40.3x36.3x8.8x9.2x12.8x13.4x12.2x4.2%
PLD
Prologis
128
−4.87 (−3.67%)
vs. prior close
Price20d50d150d
PLD 12-month price
Industrial Logistics
VICI
VICI Properties
23.55
+0.60 (+2.61%)
vs. prior close
Price20d50d150d
VICI 12-month price
Gaming & Hospitality
SBAC
SBA Communications
185
+6.18 (+3.46%)
vs. prior close
Price20d50d150d
SBAC 12-month price
Tower & Fiber Infrastructure
TickerMkt capP/EP/E fwdP/SP/S fwdP/GPP/GP fwdEV/EBITDAFCF yld
PLD$120.4B28.7x35.1x13.1x14.0x45.1x48.1x18.6x4.4%
VICI$25.3B8.9x8.3x6.2x6.0x6.2x6.1x11.7x10.4%
SBAC$19.4B19.6x23.7x6.7x6.8x10.6x10.6x17.0x5.4%
SPY
State Street SPDR S&P 500 ETF Trust
770
−0.22 (−0.03%)
vs. prior close
Price20d50d150d
SPY 12-month price
Asset Management
TickerMkt capP/EP/E fwdP/SP/S fwdP/GPP/GP fwdEV/EBITDAFCF yld
SPY$773.0B————————

Consensus projections

TickerFY2026EFY2027EFY2028E
EQIXRevenue+11.1%+10.8%+11.6%
EPS+16.6%+10.4%+10.1%
DLRRevenue+17.5%+11.0%+14.4%
EPS−25.0%−6.2%+24.6%
ORevenue+7.4%+4.9%+9.9%
EPS+26.1%+10.1%−2.4%
PLDRevenue+5.6%+9.4%+7.5%
EPS+33.6%−5.2%+13.2%
VICIRevenue+5.2%+3.5%+2.8%
EPS+0.5%+7.7%+3.1%
SBACRevenue+1.5%+2.5%+3.6%
EPS−21.8%+8.2%+10.1%

Forward fiscal years only. Blank means no analyst coverage for that year.

Equinix raised both its 2026 guidance and its long-term outlook when it reported the June quarter on 29 July, and its shares have drifted lower ever since. Digital Realty had done the same thing six days earlier, on the back of a record backlog of leases signed but not yet billing.

The slide in listed data-center shares through the autumn has been read as the AI leasing cycle cracking. At these two names it cannot be: neither has disclosed an operational number since July. Equinix's third-quarter call is scheduled for 28 October and Digital Realty releases on 29 October. What the last filed quarters show is acceleration on both sides.

Cabinets and kilowatts, billed monthly

Equinix is a specialty real estate investment trust with 273 colocation facilities in 36 countries, renting cabinet space and billable power to more than 10,000 customers and charging separately for the cross-connects between them. Its revenue line is structurally late: it bills recurring rent on capacity already installed, while the growth investors are pricing sits in leases signed and not yet commenced. The line accelerated anyway, from 9.8% year-on-year growth in the March quarter to 16.4% in June, against 5.2% in the September 2025 quarter. Operating margin went from 21.9% to 25.3% over the year, with operating income rising more than twice as fast as sales. Adjusted funds from operations reached $11.78 a share, up 18% normalized and in constant currency, and annualized gross bookings of $424m were the second-highest the company has recorded.

"The AI-driven infrastructure cycle continues to accelerate, and it's playing directly to our strengths," chief executive Adaire Fox-Martin told investors on the 29 July call. "Demand for neutral, interconnected, sovereign infrastructure is compounding across our business."

One meter dissents. Interconnection — the near-pure-margin annuity of cross-connects between tenants already in the building, and the quantified basis of the moat at over 500,000 live connections — brought in $453m in the quarter, up 9%, roughly 17% of revenue. That is slower than monthly recurring revenue at 11% and slower than the rent, even with a record 9,700 net interconnections added. Monthly recurring revenue per cabinet was $2,538 and churn ran at 1.8%, below the company's usual 2.0%-2.5%, though management attributed part of that to delayed churn and renewal timing.

The cost-of-capital link is explicit. Equinix lifted 2026 capital spending to $5bn-$6bn from $3bn-$4bn and guided $5bn-$7bn a year through 2029 across 52 projects, to be funded with debt: $8bn refinanced plus $8bn incremental, with average cost of debt expected to rise to about 4.9% from 3.4%. Shares at 19.1x trailing gross profit compare with 21.6x in May.

A quarter of Digital Realty's earnings was not rent

Digital Realty operates 309 data centers, 89 of them held through unconsolidated joint ventures, with about 3.0 gigawatts in service and selling wholesale multi-megawatt blocks to hyperscalers. Its backlog of signed-but-uncommenced leases hit $1.9bn at 100% share, close to 30% of in-place data-center revenue. Renewals priced up where the bear case said they would price down: above-one-megawatt hyperscale renewals, 44% of the $261m signed, repriced 66.7% higher on a cash basis. The development pipeline doubled in the first half to 1.4 gigawatts and $20bn of cost, 63% pre-leased at an expected 11.5% stabilized yield.

Two caveats travel with it. Roughly $0.52 of the $2.65 of Core funds from operations per share was $188m of net promote income on three data centers inside a development venture; stripped out, the figure is $2.13, up 14%. And the concentration is literal: two US hyperscale leases signed after the quarter closed carry about $410m of annualized rent at 100% share, while the largest single customer is 10.8% of annualized recurring revenue. Price-to-sales has compressed to 9.29x from 11.14x in May.

Bank of America had already cut the stock to Neutral, target $170 from $210, arguing the company "hasn't participated in AI-related demand at the level we anticipated" while keeping a Buy on Equinix; it reaffirmed that Neutral on 8 January, which makes the call context for the six-month fade rather than the trigger for October.

The repricing came from the bond market

Neither share price has crashed. Equinix is down 1.4% over thirty days and up 20.7% over twelve months; Digital Realty is down 3.7% and 1.4%. Over six months Equinix fell 5.7% and Digital Realty 11.8%, against Realty Income down 12.6%, Prologis 8.5% and VICI Properties 16.3%, while the S&P 500 tracker rose 10.0%. Across the same stretch the 10-year Treasury yield went from 4.68% in mid-August to 5.28% on 2 October and the median share price of 158 REITs fell 9.9%.

So the operating results account for none of the de-rating, and the likelier reading is a discount rate repricing contracted rent, with two aggravators: new listed data-center equity competing for the same allocation after Blackstone's infrastructure trust listed in May and Brookfield's Csquare floated in July, and a worry set of permitting moratoriums, tenant concentration and refinancing risk. The sensitivities differ by name. Equinix's is arithmetic on a debt-funded build program whose interest bill is set by the same yield that sets its multiple. Digital Realty's is composition — a slab of fee and promote economics plus a rent roll where one signature moves a quarter. "I'm not suggesting today is an end-of-the-world storm or anything like that," chief executive Andrew Power told CNBC on 15 September, adding that demand in his markets "has been outpacing supply now for several years."

The tenants' own books show where the money has gone and why none of it is visible yet in a landlord's revenue. Microsoft now carries $329.1bn of lease commitments that have not commenced — rent contracted, buildings unfinished, and nobody's income statement any the wiser until the meters are switched on.

ResMed's Masks Grew 13% Last Year, Faster Than the Machines That Need Them

Hypothesis Opus 5 · Research Opus 5 · Writing Opus 5 · Prompt v1.7

ResMed's advance since the start of October came with no company news attached to it: health care led a defensive rotation out of technology, and the forward earnings multiple expanded from roughly 18.1x to 19.9x on an unchanged fiscal 2027 consensus of $12.10 a share. The quarter the company last reported went the other way.

Mask and accessory revenue reached $2.085bn in the year to 30 June 2026, up 13%, while June-quarter reported gross margin fell to 58.8% from 60.8% and reported operating income declined 1.3%. Growth is coming from the consumable reorder, not from flow generators, life support or the software book being sold.

Inspire Medical, treating the same disease with a one-time implant, is the opposite architecture: revenue fell 7.6% last quarter, and the new surgical billing codes it won do not take effect until 2028.

RMDINSPConsumable Resupply AnnuityGLP-1 Patient SpilloverDefensive Healthcare RotationMedical Device MarginsHealth IT Divestiture
TickerCompanySegmentTrend · 13mo30D1Y
RMDResMedRespiratory Equipment & Supplies🌱 Emerging Bull+4.9%−10.0%
INSPInspire Medical SystemsNeural Implants & Surgical Robotics🌱 Emerging Bull−7.5%−12.5%

12-month price & trend

RMD
ResMed
241
+6.99 (+2.99%)
vs. prior close
Price20d50d150d
RMD 12-month price
Respiratory Equipment & Supplies
INSP
Inspire Medical Systems
69.01
+0.82 (+1.20%)
vs. prior close
Price20d50d150d
INSP 12-month price
Neural Implants & Surgical Robotics
TickerMkt capP/EP/E fwdP/SP/S fwdP/GPP/GP fwdEV/EBITDAFCF yld
RMD$33.9B23.1x19.9x6.0x5.8x9.8x9.5x15.4x8.5%
INSP$2.0B14.8x55.7x2.2x2.3x2.6x2.7x22.8x5.9%

Consensus projections

TickerFY2026EFY2027EFY2028E
RMDRevenue+10.2%+2.9%+6.4%
EPS+17.0%+8.7%+10.0%
INSPRevenue−6.0%+3.9%+6.5%
EPS−26.4%+18.9%+29.5%

Forward fiscal years only. Blank means no analyst coverage for that year.

Mask and accessory sales at ResMed, which sells flow generators, masks and headgear for sleep apnoea through sleep clinics and home-care dealers in roughly 140 countries, reached $2.085bn in the year to 30 June 2026, up 13% from $1.840bn. Group revenue grew 9.9%, which means the machines those masks attach to grew slower than the company did. The dealer reorders cushions and tubing on a resupply schedule; the flow generator sells once.

That annuity is the business now, and it is not what repriced the shares this month. ResMed has gained 10.0% in the nine sessions to 15 October, from $218.89 to $240.77, with nothing company-specific inside the window. Health care led a defensive rotation on 15 October, the sector exchange-traded fund up 2.58% in the session as money left leveraged technology; RBC Capital Markets moved health care to overweight and cut technology to market weight on valuation grounds. On unchanged fiscal 2027 consensus earnings of $12.10, the forward multiple went from about 18.1x to 19.9x in those nine sessions, by derivation from the closing prices: roughly half the distance back to the 24.2x the shares carried a year ago, against 15.1x at the 2 June low of $182.82.

The June quarter moved the other way

Revenue growth decelerated to 8.6% from 10.8% the prior quarter. Reported gross margin fell to 58.8% from 60.8% a year earlier, and reported operating income declined 1.3%. Management's non-GAAP gross margin for the same quarter was 62.3%, up 90 basis points; both are correct on their own basis, and the statutory series is the one showing compression.

Inside the mix, the resupply premium is regional. Americas sleep device revenue grew 8% against Americas masks at 10%; outside the Americas the order reverses, devices 13% against masks 12%. Life support devices fell 45% in the Americas and 38% elsewhere on the Astral halt. The third dollar in the ticker, residential care software, grew 2% in constant currency.

It is also the dollar leaving. ResMed agreed in June to sell its home health and hospice software unit, which includes HEALTHCAREfirst and Citus, to Frazier Healthcare Partners for $490m, with closing expected in the first quarter of fiscal 2027: the quarter reported on 29 October. Roughly $220m of revenue walks out with it, which is why consensus fiscal 2027 revenue growth of 2.9% is portfolio surgery and not a demand reading. The company also announced a $1.5bn repurchase and a 10% dividend raise for the year.

The drug threat shows up as a tailwind

Asked at the Morgan Stanley healthcare conference in September 2026 whether weight-loss drugs cannibalise airway pressure, chief executive Mick Farrell said: "We've got 2.5 million reasons that it's a tailwind. High start rate, high resupply at one year, and even higher than that resupply at three years." The company put therapy start rates 11 percentage points above a control group, with resupply 300 basis points higher at one year. A study of more than 100,000 patients found resupply enrolment halved first-year therapy termination.

Inspire sells the same disease once

Inspire Medical implants a hypoglossal-nerve stimulator per procedure, with no reorder behind it, and the architecture shows. Quarterly revenue went from 12.2% growth to 1.6% to a 7.6% decline, at $200.6m, with first-half operating income at a loss of about $1.6m against $50.95m for all of 2025, on a gross margin of 85.5%. The Senate rejected the resolution to block the Medicare prior-authorisation pilot 46-50 on 16 July, so the paperwork the implant queue runs through stays. Inspire did win new Category I billing codes from the American Medical Association on 1 October, but they take effect on 1 January 2028, with Medicare valuations not final until November 2027. Meanwhile Nyxoah's leadless Genio stimulator, approved in August 2025, is implanting at more than 50 US accounts on $4.5m of US revenue, with both companies suing each other in Delaware.

At 55.7x forward earnings on consensus that has 2026 earnings falling 26.4%, Inspire's shares price a recovery its own reimbursement calendar funds in 2028, well beyond the 3.9% revenue growth consensus pencils for 2027; the forward price-to-sales ratio of 2.34x sits above the trailing 2.22x, which is arithmetic for paying more for a smaller base. The shares are 7.5% lower over thirty days from an 18 September high of $76.78, and still 72% above the May low.

So the two tapes have different authors. Inspire's decline tracks its own disclosures. ResMed's gain does not: the annuity grew, the buyback is real, and the reported margin still fell in the last quarter anyone has seen, which leaves rotation as the likelier explanation for a multiple that re-rated on static estimates.

ResMed's report arrives on 29 October carrying a divestiture, a currency and a mask reorder cycle. What the revenue line will not carry is a count of how many people started therapy.

Falling Power Prices Shrank Air Products' Revenue and Widened Its Margin

Hypothesis Opus 5 · Research Opus 5 · Writing Opus 5 · Prompt v1.7

The revenue line of an industrial gas company cannot say whether its business improved, because the electricity and natural gas burned inside a customer's fenceline arrive in sales at zero margin. Air Products' Americas sales rose 5% last quarter with the energy cost rebilled to customers subtracting two points, and that subtraction added roughly 50 basis points to the segment's operating margin.

Linde's own filing splits its growth into six pieces, one of which is the contractual billing of energy cost variances. Where the two part is capital and cost. Air Products took a $2.9bn charge to walk away from Louisiana hydrogen, cut its capital plan, and reported better adjusted margin, return on capital and guidance. Linde's adjusted operating margin fell 60 basis points and its return on capital slipped to 23.5%, even as its signed gas-supply backlog hit a record.

APDLINEnergy Cost Pass-ThroughClean Hydrogen BuildoutCapital Spending DisciplineOn-Site Gas ContractsReturn On Capital
TickerCompanySegmentTrend · 13mo30D1Y
APDAir Products and ChemicalsIndustrial Gases🟢 Cont. Bull+1.6%+16.3%
LINLindeIndustrial Gases⚠️ Emerging Bear+6.9%+10.4%

12-month price & trend

APD
Air Products and Chemicals
295
+3.83 (+1.32%)
vs. prior close
Price20d50d150d
APD 12-month price
Industrial Gases
LIN
Linde
495
+3.23 (+0.66%)
vs. prior close
Price20d50d150d
LIN 12-month price
Industrial Gases
TickerMkt capP/EP/E fwdP/SP/S fwdP/GPP/GP fwdEV/EBITDAFCF yld
APD$65.8Bn/m20.4x5.2x4.9x16.3x15.3x18.9x3.1%
LIN$228.2B31.8x27.7x6.4x6.3x17.1x16.7x18.7x2.2%

Consensus projections

TickerFY2026EFY2027EFY2028E
APDRevenue+6.0%+5.5%+6.2%
EPS+12.1%+7.5%+8.3%
LINRevenue+7.3%+4.9%+5.8%
EPS+8.9%+9.6%+10.2%

Forward fiscal years only. Blank means no analyst coverage for that year.

Air Products' Americas business sold more gas in the June quarter and billed its customers less for the power that made it. Segment sales rose 5%, according to the company's quarterly filing: volumes added seven points, price was flat, and the energy cost passed through to customers subtracted two. The margin moved the other way, reaching 29.9% against 29.7% a year earlier, with about 50 basis points of that improvement coming from the same shrinking pass-through.

The top line of an industrial gas company is close to useless, then, as a gauge of whether the business got better. Most of the profit comes from air-separation units built inside a customer's fence under long-term take-or-pay contracts, where power and gas are rebilled at no margin and a fixed facility fee arrives whether the customer runs its plant or not. The meters that answer the question are operating margin, return on capital, and the money each company is committing to new plants. On those, Air Products and Linde have spent this year moving in opposite directions.

Two points of sales that were never profit

Linde, which supplies the same oxygen, nitrogen, argon and hydrogen and also builds the plants that make them, does the arithmetic in public. Its second-quarter 10-Q bridges 9% sales growth, to $9,289m, into six parts: two points of price, two of volume, two of currency, one of acquisitions, one from engineering, and one of "cost pass-through, representing the contractual billing of energy cost variances primarily to onsite customers." Half that growth carries no information about gas sold.

Air Products shows the same line running both ways inside one year. Over the nine months to 30 June, a higher pass-through added two points to Americas sales and cost the segment 50 basis points of margin, which fell to 29.0%.

Air Products got paid for retreating

On 26 June the company exited Casa Grande, Arizona and other small clean-energy distribution projects, citing slower-than-expected market development largely in hydrogen for mobility. Four days later it abandoned the Louisiana Clean Energy Complex, a low-carbon hydrogen and ammonia plant already under construction, on returns grounds. The pre-tax charge runs to $2.9bn, $2.2bn after tax, against cash costs capped at $925m. The NEOM green-hydrogen venture in Saudi Arabia survived; Air Products instead signed a marketing and distribution agreement with Yara for its renewable ammonia.

The shares rose 8.0% on announcement day, from $271.35 to $293.18. Capital spending guidance for fiscal 2026 came down to about $3.5bn from roughly $4.0bn, and the company is steering toward some $1.5bn a year of ordinary industrial-gas plants.

What the trading business did under that charge was improve. Adjusted operating income of $810m rose 9%, adjusted operating margin widened 110 basis points to 25.6%, adjusted earnings per share of $3.47 rose 12%, and return on capital reached 11.7%. Full-year adjusted earnings guidance went up to $13.39–$13.49. "Having taken additional decisions to further optimize our large project portfolio, we have a clear pathway to reduce capital expenditures and drive continued profitable growth through high-quality, traditional industrial gas projects," chief executive Eduardo Menezes said on 30 July.

Linde's margin gave way while its backlog hit a record

Linde's adjusted operating margin narrowed 60 basis points to 29.5% as cost inflation outran price and productivity. Chief executive Sanjiv Lamba, on 31 July, called it "another solid quarter, generating record sales and EPS while maintaining industry-leading profitability with 29.5% operating margin and 23.5% return on capital." That return was below the roughly 24% of the prior quarter. On the call Lamba put the roughly 30 basis points of decline excluding pass-through mainly on the US homecare business, and described the quarter's 2% price attainment as broad-based and generally tracking local inflation.

The order book did not crack. A long-term US electronics supply agreement lifted the contractual sale-of-gas backlog about $1bn to a record $8.1bn, within a total project pipeline near $11bn, and capital spending is guided to $5.5bn–$6.0bn. Linde fell 5.95% the day it reported.

Where the two de-ratings part company

Both stocks peaked on 2 July, Air Products at $314.19 and Linde at $546.64, and sit 6.0% and 9.4% below those marks; Air Products is still up 14.7% over twelve months.

For Air Products the results do not account for the slide. Price to gross profit has eased to 16.3x trailing from 17.5x in early May while margin, return on capital and guidance all improved, and the forward multiple of earnings is 20.4x. Linde's fall from 34.98x trailing earnings in early May to 31.8x rests on compression a reader can see in the filings.

One caveat sits against calling Air Products mispriced: the two now change hands at almost the same trailing enterprise value to cash earnings, 18.9x against Linde's 18.7x, while Air Products earns 11.7% on capital employed and Linde 23.5%. The likelier reading is a market pricing the return gap rather than missing the quarter. In a three-way oligopoly where Linde holds roughly 30% of the global market, Air Liquide about 24% and Air Products some 16%, the asset inside the fence is the moat, and the pressure point is renewal: bulk atmospheric gas contracts in North America and Western Europe get renegotiated as take-or-pay terms expire, which erodes a book without any volume falling.

The answer arrives in a cluster. Linde reports third-quarter results on 29 October and Air Liquide publishes revenue the same morning; Air Products holds its fiscal fourth-quarter call on 5 November. Whichever of them restates backlog or capital spending first will say more about the next decade of fenceline plants than any sales bridge can.

Truckload Rates Rose on a Record Fuel Surcharge; the Rate Carriers Keep Went Backwards

Hypothesis Opus 5 · Research Opus 5 · Writing Opus 5 · Prompt v1.7

September looked like the month the freight recovery arrived: spot and contract rates rose across every trailer type. Strip out the fuel surcharge, which reaches a carrier and leaves again at zero margin, and dry-van pricing fell in both the spot and contract markets.

The second prop softened in the same window. The average retail price of a used Class 8 truck slipped 1.5% from August to $61,000, with retail sales off 7%. That line matters most at Heartland Express, where gains on selling trucks ran at 13.6% of June-quarter revenue and delivered a profit on top of an operating loss.

Werner's dedicated contracts are repricing up 3-5%, and refrigerated rates rose, which separates Marten from the dry-van pair. All three were marked down about a quarter in three months, and the compressed margins behind that are doing rational work.

WERNHTLDMRTNCVLGTruckload Rate CycleFuel Surcharge EconomicsDedicated Fleet ContractsUsed Class 8 ValuesRefrigerated FreightDiesel Price Inflation
TickerCompanySegmentTrend · 13mo30D1Y
WERNWerner EnterprisesTruckload & Dedicated⚠️ Emerging Bear−12.2%+26.6%
HTLDHeartland ExpressTruckload & Dedicated⚠️ Emerging Bear−11.9%+37.4%
MRTNMarten TransportTruckload & Dedicated⚠️ Emerging Bear−8.0%+23.3%
CVLGCovenant LogisticsTruckload & Dedicated⚠️ Emerging Bear−14.2%+48.2%

12-month price & trend

WERN
Werner Enterprises
32.97
+0.81 (+2.50%)
vs. prior close
Price20d50d150d
WERN 12-month price
Truckload & Dedicated
HTLD
Heartland Express
11.03
+0.20 (+1.84%)
vs. prior close
Price20d50d150d
HTLD 12-month price
Truckload & Dedicated
MRTN
Marten Transport
12.82
+0.16 (+1.30%)
vs. prior close
Price20d50d150d
MRTN 12-month price
Truckload & Dedicated
TickerMkt capP/EP/E fwdP/SP/S fwdP/GPP/GP fwdEV/EBITDAFCF yld
WERN$2.0Bn/m29.2x0.6x0.5x8.4x7.5x9.9x2.7%
HTLD$854.5Mn/m75.3x1.2x1.2x15.5x16.0x9.2x-10.0%
MRTN$1.0B82.7x46.9x1.2x1.2x101.4x97.2x8.3x0.1%
CVLG
Covenant Logistics
30.92
+0.38 (+1.23%)
vs. prior close
Price20d50d150d
CVLG 12-month price
Truckload & Dedicated
TickerMkt capP/EP/E fwdP/SP/S fwdP/GPP/GP fwdEV/EBITDAFCF yld
CVLG$784.6M206.1x18.6x0.6x0.6x6.0x5.6x8.1x14.0%

Consensus projections

TickerFY2026EFY2027EFY2028E
WERNRevenue+21.5%+7.8%+5.9%
EPS+1669.2%+98.4%+37.5%
HTLDRevenue−12.7%+7.4%+8.4%
EPS−130.1%+244.6%+39.8%
MRTNRevenue+1.7%+9.7%—
EPS+39.5%+137.8%—
CVLGRevenue+12.7%+8.4%+6.9%
EPS+6.9%+62.2%+30.1%

Forward fiscal years only. Blank means no analyst coverage for that year.

Two freight data sets published on 13 October took away the arithmetic the truckload trade had been running on. DAT's monthly release reported that spot and contract rates including fuel rose for all three equipment types in September, as the monthly national average on-highway diesel price passed $6 a gallon for the first time. Excluding fuel, van and flatbed rates declined in both the spot and the contract market. Only refrigerated pricing rose.

That distinction is the whole business. An asset-based carrier is paid revenue per mile net of fuel surcharge, multiplied by the miles each tractor runs in a week, multiplied by the number of trucks it can put a driver in. DAT estimates the surcharge reached a record 84 cents a mile for dry van in September, up 14 cents from August, inside an all-in spot rate of $3.01. September's rate print was widely read as the capacity squeeze finally reaching price. What reached price was diesel.

None of those 84 cents pays a driver or a depreciation charge.

The prop under Heartland's profit was the resale lot

The other leg under these shares was used-equipment value. ACT Research's September flash put the same-dealer average retail price of a used Class 8 truck down 1.5% from August to $61,000, softening more than seasonally expected, and retail sales fell 7% from August in a second consecutive monthly decline.

Heartland Express, the North Liberty, Iowa short-to-medium-haul dry-van carrier, is where that line does the heaviest lifting. Gains on the sale of revenue equipment ran at 13.6% of June-quarter revenue against a 2015-25 average of 4.1%, and without them the operating ratio would have been nearer 103% than the 91.0% reported. Net income of $10.6m sat above an operating loss of $8.5m. Heartland holds no quarterly earnings call and discloses no rate or utilisation metrics, so the resale line is the clearest window the company offers. The shares trade at 9.17x enterprise value to trailing earnings before interest, tax, depreciation and amortisation and 1.13x book, the cheapest book value of the three, while 75.3x on 2026 consensus earnings falls to roughly 21.8x on 2027 — a 245% per-share increase the price already pays for.

Werner is repricing truck-weeks by the year

Werner Enterprises, the Omaha full-truckload and logistics operator, took the other route out of the spot market. More than 70% of its truckload fleet, about 7,400 trucks, sits under dedicated agreements, and the one-way fleet shrank from nearly 3,300 tractors in 2022 to under 2,400 at the end of 2025. Dedicated revenue per tractor per week rose 5.4% net of fuel surcharge in the June quarter, and the company raised dedicated pricing guidance to up 3-5%. The pace is contractual. Renewals should bring "up low to mid-single digit type increases," senior vice-president of pricing Chris Neal said, and chief executive Derek Leathers added that "you need a couple of years of that to really get dedicated back to its traditional long-term run rate".

Reported earnings flatter and then punish. Revenue grew 24.0% to $933.9m in the June quarter, helped by a dedicated-carrier acquisition completed in January. Operating income fell 74.5% to $16.9m, against a prior-year quarter that carried a $45.7m insurance-and-claims reversal. At 9.93x trailing EV/EBITDA, Werner's forward path runs from 29.2x on 2026 consensus to about 14.8x on 2027, on a 97% jump in net income.

Marten's refrigerated rates helped; its dedicated book did not

Marten Transport hauls temperature-controlled food and consumer goods, and was the one name September's data favored: refrigerated spot rates rose 24 cents from August to $3.62 a mile. Its dedicated segment went the other way, the operating ratio deteriorating to 96.4% from 92.4% a year earlier. Revenue fell 2.8% to $223.5m and operating margin compressed to 2.35% from 4.23%. At 8.31x trailing EV/EBITDA, the cheapest of the three, 46.9x on 2026 consensus falls to roughly 19.7x on 2027.

What the de-rating already accounts for

Revenue trajectories improved at all three: Heartland's year-over-year decline narrowed from 26.1% to 12.5% over three quarters, Marten's from 8.8% to 2.8%. Margins compressed at every one of them. The two lines disagree because what improved was the part of the dollar nobody is paid on, and because the capacity story the shares were bought for has no revenue in it yet. "The truck market has certainly flipped this year, but recent tonnage levels confirm this is due to reduced capacity, not robust demand," American Trucking Associations chief economist Bob Costello said in the September tonnage release, which showed the index down 0.9% to 114.2.

Capacity exit sets a floor under future price; it does not fill a quarter. UBS cut Werner and Heartland to hold from buy and JP Morgan moved both to underweight, arguing a truckload rate recovery would be pushed out. With ex-fuel van pricing lower, used-truck values easing and the weekly national diesel average down from its $6.529 peak in the week of 21 September to $6.199 by 5 October, a markdown from an expensive multiple is doing rational work. The near-identical 8.3x-to-9.9x band across three structurally different fleets says the market repriced a shelf.

Diesel has turned back down from its late-September record, which takes the flattery out of the top line before it takes anything out of cost. Marten prints first, after the close on 22 October, and what it reports will carry less surcharge in it than September's rates did.