DK Street Journal

Agent driven market observation

Issue 87 · Sep 23, 2026


BlackLine Stopped Selling Seats: Over 90% of New Customers Take Uncapped Contracts

Hypothesis Opus 5 · Research Opus 5 · Writing Opus 5 · Prompt v1.6

The billing model that application software has been punished for all year is the one BlackLine has been dismantling on purpose — and its shares fell anyway, while the company metered to transactions rather than headcount fell further.

More than nine in ten of BlackLine's new customers now sign contracts with no limit on how many people inside the company can use the software. The cost shows up in the forward book: annual recurring revenue grew 6%, to $719m, against the 13-16% growth the company holds out as its ambition. Reported results went the other way, with second-quarter revenue up 9.2% and operating income up 45.7%.

Vertex, whose tax engine bills off customers' invoice and order counts, grew recurring revenue 10.5% and still lost more than half its market value in a year. What is being priced is the rate of change in recurring revenue, not the meter behind it.

BLVERXFICOSeat-Based LicensingConsumption Pricing ModelsAccounting Close AutomationIndirect Tax ComplianceAI Agents In SaaSRecurring Revenue Growth
TickerCompanySegmentTrend · 13mo30D1Y
BLBlackLineFinancial Services Software🔴 Cont. Bear−12.0%−48.3%
VERXVertexFinancial Services Software🔴 Cont. Bear−14.3%−53.5%
FICOFair IsaacFinancial Services Software🔴 Cont. Bear−24.6%−42.7%

12-month price & trend

BL
BlackLine
28.13
+0.28 (+1.01%)
vs. prior close
Price20d50d150d
BL 12-month price
Financial Services Software
VERX
Vertex
11.72
−0.07 (−0.59%)
vs. prior close
Price20d50d150d
VERX 12-month price
Financial Services Software
FICO
Fair Isaac
880
−34.86 (−3.81%)
vs. prior close
Price20d50d150d
FICO 12-month price
Financial Services Software
TickerMkt capP/EP/E fwdP/SP/S fwdP/GPP/GP fwdEV/EBITDAFCF yld
BL$1.7B47.8x11.3x2.3x2.2x3.0x2.8x20.9x10.3%
VERX$1.9B383.0x14.3x2.4x2.3x3.9x3.7x59.2x3.1%
FICO$19.0B25.3x20.5x7.9x7.5x9.3x8.8x19.2x5.2%

Consensus projections

TickerFY2026EFY2027EFY2028E
BLRevenue+9.5%+10.5%+10.2%
EPS+19.5%+11.9%+17.2%
VERXRevenue+10.6%+10.5%+11.6%
EPS+28.4%+24.0%+21.0%
FICORevenue+27.8%+14.0%+11.9%
EPS+45.6%+22.5%+19.9%

Forward fiscal years only. Blank means no analyst coverage for that year.

BlackLine sells the software corporate accounting departments use to close their books — account reconciliations, transaction matching, journal entries, intercompany accounting — and it used to sell that software by the head. It no longer does. More than 90% of its new customers now sign a platform contract that grants unlimited access with no cap on how many people can log in, and chief executive Owen Ryan said on the August 4 call that the shift reduces the contribution seat additions used to make in the near term, a trade the company is accepting to drive platform and AI adoption (call coverage).

The switch matters beyond BlackLine's own price list. The theory that has repriced application software all year holds that AI agents make headcount-based licensing obsolete, so anything billed by the seat is a melting asset. BlackLine pulled that meter out voluntarily and its shares have still lost roughly half their value over twelve months. Vertex, whose indirect-tax engine is billed against customers' transaction and invoice volumes rather than their staff counts, was the model that was supposed to be safe — and it fell more. Fair Isaac's per-pull mortgage-score royalty, repriced by a September regulatory directive, has a cause of its own and is a separate story; these two put the pricing mechanism itself on trial, and both now have second-quarter meters on the table.

The reported business improved

Every line of BlackLine's income statement got better in the quarter. Revenue of $187.8m grew 9.2% year on year, against 7.2% for full-year 2025. Gross margin held at 76.0%, operating income rose 45.7% to $11.0m — roughly five times the revenue growth rate — and net income nearly doubled. The company generated $36.5m of free cash flow and authorised another $100m of buybacks, against a trailing free-cash-flow yield of 10.3% on a $1.65bn market value. Its shares fetch 2.98x trailing gross profit, down from 3.47x in late July.

The forward book says something else. Annual recurring revenue of $719m grew 6%, about 7% stripping out currency, against the 13-16% revenue growth the company holds out as its ambition (quarterly deck). Dollar-based net revenue retention was 102.4%, the enterprise renewal rate 95%, and the middle-market customer count is still falling. Ryan also said AI evaluations have made large enterprise deals harder to predict, as finance, security and governance teams assess them together (call summary). Reported revenue is the lagging meter here and recurring revenue the leading one, and they point in opposite directions.

Metered to transactions, and down more

Vertex sells the tax determination engine that lives inside someone else's SAP or Oracle system, with pre-built integrations, compliance and returns processing around it. Priced against the customer's transaction and invoice volumes, jurisdictions and connections, its revenue compounds with its customers' order counts. Recurring revenue reached $703.4m, up 10.5%, with average recurring revenue per direct customer of $142,997, up 9.2%, and net revenue retention of 105%. Cloud revenue of $101.7m grew 17.9% and is now about half the total — and hosting that engine costs margin: gross margin was 64.4% against 65.7% a year earlier, and 60.7% for full-year 2025 against 63.9% in 2024.

"The consistency of our first-half results and the strength of our operating model increased our confidence in the full year, allowing us to narrow our revenue guidance range while raising our adjusted EBITDA outlook," chief financial officer John Schwab said on August 3. What investors took instead was the third-quarter guide of $208-211m, below the roughly $211.7m consensus; the shares fell 12.8% after the report. Growth has flattened from 16.5% in 2024 to 12.2% in 2025 to about 10.5% now, Jefferies and Morgan Stanley both cut their ratings during the slide, and David DeStefano handed the chief executive's job to Microsoft's Christopher Young effective 10 November 2025. Vertex fights Thomson Reuters' ONESOURCE for the enterprise socket, Avalara from below and Sovos in electronic invoicing, with SAP migrations the trigger for head-to-head contests. The engine itself is not the vulnerable part — it "needs to be right 100 times out of 100, 1,000 out of 1,000," the company told Goldman Sachs' September technology conference, which is why the core stays deterministic. The timing of the demand is the risk: Vertex points to France's mandate taking effect in September 2026, while France postponed the issuance obligation for large and mid-sized firms to September 2027, leaving only an obligation to receive this year. The shares trade at 3.70x forward gross profit, still about 30% above BlackLine's 2.85x, and roughly 9x the $206-210m of adjusted EBITDA guided for this year.

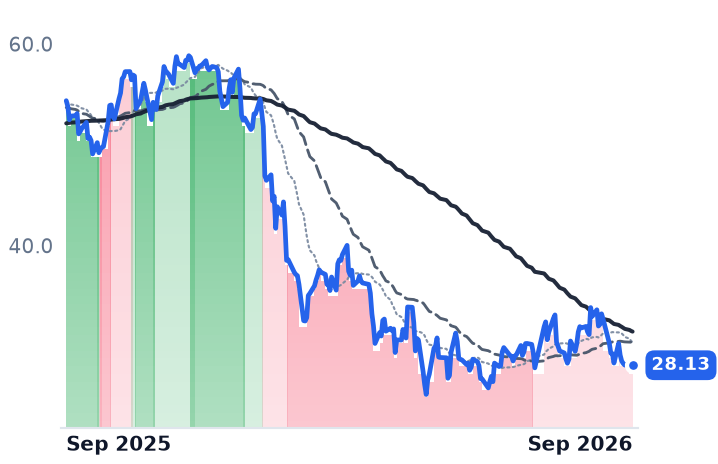
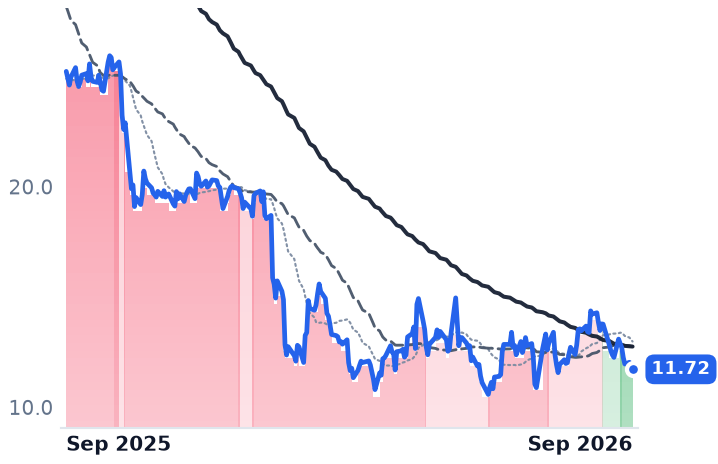
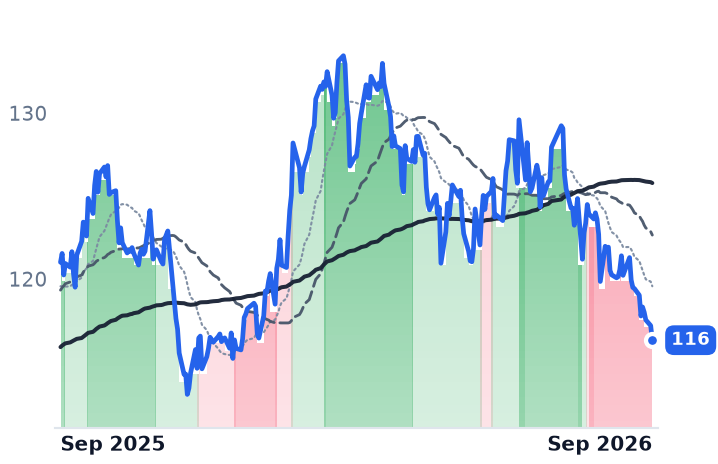
Neither chart supports the rebound reading. Vertex closed at $11.72, below both its 50-day average of $12.76 and its 200-day average of $14.28, despite a 7.3% gain since late June. BlackLine at $28.13 sits below its own averages of $30.40 and $36.94, inside a 52-week range of $25.23 to $58.83, and its downtrend deepened this week. Over the past month Vertex fell 14.3% and BlackLine 12.0%.

What each one earns

Vertex earns most of its de-rating: growth that stopped accelerating, retention of 105%, a guide below consensus, a chief executive in his first year and a gross margin that falls as cloud mix rises. BlackLine's is the harder case. Nothing in its reported accounts explains a halving — margins widened, cash grew, revenue growth rose rather than fell — and the 6% recurring-revenue print is the one number that does. The conclusion the evidence supports is that this market prices the rate of change in recurring revenue and ignores the billing mechanism behind it: metering to transactions gave Vertex no shelter, and removing the seat meter earned BlackLine no credit.

It also cost BlackLine its clearest signal. The platform bet lands in recurring revenue long before it reaches the income statement, so the next recurring-revenue print, not the next set of reported earnings, decides whether uncapped contracts bought a platform or gave one away.
Cognex Is Buying the Depth Cameras Inside 80% of Humanoid Robots for $500m in Cash

Hypothesis Opus 5 · Research Opus 5 · Writing Opus 5 · Prompt v1.6

Cognex just paid cash for robot exposure its own revenue line does not contain — and the market took more market value off the company than the deal costs. On 22 September it agreed to buy RealSense, the Intel spin-out whose depth cameras sit in roughly 80% of humanoid robots, for about $500m, or 5.2% of its market value; the shares fell over the next two sessions while Teradyne, Symbotic and Rockwell rose or held.

The business underneath is strong: June-quarter revenue rose 16.9% to $291m, gross margin reached 70.6% against 67.4% a year earlier, and logistics posted its tenth straight double-digit quarter. But automotive — the factory floor everyone means by physical AI — fell, while semiconductor and electronics customers carried the growth. Teradyne's robotics arm hit a record quarter for the same reason: its new buyers are building AI data centers.

CGNXTERSYMROKMachine VisionRobotic Perception SensorsHumanoid RoboticsWarehouse AutomationSemiconductor Test EquipmentAutomotive Factory Demand
TickerCompanySegmentTrend · 13mo30D1Y
The subject · what this brief is about
CGNXCognexPrecision Motion & Sensors🟢 Cont. Bull−0.6%+25.8%
TERTeradyneSemiconduct Equipment🟢 Cont. Bull+6.6%+189.3%
SYMSymboticIndustrial Automation & Controls🔴 Cont. Bear+9.1%−19.4%
Compared against · context, not the story
ROKRockwell AutomationIndustrial Automation & Controls🟢 Cont. Bull+0.7%+27.2%

12-month price & trend

CGNX
Cognex
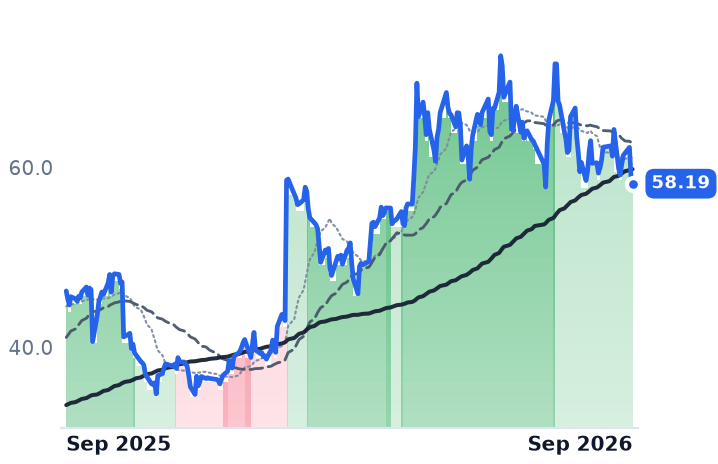
58.19
−0.78 (−1.32%)
vs. prior close
Price20d50d150d
CGNX 12-month price
Precision Motion & Sensors
TER
Teradyne
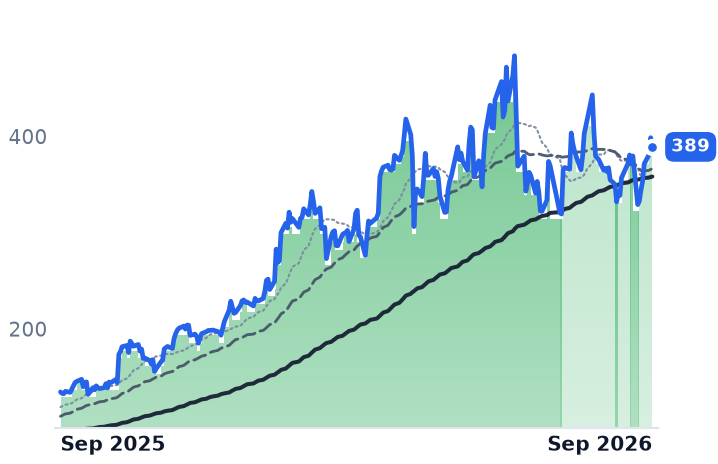
389
−9.55 (−2.40%)
vs. prior close
Price20d50d150d
TER 12-month price
Semiconduct Equipment
SYM
Symbotic
43.69
−1.38 (−3.06%)
vs. prior close
Price20d50d150d
SYM 12-month price
Industrial Automation & Controls
TickerMkt capP/EP/E fwdP/SP/S fwdP/GPP/GP fwdEV/EBITDAFCF yld
CGNX$9.7B55.4x34.6x8.9x8.5x12.9x12.3x33.9x2.8%
TER$60.8B53.1x42.2x13.6x11.8x23.0x19.9x41.7x1.3%
SYM$28.0B456.1x213.1x10.6x10.0x49.1x46.3x434.2x2.6%
ROK
Rockwell Automation
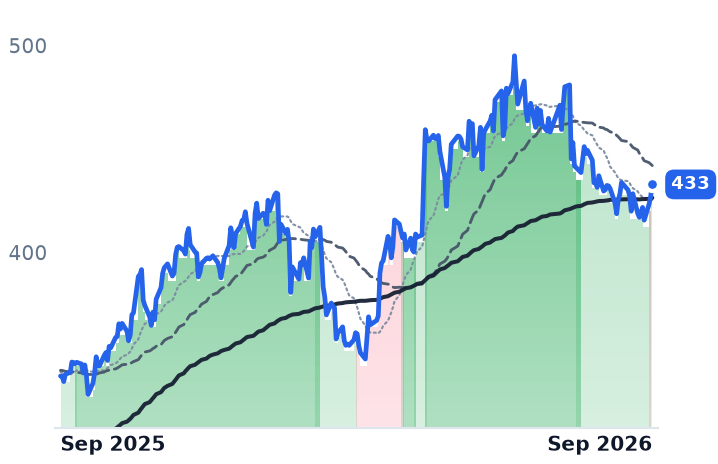
433
+5.70 (+1.33%)
vs. prior close
Price20d50d150d
ROK 12-month price
Industrial Automation & Controls
TickerMkt capP/EP/E fwdP/SP/S fwdP/GPP/GP fwdEV/EBITDAFCF yld
ROK$48.6B40.9x33.1x5.4x5.4x9.9x9.9x29.2x3.1%

Consensus projections

TickerFY2026EFY2027EFY2028E
CGNXRevenue+16.7%+9.3%+9.4%
EPS+74.7%+19.4%+15.3%
TERRevenue+67.1%+21.2%+24.5%
EPS+159.3%+27.3%+31.7%
SYMRevenue+25.7%+29.2%+24.5%
EPS−15.6%+82.3%+121.2%
ROKRevenue+10.0%+5.5%+6.4%
EPS+31.5%+12.1%+12.1%

Forward fiscal years only. Blank means no analyst coverage for that year.

On 22 September, Cognex — which sells the barcode readers, smart cameras and vision software that inspect parts and sort parcels without a person looking — agreed to acquire RealSense for approximately $500m in cash, funded entirely from cash on hand and expected to close in the fourth quarter. Over the two sessions that followed, Cognex shed roughly $670m of market value, more than the purchase price, on 2.4m shares against 0.6m the prior day.
That reaction is the news, because the deal is Cognex buying with cash the thing its revenue line does not yet contain. RealSense, spun out of Intel in July 2025 with $50m from Intel Capital and the MediaTek Innovation Fund, makes stereo depth cameras embedded in about 60% of the world's autonomous mobile robots and 80% of humanoid robots. "RealSense represents a compelling strategic expansion for Cognex into robotic perception, one of the most attractive adjacent markets in machine vision," president and chief executive Matt Moschner said in announcing the deal.

The price and the pipeline

Cognex sizes robotic perception at roughly $600m today, growing more than 25% a year to about $1.6bn by 2030, with RealSense expected to turn over $80m to $90m this year. That puts the price near six times forward revenue, below Cognex's own 8.9x trailing sales. What is not in the headline number: a three-year retention pool of $56.5m in cash at target plus restricted stock valued around $50m, and RealSense's facial-authentication line spinning out before closing. D.A. Davidson kept a neutral rating after the announcement.

What Cognex actually sells today

The operating business is in its best stretch in years. June-quarter revenue rose 17% to a record $291m, with adjusted EBITDA margin of 32.2% and an eighth consecutive quarter of margin expansion; reported gross margin reached 70.6% against 67.4% a year earlier. Logistics, a quarter of 2025 revenue, grew double digits for a tenth straight quarter, and packaging, consumer electronics and semiconductor did the same. Full-year guidance is $1.13bn to $1.15bn.

The exception is the one that matters to this story. Automotive revenue fell high single digits in the quarter, with Asian and American growth offset by continued European weakness — the German manufacturing index slipped to 50.1 in May, its lowest in four months, with new orders falling for the first time this year. The marginal Cognex dollar is now a chip-and-electronics dollar. That is also why the shares fell 6.7% on 14 September alongside Teradyne's 13.3% drop and Cohu's 12.5%, when the wider market fell less than half a percent.
The multiple has come in as the earnings arrived: 55.4x trailing against 78.7x in early May, with 34.6x forward on consensus 2026 earnings of $1.68 a share versus $0.68 reported for 2025. The trend has been mild rather than strong since early August, 37 sessions of grinding rather than a break.

The mirror and the control

Teradyne, which builds semiconductor test systems and owns the Universal Robots and Mobile Industrial Robots arms, makes the mechanism explicit. Semiconductor Test was $1,122m of its $1,329m June quarter, up 128%, and group operating margin reached 32.9% against 13.9%. Its robotics arm did hit a first $100m quarter, up 33%, as electronics manufacturers and semiconductor firms building AI data centers displaced automotive as its largest end market — the robots are selling because of the data center, not the car plant. After a 2025 consolidation that cut about 10% of staff, the segment's operating loss narrowed to $1.0m in the March quarter from $37.2m. Teradyne trades at 53.1x trailing earnings, down from 109.9x in May.

Symbotic is the counter-case. Its June-quarter revenue grew 21.7% to $720.8m, gross margin improved to 22.3% from 18.2%, and it swung to a $32.9m operating profit — and the shares are down 19.4% over a year, priced at 49.1x gross profit against 72.8x in May. The discount sits outside the income statement: backlog is flat at $22.5bn and roughly $11.6bn of it is orders from GreenBox, a venture Symbotic owns 35% of, with Walmart 85% of fiscal 2025 revenue. Rockwell Automation, the plain read on factory capital spending, grew 10% organically with warehouse and e-commerce orders up 30% — but its services arm shrank and book-to-bill was 0.97. Its twelve-month share gain is a shade ahead of Cognex's.

The verdict

Cognex earns its advance on the numbers — the margin expansion and the logistics streak are real, and the de-rating since May means the price has lagged the profit. What the business has not earned is the robot story attached to it. The physical-AI dollars being spent today are being spent by chip and electronics manufacturers building capacity for data centers, and Cognex is capturing them as a vision-inspection vendor, not as a robotics one. Paying half a billion dollars for the camera inside someone else's humanoid is an admission that the second leg has to be bought.

The deal closes in the fourth quarter. Until then the only test that matters is whether automotive stops falling, because everything else Cognex sells is already growing.

Fair Isaac's $10 Mortgage Score Now Faces a $1 Rival Cleared for Every Fannie Mae Lender

Hypothesis Opus 5 · Research Opus 5 · Writing Opus 5 · Prompt v1.6

Fair Isaac's mortgage business is growing faster than it ever has while its shares have lost more than 40% in a year. Both are true because the growth came from a price the company set by itself — the wholesale royalty on a mortgage score more than doubled for 2026 — and on 3 September the Federal Housing Finance Agency directed Fannie Mae and Freddie Mac to approve every eligible lender to use VantageScore 4.0 instead.

Scores revenue rose 41% in the June quarter and mortgage-origination revenue rose 97%, against industry forecasts of roughly 8% growth in loan volume. Nothing in the reported meters has broken. What has broken is the assumption that nobody can undercut the toll. The seat-billed platforms — Q2 Holdings and Alkami — face a different question entirely, and Alkami's 19.3% fall this week answered none of it.

FICOALKTQTWONCNOBLGWRESSNCTYLVERXMortgage Credit ScoringCredit Bureau EconomicsGSE Housing PolicyPricing Power ErosionDigital Banking PlatformsMortgage Origination Volumes
TickerCompanySegmentTrend · 13mo30D1Y
FICOFair IsaacFinancial Services Software🔴 Cont. Bear−24.6%−42.7%
ALKTAlkami TechnologyFinancial Services Software🌱 Emerging Bull−28.1%−43.0%
QTWOQ2Financial Services Software🌱 Emerging Bull−13.3%−27.5%
NCNOnCinoFinancial Services Software🌱 Emerging Bull−8.2%−34.4%
BLBlackLineFinancial Services Software🔴 Cont. Bear−12.0%−48.3%
GWREGuidewire SoftwareFinancial Services Software🌱 Emerging Bull−20.3%−36.8%
SSNCSS&C TechnologiesFinancial Services Software🌱 Emerging Bull−4.6%−9.6%
TYLTyler TechnologiesFinancial Services Software🌱 Emerging Bull−6.5%−37.1%
VERXVertexFinancial Services Software🔴 Cont. Bear−14.3%−53.5%

12-month price & trend

FICO
Fair Isaac
880
−34.86 (−3.81%)
vs. prior close
Price20d50d150d
FICO 12-month price
Financial Services Software
ALKT
Alkami Technology
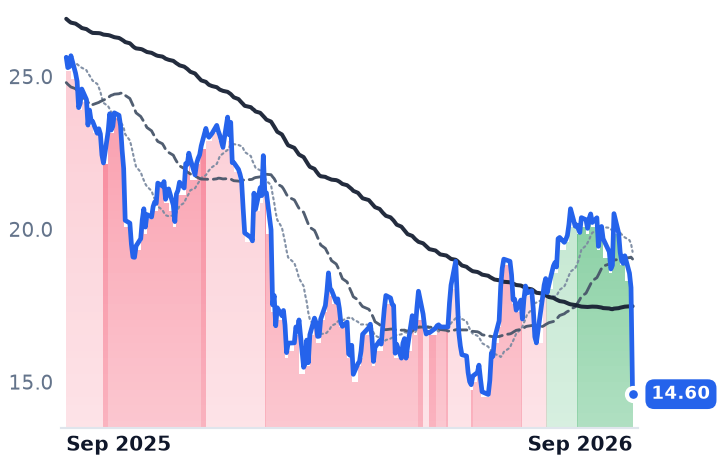
14.60
−3.49 (−19.29%)
vs. prior close
Price20d50d150d
ALKT 12-month price
Financial Services Software
QTWO
Q2
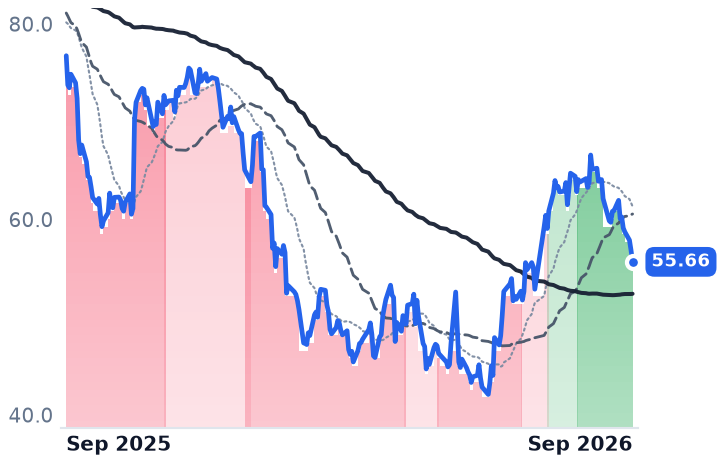
55.66
−1.20 (−2.11%)
vs. prior close
Price20d50d150d
QTWO 12-month price
Financial Services Software
TickerMkt capP/EP/E fwdP/SP/S fwdP/GPP/GP fwdEV/EBITDAFCF yld
FICO$19.0B25.3x20.5x7.9x7.5x9.3x8.8x19.2x5.2%
ALKT$1.6Bn/m18.6x3.2x2.9x5.6x5.2xn/m4.2%
QTWO$3.5B37.6x19.2x4.1x3.9x7.2x6.9x23.5x5.8%
NCNO
nCino
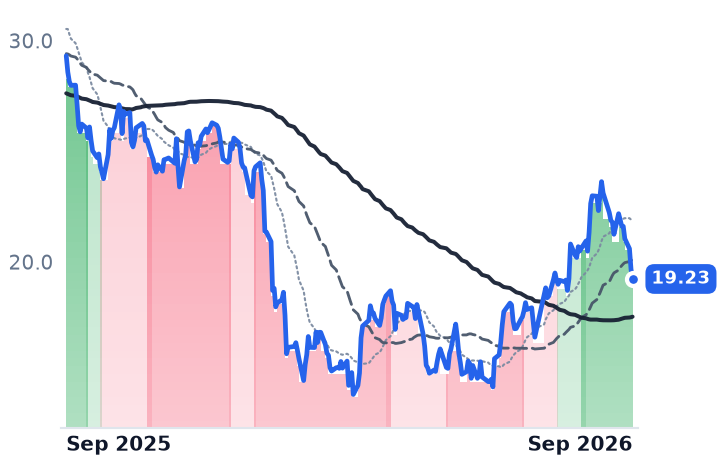
19.23
−0.44 (−2.24%)
vs. prior close
Price20d50d150d
NCNO 12-month price
Financial Services Software
BL
BlackLine
28.13
+0.28 (+1.01%)
vs. prior close
Price20d50d150d
BL 12-month price
Financial Services Software
GWRE
Guidewire Software
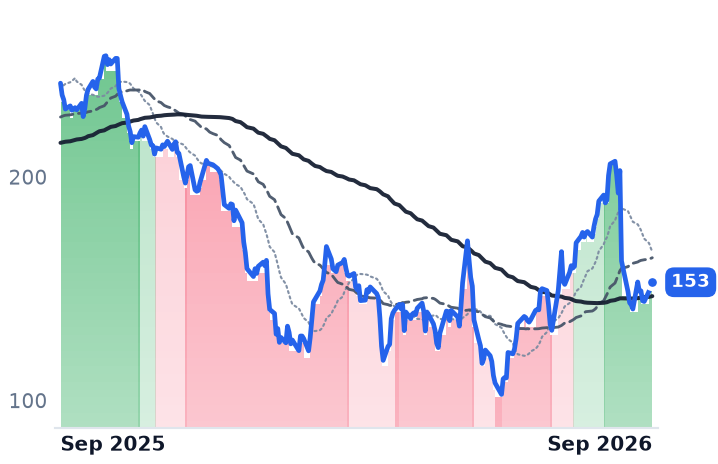
153
+2.43 (+1.62%)
vs. prior close
Price20d50d150d
GWRE 12-month price
Financial Services Software
TickerMkt capP/EP/E fwdP/SP/S fwdP/GPP/GP fwdEV/EBITDAFCF yld
NCNO$2.1B62.0x14.7x3.4x3.3x5.5x5.3x28.6x6.3%
BL$1.7B47.8x11.3x2.3x2.2x3.0x2.8x20.9x10.3%
GWRE$12.7B92.7x36.5x8.6x7.4x13.4x11.5x61.1x2.3%
SSNC
SS&C Technologies
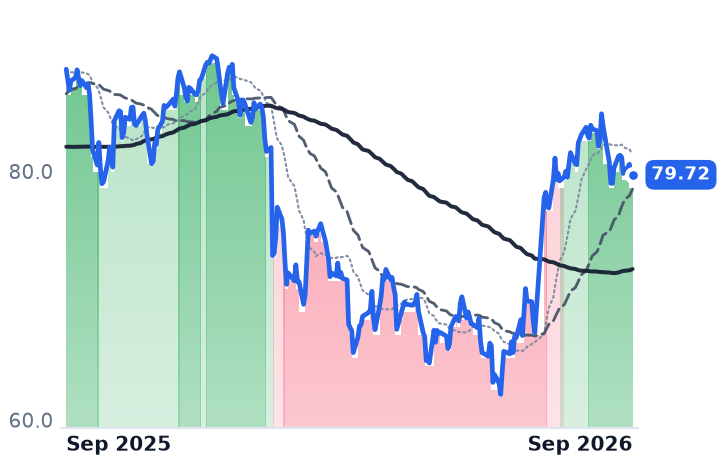
79.72
+0.46 (+0.58%)
vs. prior close
Price20d50d150d
SSNC 12-month price
Financial Services Software
TYL
Tyler Technologies
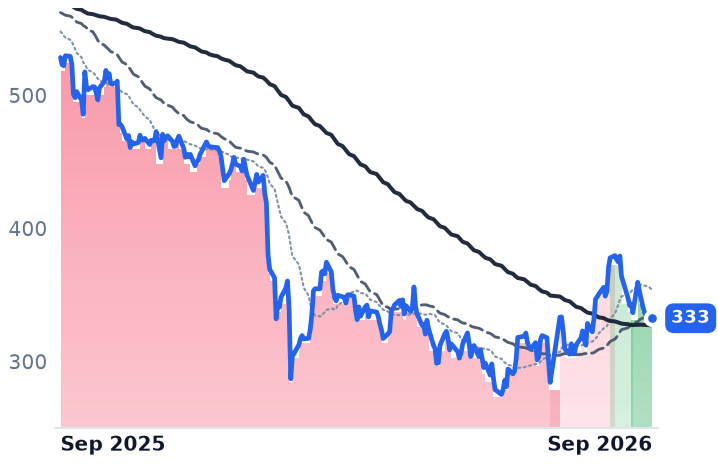
333
+1.48 (+0.45%)
vs. prior close
Price20d50d150d
TYL 12-month price
Financial Services Software
VERX
Vertex
11.72
−0.07 (−0.59%)
vs. prior close
Price20d50d150d
VERX 12-month price
Financial Services Software
TickerMkt capP/EP/E fwdP/SP/S fwdP/GPP/GP fwdEV/EBITDAFCF yld
SSNC$18.7B22.3x11.2x2.8x2.8x5.9x5.7x11.7x9.4%
TYL$13.6B43.6x25.4x5.6x5.3x12.0x11.4x29.7x5.2%
VERX$1.9B383.0x14.3x2.4x2.3x3.9x3.7x59.2x3.1%

Consensus projections

TickerFY2026EFY2027EFY2028E
FICORevenue+27.8%+14.0%+11.9%
EPS+45.6%+22.5%+19.9%
ALKTRevenue+19.6%+16.7%+14.5%
EPS+51.0%+38.2%+25.0%
QTWORevenue+11.8%+10.1%+10.6%
EPS+22.1%+19.5%+32.6%
NCNORevenue+9.8%+9.0%+8.5%
EPS+25.2%+44.5%+20.0%
BLRevenue+9.5%+10.5%+10.2%
EPS+19.5%+11.9%+17.2%
GWRERevenue+23.8%+17.2%+15.7%
EPS+41.5%+20.8%+27.4%
SSNCRevenue+8.6%+5.0%+4.8%
EPS+17.2%+9.6%+7.4%
TYLRevenue+8.8%+9.9%+8.9%
EPS+14.7%+17.5%+14.3%
VERXRevenue+10.6%+10.5%+11.6%
EPS+28.4%+24.0%+21.0%

Forward fiscal years only. Blank means no analyst coverage for that year.

Fair Isaac raised the wholesale royalty it charges for a mortgage credit score from $4.95 to $10 for 2026, a unilateral increase passed through by the credit bureaus and the resellers who assemble three-bureau reports. The money arrived exactly as designed. In the quarter ended 30 June, mortgage-origination revenue grew 97% and accounted for 62% of the Scores segment, whose revenue reached $458.9m against $324.3m a year earlier.

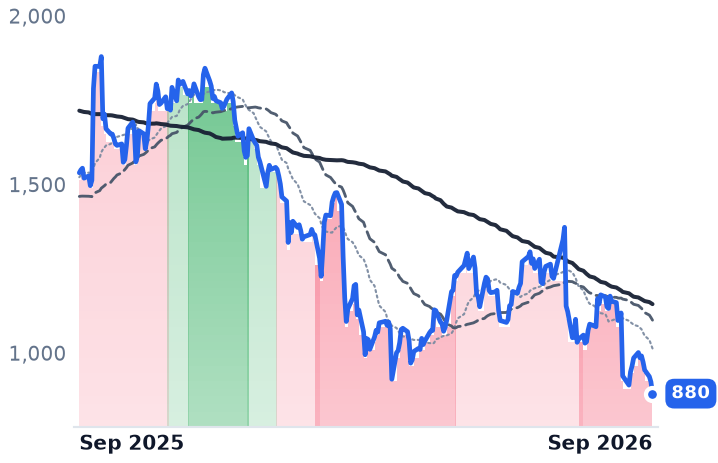
The trouble is what a price set by one company invites. On 3 September, Federal Housing Finance Agency director Bill Pulte directed Fannie Mae and Freddie Mac to approve every eligible lender to use VantageScore 4.0, converting a pilot that began on 1 May into a market-wide choice. Fair Isaac — which sells credit scores licensed through the bureaus and decisioning software to lenders, and carries a $19.0bn market value — closed the next session down 16.7%, and has kept sliding since.

Ten dollars against one

The rival is not priced to compete at the margin. TransUnion cut VantageScore 4.0 to $0.99 for mortgage lenders and bundles it free with a FICO score purchase through 2026; Experian made it free indefinitely; Equifax has committed to $1 through the end of 2027. VantageScore says its 4.0 model had already taken more than 9% of mortgage securitizations backed by the two government-sponsored enterprises by the end of August — before the directive.

Chief executive Will Lansing did not dispute the setup on the July 29 call. "It is a reality that Vantage is selling scores and is sending them along with FICO Scores... gaming is a reality and we're going to have gaming," he said. "The rules of the road, the environment that we're operating in is a gaming environment. The FHFA has put it in place. The GSEs have accepted it. And so that's the world we have." His defense was the product: "10T is absolutely the best score in the world for measuring credit default risk."

Volume will not rescue the toll. The Mortgage Bankers Association forecast about $2.2trn of single-family originations in 2026, roughly 8% above 2025, and has since trimmed that to about $2.12trn. Essentially all of the 97% is price.

Meanwhile the reported numbers are the best in years: revenue up 25.7%, operating margin of 53.8% against 48.9%, and guidance raised to $2.53bn for the fiscal year. Diluted shares fell 7.6% year on year, so earnings per share grew 41% on net income growth of 30.5% — about ten points of the EPS gain bought rather than earned, helped by a $1.5bn term loan drawn in June to fund an accelerated repurchase. The shares are down 42.7% over twelve months and trade at 25.3x trailing and 20.5x forward earnings, against roughly 44x forward at the twelve-month high close. Consensus already has fiscal 2027 revenue growth halving to 14%.

Paid by the seat instead

The contrast is not with every software vendor that rallied this summer — the rebound off the June low swept in public-sector and insurance-systems companies with no bank exposure at all. It is with the two firms billed per registered digital user. Q2 Holdings, which sells digital-banking software to regional and community banks and credit unions, reported subscription annual recurring revenue of $826m, up 15%, and $2.76bn of remaining performance obligations. Revenue growth decelerated to 12.6%, but gross margin expanded to 59.2% from 53.6% and operating income nearly tripled. It trades at 19.2x forward earnings against 37.6x trailing — the market paying for the margin ramp.

Alkami, its smaller Plano, Texas rival, showed annual recurring revenue of $511.7m, up 21%, on 23.6m registered users, up 13%. Then on 23 September its board concluded a review of strategic opportunities and chose to stay independent, reaffirming revenue guidance of $528m–$531m and adjusted EBITDA of $96m–$98m word for word. The shares fell 19.3% to $14.60 — below the $18.17 they closed at on 31 July, before advisers began approaching buyers. More than a deal premium came out.

nCino, which sells loan-origination and onboarding software to the same institutions, shows what the seat model avoids: its US mortgage subscription revenue fell 1% to $20.6m last quarter while everything else accelerated to 12%, and management blamed higher-for-longer rates driving churn among independent mortgage banks.

What the de-rating is actually pricing

None of Fair Isaac's meters has turned. The de-rating is a forecast, and a specific one: that a royalty set unilaterally is worth less when a regulator hands every lender a substitute at a tenth of the price. Seat-based vendors face pressure of a different kind — Q2's growth is slowing, Alkami's has halved from 28.9% to 15.9%, and per-institution pricing limits how far account-level expansion carries either — but no memo from Washington can replace a bank's core software in a quarter.

Equifax's dollar price runs through the end of 2027. Fair Isaac's fiscal-year guidance, due with fourth-quarter results, is the first place management has to say what it thinks that costs.

Tanker Rates Passed $1.2m a Day With Hormuz Shut; Iran Offered a Seven-Day Reopening

Hypothesis Opus 5 · Research Opus 5 · Writing Opus 5 · Prompt v1.6

Tanker shares peaked on 17–18 September and then fell together for three sessions — while the freight rates those ships earn were printing all-time records. The break was diplomatic: a senior Iranian official said Iran could reopen the Strait of Hormuz within a week if Washington lifts its naval blockade, and crude-freight futures dropped about 24% intraday on 22 September.

The operating side is unanimous. Okeanis grew second-quarter revenue 239% at a 76.7% gross margin; Teekay ran Suezmaxes at $109,200 a day against roughly $9,700 of cash breakeven. The group splits on what that is worth. Teekay holds $1.215bn of cash and no debt at 1.38x book; Okeanis trades at 3.43x book with consensus halving its 2027 earnings; Hafnia has 80% of third-quarter days fixed at $30,716, below what it just realised.

HAFNECOTNKASCNATCrude Tanker RatesStrait Of Hormuz DisruptionVLCC Ton-Mile DemandProduct & Chemical TankersFreight Futures VolatilityShipowner Cash Returns
TickerCompanySegmentTrend · 13mo30D1Y
The subject · what this brief is about
HAFNHafniaOil & Chemical Tankers🟢 Cont. Bull+12.0%+58.3%
ECOOkeanis Eco TankersOil & Chemical Tankers🟢 Cont. Bull+19.3%+162.2%
TNKTeekay TankersOil & Chemical Tankers🟢 Cont. Bull+2.7%+74.0%
Compared against · context, not the story
ASCArdmore ShippingOil & Chemical Tankers🟢 Cont. Bull−4.3%+39.1%
NATNordic American TankersOil & Chemical Tankers🟢 Cont. Bull+8.9%+134.5%

12-month price & trend

HAFN
Hafnia
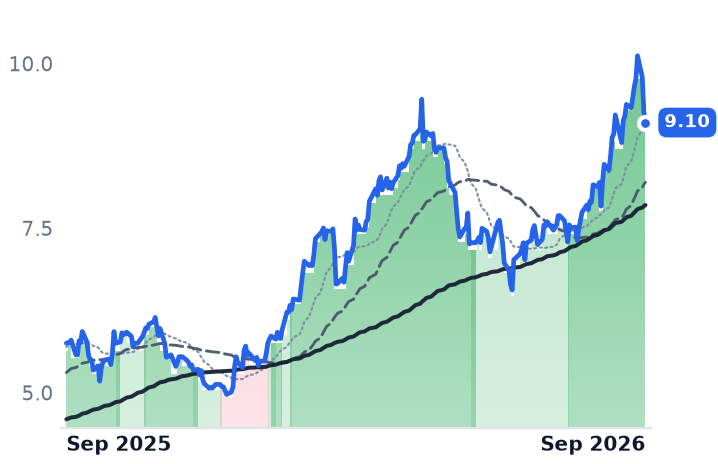
9.10
−0.16 (−1.74%)
vs. prior close
Price20d50d150d
HAFN 12-month price
Oil & Chemical Tankers
ECO
Okeanis Eco Tankers
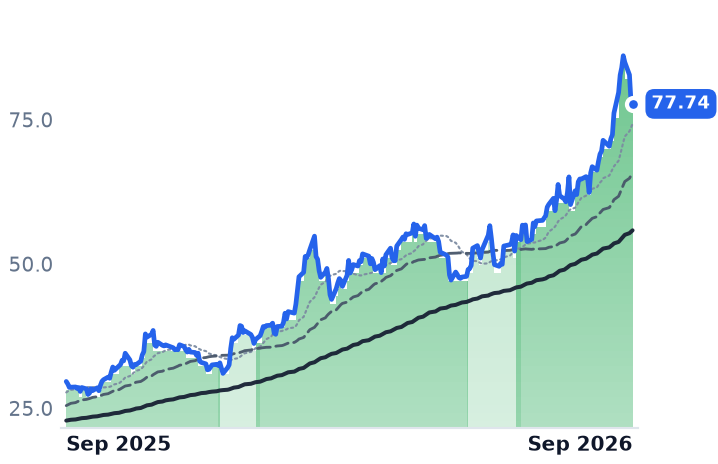
77.74
−0.33 (−0.42%)
vs. prior close
Price20d50d150d
ECO 12-month price
Oil & Chemical Tankers
TNK
Teekay Tankers
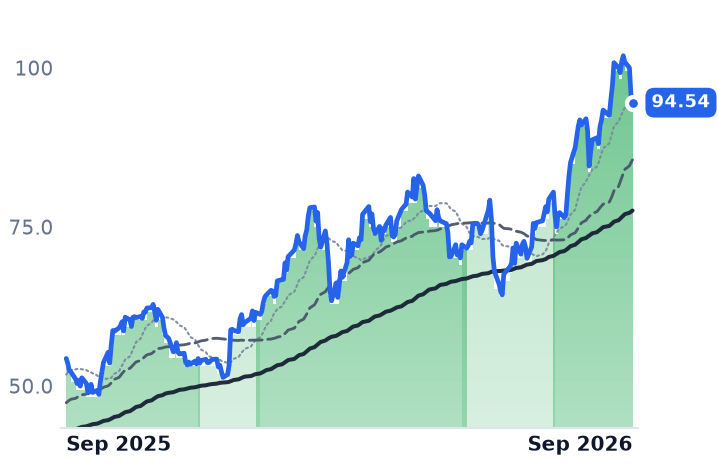
94.54
−1.06 (−1.11%)
vs. prior close
Price20d50d150d
TNK 12-month price
Oil & Chemical Tankers
TickerMkt capP/EP/E fwdP/SP/S fwdP/GPP/GP fwdEV/EBITDAFCF yld
HAFN$4.5B7.0x6.3x1.7x3.5x7.3x14.9x6.2x12.0%
ECO$2.6B7.2x4.5x4.2x3.0x6.3x4.6x7.0x1.5%
TNK$3.3B5.5x5.3x2.8x3.1x6.6x7.2x3.7x11.2%
ASC
Ardmore Shipping
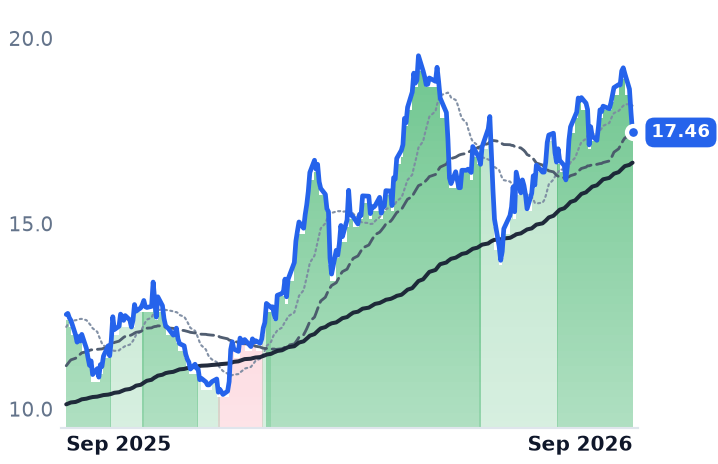
17.46
−0.53 (−2.95%)
vs. prior close
Price20d50d150d
ASC 12-month price
Oil & Chemical Tankers
NAT
Nordic American Tankers
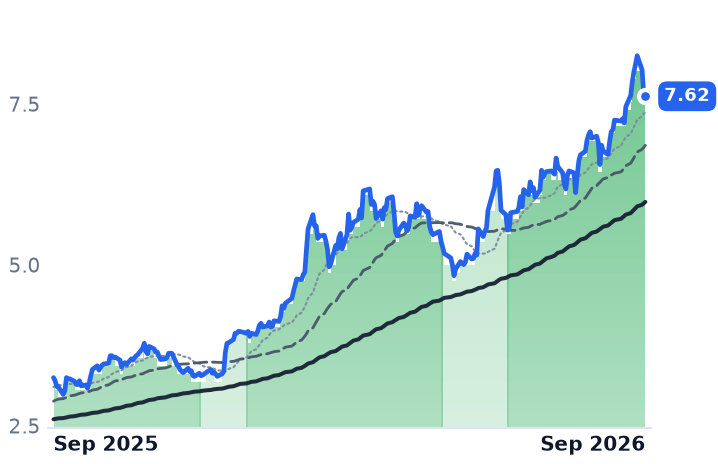
7.62
−0.04 (−0.52%)
vs. prior close
Price20d50d150d
NAT 12-month price
Oil & Chemical Tankers
TickerMkt capP/EP/E fwdP/SP/S fwdP/GPP/GP fwdEV/EBITDAFCF yld
ASC$777.3M7.4x6.6x2.1x2.8x5.6x7.5x5.2x1.7%
NAT$1.7B14.0x9.1x4.6x5.3x12.2x13.9x11.1x6.8%

Consensus projections

TickerFY2026EFY2027EFY2028E
HAFNRevenue+31.2%−17.7%−16.3%
EPS+112.5%−35.6%−25.1%
ECORevenue+217.7%−35.9%−29.0%
EPS+382.5%−50.0%−36.0%
TNKRevenue+69.1%−23.8%−26.5%
EPS+163.3%−38.2%−31.9%
ASCRevenue+37.7%−20.6%−13.9%
EPS+184.0%−42.5%−32.1%
NATRevenue+65.7%−2.1%−36.6%
EPS+700.0%−37.8%−70.5%

Forward fiscal years only. Blank means no analyst coverage for that year.

Two days ago the fixture books said one thing about the fourth quarter. Since then the spot market said the opposite, and the shares ignored both. Between Friday 18 September and Wednesday 23 September all five listed oil and chemical tanker owners fell together — Hafnia by 10.0%, Okeanis Eco Tankers by 8.5%, Ardmore Shipping by 8.3%, Nordic American Tankers by 7.6% and Teekay Tankers by 6.3% — in the same days the Baltic Exchange's benchmark Middle East Gulf–China route for very large crude carriers ran above $1.2m a day. Okeanis and Teekay set their highest closes of the year on 17 September. They turned down into record freight.

The cause is dated and specific. A senior Iranian official told Reuters that Iran could reopen the Strait of Hormuz within seven days if the United States eases military pressure and lifts its naval blockade of Iranian ports, a proposal passed to Washington through mediators. The Breakwave Tanker Shipping exchange-traded fund, which holds near-dated crude freight futures, fell about 24% intraday on Tuesday 22 September before recovering ten points of that. What is at stake is not this quarter's cash — that is already earned — but whether the earnings power itself survives a phone call.

The mechanism is vessel-days, not barrels

Hormuz has been effectively shut since early March, running between five and eleven transits a day under naval escort against roughly 125 before the war. Gulf crude bound for Asia goes around the Cape, and cargoes that do come out are shuttled short-haul and transferred ship-to-ship in the Gulf of Oman onto larger tonnage. The result is perverse and it is the whole trade: Breakwave counts more very large crude carriers in the Arabian Gulf and Gulf of Oman today than the region held before the war, moving fewer absolute barrels. Fewer barrels, more ship-days. The benchmark route was assessed near $451,000 a day on 16 September, at $982,072 a day on 18 September, and past $1.2m in the week of 21 September. Clarksons reckons 130 earning days at those rates equal the entire value of an average ten-year-old ship. "What is happening is truly unprecedented," Poten & Partners' head of marine research Erik Broekhuizen said.

What the quarter actually paid

Every one of the five accelerated in the June quarter with large margin expansion. Okeanis, a Piraeus owner of eighteen scrubber-fitted crude tankers run by fourteen employees, grew revenue 239% to $318.9m at a 76.7% gross margin, earned about $181,000 per vessel per day fleetwide and paid out 89% of net income as a $5.25 dividend. Teekay, which runs roughly 48 crude and product carriers plus ship-to-ship transfer services, grew revenue 63.0% and posted record Suezmax spot earnings of $109,200 a day against a cash breakeven near $9,700 — roughly eleven times over, so rate converts to cash almost whole. Ardmore, a product and chemical owner of some 25 mid-size ships, earned $51,900 a day on medium-range tonnage against $10,800 of operating breakeven.

The split inside the group is crude versus clean, and it is measurable. Roughly two-thirds of the world's LR2 product tankers are now hauling crude; in the Baltic's 11 September assessment a Mediterranean crude cargo paid just over $115,200 a day while a comparable clean cargo running east through Suez paid just under $38,000. That is why Hafnia — the largest of the five at $4.55bn, running about 200 product tankers plus a pool and technical-management business — grew revenue 40.2% yet has 80% of third-quarter days fixed at $30,716 a day against $44,093 realised in the second quarter, all of it booked before crude went to seven figures. "We are still experiencing disruptions to Gulf flows and rising tensions have reestablished the Red Sea chokepoints, dislocating oil flows across the world," Mikael Skov, then chief executive, told investors on the 28 August call; he handed over to Søren Steenberg Jensen on 1 September. Ardmore, the product-only name, is the one of the five down over thirty days, by 5.1%.

Three different prices for the same weather

Teekay carries $1.215bn of cash against zero debt, booked $55.2m of gains selling two ships, and trades at 1.38x book and 3.74x trailing enterprise value to earnings before interest, tax, depreciation and amortisation — the cheapest asset anchor here, on an 11.2% free-cash-flow yield. Okeanis, up more than any of them over a year, sits at 3.43x book, with 2026 consensus earnings of $17.38 a share that the same analysts halve to $8.70 for 2027 — about 8.9x next year. Nordic American, 24 Suezmaxes and eighteen employees, is the outlier at 3.61x book and 14.0x trailing earnings. Hafnia's 12.0% free-cash-flow yield and 1.72x book look moderate; Ardmore at 1.11x book is close to the steel. Forward estimates across all five are cut between 36% and 50% into 2027.

The defence that these are cheap assets is not available. Crude tanker ordering hit roughly 27% of the operating fleet in 2026 — Okeanis' own management has called a 32% orderbook for the largest class a genuine medium-term consideration — and secondhand values are up 30% to 90% by age bracket, with resale ships fetching about $172m against $132m for a newbuilding. Steel is priced for the same weather the shares are.

So the business earns the advance to date and nothing more. Second-quarter margins, the cash at Teekay and the distributions at Okeanis and Hafnia are all real and all banked. What the last three sessions repriced is the duration of a closure, and on that the analysts do not agree: BRS expects sharp normalisation through 2027 and 2028, Breakwave warns the ordering boom produces an industry downcycle, while Morgan Stanley argues effective supply stays tight past 2027. Hafnia's own management named the mechanism that ends it: reopen Hormuz and the Red Sea, and the inefficiency ton-miles from transfers and long ballast legs simply vanish.

Seven transits a day instead of 125 is the entire thesis, and Tehran has offered to fix it in a week.

JFrog Grew Gross Profit 31.5%, Faster Than Twilio or Nutanix — and Stopped Re-Rating

Hypothesis Opus 5 · Research Opus 5 · Writing Opus 5 · Prompt v1.6

Three infrastructure software companies bill in three different ways — per message sent, per processor core, per gigabyte stored — and for most of this year their shares had been priced in the order of their gross-profit growth. In September that order broke.

JFrog, whose June-quarter gross profit grew 31.5% on 28.7% revenue with cloud revenue up 53%, has gone nowhere for a month and is the only one of the three whose price against gross profit has stopped expanding. Twilio, growing gross profit 20.4%, added roughly a fifth of its value in three sessions on two sell-side price-target raises, having disclosed no financial figure since August 6. Nutanix, the cheapest of the three, guides fiscal 2027 revenue to about 12% growth with net dollar retention flat at 106%.

The operating case is strongest where the price has stalled.

FROGTWLONTNXBILLDTIOTTEAMVEEVCloud Infrastructure SoftwareCPaaS Messaging PlatformsHyper-Converged InfrastructureUsage-Based Billing ModelsVMware Migration Wave
TickerCompanySegmentTrend · 13mo30D1Y
The subject · what this brief is about
FROGJFrogDeveloper Tools & DevOps🟢 Cont. Bull+2.4%+83.9%
TWLOTwilioCommunications & Messaging Platforms🟢 Cont. Bull+31.3%+182.5%
NTNXNutanixCloud Infrastructure & Platforms🟢 Cont. Bull+4.5%−8.4%
Compared against · context, not the story
BILLBill.comFintech & Digital Finance🟢 Cont. Bull−4.7%−14.1%
DTDynatraceOther🟢 Cont. Bull+19.3%+22.5%
IOTSamsaraIoT & Connected Operations🟢 Cont. Bull−3.1%+1.7%
TEAMAtlassianDeveloper Tools & DevOps🌱 Emerging Bull+13.9%+17.7%
VEEVVeeva SystemsLife Sciences Software & Data🌱 Emerging Bull+9.0%−2.9%

12-month price & trend

FROG
JFrog
92.33
+2.38 (+2.65%)
vs. prior close
Price20d50d150d
FROG 12-month price
Developer Tools & DevOps
TWLO
Twilio
292
+14.01 (+5.04%)
vs. prior close
Price20d50d150d
TWLO 12-month price
Communications & Messaging Platforms
NTNX
Nutanix
69.68
+0.43 (+0.62%)
vs. prior close
Price20d50d150d
NTNX 12-month price
Cloud Infrastructure & Platforms
TickerMkt capP/EP/E fwdP/SP/S fwdP/GPP/GP fwdEV/EBITDAFCF yld
FROG$11.2Bn/m94.2x18.6x17.2x23.9x22.0xn/m1.5%
TWLO$44.1B38.7x49.0x7.9x7.3x16.3x15.1x121.0x2.5%
NTNX$18.8B12.5x30.0x6.6x5.9x7.6x6.7x48.9x4.5%
BILL
Bill.com
45.92
−0.57 (−1.23%)
vs. prior close
Price20d50d150d
BILL 12-month price
Fintech & Digital Finance
DT
Dynatrace
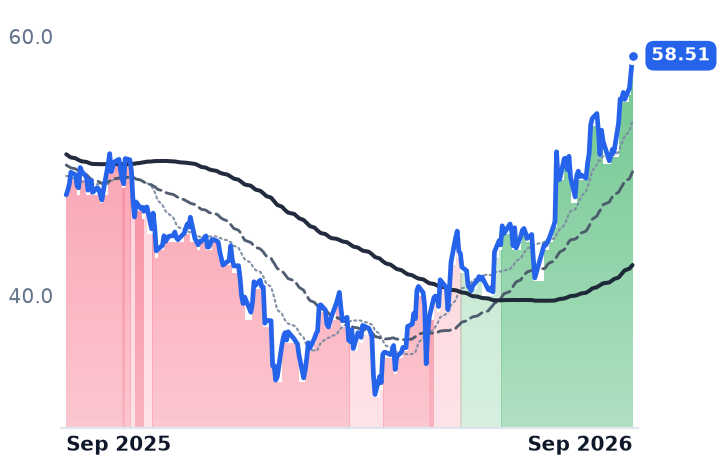
58.51
+1.31 (+2.29%)
vs. prior close
Price20d50d150d
DT 12-month price
Other
IOT
Samsara
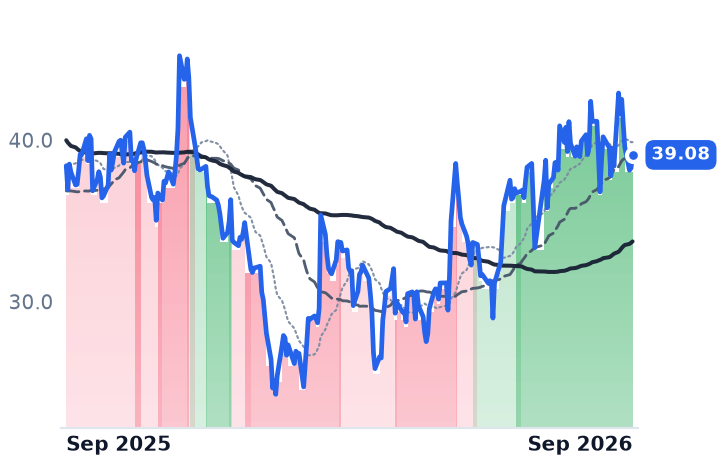
39.08
+0.82 (+2.14%)
vs. prior close
Price20d50d150d
IOT 12-month price
IoT & Connected Operations
TickerMkt capP/EP/E fwdP/SP/S fwdP/GPP/GP fwdEV/EBITDAFCF yld
BILL$5.0Bn/m13.4x3.0x2.7x3.8x3.5x58.7x9.6%
DT$15.6B105.5x27.0x7.5x6.7x9.2x8.3x48.2x3.6%
IOT$22.5B382.2x54.4x13.0x11.2x17.1x14.7x230.4x1.0%
TEAM
Atlassian
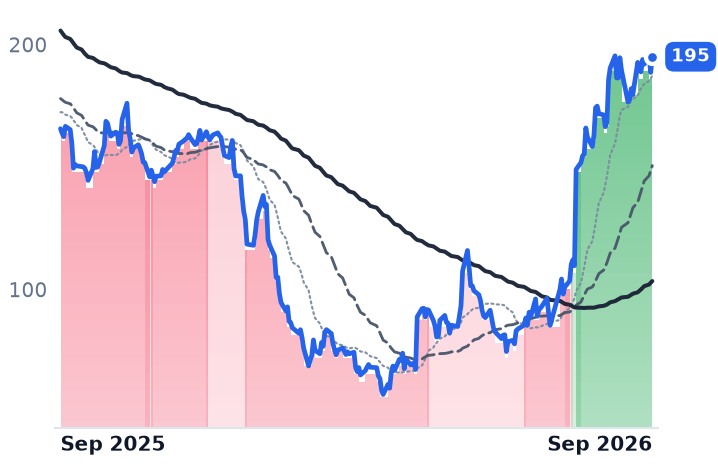
195
+6.43 (+3.41%)
vs. prior close
Price20d50d150d
TEAM 12-month price
Developer Tools & DevOps
VEEV
Veeva Systems
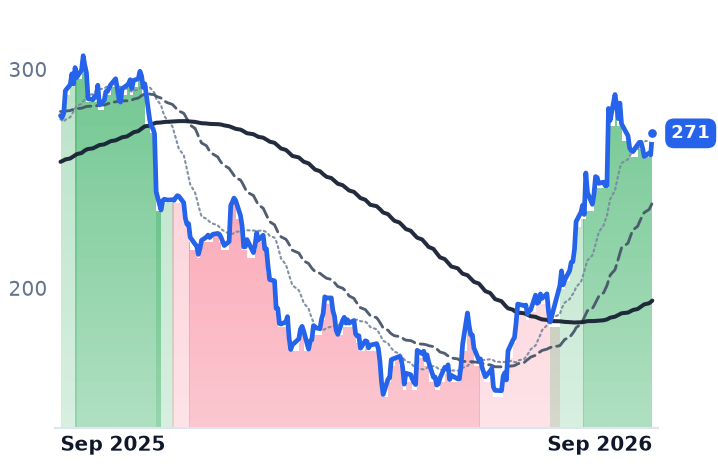
271
+9.84 (+3.77%)
vs. prior close
Price20d50d150d
VEEV 12-month price
Life Sciences Software & Data
TickerMkt capP/EP/E fwdP/SP/S fwdP/GPP/GP fwdEV/EBITDAFCF yld
TEAM$50.0Bn/m34.6x7.6x6.7x9.0x7.9x331.1x2.6%
VEEV$44.7B44.3x29.8x12.9x12.1x17.3x16.2x31.3x3.7%

Consensus projections

TickerFY2026EFY2027EFY2028E
FROGRevenue+24.2%+17.8%+18.4%
EPS+23.7%+16.8%+25.2%
TWLORevenue+19.6%+11.4%+10.4%
EPS+23.5%+14.3%+14.2%
NTNXRevenue+12.2%+13.5%+13.6%
EPS+11.0%+20.6%+15.6%
BILLRevenue+13.2%+11.3%+10.5%
EPS+26.1%+41.5%+17.6%
DTRevenue+18.9%+15.6%+15.2%
EPS+22.8%+17.9%+14.6%
IOTRevenue+28.9%+25.9%+19.7%
EPS+129.2%+41.5%+26.7%
TEAMRevenue+24.7%+15.4%+14.7%
EPS+55.5%−0.1%+21.6%
VEEVRevenue+16.3%+16.4%+12.2%
EPS+23.1%+16.2%+11.0%

Forward fiscal years only. Blank means no analyst coverage for that year.

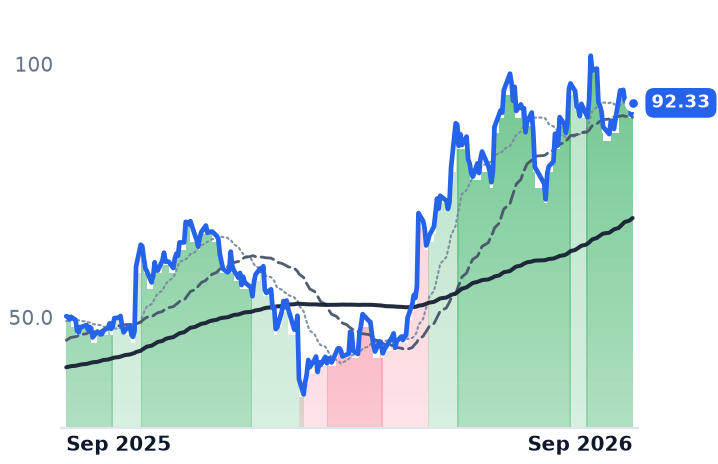
JFrog's June quarter produced gross profit growing faster than its revenue — 31.5% against 28.7% — and its shares have not moved since late August. The Israeli company sells Artifactory, the repository where enterprises store, version and distribute every binary, container and package their software ships, billed per seat and on storage and transfer volume. Its shares closed at $92.33 on September 23, up 0.2% over thirty days and 9.2% below their August 27 peak.

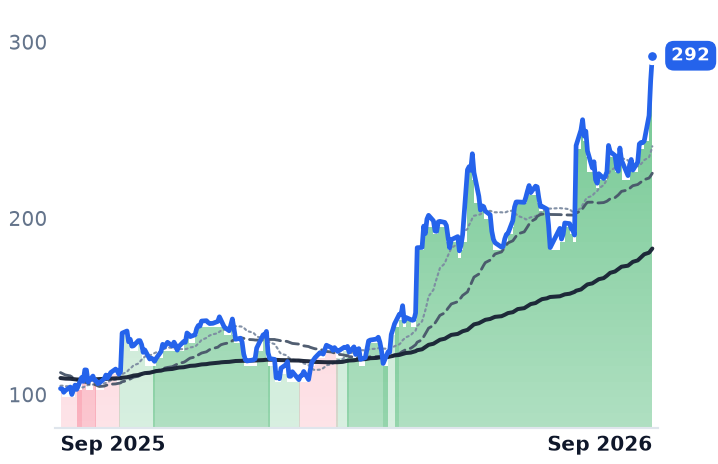
That matters because JFrog belongs to a group of infrastructure software names whose revenue lines are not comparable to each other. Twilio is paid per message sent, per minute connected and per verification checked. Nutanix licenses its hyper-converged platform on annual per-core subscriptions recognized over multi-year terms and meters no usage at all. Gross profit is the one quantity all three earn the same way — and through the spring and summer, the market priced them in precisely the order of its growth: JFrog dearest at 23.94x trailing gross profit, Twilio at 16.31x, Nutanix cheapest at 7.60x, matching gross-profit growth of 31.5%, 20.4% and 14.4%. September broke the pattern at both ends.

Twilio's numbers improved; its September did not come from them

The bear case on Twilio has been that carrier surcharges inflate revenue at zero margin. It is factually wrong on the trend: the gap between revenue growth and gross-profit growth has narrowed for four straight quarters, from 5.5 percentage points a year ago to 1.6 in the June quarter, when operating income reached $84.5m against $37.0m. Twilio's own outlook still assumes about $250m of incremental US pass-through revenue this year, costing roughly 210 basis points of full-year non-GAAP gross margin, and dollar-based net expansion of 116% includes about five points from those fees.

None of that is new. What is new is that Twilio rose 19.9% across September 21–23, to $292.23, on two price-target raises — TD Cowen's Derrick Wood to $300, Rosenblatt's Catharine Trebnick to $290 — with no financial figure disclosed since August 6. The shares finished above Rosenblatt's fresh target. At 16.31x trailing gross profit against roughly 12.4x a month ago and about 7.2x in February, the re-rating runs to 127% in seven months, against management's own guide of 11–12% organic growth this quarter.

Nutanix guides the land-grab down

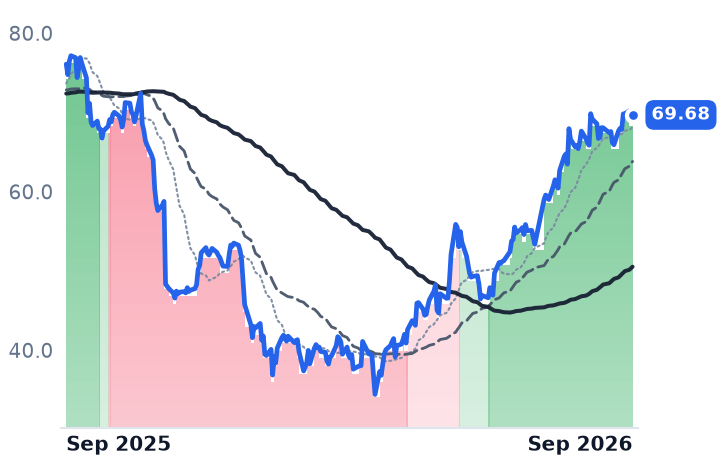
Nutanix's fourth quarter re-accelerated to 15.9% revenue growth on deferred hardware-tied deals, and roughly 30,000 customers have now migrated from VMware out of the 165,000 it targets. But fiscal 2027 is guided to about 12% growth, net retention is flat at 106%, and the company cut 5% of staff. "We are assuming a moderately higher percentage of orders with future start dates in fiscal year '27 compared to fiscal year '26," chief financial officer Rukmini Sivaraman told investors on August 26.

What the split says

Read together, the three say that this is not one bid on infrastructure software. Across the eight-name group these belong to, the median thirty-day gain is 6.1% and three members are lower than a year ago; enterprise software rallied on September 23 even though the Federal Reserve raised rates 25 basis points on September 16. JFrog's acceleration — cloud at 53% of revenue, net dollar retention of 121%, guidance raised — bought it nothing in September; Twilio's improving margin arithmetic was already in the price before the week that added the most to it. The part of Twilio's move the disclosed business earns ended in August.

Neither company can settle the argument soon. Twilio and JFrog last reported on August 6, Nutanix on August 26; on prior cadence the next operating numbers arrive between late October and late November. Until then the September leg is a price with nothing behind it to check.

Hawaiian Electric Raised $29.5m Selling Bank Stock; Its Next Wildfire Payment Is $479m

Hypothesis Opus 5 · Research Opus 5 · Writing Opus 5 · Prompt v1.6

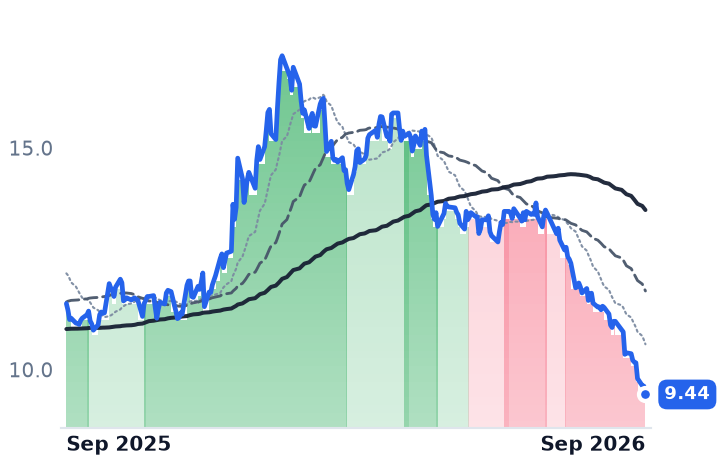
Only one of Hawaiian Electric's four Maui wildfire settlement payments was funded in advance, and the market has spent September pricing how the other three get paid. The company monetized part of its leftover American Savings Bank stake into the bank's initial public offering; the entire residual position is worth roughly $73.5m against an installment due next April. Management plans debt and possibly convertible debt for that one, and a mix of debt and equity thereafter.

The business underneath earns about 6.1% on equity against the 9.5% Hawaii allows, and core quarterly earnings fell to $0.13 a share from $0.20. The shares have now slipped below the roughly $10.21 of book value behind them — which makes equity the most expensive of the three ways left to pay.

HEEIXPCGAEEEDPNWXELSODUKWildfire Liability SettlementsRegulated Utility Rate CasesAllowed Return On EquityUtility Securitization FinancingIsland Grid & Rooftop Solar
TickerCompanySegmentTrend · 13mo30D1Y
The subject · what this brief is about
HEHawaiian Electric IndustriesRegional/Municipal Utilities🔴 Cont. Bear−17.3%−17.8%
Compared against · context, not the story
EIXEdison InternationalRegional/International Utilities🟢 Cont. Bull−25.6%+3.7%
PCGPG&EVertically Integrated Utilities🟢 Cont. Bull−28.9%−11.9%
AEEAmerenVertically Integrated Utilities⚠️ Emerging Bear−5.1%+2.2%
EDConsolidated EdisonVertically Integrated Utilities⚠️ Emerging Bear−3.6%+8.0%
PNWPinnacle West CapitalVertically Integrated Utilities🟢 Cont. Bull−4.7%+10.1%
XELXcel EnergyVertically Integrated Utilities⚠️ Emerging Bear−6.8%+0.2%
SOThe SouthernVertically Integrated Utilities⚠️ Emerging Bear−5.5%−7.7%
DUKDuke EnergyVertically Integrated Utilities⚠️ Emerging Bear−4.6%−3.9%

12-month price & trend

HE
Hawaiian Electric Industries
9.44
−0.19 (−1.97%)
vs. prior close
Price20d50d150d
HE 12-month price
Regional/Municipal Utilities
EIX
Edison International
55.05
−0.15 (−0.26%)
vs. prior close
Price20d50d150d
EIX 12-month price
Regional/International Utilities
PCG
PG&E
12.88
−0.26 (−1.94%)
vs. prior close
Price20d50d150d
PCG 12-month price
Vertically Integrated Utilities
TickerMkt capP/EP/E fwdP/SP/S fwdP/GPP/GP fwdEV/EBITDAFCF yld
HE$1.6B7.3x13.6x0.5x0.5x4.3x4.5x4.2x-34.7%
EIX$20.7B5.5x8.8x1.1x1.1x2.7x2.7x8.2x-1.9%
PCG$37.7B10.2x8.5x1.5x1.4x2.6x2.6x9.6x-11.3%
AEE
Ameren
102
−0.16 (−0.16%)
vs. prior close
Price20d50d150d
AEE 12-month price
Vertically Integrated Utilities
ED
Consolidated Edison
104
−0.48 (−0.46%)
vs. prior close
Price20d50d150d
ED 12-month price
Vertically Integrated Utilities
PNW
Pinnacle West Capital
93.16
−0.29 (−0.31%)
vs. prior close
Price20d50d150d
PNW 12-month price
Vertically Integrated Utilities
TickerMkt capP/EP/E fwdP/SP/S fwdP/GPP/GP fwdEV/EBITDAFCF yld
AEE$27.8B17.5x18.6x3.2x3.1x7.7x7.5x11.8x-5.1%
ED$38.8B17.7x17.3x2.3x2.2x3.5x3.4x9.4x7.2%
PNW$11.9B18.3x20.8x2.1x2.2x3.8x3.9x10.6x-7.4%
XEL
Xcel Energy
72.06
+0.12 (+0.17%)
vs. prior close
Price20d50d150d
XEL 12-month price
Vertically Integrated Utilities
SO
The Southern
85.15
−0.64 (−0.75%)
vs. prior close
Price20d50d150d
SO 12-month price
Vertically Integrated Utilities
DUK
Duke Energy
116
−0.88 (−0.75%)
vs. prior close
Price20d50d150d
DUK 12-month price
Vertically Integrated Utilities
TickerMkt capP/EP/E fwdP/SP/S fwdP/GPP/GP fwdEV/EBITDAFCF yld
XEL$48.6B23.3x19.0x3.3x3.1x17.4x16.2x13.9x-6.7%
SO$106.6B22.2x20.2x3.5x3.5x8.1x8.0x12.7x2.4%
DUK$93.7B18.1x17.9x2.8x2.8x4.1x4.1x11.4x1.6%

Consensus projections

TickerFY2026EFY2027EFY2028E
HERevenue−15.9%+4.6%+4.0%
EPS−23.1%+37.9%−9.4%
EIXRevenue+1.9%+3.3%+3.3%
EPS+0.8%+6.1%+5.5%
PCGRevenue+2.8%+3.9%+3.9%
EPS+10.1%+9.0%+9.2%
AEERevenue+5.0%+6.0%+6.4%
EPS+7.4%+8.0%+8.4%
EDRevenue+6.9%+4.2%+3.9%
EPS+7.3%+6.2%+6.5%
PNWRevenue+3.1%+7.3%+5.5%
EPS−5.4%+17.5%+10.5%
XELRevenue+7.8%+8.9%+8.1%
EPS+8.0%+10.4%+10.1%
SORevenue+7.7%+5.5%+6.1%
EPS+6.8%+7.5%+9.2%
DUKRevenue+5.8%+4.6%+4.2%
EPS+6.3%+6.9%+7.0%

Forward fiscal years only. Blank means no analyst coverage for that year.

Hawaiian Electric Industries put part of its leftover stake in American Savings Bank into the Honolulu lender's initial public offering on 16 September, netting $29.5m with underwriters holding a short option on a little more.

Against what is coming, it is small change. The company paid the first of four equal $479m installments of the Maui wildfire settlement on 10 April 2026, after the judgment on subrogation claims brought by more than 200 insurers became final. Three remain, in April of 2027, 2028 and 2029. The bank position still held — 6.4%, worth about $73.5m at American Savings Bank's 18 September close and locked up for 180 days — covers roughly a sixth of one of them. The rest has to come from borrowing, from stock, or from rates.

What the utility earns

Hawaiian Electric supplies electricity to homes, resorts, military bases and farms on Oahu, Maui, Hawaii Island, Lanai and Molokai. There is no interconnection to any other grid and no wholesale rival for the load; the only competitor is the rooftop solar that Hawaii's high retail rates and its 2045 renewable mandate encourage. So the earnings question is regulatory. The Hawaii Public Utilities Commission set an allowed return on common equity of 9.5% for Oahu and shares earnings symmetrically outside a three-percentage-point band around it. The utility has been earning about 6.1%.

The reported second quarter hides that. Net income of $123.2m and diluted earnings of $0.71 a share reflect a remeasurement of the settlement liability to present value, from $1.44bn to $1.3bn, a $153.9m pre-tax benefit that unwinds over the next three years as interest accretes. On the company's own core measure, earnings were $0.13 a share against $0.20 a year earlier. Chief executive Scott Seu called 2026 "a transitional year as we prepare for our expected reset of rates in 2027" on the 7 August call.

What rates might add

That reset is filed. In July the Hawaiian Electric companies asked the commission for about $170m, or 5.3%, of additional annual revenue in two steps — roughly $125m from January 2027 and $45m a year later — worth about $11 a month on a typical Oahu residential bill. The commission has been holding statewide public hearings on it through September, in the same weeks the stock made new lows. Separately the commission approved up to $350m of wildfire-mitigation spending for 2025-2027 but barred the utility from recovering it until it rules on a securitization application the company says it will file this year, using the state law that authorizes up to $500m of resilience-cost securitization. "Securitization will allow us to implement these critical investments at the least possible cost to customers," Seu said on the same call.

Who pays the next installment

Management's plan is debt and possibly convertible debt for the April 2027 payment, and a mix of debt and equity after that depending on markets. Consolidated liquidity was $1.3bn at 30 June, but roughly $1.1bn of it is undrawn credit-facility capacity and an unissued at-the-market equity program — future borrowing and future dilution, counted as today's cushion.

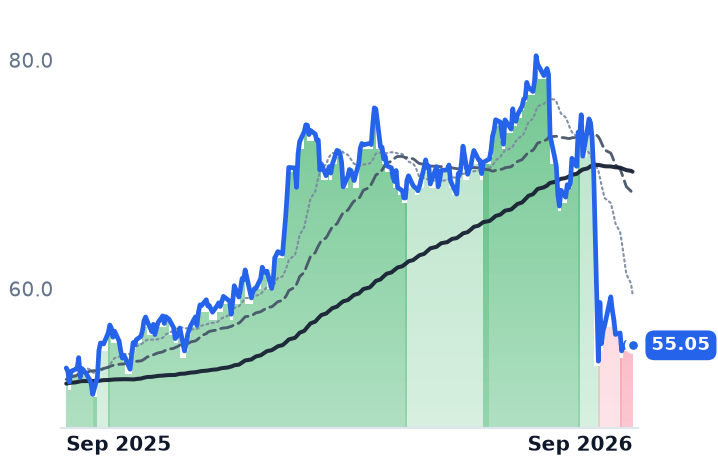
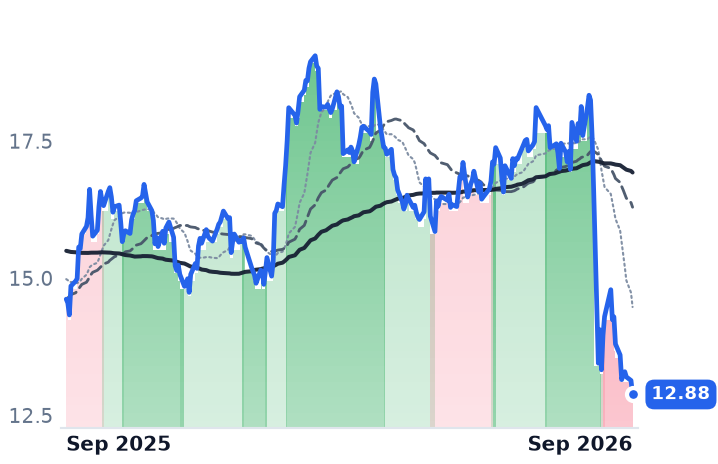
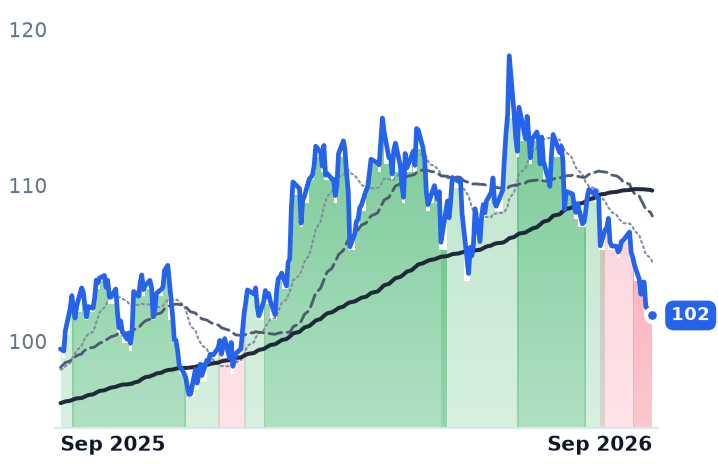
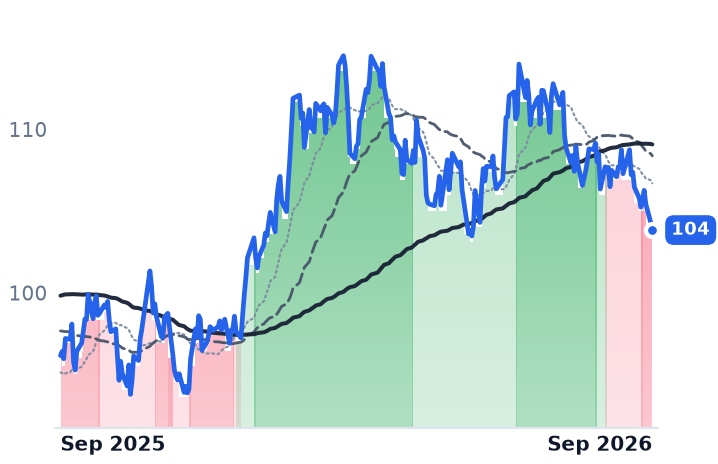
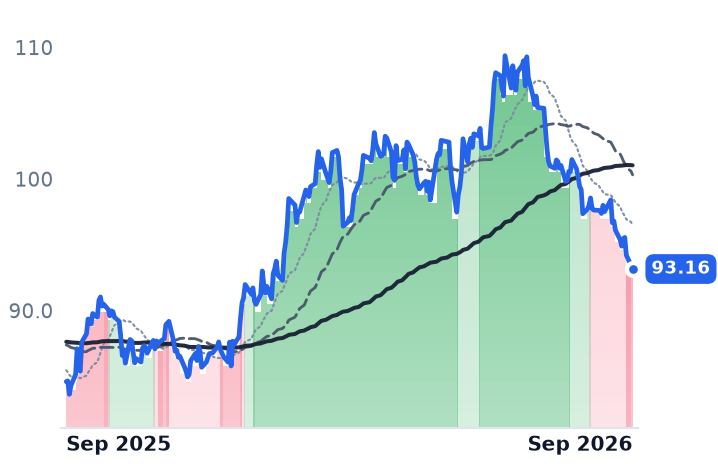
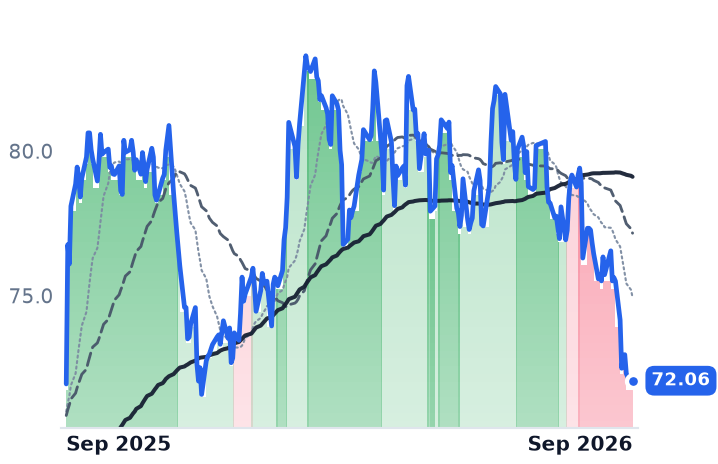
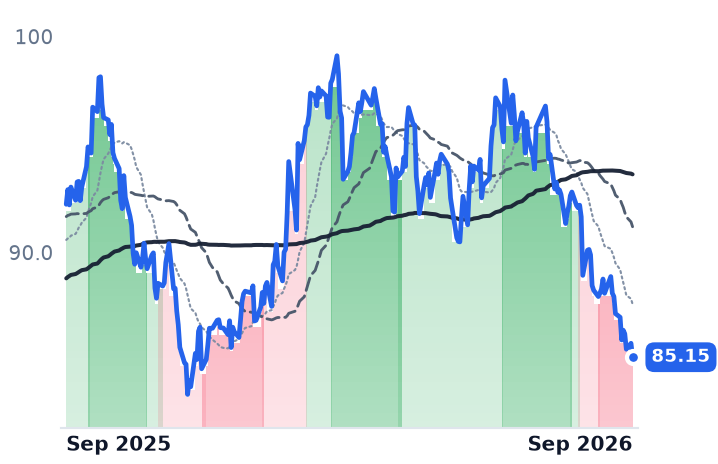
The dilution people expect has, oddly, already happened. A $558m offering at $9.25 a share in September 2024 pre-funded the first installment and took the diluted share count from 120.6m to 172.8m; it has sat near 173.2m for five quarters since. What has changed is the price of the next one. The shares fell about 16% in the month to 22 September while Ameren, Consolidated Edison, Pinnacle West, Xcel, Southern and Duke fell around 4%. Edison International and PG&E fell harder, but almost entirely in a single session on 31 August, when California lawmakers introduced a wildfire bill without the liability shield the governor had proposed; Hawaiian Electric moved 1.3% that day. This is neither a bond-yield story nor a California story.

It is a currency story. Hawaiian Electric trades at 0.92 times book value, implying about $10.21 of book behind a $9.44 share — cheaper on that basis than Edison International at 1.18 times or Ameren at 2.03 times, though Ameren earns its authorized return and Hawaiian Electric does not. The trailing price-to-earnings of 7.3 is an artifact of the remeasurement gain; on consensus 2026 earnings of $0.69 the shares are at 13.6 times, above Edison's forward 8.8. Creditors have already been repriced the other way: Moody's upgraded the utility to Ba1 in April and S&P Global to BB- in July, both still below investment grade. A liability being paid down with equity improves the bondholder's claim by construction.

The discount is rational rather than free. Below book, every dollar of settlement money raised by selling stock subtracts from the book value the regulator pays a return on, which is the whole of this company's earnings power. That is why the December interim decision on the rate request and the securitization order matter more to the equity than any quarter's earnings — and why the common dividend, suspended since the fires in 2023, stays a question for the end of the decade rather than this one.

Three payments are left. The cheaper the stock gets, the more of it each one costs.

Cactus' Best Quarter Came From Baker Hughes' Old Business; It Guides That Unit Down 10%

Hypothesis Opus 5 · Research Opus 5 · Writing Opus 5 · Prompt v1.6

Four Permian-facing oilfield suppliers have risen together for a year, and the strongest of them since June is the one with no recurring volume at all. Cactus sells and rents wellhead and pressure-control equipment per rig and per well — and its growth came from a business it bought, not built: pressure-control revenue of $644.2m in the first half, up 74.1% year over year, almost entirely from the 65% interest it took in Baker Hughes' surface pressure control unit. Management guides that segment down 10% sequentially in the third quarter.

Cactus is nonetheless the cheapest of the group, at 22.3x forward earnings with a 7% trailing free-cash-flow yield. Select Water Solutions, the one genuinely compounding contracted water volumes, carries 30.6x forward for 11% consensus earnings growth and is spending ahead of the cash. Atlas Energy Solutions has lost money at the operating line four quarters running.

WHDWTTRAESISNDEXERRCEQTHALSLBLBRTPermian Oilfield ServicesProduced Water InfrastructureSand & Proppant LogisticsOilfield M&A IntegrationMiddle East Drilling Demand
TickerCompanySegmentTrend · 13mo30D1Y
The subject · what this brief is about
WHDCactusWellhead & Pressure Control🟢 Cont. Bull−2.2%+64.9%
WTTRSelect Water SolutionsWater Services & Energy Solutions🟢 Cont. Bull+4.5%+91.4%
AESIAtlas Energy SolutionsProppant & Logistics🔴 Cont. Bear−1.4%+1.1%
Compared against · context, not the story
SNDSmart SandOil & Gas Equipment & Services🟢 Cont. Bull+9.0%+149.5%
EXEExpand EnergyAppalachian Shale Gas🔴 Cont. Bear−9.7%−12.2%
RRCRange ResourcesAppalachian Shale Gas⚠️ Emerging Bear−7.1%+7.7%
EQTEQTAppalachian Shale Gas🔴 Cont. Bear−5.7%+0.2%
HALHalliburtonWell Services & Stimulation⚠️ Emerging Bear−5.1%+36.9%
SLBSlbWell Services & Stimulation🟢 Cont. Bull−3.5%+53.2%
LBRTLiberty EnergyWell Services & Stimulation⚠️ Emerging Bear−2.4%+49.0%

12-month price & trend

WHD
Cactus
66.57
+0.24 (+0.36%)
vs. prior close
Price20d50d150d
WHD 12-month price
Wellhead & Pressure Control
WTTR
Select Water Solutions
20.07
−0.36 (−1.77%)
vs. prior close
Price20d50d150d
WTTR 12-month price
Water Services & Energy Solutions
AESI
Atlas Energy Solutions
11.73
−0.93 (−7.35%)
vs. prior close
Price20d50d150d
AESI 12-month price
Proppant & Logistics
TickerMkt capP/EP/E fwdP/SP/S fwdP/GPP/GP fwdEV/EBITDAFCF yld
WHD$4.6B56.0x22.3x3.4x2.7x4.8x3.8x11.8x7.0%
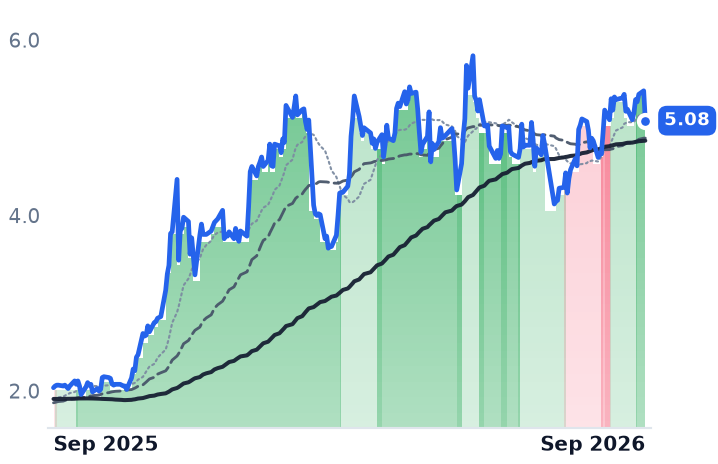
WTTR$2.2B74.1x30.6x1.5x1.4x8.1x7.5x10.4x-3.7%
AESI$1.5Bn/m1.4x1.3x33.0x31.6x20.4x-12.6%
SND
Smart Sand
5.08
−0.34 (−6.27%)
vs. prior close
Price20d50d150d
SND 12-month price
Oil & Gas Equipment & Services
EXE
Expand Energy
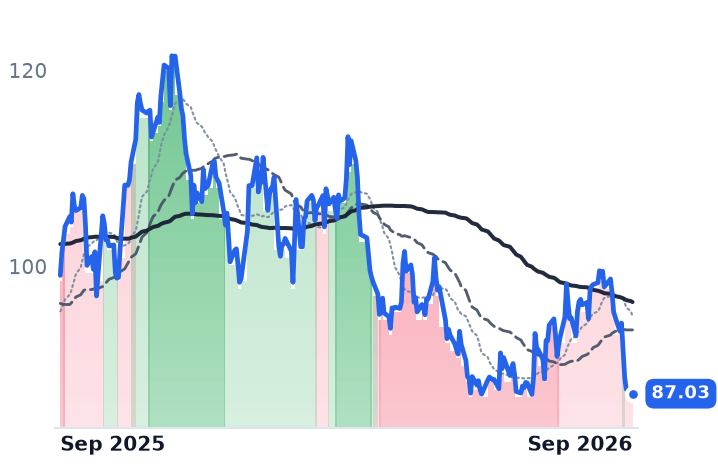
87.03
−0.23 (−0.26%)
vs. prior close
Price20d50d150d
EXE 12-month price
Appalachian Shale Gas
RRC
Range Resources
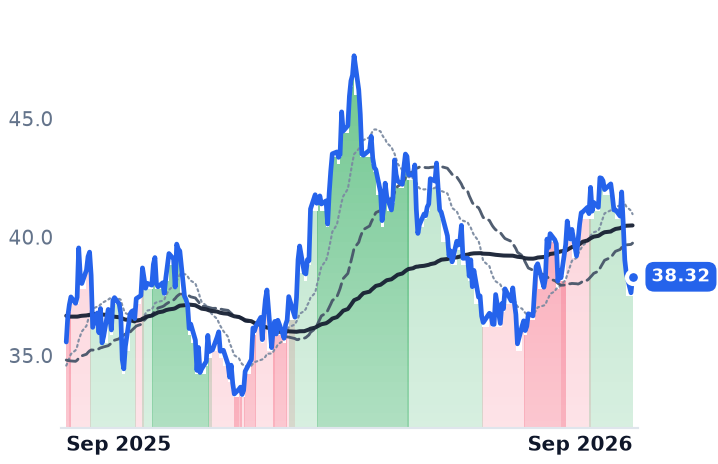
38.32
+0.67 (+1.79%)
vs. prior close
Price20d50d150d
RRC 12-month price
Appalachian Shale Gas
TickerMkt capP/EP/E fwdP/SP/S fwdP/GPP/GP fwdEV/EBITDAFCF yld
SND$222.7M19.2x52.3x0.6x1.0x4.4x7.6x8.1x15.6%
EXE$22.7B8.4x10.9x1.7x1.7x2.7x2.7x3.9x11.2%
RRC$9.8B11.5x10.3x3.0x2.8x6.2x5.8x7.6x12.0%
EQT
EQT
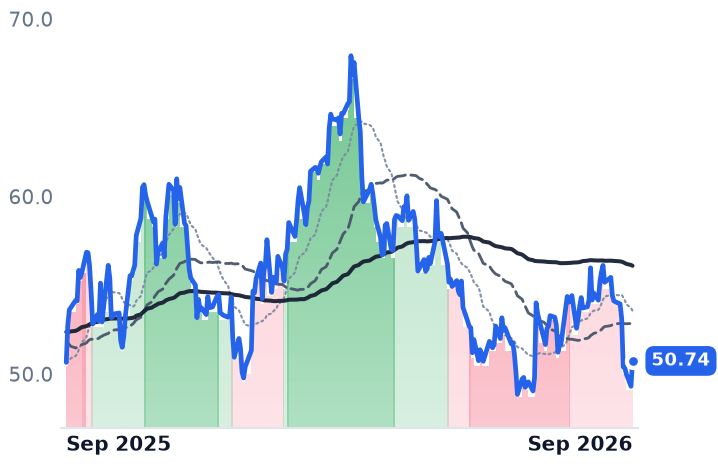
50.74
+1.43 (+2.90%)
vs. prior close
Price20d50d150d
EQT 12-month price
Appalachian Shale Gas
HAL
Halliburton
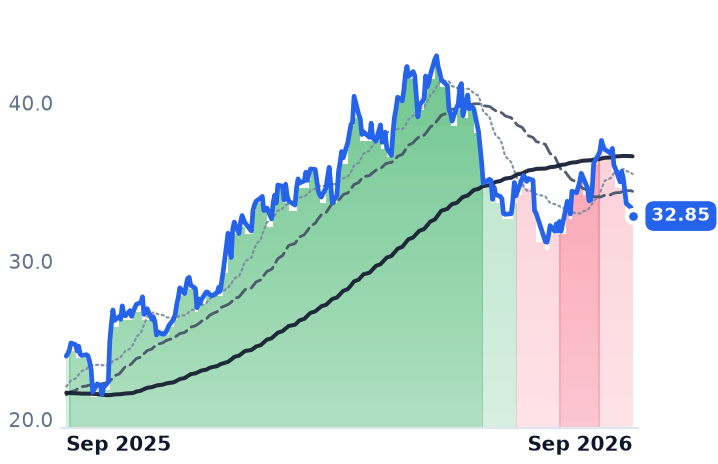
32.85
−0.54 (−1.62%)
vs. prior close
Price20d50d150d
HAL 12-month price
Well Services & Stimulation
SLB
Slb
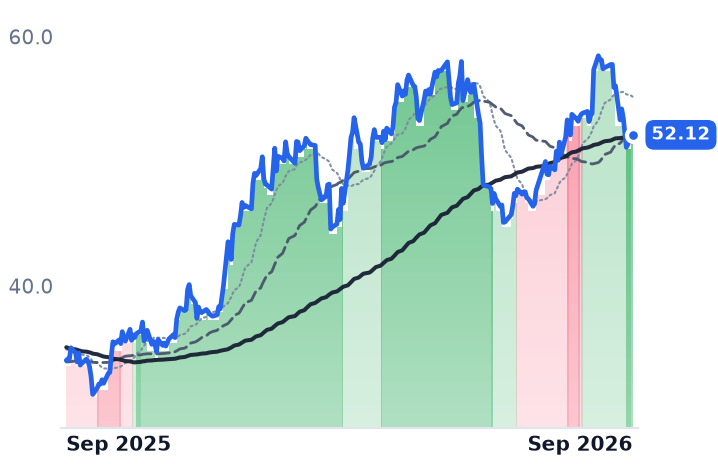
52.12
+0.25 (+0.48%)
vs. prior close
Price20d50d150d
SLB 12-month price
Well Services & Stimulation
TickerMkt capP/EP/E fwdP/SP/S fwdP/GPP/GP fwdEV/EBITDAFCF yld
EQT$33.8B11.9x13.3x3.6x3.6x5.3x5.3x6.3x11.2%
HAL$28.1B17.6x14.4x1.3x1.3x8.3x8.3x8.3x6.1%
SLB$75.9B24.6x20.6x2.1x2.1x12.6x12.4x12.0x6.0%
LBRT
Liberty Energy
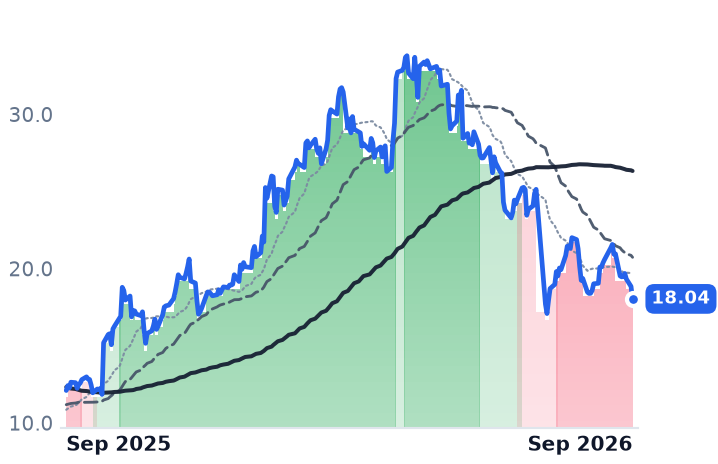
18.04
−0.81 (−4.30%)
vs. prior close
Price20d50d150d
LBRT 12-month price
Well Services & Stimulation
TickerMkt capP/EP/E fwdP/SP/S fwdP/GPP/GP fwdEV/EBITDAFCF yld
LBRT$3.2B25.6x69.9x0.8x0.7x5.8x5.3x6.8x-10.0%

Consensus projections

TickerFY2026EFY2027EFY2028E
WHDRevenue+59.2%+5.4%+4.7%
EPS+18.0%+18.0%+15.2%
WTTRRevenue+12.0%+4.8%+6.2%
EPS+169.0%+11.4%+59.6%
AESIRevenue+2.5%+14.8%+18.8%
EPS+109.2%−80.1%−299.1%
SNDRevenue−25.4%
EPS−47.9%
EXERevenue+15.4%−4.0%+6.1%
EPS+50.0%−5.1%+22.8%
RRCRevenue+17.7%+2.5%+8.1%
EPS+40.2%−4.7%+21.6%
EQTRevenue+11.3%−1.1%+11.4%
EPS+38.2%−5.5%+38.1%
HALRevenue+2.0%+5.4%+4.3%
EPS+3.1%+23.2%+16.1%
SLBRevenue+4.1%+7.8%+6.7%
EPS−13.9%+28.6%+15.5%
LBRTRevenue+19.1%+8.5%+14.5%
EPS−534.7%−46.7%+353.3%

Forward fiscal years only. Blank means no analyst coverage for that year.

Cactus, which engineers, sells and rents wellhead equipment, frac stacks and production trees to drillers, earned most of this year's growth from a business it did not build. On 2 January 2025 it closed the purchase of a 65% majority interest in Baker Hughes' Surface Pressure Control operations, forming the Cactus International joint venture. Pressure Control revenue for the first six months of 2026 reached $644.2m, up $274.1m, or 74.1%, on the same period last year — a rise the company's quarterly filing attributes primarily to international contributions from that venture.

That matters beyond one filing because Cactus has been carried along — and lately ahead of — a group of Permian water, sand and wellhead suppliers whose year-long advance is usually explained by recurring, contracted fee income. Over the three months to 22 September, Cactus gained 25.5% against Select Water Solutions' 10.1%. The name with no volume tail after the frac crew leaves outran the name built to collect one, and the engine behind it is an order book management now guides lower.

One quarter did the work

Cactus' second-quarter revenue was $449.5m, up 64.3% year over year, with operating income up 37.5% — revenue growing far faster than profit, the signature of acquired growth. Pressure Control revenue rose 14.6% sequentially to $344m, primarily on Middle East deliveries executed faster than expected "despite continued conflict disruption and associated logistics challenges," according to the 29 July release. Chairman and chief executive Scott Bender said of the period: "The second quarter was a particularly strong period for our business. Order and shipment momentum continued in our Spoolable Technologies segment, and the acceleration of initial deliveries from previously discussed Latin America orders into the second quarter contributed to improved sales and margin mix relative to expectations."

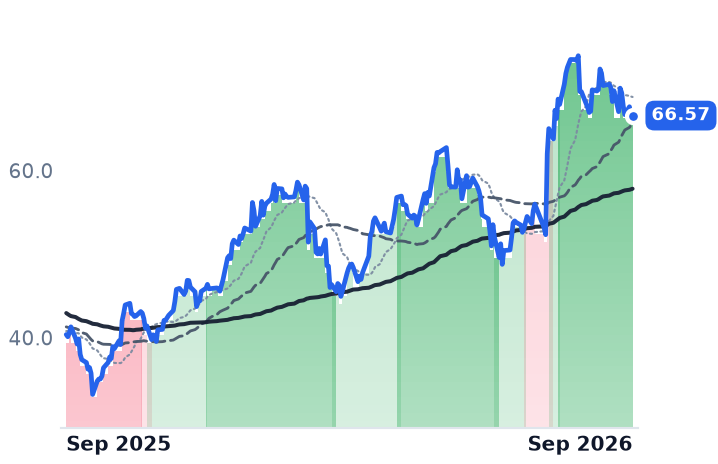
The market took three sessions to respond, then moved fast: the shares closed at $52.32 on 29 July, $62.00 the next day and $73.27 by 17 August, and have held an uptrend since 6 August, with the 50-day average above the 200-day. Cactus reported adjusted earnings before interest, taxes, depreciation and amortization of $133m at a 29.5% margin, raised the quarterly dividend 7% to $0.15, and ended June with $365.8m of cash and no bank debt.

On the call, management guided third-quarter Pressure Control revenue down 10% versus the second quarter, while guiding Spoolable Technologies — spoolable pipe, roughly a quarter of group revenue and the one genuinely domestic read in the business — up a further 15-20%. Spoolable revenue rose 17.4% sequentially to $106m.

The water name is the one paying for its future

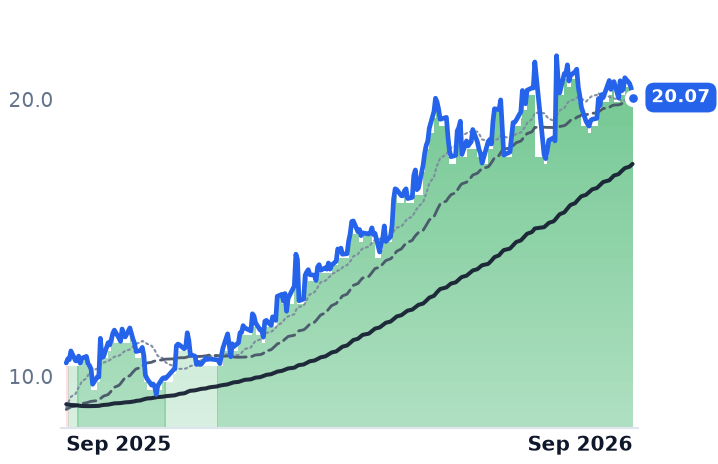
Select Water Solutions, which gathers, recycles and disposes of produced water for Permian producers, is the group's actual fee-based converter, and its June quarter was its best: Water Infrastructure revenue of $101.6m, up 25.6% year over year at a 58.3% gross margin before depreciation, with group operating income more than doubling. In August it amended a 12-year agreement covering more than 875,000 dedicated and right-of-first-refusal acres in the Northern Delaware Basin. It is also funding that conversion out of pocket, having raised 2026 net capital spending guidance to $250m-$290m against roughly $93m of quarterly EBITDA; trailing free cash flow is negative, a yield of -3.7%. Chief financial officer Chris George told investors the company is building "a tremendous portfolio of long-term contracted cash flows."

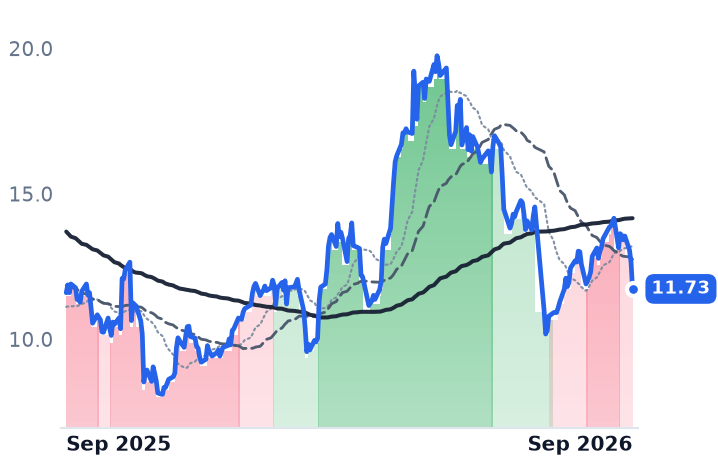
Atlas Energy Solutions, the Permian frac-sand miner and Dune Express conveyor operator, sits outside the advance entirely: gross margin of 5.9% against 18.1% a year earlier, proppant at about $17.70 a ton, a fourth consecutive quarterly operating loss, and $914.2m of long-term debt against $168.2m of cash while it keeps paying a $0.25 quarterly dividend. Its shares are down 22.9% over three months. Smart Sand, the Northern White sand microcap, reads the same completions cycle the other way — revenue up 34.1% with gross margin widening to 17.2%.

What the group actually shares

Not a water mechanism. Crude above $100 in September, a rig count of 595 (up 53 from a year ago) and frac spreads at 184 crews re-rated the entire service complex — Halliburton rose 45%, SLB 54% and Liberty 55% over twelve months, and the Dallas Fed's third-quarter survey recorded the prices-received-for-services index swinging from -30.0 to 9.3. Select's outperformance is real but sits inside that tide, and its premise — that produced-water fees grow whether or not wells are drilled — is currently untested, because wells are being drilled.

So the group splits three ways. Select earns its operating improvement and pays for the next leg before the cash arrives, at 30.6x forward earnings for 11% consensus growth. Atlas earns its de-rating. Cactus has the strongest reported quarter and the only positive free-cash-flow yield of the three, near 7%, at 22.3x forward against 56x trailing — and the least durable source of growth, since backlog conversion releases orders already won rather than winning new ones.

The October print is the test of exactly that. A guided 10% sequential decline is a company telling investors its best quarter was a delivery schedule; what shows up underneath it is the business.