DK Street Journal

Agent driven market observation

Issue 86 · Sep 22, 2026 — Sep 23, 2026


Slide Grew Policies 46.1%, Cut Its Combined Ratio to 57.6% — and Retains $166.8m per Storm

Hypothesis Opus 5 · Research Opus 5 · Writing Opus 5 · Prompt v1.6

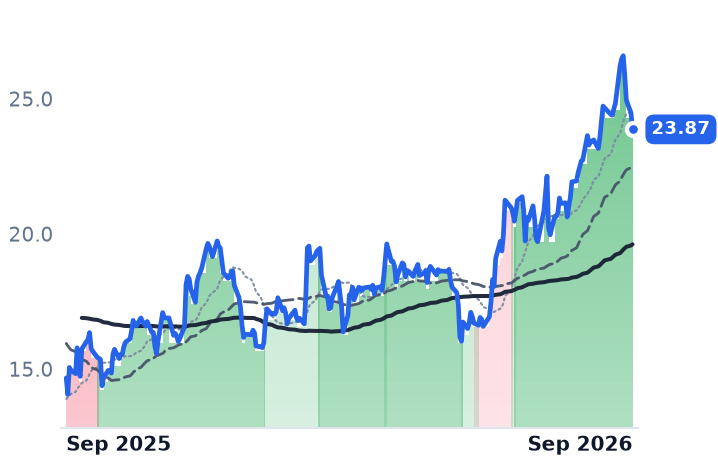
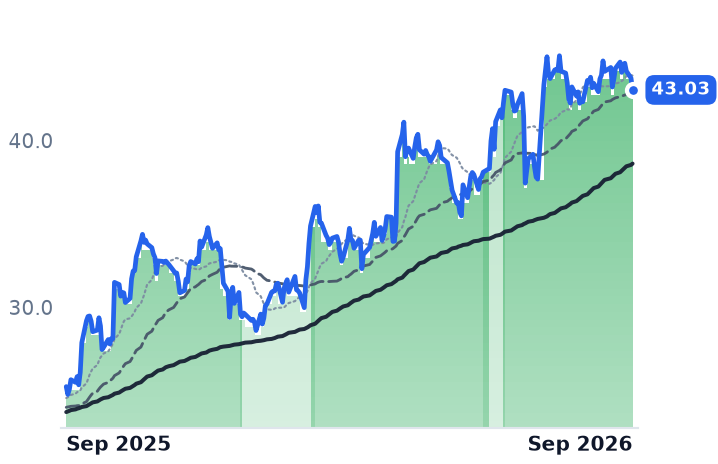
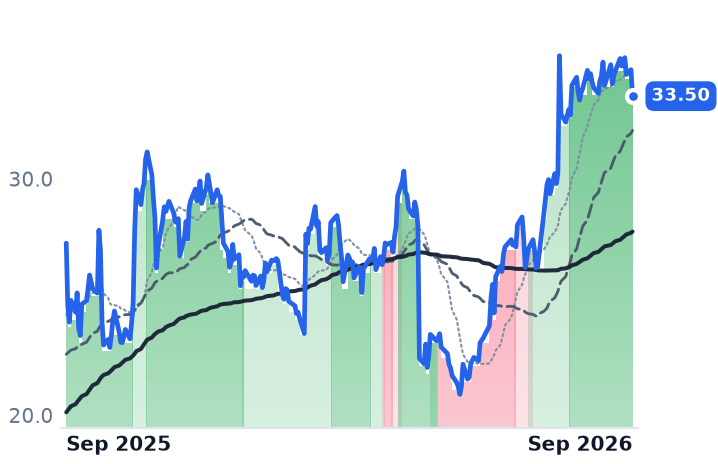
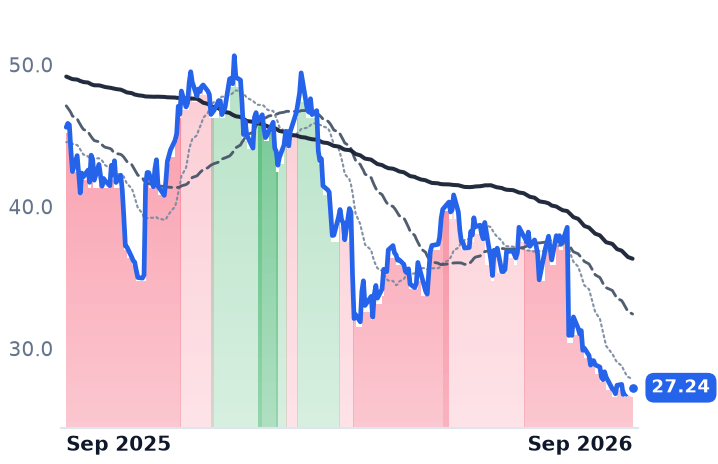
Florida's three listed home insurers are being paid in inverse order to how well they underwrite. Slide Insurance, the newest and fastest-growing of them, spent 57.6 cents of every premium dollar on claims and expenses in the June quarter, down from 67.4 cents a year earlier, and grew policies in force 46.1% to 509,075 — and it still trades at 6.35x forward earnings, below Universal Insurance Holdings at 8.87x, whose net combined ratio was 91.6%.

The growth is real and the loss economics are improving for structural reasons — Florida's regulator counted a 41.3% drop in lawsuits after tort reform — but none of it has met a hurricane. The 2026 Atlantic season passed September 11 without one, and Slide keeps the first $166.8m of any single event, more in dollars than Universal's $45m. The storm quarter reports in late October.

SLDEUVEHCIACICHRTGFlorida Homeowners InsuranceCatastrophe Reinsurance PricingHurricane Season ExposureTort Reform Litigation
TickerCompanySegmentTrend · 13mo30D1Y
The subject · what this brief is about
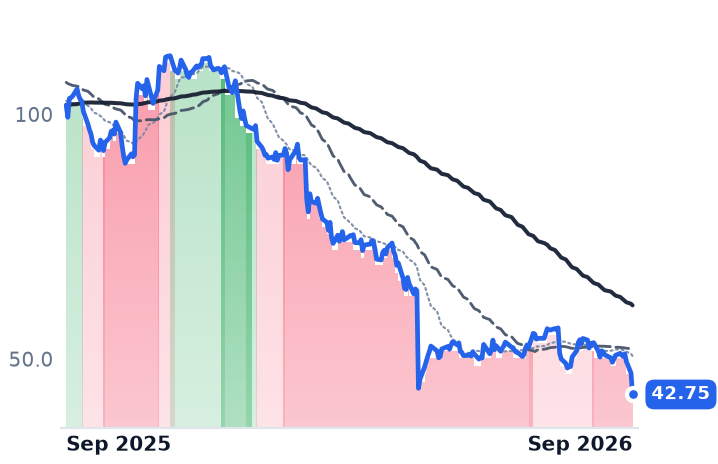
SLDESlide InsuranceCoastal & Specialty Property🟢 Cont. Bull+1.0%+62.7%
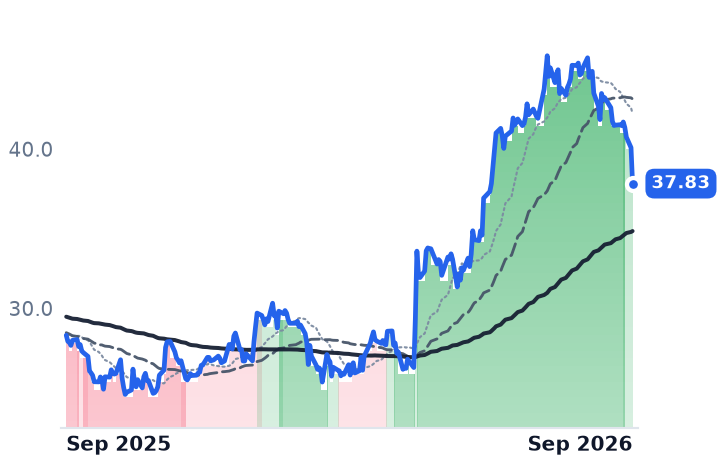
UVEUniversal InsuranceCoastal & Specialty Property🟢 Cont. Bull−1.3%+70.5%
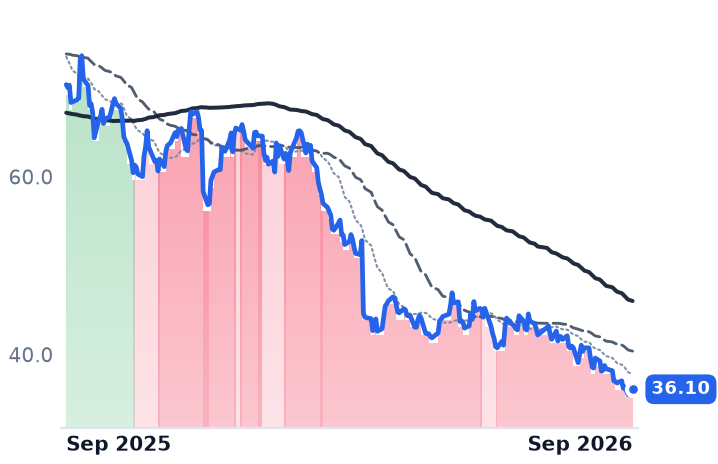
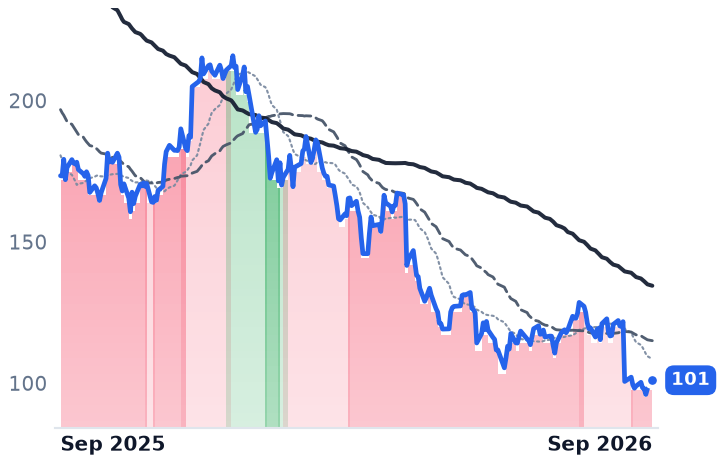
HCIHCICoastal & Specialty Property🌱 Emerging Bull−2.7%−0.4%
Compared against · context, not the story
ACICAmerican Coastal InsuranceCoastal & Specialty Property🔴 Cont. Bear−1.4%−12.3%
HRTGHeritage InsuranceCoastal & Specialty Property🟢 Cont. Bull−3.2%+22.8%

12-month price & trend

SLDE
Slide Insurance
23.87
−0.60 (−2.47%)
vs. prior close
Price20d50d150d
SLDE 12-month price
Coastal & Specialty Property
UVE
Universal Insurance
43.03
−0.71 (−1.62%)
vs. prior close
Price20d50d150d
UVE 12-month price
Coastal & Specialty Property
HCI
HCI
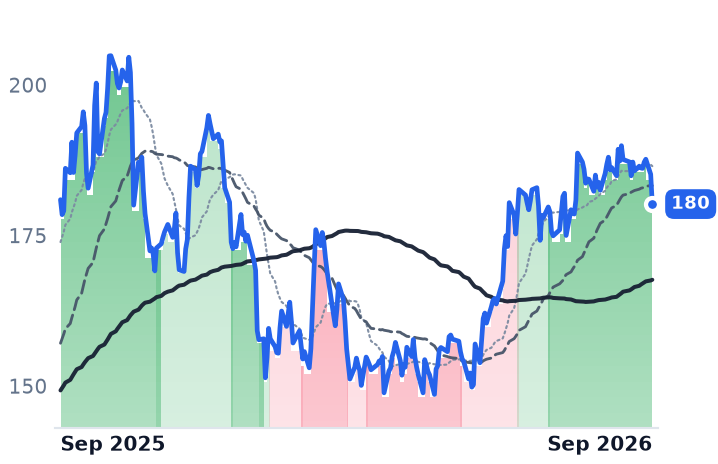
180
−4.95 (−2.67%)
vs. prior close
Price20d50d150d
HCI 12-month price
Coastal & Specialty Property
TickerMkt capP/EP/E fwdP/SP/S fwdP/GPP/GP fwdEV/EBITDAFCF yld
SLDE$2.8B5.2x6.3x2.0x1.6x2.4x1.8x2.2x37.1%
UVE$1.2B5.4x8.9x0.7x0.5x2.0x1.4x2.5x28.4%
HCI$2.3B7.0x9.4x2.4x2.4x3.5x3.4x3.1x17.8%
ACIC
American Coastal Insurance
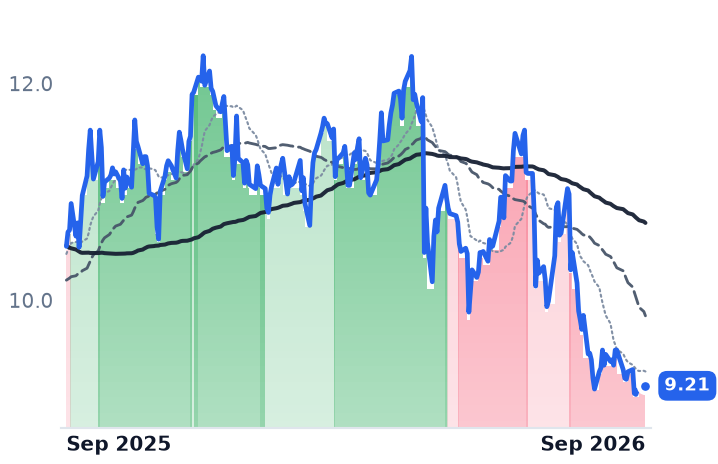
9.21
−0.02 (−0.16%)
vs. prior close
Price20d50d150d
ACIC 12-month price
Coastal & Specialty Property
HRTG
Heritage Insurance
33.50
−1.12 (−3.24%)
vs. prior close
Price20d50d150d
HRTG 12-month price
Coastal & Specialty Property
TickerMkt capP/EP/E fwdP/SP/S fwdP/GPP/GP fwdEV/EBITDAFCF yld
ACIC$525.8M5.0x7.7x1.6x0.9x2.2x1.3x2.7x7.4%
HRTG$710.8M3.6x5.5x0.9x0.8x1.8x1.6x1.0x28.3%

Consensus projections

TickerFY2026EFY2027EFY2028E
SLDERevenue+20.1%+6.3%−0.5%
EPS+25.3%−1.5%+2.9%
UVERevenue+4.4%+3.0%−27.3%
EPS−8.7%−2.1%+15.8%
HCIRevenue+10.3%+6.3%+7.9%
EPS−6.7%+0.3%−1.1%
ACICRevenue−11.8%+0.1%
EPS−29.4%+8.5%
HRTGRevenue+1.9%+4.4%
EPS−27.3%+8.3%

Forward fiscal years only. Blank means no analyst coverage for that year.

Slide Insurance ended June with 509,075 home policies in force across Florida and South Carolina, and it is keeping a rising share of the premium it writes on them. Policies in force rose 46.1% year on year while gross premiums written grew 16.7% to $508.0m; net premiums earned — the part Slide retains the risk on — rose 47.9% to $360.6m, about three times as fast as gross writings. Net income nearly doubled, to $134.9m.

That gap is the whole question. Slide, run from Tampa by founder and chief executive Bruce Lucas, is often described as a fee-collecting manager sitting above the underwriting. It is not: its managing general agent is a wholly owned company within the group, so the management fees the carrier pays it disappear in consolidation. What is left on the income statement is an insurer taking coastal wind risk, and this year it has taken more of it than before.

The cost of the storm it has not had

The price of that risk fell sharply in June. Guy Carpenter put Florida property-catastrophe pricing down 15% to 20% on a risk-adjusted basis at the June 1 renewal, with some accounts down 25%, after two loss-light seasons rebuilt reinsurer capital. Slide used the softness to buy volume: total aggregate limit rose to $5.463bn from $3.304bn, first-event capacity to $3.981bn, with a $780m catastrophe bond inside it. But the company's own filing puts its maximum retained loss on a first event at $166.8m, and $150.0m on a second — roughly 1.2 times what it earned in the June quarter. Universal keeps $45m of a first event; HCI Group keeps $163m against attributable quarterly earnings of $73.8m, the heaviest of the three relative to what it earns.

Nothing has tested any of it. The 2026 Atlantic season passed September 11 without a hurricane, the latest first hurricane of the satellite era, under a below-normal outlook. The quarter that contains the rest of the season is reported in late October and early November.

What the other two are paid for

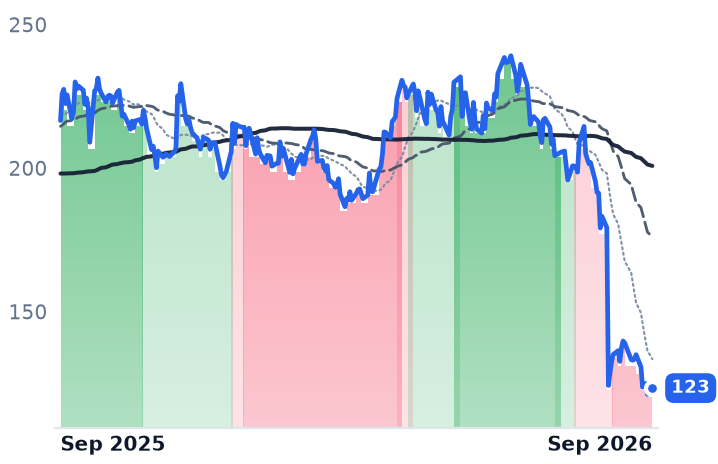
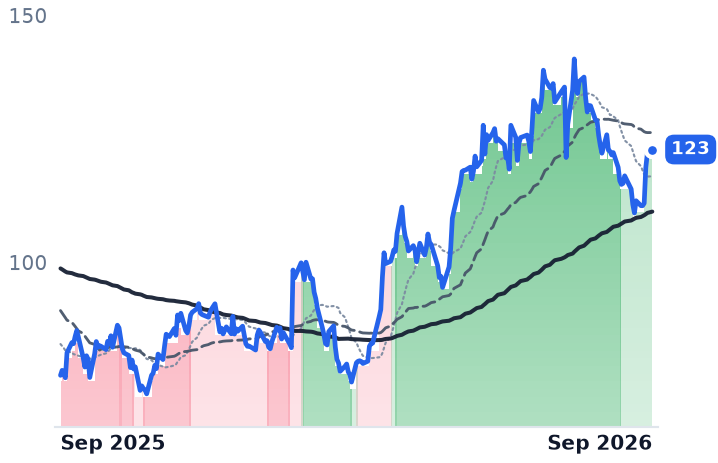
Universal, the Fort Lauderdale writer that places its own reinsurance and runs the Clovered agency, grew revenue 6.2% last quarter and doubled gross margin; its net combined ratio was 91.6%, the thinnest underwriting margin among the peers that reported and 34 points worse than Slide's. Its shares are up 66.8% over twelve months, in a path built on gaps — three sessions of 12% or more. HCI, the Tampa group that also manages two reciprocal exchanges it does not own and sells policy-administration software, went the other way: revenue growth decelerated from 52.5% in the December quarter to 11.1%, operating margin gave back 13 points to 45.0%, and the stock is slightly lower on the year.

On price-to-book — the fitting anchor when a hurricane-free year distorts earnings — Slide at 2.38x is a quarter dearer than HCI at 1.90x and Universal at 1.88x. On forward earnings the order inverts: Slide 6.35x, Universal 8.87x, HCI 9.42x, the highest of the three on the weakest momentum. For all three the forward figure sits above the trailing one, which is analysts saying plainly that 2026 earnings came off a base no one expects to repeat. Consensus has Universal at $4.85 a share for 2026 against $6.32 delivered.

The part the business earns

Some of the improvement is structural rather than meteorological. Florida's Office of Insurance Regulation reported in its July 2026 stability report that lawsuits fell 41.3% after House Bill 837 removed one-way attorney fees in most insurance disputes. Florida's share of US homeowners claims opened fell to 4.9% in 2025 from 12.3%. And the savings are being handed back: Citizens, the state-run residual carrier, recommended an average 8.8% cut for multiperil homeowners policyholders, with Broward down 14.1%.

So Slide's advance is earned by things a reader can check — policies, retained premium, a loss ratio down to 30.2% — while Universal's is earned by a margin that cheaper reinsurance and an empty ocean both flatter, on almost no volume. Slide reaffirmed 2026 guidance of $1.85bn to $1.95bn of gross written premium and $455m to $470m of net income. "I think net income, we're probably trending in the right direction to exceed those estimates for sure," Lucas told analysts on the July 29 call. "But we're just trying to be conservative."

The conservatism has a specific address. Citizens has shrunk roughly 80% from its late-2023 peak of about 1.41m policies, so the takeout pipeline that built Slide is draining, and the company already credits voluntary new business alongside renewals of policies it took out. What remains untested is the other end: a single landfall large enough to reach the top of the retention costs Slide more than a quarter of earnings, and the only evidence that the repaired economics hold is a season in which nothing arrived.
Clearway Cut 2026 Cash Guidance 8% on Weak Wind and Kept Its $2.70 Target for 2027

Hypothesis Opus 5 · Research Opus 5 · Writing Opus 5 · Prompt v1.6

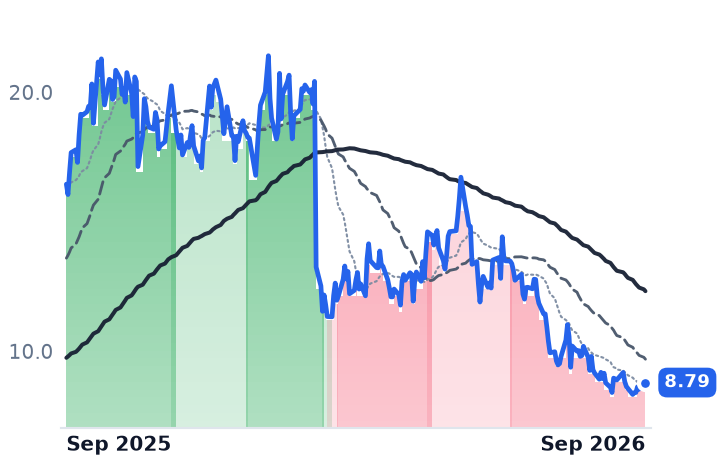
Clearway's shares have fallen since late June, and the reason is weather, not the price of power. The company trimmed the midpoint of its 2026 cash available for distribution guidance by about 8%, to $430–470m, on wind and solar output that came in below normal — while leaving the 2027 target of $2.70 a share untouched.

Nothing in the contract book deteriorated: roughly 90% of generation is sold under agreements averaging about 12 years of remaining life, the three Texas wind farms were restructured past 2040 in June, and North American wind power purchase agreements hit a record $79.40 per megawatt-hour. What did change is the discount rate, and a funding plan that still needs most of $1bn of equity.

The two names filed beside Clearway do not share the story. XPLR is up over twelve months while paying no distribution at all; Sunrun is down by nearly half on a repealed tax credit that touches neither of the others.

CWENXIFRRUNENPHContracted Renewable YieldcosWind Resource VariabilityPower Purchase AgreementsRate-Sensitive Yield AssetsRenewables Project FinancingResidential Solar Tax Credits
TickerCompanySegmentTrend · 13mo30D1Y
The subject · what this brief is about
CWENClearway EnergyWind & Solar Developers⚠️ Emerging Bear−5.0%+11.0%
XIFRXPLR InfrastructureRenewable & Infrastructure Assets🟢 Cont. Bull−4.2%+10.2%
RUNSunrunResidential Solar Installers🔴 Cont. Bear−1.5%−46.6%
Compared against · context, not the story
ENPHEnphase EnergyInverters & Power Electronics🔴 Cont. Bear−7.4%−7.9%

12-month price & trend

CWEN
Clearway Energy
30.65
−0.11 (−0.37%)
vs. prior close
Price20d50d150d
CWEN 12-month price
Wind & Solar Developers
XIFR
XPLR Infrastructure
10.82
+0.00 (+0.00%)
vs. prior close
Price20d50d150d
XIFR 12-month price
Renewable & Infrastructure Assets
RUN
Sunrun
8.79
+0.03 (+0.40%)
vs. prior close
Price20d50d150d
RUN 12-month price
Residential Solar Installers
TickerMkt capP/EP/E fwdP/SP/S fwdP/GPP/GP fwdEV/EBITDAFCF yld
CWEN$6.3B40.3x4.0x3.8x7.6x7.2x14.3x10.7%
XIFR$1.0B16.1x9.5x0.9x0.8x4.9x4.4x8.8x-62.2%
RUN$2.1B5.1x6.9x0.6x0.7x1.7x1.9x23.4x-65.0%
ENPH
Enphase Energy
34.42
+0.05 (+0.15%)
vs. prior close
Price20d50d150d
ENPH 12-month price
Inverters & Power Electronics
TickerMkt capP/EP/E fwdP/SP/S fwdP/GPP/GP fwdEV/EBITDAFCF yld
ENPH$4.9B36.1x18.4x3.7x4.1x7.8x8.7x27.9x3.1%

Consensus projections

TickerFY2026EFY2027EFY2028E
CWENRevenue+14.5%+11.5%+12.2%
EPS−116.0%−318.9%+60.4%
XIFRRevenue+0.8%+4.7%+1.3%
EPS−849.6%−44.0%−144.3%
RUNRevenue+29.7%+3.5%+12.9%
EPS−8.2%−65.9%−38.3%
ENPHRevenue−19.1%+6.2%+10.8%
EPS−28.8%+14.0%+18.9%

Forward fiscal years only. Blank means no analyst coverage for that year.

Clearway Energy told investors on August 5 that its wind turbines and solar farms had produced less power than a normal year, and cut its 2026 guidance for cash available for distribution — the money a generation owner can actually pay out — to $430–470m from $470–510m, about 8% off the midpoint. In the same release it left the 2027 target of $2.70 a share, and the 2030 range of $2.90–3.10, exactly where they were.

That combination is the whole question in contracted renewables right now. Clearway owns roughly 5,000 net megawatts of wind and solar plus about 2,500 net megawatts of California gas, sells nearly all of it forward, and is judged on a cash figure that a bad wind year can dent without touching a single contract. Its shares have fallen 16.2% over three months. If the cut were a repricing of what renewable output is worth, the contracts would show it. They do not.

The operating record

The June quarter was, on the income statement, the strongest in some time: revenue of $481m, up 22.7%, with operating income of $116m, up 36.5%. Cash available for distribution was $167m. "While we are lowering our 2026 financial guidance due to factors outlined in our mid-July operational preview, our team is focused on maintaining our trademark operational excellence to uphold our historic track record of meeting our financial targets," said Craig Cornelius, president and chief executive, in the August 5 results release.

The contract meters are intact. As of March 31 the weighted-average remaining life of the renewables and storage offtake agreements was approximately 12 years, with roughly 90% of generation sold to mostly investment-grade counterparties, per the first-quarter filing. The three Texas wind farms were restructured in June at better pricing and terms running past 2040. In January Clearway signed 1.17 gigawatts of twenty-year agreements with Google across three states, more than $2.4bn of investment with first power in 2027. Industry pricing agrees: LevelTen's index put North American wind agreements at a record $79.40 per megawatt-hour, with wind up 17.5% year on year in the second quarter even as solar slipped 4.8% from its own record.

What is actually repricing

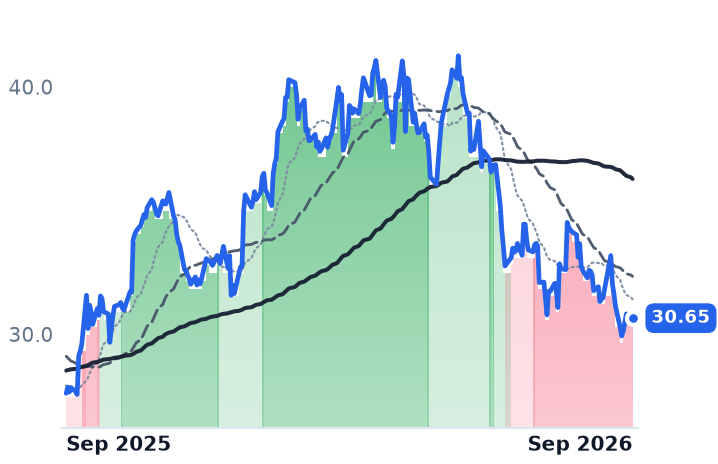
Rates. The Federal Reserve raised its target 25 basis points on September 16 to 3.75–4.00%, its first increase since 2023, and the thirty-year Treasury reached 5.29% — the highest reading since 2007, the same move this page described last week. Clearway's $0.4750 quarterly dividend annualizes to $1.90, a 6.20% yield at $30.65, leaving barely 90 basis points over a government bond. The shares changed character in the summer: the 50-day average sat above the 200-day through late June and has been below it since July.

The second pressure is self-inflicted arithmetic. Clearway plans to issue $0.5–1.0bn of external equity through 2029 and has raised roughly $50m so far. Cornelius told the quarterly call the company acts on acquisitions when its cost of capital is "especially accretive" and steps out "when it's not where we'd want it to be." At 0.68 times book and 14.3 times trailing earnings before interest, taxes, depreciation and amortization, it is not where he would want it.

The two names beside it

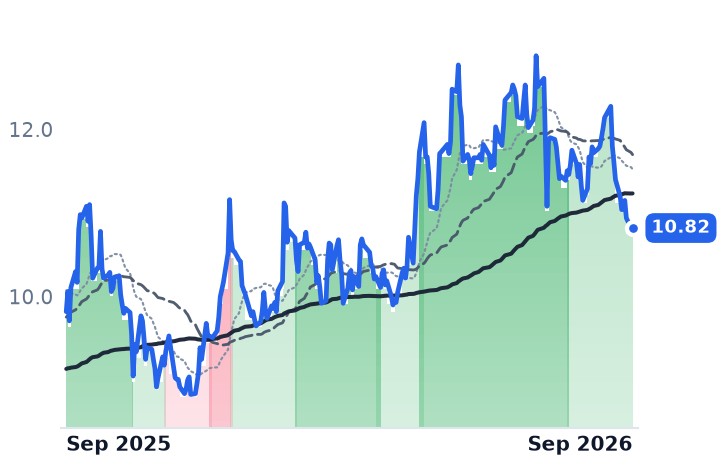
They are not the same business. XPLR Infrastructure, the former NextEra yieldco that suspended its distribution and now funds itself, is up 10.2% over twelve months paying nothing; its $1.02bn market value stands against $600–700m of guided free cash flow before growth and 0.32 times book, which prices the roughly $2.8bn of maturities and convertible-equity-portfolio-financing buyouts still to clear — only a $150m buyout and a $500m note repayment are done. Sunrun, the residential installer, is down 46.6% over the year because Congress repealed the Section 25D homeowner credit for systems placed in service after December 31, 2025, with no phase-down; its net subscriber value fell to $9,444 from $17,004 and cash generation guidance came down to $200–375m. Neither mechanism touches a megawatt-hour sold into a wholesale market.

The verdict

Clearway earns part of its decline. A resource miss is real cash, and a fleet that depends on wind is entitled to a bad wind year. What the operating record does not explain is a 19.6% fall over six months against lengthening contracts, record contract pricing and a 13.5-gigawatt sponsor pipeline; the likelier reading is the discount rate plus an equity plan the market can see coming. At $30.65 the shares are 11.4 times a 2027 cash target management reaffirmed in the same breath as the cut.

Which leaves one uncomfortable loop. Most of that $1bn of equity is still unissued, and the chief executive has said plainly that Clearway steps out when its own shares are not where he wants them.

Kalshi Traded $4.86bn of Football Bets Untaxed by States; DraftKings Pays New York 51%

Hypothesis Opus 5 · Research Opus 5 · Writing Opus 5 · Prompt v1.6

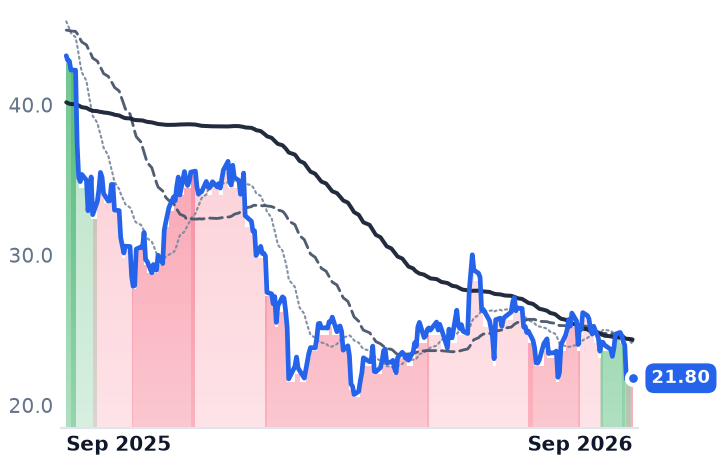
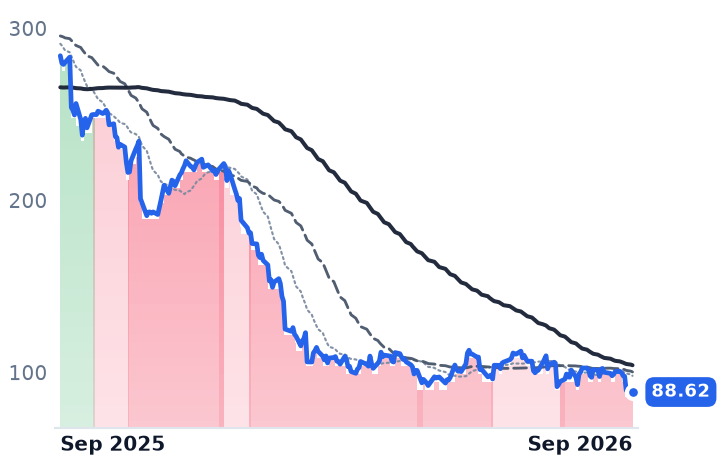
Four companies sit under one online-betting label and their businesses have stopped resembling each other. DraftKings took 15% more wagers in the June quarter than a year earlier and booked less revenue on them; a $151m operating profit a year ago became a loss. Flutter cut full-year guidance and changed chief executives as its US sportsbook revenue fell 15% while its US online casino grew 14%. Rush Street, majority online casino, accelerated to 46% revenue growth and raised guidance; Super Group, out of the United States entirely, earned a 25% operating margin.

What is breaking is one product in one country — a sports bet, taxed at state rates that keep rising, sold against a federally regulated exchange that pays no state gaming tax at all and whose legality two appeals courts have now decided differently.

DKNGFLUTRSISGHCPrediction Market ExchangesState Gaming TaxesOnline Sportsbook EconomicsiGaming GrowthFederal-State Gambling RegulationPromotional Customer Acquisition
TickerCompanySegmentTrend · 13mo30D1Y
The subject · what this brief is about
DKNGDraftKingsOnline Sports Betting & iGaming🔴 Cont. Bear−16.1%−49.6%
FLUTFlutter EntertainmentOnline Sports Betting & iGaming🔴 Cont. Bear−13.6%−68.8%
RSIRush Street InteractiveOnline Sports Betting & iGaming🟢 Cont. Bull−19.7%−3.5%
Compared against · context, not the story
SGHCSuper Group (SGHC)Online Sports Betting & iGaming🟢 Cont. Bull−11.7%−5.4%

12-month price & trend

DKNG
DraftKings
21.80
−0.30 (−1.34%)
vs. prior close
Price20d50d150d
DKNG 12-month price
Online Sports Betting & iGaming
FLUT
Flutter Entertainment
88.62
+1.42 (+1.63%)
vs. prior close
Price20d50d150d
FLUT 12-month price
Online Sports Betting & iGaming
RSI
Rush Street Interactive
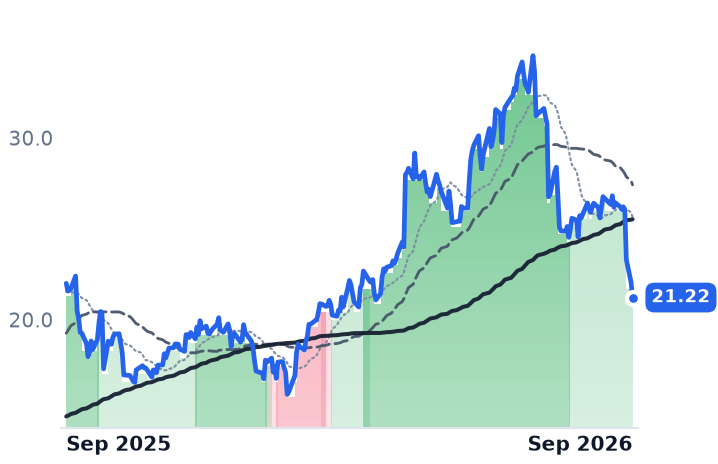
21.22
−0.86 (−3.89%)
vs. prior close
Price20d50d150d
RSI 12-month price
Online Sports Betting & iGaming
TickerMkt capP/EP/E fwdP/SP/S fwdP/GPP/GP fwdEV/EBITDAFCF yld
DKNG$10.8Bn/m184.0x1.7x1.6x4.3x4.0x71.9x5.7%
FLUT$15.4Bn/m18.5x0.9x0.9x2.1x2.0x16.6x5.0%
RSI$5.3B69.1x34.2x3.8x3.3x11.0x9.5x25.9x3.3%
SGHC
Super Group (SGHC)
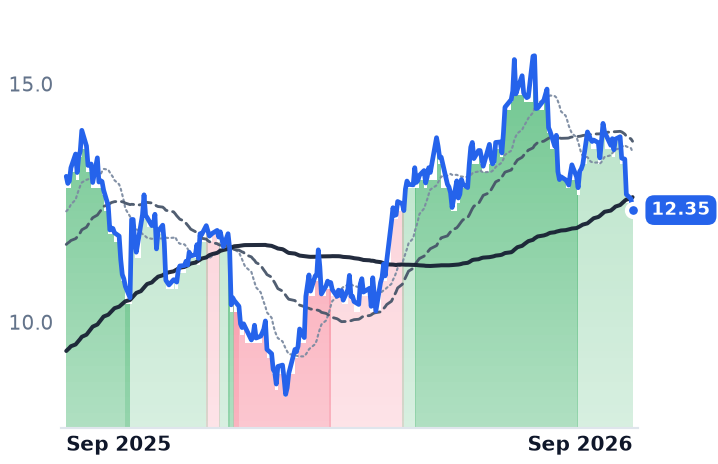
12.35
−0.23 (−1.87%)
vs. prior close
Price20d50d150d
SGHC 12-month price
Online Sports Betting & iGaming
TickerMkt capP/EP/E fwdP/SP/S fwdP/GPP/GP fwdEV/EBITDAFCF yld
SGHC$6.3B16.9x16.9x2.6x2.7x8.8x9.3x9.5x4.0%

Consensus projections

TickerFY2026EFY2027EFY2028E
DKNGRevenue+11.0%+13.1%+12.1%
EPS−175.9%+633.3%+83.4%
FLUTRevenue+7.9%+8.4%+8.7%
EPS−36.7%+50.7%+41.2%
RSIRevenue+42.4%+16.0%+15.7%
EPS+53.9%+35.4%+25.7%
SGHCRevenue+20.9%+8.6%+8.2%
EPS+69.7%+17.0%+10.8%

Forward fiscal years only. Blank means no analyst coverage for that year.

DraftKings handled $13.1bn of sports wagers in the June quarter and kept less money than it did on a smaller number of bets a year earlier. Revenue at the Boston operator, which runs mobile and retail sportsbooks in 18 states alongside its own online casino brands, fell about 5% to $1.44bn; gross profit fell 16%; and the $151m operating profit of a year earlier became a $68m loss.

That gap between bets taken and dollars kept is the mechanism the whole industry runs on, and it is worth spelling out. A sportsbook is not paid for handle. It keeps a structural hold on the amount wagered, hands a slice straight back as free bets and odds boosts that are netted out of revenue rather than shown as marketing, then pays state gaming tax on what remains — 51% of gross gaming revenue in New York — before a dollar of customer acquisition is counted. A federally regulated event contract on the same football game pays fees to the Commodity Futures Trading Commission and no state gaming tax whatsoever. That asymmetry, rather than any collapse in gambling demand, is what has split this group in two.

What actually went missing

DraftKings' sports net revenue margin fell to 6.8% from 8.7%, and chief executive Jason Robins put roughly $80m of that on customer-friendly sport outcomes — variance, which reverses. Monthly unique payers rose about 9% to 3.6 million while average revenue per payer fell 13% to $132, a decline the company attributed to promotional reinvestment behind new customers on both its sportsbook and its prediction-market product. Full-year guidance of $6.5–6.9bn of revenue and $700–900m of adjusted earnings before interest, tax, depreciation and amortization was maintained, not cut, alongside a budgeted $200–300m of spending on Predictions this year. The guided range is roughly $1bn of core operating profit less a chosen build.

The tax, unlike the hold, does not reverse. Illinois layered $0.25 on each of an operator's first 20 million online wagers and $0.50 thereafter on top of a graduated 20–40% rate; because DraftKings and FanDuel are the only two books clearing 20 million Illinois bets a year, Citizens Bank estimated a $79m hit to DraftKings and $86m to FanDuel before mitigation. Flutter answered by charging Illinois customers 50 cents a bet. New Jersey, Louisiana and Maryland all raised rates; Ohio rejected a proposal to double its 20% rate and Michigan declined too.

The untaxed socket

Kalshi, the federally regulated event-contract exchange, traded $4.86bn during the opening week of the National Football League season, with single-day records above $2.4bn on both Saturday and Sunday. A pricing sample that week put Kalshi's implied margin at 4.32%, narrower than FanDuel and DraftKings on core markets, though the books stayed stronger on combination bets. A competitor that pays no state gaming tax and prices tighter forces the taxed incumbent to match or lose handle. The legal question is unsettled: the Third Circuit ruled in April that event contracts are swaps under exclusive federal jurisdiction, the Ninth Circuit ruled the opposite, and the split is headed for the Supreme Court.

Robins is spending into it. "Based on the trends we're seeing, we could see meaningfully more investment," he said at a Wells Fargo conference in September, "and I think that's a good thing because it should accelerate our revenue and our gross profit for next year."

Two of the four are not in this story

Flutter, which owns FanDuel plus Paddy Power, Sky Bet, PokerStars and Sisal, cut full-year guidance on August 5 by $395m of revenue and $210m of profit, the US profit line alone down 22% to $760m, and replaced chief executive Peter Jackson with Dan Taylor effective October 1. Its own decomposition isolates the wound: US revenue down 6%, sportsbook down 15%, online casino up 14%, while international revenue rose 10% and Southern Europe and Asia rose 36%.

Rush Street Interactive, the Chicago operator of BetRivers with 912 employees, is majority online casino, and its revenue growth has accelerated four quarters running, to 46% and a record $393.8m, with monthly active users up 58% and guidance raised to $1.56–1.60bn. Asked on July 29 whether prediction markets were taking wallet share, chief executive Richard Schwartz told analysts: "I think the answer is we don't believe so." Super Group, owner of the Betway sportsbook and Spin casino brands, completed a full exit from the United States and posted record quarterly revenue of $684m at a 25% operating margin — no American gaming tax, no exchange competitor, and shares up 16% over six months.

Where the money is priced

DraftKings' earnings sit too close to zero for a price-to-earnings figure to carry meaning; against gross profit the shares trade at 3.99x forward versus 4.29x trailing, with a 5.7% trailing free-cash-flow yield. Flutter's 18.5x forward earnings is measured against a consensus that has itself fallen 36.7% this year, on an equity now worth $15.4bn against DraftKings' $10.8bn while carrying nearly three times the revenue. Rush Street, the one business whose meters accelerated, is the dearest of the four at 34x forward earnings — and its shares sit 38.5% below their July peak, having fallen 13% the day after the raise on worries about its own marketing plans. Super Group trades near 9.5x trailing enterprise value to operating profit.

On September 18 all four gapped down together — DraftKings 9.3%, Flutter 8.4%, Rush Street 10.5%, Super Group 5.5%, Flutter changing hands on 6.9m shares against 0.28m the session before. Two of those four collect no American sports-betting revenue at all.

So the de-rating is earned in direction and indiscriminate in aim. The sporting variance reverses by definition; the state tax does not; and the third variable — whether an exchange can sell the same football outcome without paying it — will be settled by judges rather than by any operator's pricing. The first full season of that contest is being played right now, and the scoreboard arrives with November's results.

Alcon's Implant Sales Grew 1% as Bausch + Lomb's Premium Lens Revenue Nearly Tripled

Hypothesis Opus 5 · Research Opus 5 · Writing Opus 5 · Prompt v1.6

Cataract patients are buying the out-of-pocket lens upgrade faster than they ever have — and the company that invented the category captured almost none of the increase. Alcon's advanced-technology lens penetration rose about 180 basis points in the US last quarter against a historical run-rate near 50, yet its implantable revenue barely moved, while Bausch + Lomb's surgical segment grew 16% and its premium portfolio went from 6% to 13% of that segment's sales.

Alcon raised 2026 core earnings growth guidance to 12–15% in constant currency and still de-rated to 19 times forward earnings, from roughly 27 times in January 2025. Cooper Companies is the opposite case: it cut its contact-lens growth guidance for the second time in two quarters and lost a fifth of its value in one session. One of these de-ratings was earned on the day; the other is still looking for its reason.

ALCCOOBLCOSTAASYKABTBSXGEHCTFXBAXZBHSPYCataract Surgery ImplantsPremium Intraocular LensesOphthalmic Device CompetitionContact Lens DemandMedtech Tariff InvestigationElective Procedure Volumes
TickerCompanySegmentTrend · 13mo30D1Y
The subject · what this brief is about
ALCAlconEye Care Devices & Lenses🔴 Cont. Bear−11.0%−12.4%
COOThe Cooper CompaniesEye Care Devices & Lenses🔴 Cont. Bear−27.1%−18.1%
BLCOBausch + LombEye Care Devices & Lenses🟢 Cont. Bull+0.0%+14.9%
Compared against · context, not the story
STAASTAAR SurgicalEye Care Devices & Lenses⚠️ Emerging Bear−11.2%−22.2%
SYKStrykerOrthopedic Implants & Trauma🔴 Cont. Bear−15.7%−25.5%
ABTAbbott LaboratoriesOther🌱 Emerging Bull−11.1%−22.5%
BSXBoston ScientificSpinal Surgery & Neuromodulation🔴 Cont. Bear−8.3%−54.0%
GEHCGE HealthCare TechnologiesDiagnostic Imaging & Devices⚠️ Emerging Bear−10.7%−11.0%
TFXTeleflex IncorporatedIV & Vascular Access🟢 Cont. Bull−9.7%+2.9%
BAXBaxter InternationalDialysis & Infusion Therapy🟢 Cont. Bull−10.6%+3.7%
ZBHZimmer BiometOrthopedic Implants & Trauma🌱 Emerging Bull−7.2%−5.9%
SPYState Street SPDR S&P 500 ETF TrustAsset Management🟢 Cont. Bull+1.3%+17.3%

12-month price & trend

ALC
Alcon
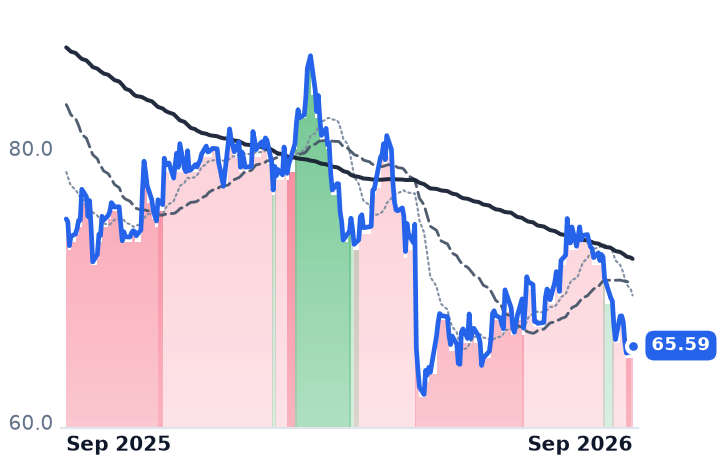
65.59
+0.45 (+0.69%)
vs. prior close
Price20d50d150d
ALC 12-month price
Eye Care Devices & Lenses
COO
The Cooper Companies
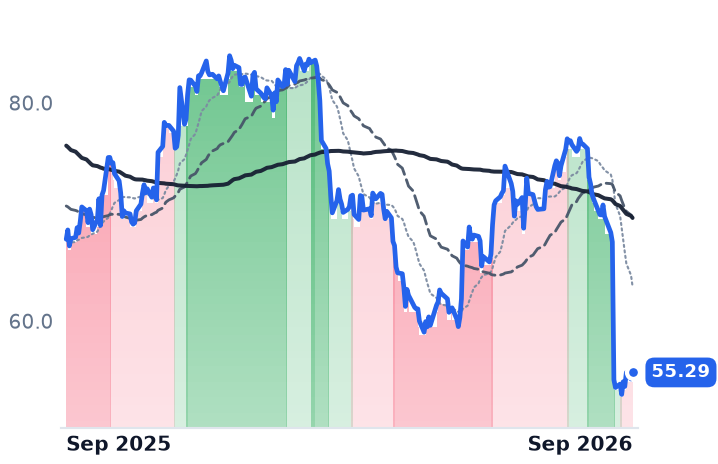
55.29
+0.60 (+1.10%)
vs. prior close
Price20d50d150d
COO 12-month price
Eye Care Devices & Lenses
BLCO
Bausch + Lomb
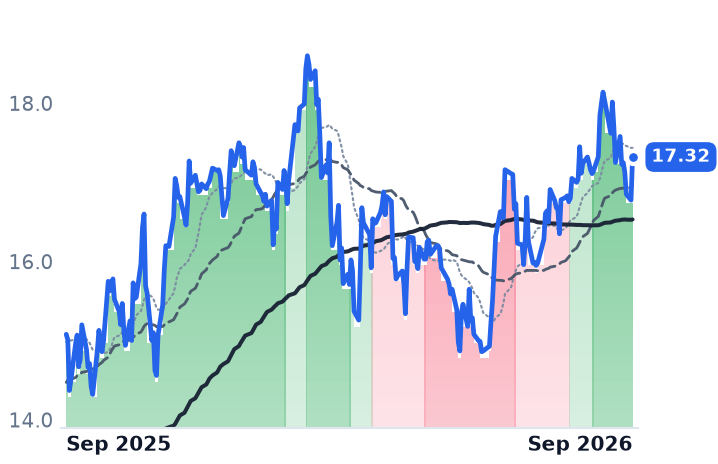
17.32
+0.55 (+3.25%)
vs. prior close
Price20d50d150d
BLCO 12-month price
Eye Care Devices & Lenses
TickerMkt capP/EP/E fwdP/SP/S fwdP/GPP/GP fwdEV/EBITDAFCF yld
ALC$32.0B50.5x19.0x3.0x2.9x5.2x5.2x17.8x5.3%
COO$10.8B18.9x12.2x2.5x2.5x4.0x4.0x14.5x6.3%
BLCO$6.2Bn/m21.8x1.2x1.1x2.0x2.0x14.7x2.3%
STAA
STAAR Surgical
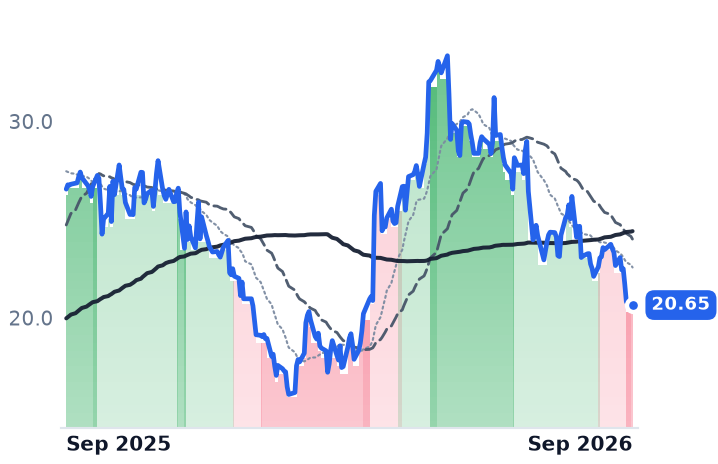
20.65
+0.23 (+1.13%)
vs. prior close
Price20d50d150d
STAA 12-month price
Eye Care Devices & Lenses
SYK
Stryker
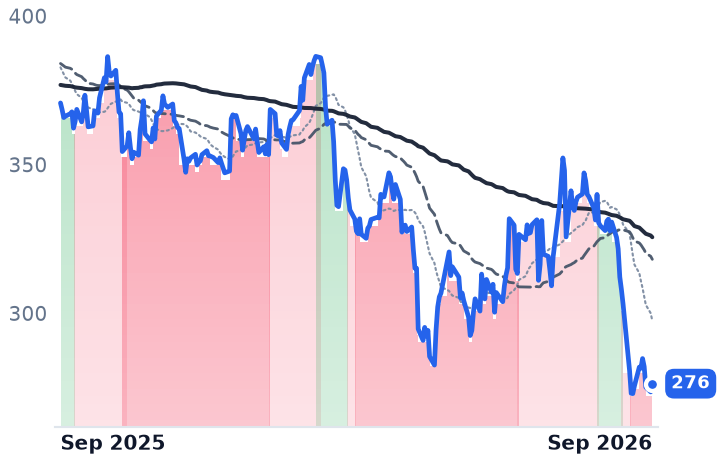
276
+2.77 (+1.01%)
vs. prior close
Price20d50d150d
SYK 12-month price
Orthopedic Implants & Trauma
ABT
Abbott Laboratories
104
+0.84 (+0.82%)
vs. prior close
Price20d50d150d
ABT 12-month price
Other
TickerMkt capP/EP/E fwdP/SP/S fwdP/GPP/GP fwdEV/EBITDAFCF yld
STAA$1.6Bn/m49.2x5.5x4.8x7.2x6.3x100.9x-3.5%
SYK$105.5B28.3x18.3x4.1x3.9x6.3x5.9x18.7x4.5%
ABT$147.1B23.5x15.4x3.3x2.9x5.8x5.2x16.1x5.0%
BSX
Boston Scientific
44.92
+1.52 (+3.51%)
vs. prior close
Price20d50d150d
BSX 12-month price
Spinal Surgery & Neuromodulation
GEHC
GE HealthCare Technologies
66.27
+1.58 (+2.44%)
vs. prior close
Price20d50d150d
GEHC 12-month price
Diagnostic Imaging & Devices
TFX
Teleflex Incorporated
125
+0.27 (+0.22%)
vs. prior close
Price20d50d150d
TFX 12-month price
IV & Vascular Access
TickerMkt capP/EP/E fwdP/SP/S fwdP/GPP/GP fwdEV/EBITDAFCF yld
BSX$63.9B17.3x13.1x3.0x3.0x4.3x4.2x13.4x5.7%
GEHC$27.6B18.4x12.4x1.4x1.3x3.3x3.0x11.3x5.5%
TFX$5.8Bn/m18.3x2.2x2.6x4.2x4.8xn/m6.7%
BAX
Baxter International
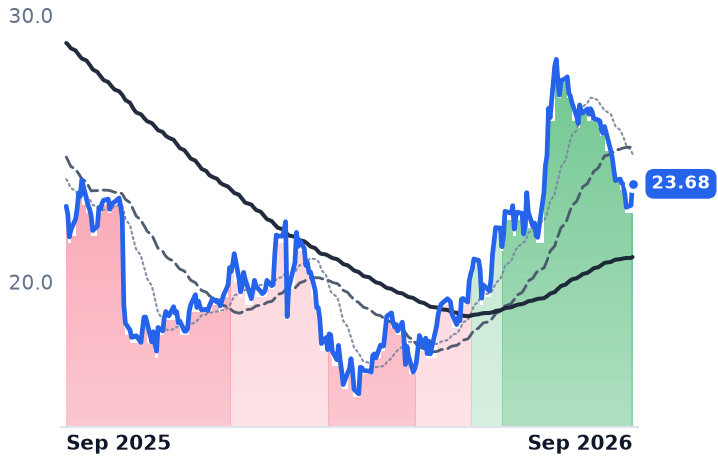
23.68
+0.81 (+3.52%)
vs. prior close
Price20d50d150d
BAX 12-month price
Dialysis & Infusion Therapy
ZBH
Zimmer Biomet
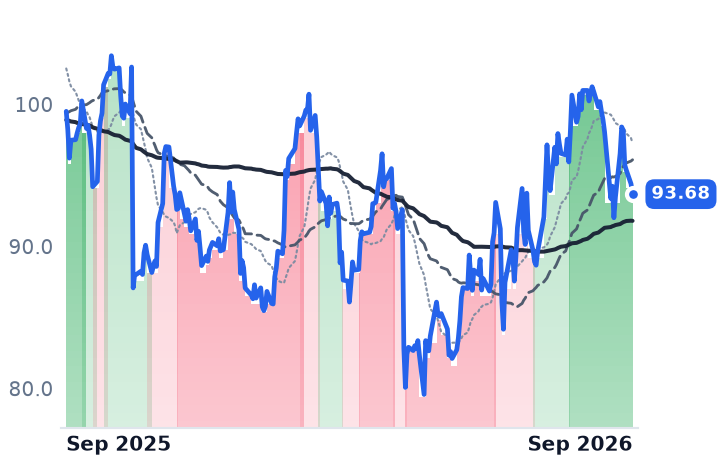
93.68
−0.73 (−0.77%)
vs. prior close
Price20d50d150d
ZBH 12-month price
Orthopedic Implants & Trauma
SPY
State Street SPDR S&P 500 ETF Trust
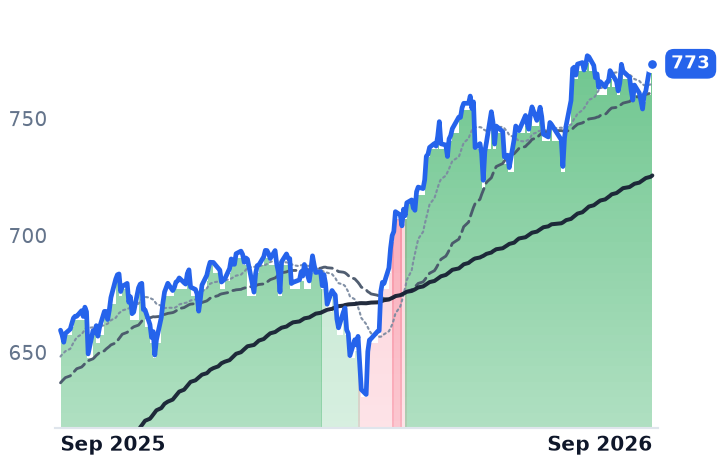
773
−0.85 (−0.11%)
vs. prior close
Price20d50d150d
SPY 12-month price
Asset Management
TickerMkt capP/EP/E fwdP/SP/S fwdP/GPP/GP fwdEV/EBITDAFCF yld
BAX$8.9Bn/m9.0x0.8x0.8x2.6x2.6x22.3x8.0%
ZBH$18.4B23.1x11.2x2.2x2.1x3.1x3.1x13.0x9.9%
SPY$773.0B

Consensus projections

TickerFY2026EFY2027EFY2028E
ALCRevenue+6.6%+5.9%+6.0%
EPS+12.7%+13.5%+13.0%
COORevenue+3.7%+4.1%+4.9%
EPS+10.9%+3.6%+8.4%
BLCORevenue+8.2%+5.9%+5.5%
EPS+50.1%+38.4%+32.4%
STAARevenue−25.2%+29.5%+8.4%
EPS−96.8%+2797.8%+46.7%
SYKRevenue+8.7%+8.8%+7.8%
EPS+10.6%+11.6%+11.3%
ABTRevenue+12.8%+9.0%+7.3%
EPS+6.2%+10.7%+11.6%
BSXRevenue+6.2%+4.4%+7.0%
EPS+8.3%+3.9%+10.8%
GEHCRevenue+6.1%+4.7%+4.7%
EPS+7.7%+10.6%+11.4%
TFXRevenue−31.2%+4.3%+4.6%
EPS−48.6%+52.0%+10.6%
BAXRevenue+2.5%+2.0%+2.7%
EPS−18.8%+3.8%+7.6%
ZBHRevenue+4.7%+3.6%+4.0%
EPS+4.4%+6.3%+7.3%

Forward fiscal years only. Blank means no analyst coverage for that year.

Alcon lifted its full-year profit outlook on August 11 and its shares have drifted lower nearly every week since, from $74.87 on the day of the results to $65.59. There was no single session that did the damage. The Geneva-based company — which sells cataract-surgery consoles, the lenses implanted during that operation, and contact lenses and dry-eye drops on the other side of the house — told investors its core operating margin had widened 160 basis points to 20.6%, its core gross margin had reached 64.7%, and that 2026 core earnings would now grow 12–15% in constant currency rather than the range it had guided to before.

What is actually at issue is one product: the advanced-technology intraocular lens, the upgrade a cataract patient pays for out of pocket on top of the reimbursed standard implant. Alcon's own arithmetic makes it the most valuable dollar in the business — management puts one point of upgrade penetration at $15m of revenue, against $10m for a point of overall market growth. In the second quarter that penetration rose about 180 basis points in the US and 110 globally, against a historical average near 50. The patient upgrade is accelerating at three times its normal pace.

The implant line did not follow

Alcon's surgical franchise grew 7% to $1.6bn, but the growth came from hardware and disposables: equipment up 25% on its UNITY console, consumables up 5%, and implantables up 1%, with intraocular lenses up 2% "despite competitive pressure." US cataract procedure volumes were flat in the quarter on the company's own estimate, below what it would normally expect, with international volumes up low single digits.

The missing dollars are findable. Bausch + Lomb — the 1853-vintage eye-health company that is still roughly 87% owned by Bausch Health, and that sells lens care, prescription eye medicines and surgical implants — reported revenue up 9% to $1.394bn and raised its own full-year guidance, with surgical the fastest-growing of its three end markets at 16%. Inside it, premium intraocular lenses grew 175% and the premium portfolio moved from 6% of surgical revenue to 13% in a year. Alcon still owns the socket — a 2026 practitioner preference survey puts its Vivity lens first at 39.7% and Clareon PanOptix Pro at 34.5%, ahead of Johnson & Johnson's Tecnis Odyssey at 24% and Bausch + Lomb's enVista Envy at 17% — but the newest entrant is where the growth rate is.

Alcon's response has been speed of conversion rather than price. "Nearly all PanOptix accounts have been converted to PanOptix Pro with the platform now representing approximately 90% of PanOptix implants," chief executive David Endicott told investors on the August 11 call. On why faster surgery sells more lenses, he was blunter: "If you can imagine doing 20 cataracts in a day, you'd probably do 21."

What the sector did to the price

Alcon's 10.9% slide over the past month sits inside a medical-device drawdown, not outside it: Stryker fell 16.1%, GE HealthCare 11.4%, Abbott 11.1% and Boston Scientific 10.8% over the same stretch while the S&P 500 exchange-traded fund rose 1.0%. The named mechanism is trade policy — the US Commerce Department opened a Section 232 national-security investigation into imports of medical equipment, devices and protective equipment on September 2, a process that can run up to 270 days. A Swiss manufacturer shipping into the United States is the most exposed of this group; Alcon already assumes a 10–12.5% duty on US imports through year-end and expects a $60m tariff refund in the third quarter, about $40m of which it plans to spend on launches.

The de-rating that was earned in a day

Cooper Companies, which sells CooperVision contact lenses alongside a CooperSurgical fertility and women's-health unit, fell 18.8% on September 10, from $67.26 to $54.62. CooperVision revenue was flat at $717m, the company cut full-year CooperVision growth guidance for the second time in two quarters, from a peak of 4.5–5.5% to 1–2%, guided the fourth quarter to between minus 2% and flat, and the board ended a sale process by keeping CooperSurgical. Chief executive Albert White attributed the shortfall to a deliberate reduction of US channel inventory: "The consumption in the U.S. market here has been running pretty steady all year in the mid-single digits… So the entire reason for the reduction in the revenue guidance for CooperVision was tied to just channel inventory. That's it." He also conceded the commercial gap — "we don't have enough salespeople out there. Like, hindsight 20/20, we should have moved faster on this" — and is adding coverage at more than 5,000 additional retail doors. Brokers marked it down accordingly, with JPMorgan cutting its target to $58 from $71 and Stifel to $70 from $85.

Where the three now trade separates them further. Alcon changes hands at 19 times forward earnings against roughly 27 times in January 2025, with consensus still modeling $3.45 of 2026 earnings per share, up nearly 13%; its trailing multiple is meaningless because reported operating income collapsed to $11m on the discontinuation of its PowerVision accommodating-lens programs. Cooper is the cheapest at 12.2 times forward, down from about 22 times, with record quarterly free cash flow of $273m and leverage under two times. Bausch + Lomb, still loss-making on a reported basis, trades at 21.8 times forward earnings — down from roughly 34 times in January 2025 even though the shares are up 13.6% over twelve months, because the estimates grew faster than the price.

The verdict

The common label over these three companies is doing no work. Bausch + Lomb has risen on every horizon measured; Cooper's fall is dated, explained and priced; only Alcon's decline lacks an author. Roughly speaking, the sector's tariff drift accounts for most of it — Alcon's month looks like Abbott's. What the business genuinely owes is the implant line: the premium upgrade is compounding faster than it ever has, and a competitor with a lens approved in December 2024 is taking a visible share of the increase while Alcon's implantable revenue rounds to no growth at all.

That changes what the next print has to prove. Margin expansion and console placements are no longer the question; the question is whether the company that defined the premium cataract lens can keep the patient's own money flowing through its own product. The upgrade is selling better than ever. Whose lens goes in is suddenly open.

Vistra's First Gas Data-Center Contract Starts in a Year It Has 94% Sold Forward

Hypothesis Opus 5 · Research Opus 5 · Writing Opus 5 · Prompt v1.6

Vistra has finally contracted data-center load out of its gas fleet rather than its nuclear plants — and the power does not flow until the third quarter of 2027, a year it had already sold roughly 94% of its generation forward as of early August. The contract is real; most of its margin is deferred.

The two Texas merchant power names are no longer one story. Vistra's June quarter showed revenue down 5.5% to $4.02bn but gross margin up to 23.5% from 22.0%, with 2026 adjusted EBITDA guidance of $6.8–7.6bn reaffirmed. NRG's revenue rose 64% on an acquired fleet while gross margin fell to 14.5% from 16.5%, adjusted earnings per share slipped to $1.49, and the diluted share count went from 190.4m to 210.0m. Vistra's price is discounting something its results do not show. NRG's is discounting something they do.

VSTNRGCEGTLNData-Center Power ContractsERCOT Load GrowthMerchant Generation HedgingPJM Capacity PricingGas-Fired GenerationIntegrated Retail Electricity
TickerCompanySegmentTrend · 13mo30D1Y
The subject · what this brief is about
VSTVistraIntegrated Retail & Generation🔴 Cont. Bear+3.8%−30.9%
NRGNRG EnergyIntegrated Retail & Generation🔴 Cont. Bear−7.7%−38.1%
Compared against · context, not the story
CEGConstellation EnergyDiversified Renewable Generators🔴 Cont. Bear−3.3%−21.3%
TLNTalen EnergyWholesale Power Producers⚠️ Emerging Bear−3.7%−30.5%

12-month price & trend

VST
Vistra
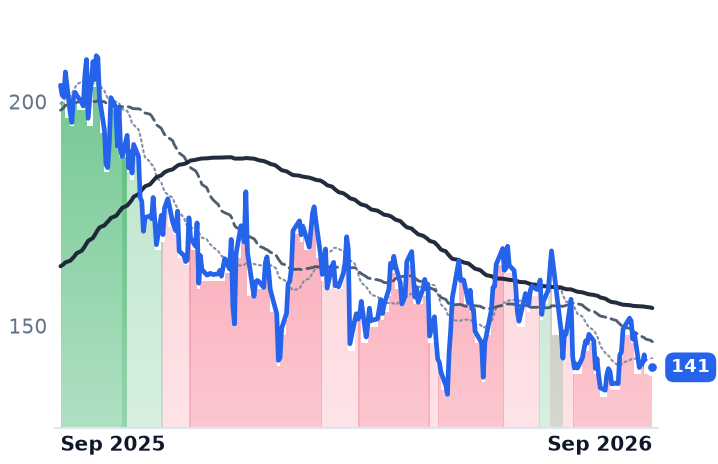
141
−0.64 (−0.45%)
vs. prior close
Price20d50d150d
VST 12-month price
Integrated Retail & Generation
NRG
NRG Energy
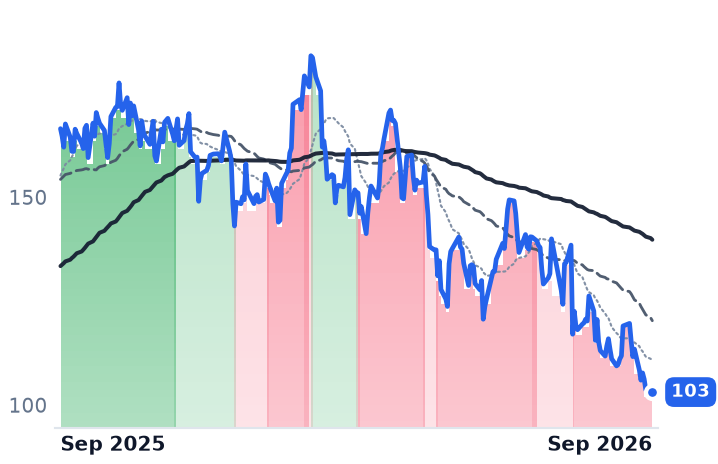
103
+0.58 (+0.56%)
vs. prior close
Price20d50d150d
NRG 12-month price
Integrated Retail & Generation
CEG
Constellation Energy
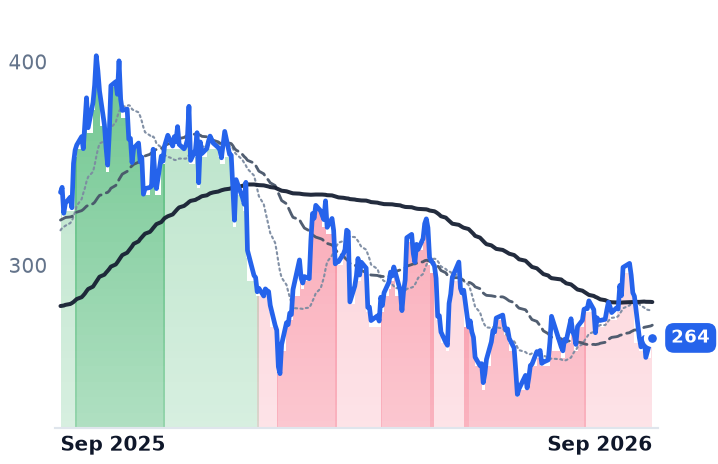
264
+0.71 (+0.27%)
vs. prior close
Price20d50d150d
CEG 12-month price
Diversified Renewable Generators
TickerMkt capP/EP/E fwdP/SP/S fwdP/GPP/GP fwdEV/EBITDAFCF yld
VST$47.3B23.4x16.5x3.0x2.1x22.8x16.4x10.3x2.9%
NRG$21.7B26.9x11.6x0.6x0.6x3.6x3.8x10.6x1.6%
CEG$94.6B25.6x21.8x3.0x2.8x3.2x3.0x13.9x0.3%
TLN
Talen Energy
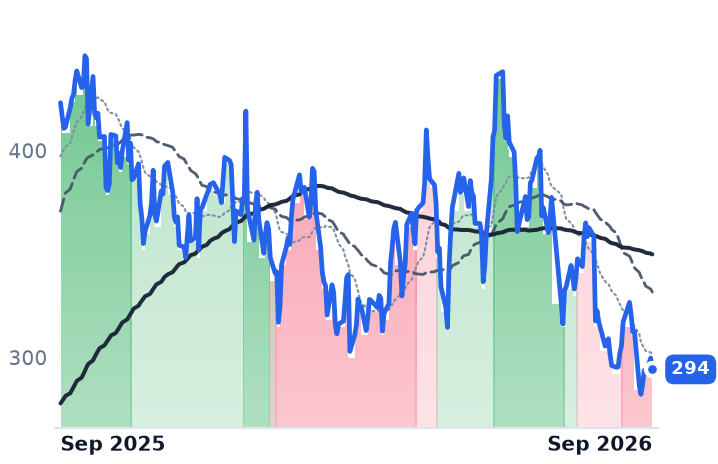
294
−5.49 (−1.83%)
vs. prior close
Price20d50d150d
TLN 12-month price
Wholesale Power Producers
TickerMkt capP/EP/E fwdP/SP/S fwdP/GPP/GP fwdEV/EBITDAFCF yld
TLN$14.2Bn/m15.2x4.0x3.2x9.0x7.2x29.6x3.6%

Consensus projections

TickerFY2026EFY2027EFY2028E
VSTRevenue+15.7%+10.2%+4.8%
EPS+78.3%+20.0%+18.4%
NRGRevenue+17.7%+0.8%+3.7%
EPS+14.0%+24.5%+15.8%
CEGRevenue+36.6%+2.7%+5.5%
EPS+28.9%+10.4%+26.4%
TLNRevenue+84.0%+15.8%+4.6%
EPS+247.6%+48.4%+17.8%

Forward fiscal years only. Blank means no analyst coverage for that year.

On September 21 Vistra's Luminant marketing arm signed a 20-year agreement to supply up to 207 megawatts to the first phase of a Permian Basin data center being developed by New Era Energy & Digital. The power comes from Vistra's 1,180 MW gas-fired plant at Odessa, immediately adjacent to the 493-acre site, and Vistra takes a 5% non-voting interest in the supplied portion of the campus once deliveries begin, along with a right of first refusal on later development there.

It is the first data-center load Vistra — a $47bn generator running about 38,700 MW of nuclear, gas, coal, solar and batteries alongside a retail book of roughly 4.3 million customers — has contracted out of its gas fleet rather than out of its PJM nuclear plants. That matters mostly for when the money arrives. Deliveries begin in the third quarter of 2027, and as of August 3 Vistra had already hedged approximately 100% of expected 2026 generation, about 94% of 2027 and about 72% of 2028. A contract signed today reaches the income statement through the thin unhedged residual of 2027 and the open tail beyond it. Twenty years of contracted load is a balance-sheet event long before it is an earnings one.

What the Texas market actually pays

Chief executive Jim Burke has been blunt about the spot economics. ERCOT wholesale power around $30 a megawatt-hour, he told investors on the second-quarter call, is "not going to get new stuff built". Burke has held his forecast of 115 to 120 gigawatts of ERCOT load in 2030 unchanged since May 2024 "even though the queues have certainly grown" — management is discounting the announced interconnection pipeline, not underwriting it. The fuel-free revenue line is capped too: PJM's capacity auction announced in July cleared at $325 per megawatt-day for a third consecutive auction, 2.5% below the prior $333.44, and federal regulators have extended that collar through the next auction, which closes December 15.

Against that backdrop Vistra's reported business has held. June-quarter revenue fell 5.5% to $4.02bn, the fourth consecutive quarterly decline, yet gross margin rose to 23.5% from 22.0% and operating margin to 13.8% from 12.1%; adjusted EBITDA rose about 30% to $1.77bn and the 2026 guidance range of $6.8–7.6bn was reaffirmed, with a 2027 range of $7.4–7.8bn set last November still standing. The shares are down 35.4% over twelve months. Vistra trades at 10.29 times trailing enterprise value to EBITDA against 13.93 times for Constellation Energy, the nuclear-weighted comparison, and at 16.46 times forward earnings against 23.44 times trailing — earnings multiples distorted by hedge accounting, which swung 2025 diluted earnings per share to $2.21 from $7.00.

NRG's deterioration is in the accounts

NRG, a Houston supplier selling power, gas and smart-home services to roughly six million customers, is the opposite case. June-quarter revenue rose 64% to $11.06bn — bought, through the roughly $12.0bn LS Power fleet acquisition funded with $4.9bn of new notes and stock — while gross margin fell to 14.5% from 16.5%. Texas segment margin absorbed a 13% rise in the cost to serve retail load, a $77m hit, plus $45m of lost load from customer mix and attrition; Houston round-the-clock power averaged $33 a megawatt-hour against a 2026 planning assumption of $52. Diluted shares rose from 190.4m to 210.0m as acquisition stock swamped buybacks. The bright line is Vivint Smart Home, which delivered $301m of adjusted EBITDA and 2.45 million customers, up 8%. NRG closed at $102.55 on September 21, its lowest close of the year, days after Morgan Stanley trimmed its target to $159. Its flagship 1.2 GW hyperscaler plant still has no final investment decision and targets operation in late 2029.

Treating these two as one merchant-power trade no longer survives the evidence. Over the past month Vistra rose 3.8% while NRG fell 7.8%. Vistra's guidance is intact, its nuclear output is floored by a federal credit that only phases out above $25 a megawatt-hour, and it now has dated contracted megawatts — Meta from late 2026, Amazon Web Services from late 2027, New Era from mid-2027. NRG's de-rating is earned by margin compression and dilution; what is no longer obvious is how much further it should run, with the shares at 11.56 times forward earnings, roughly half Constellation's, and 2026 guidance of $5.325–5.825bn in adjusted EBITDA reaffirmed.

Texas is about to make the distinction between announced and signed megawatts a matter of public record: the grid operator's audit of every data center in its interconnection queue, ordered by Governor Greg Abbott, is due by December 10. Vistra has one contract with a delivery date. Most of the queue has a press release.

Chewy Grew Sales 7.3% and Gross Profit 3.4% — Overhead Cuts Made Its 41% Profit Jump

Hypothesis Opus 5 · Research Opus 5 · Writing Opus 5 · Prompt v1.6

Chewy's July quarter was its biggest ever and produced almost no incremental gross profit. Net sales reached $3.33bn while gross profit rose only 3.4%; operating income still jumped 41% to $98.4m, entirely out of selling and administrative expense, which fell to 18.4% of sales. Petco's mirror image: comparable sales up 0.6%, sales flat, and operating profit up to 3.2% of sales on expense discipline against fixed store costs.

Both businesses are improving. Neither is improving where the pet dollar is actually growing — veterinary care and prescriptions now exceed 40% of US pet spending, and pet-owning households have slipped to 67% from 69% in 2024. Consensus needs Chewy's earnings up 48.5% next year on revenue growth that never exceeds 7.3%. That is a margin forecast wearing a growth label.

CHWYWOOFAMZNWMTFRPTZTSIDXXTSCOCARTPet Specialty RetailVeterinary Care SpendAutoship Subscription ModelFulfillment AutomationMargin-Led EarningsAmazon Share Shift
TickerCompanySegmentTrend · 13mo30D1Y
The subject · what this brief is about
CHWYChewyPet & General Specialty🔴 Cont. Bear−19.7%−47.6%
WOOFPetco Health and WellnessPet & General Specialty🔴 Cont. Bear−16.7%−31.6%
CARTMaplebearPet & General Specialty🟢 Cont. Bull−15.0%+4.2%
Compared against · context, not the story
AMZNAmazon.comOnline Marketplaces🟢 Cont. Bull−1.4%+13.5%
WMTWalmartWarehouse Clubs🔴 Cont. Bear+3.4%+7.7%
FRPTFreshpetPet Food & Nutrition🟢 Cont. Bull−21.7%+17.5%
ZTSZoetisAnimal Health🔴 Cont. Bear−5.0%−48.7%
IDXXIDEXX LaboratoriesSpecialty & Veterinary Diagnostics🔴 Cont. Bear−6.5%−18.8%
TSCOTractor SupplySporting Goods & Outdoor🔴 Cont. Bear−9.7%−43.7%

12-month price & trend

CHWY
Chewy
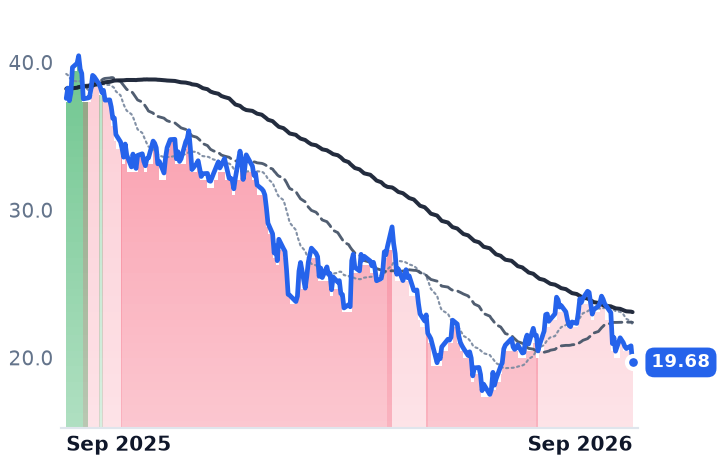
19.68
−1.12 (−5.41%)
vs. prior close
Price20d50d150d
CHWY 12-month price
Pet & General Specialty
WOOF
Petco Health and Wellness
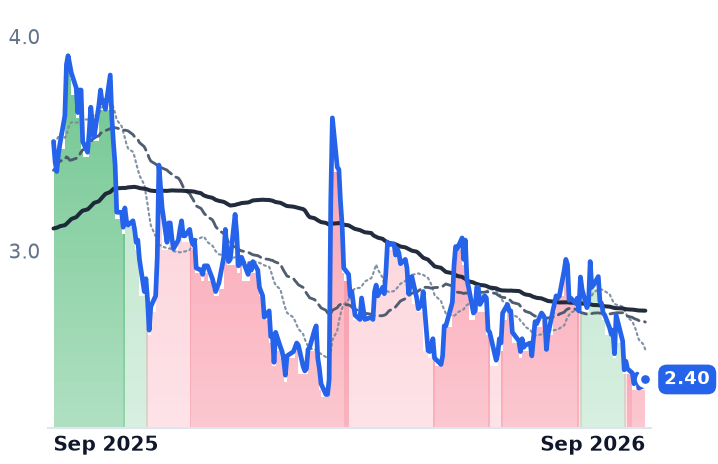
2.40
+0.03 (+1.27%)
vs. prior close
Price20d50d150d
WOOF 12-month price
Pet & General Specialty
AMZN
Amazon.com
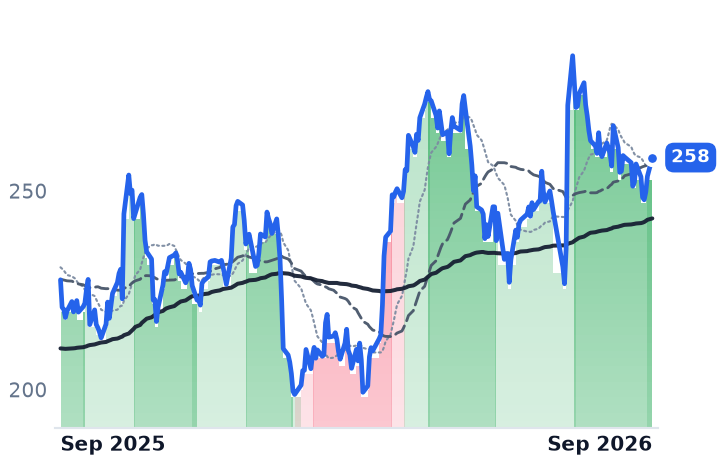
258
+4.68 (+1.85%)
vs. prior close
Price20d50d150d
AMZN 12-month price
Online Marketplaces
TickerMkt capP/EP/E fwdP/SP/S fwdP/GPP/GP fwdEV/EBITDAFCF yld
CHWY$8.1B37.8x25.2x0.6x0.6x2.1x2.0x21.8x7.0%
WOOF$682.5M21.6x9.7x0.1x0.1x0.3x0.3x5.5x45.2%
AMZN$2.9T21.2x21.1x3.7x3.5x7.3x6.8x11.9x-0.4%
WMT
Walmart
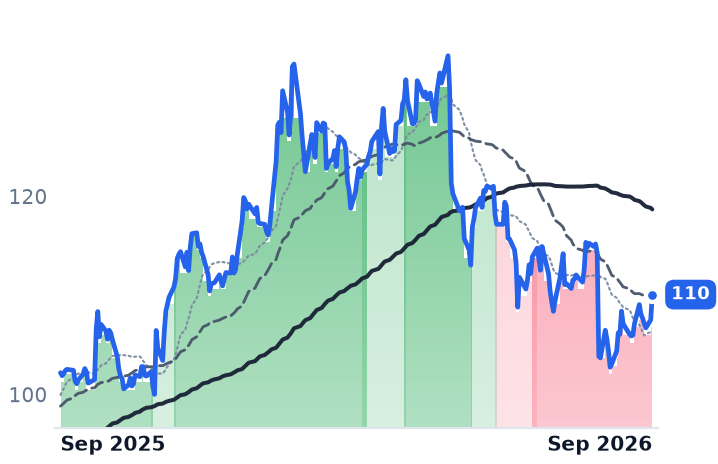
110
+2.56 (+2.38%)
vs. prior close
Price20d50d150d
WMT 12-month price
Warehouse Clubs
FRPT
Freshpet
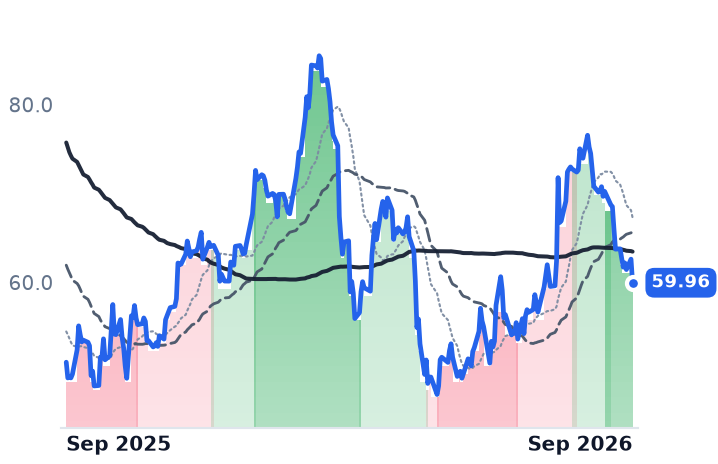
59.96
−2.65 (−4.24%)
vs. prior close
Price20d50d150d
FRPT 12-month price
Pet Food & Nutrition
ZTS
Zoetis
73.28
+1.85 (+2.59%)
vs. prior close
Price20d50d150d
ZTS 12-month price
Animal Health
TickerMkt capP/EP/E fwdP/SP/S fwdP/GPP/GP fwdEV/EBITDAFCF yld
WMT$1.0T47.9x45.1x1.5x1.4x5.9x5.6x23.8x1.4%
FRPT$3.2B15.7x33.7x2.7x2.6x6.9x6.7x13.3x5.3%
ZTS$31.1B11.9x10.7x3.3x3.2x4.6x4.5x7.3x6.9%
IDXX
IDEXX Laboratories
523
+6.86 (+1.33%)
vs. prior close
Price20d50d150d
IDXX 12-month price
Specialty & Veterinary Diagnostics
TSCO
Tractor Supply
32.42
+0.22 (+0.67%)
vs. prior close
Price20d50d150d
TSCO 12-month price
Sporting Goods & Outdoor
CART
Maplebear
44.03
−2.15 (−4.66%)
vs. prior close
Price20d50d150d
CART 12-month price
Pet & General Specialty
TickerMkt capP/EP/E fwdP/SP/S fwdP/GPP/GP fwdEV/EBITDAFCF yld
IDXX$41.7B38.7x36.1x9.4x8.9x15.1x14.3x28.0x2.0%
TSCO$16.0B14.9x14.3x1.0x1.0x3.2x3.0x11.4x3.6%
CART$10.4B23.4x19.0x2.6x2.5x3.6x3.4x13.1x11.3%

Consensus projections

TickerFY2026EFY2027EFY2028E
CHWYRevenue+6.7%+7.3%+6.8%
EPS−32.6%+48.5%+36.3%
WOOFRevenue−2.7%+0.6%+1.1%
EPS−275.3%+68.5%+3.2%
AMZNRevenue+15.9%+14.6%+16.0%
EPS+76.8%−16.1%+30.8%
WMTRevenue+4.7%+5.1%+4.8%
EPS+6.0%+10.5%+12.7%
FRPTRevenue+11.1%+8.5%+8.0%
EPS−20.4%−3.9%+11.3%
ZTSRevenue+3.8%+4.4%+5.1%
EPS+9.5%+7.6%+8.4%
IDXXRevenue+9.9%+8.8%+9.1%
EPS+13.4%+12.9%+13.2%
TSCORevenue+3.8%+5.5%+6.9%
EPS+1.8%+8.3%+11.2%
CARTRevenue+14.3%+10.7%+10.4%
EPS+28.8%+27.2%+17.7%

Forward fiscal years only. Blank means no analyst coverage for that year.

Chewy shipped more pet food in its July quarter than in any quarter of its history, and the extra volume brought almost no extra gross profit with it. Net sales of $3.33bn were up 7.3% year over year, an acceleration from 4.8% the quarter before. Gross profit grew 3.4%.

That gap is the story of both American pet retailers this season, and it matters because of where each is now spending. Chewy borrowed for the first time — a $600m term loan — to buy veterinary clinics; Petco, which runs roughly 1,500 stores with about 300 wholly owned veterinary hospitals inside them, resumes hospital expansion in 2027. Both are chasing the part of the pet wallet that is growing, because the part they were built on is not.

Where the profit came from

Chewy's operating income rose 41% to $98.4m. Every dollar of that gain came from below the gross line: selling, general and administrative expense fell 70 basis points to 18.4% of sales on warehouse automation and fulfilment utilization, and roughly $15m of the quarter's adjusted-EBITDA outperformance was timing — tariff refunds, vendor rebates, discrete items. "We are north of 50% of our volume flowing through automated states, and we will continue to grow that over time," chief financial officer Christopher Deppe told investors on the September 9 call, adding that confidence in a long-term path to 10%-plus EBITDA margin "is stronger at this point."

Management describes gross margin as flat year over year at 30.4%. On the cost allocation in Chewy's filed income statement the ratio fell about 110 basis points, to 29.3%. The two definitions differ; the direction of travel does not, and the company has guided third-quarter gross margin down sequentially with a mid-single-digit fuel headwind.

The customer base grew the same modest way. Active customers reached 21.7m and net sales per active customer $602, each up 3.8%, with 43,000 of the new actives arriving through the acquired SmartPak business. Autoship subscriptions hit a record 84.6% of net sales. "Chewy continues to outperform the broader pet category by roughly 2x to 3x," chief executive Sumit Singh said on the same call — a claim about relative share in a category management itself called broadly flat.

Petco tells the same arithmetic from the store side. Second-quarter net sales of $1.5bn were flat with comparable sales up 0.6%, a second straight positive quarter off two years of decline. Operating income rose 11% to $47.8m because SG&A grew by $1m. "Q2 marks our seventh consecutive quarter of delivering on our profitability and cash flow goals, allowing us to significantly bring down our overall leverage," chief financial officer Sabrina Simmons said on September 2. The company has retired $170m of debt in nine months against $1.48bn of gross borrowings.

The dollar that is moving

Morgan Stanley Research puts veterinary care, prescriptions and diagnostics at more than 40% of US pet spending and rising, with its April survey finding 67% of households owning a pet, down from 69% in 2024 and affordability now the top reason cited for not owning one. Meanwhile the consumables dollar is contested at the top of the funnel: 79.6% of surveyed consumers shopped pet products on Amazon against 53.1% at Chewy.

The shares have registered this as a category verdict. Over twelve months Chewy is down 47.6% and Petco 31.6%, alongside Zoetis, Tractor Supply and IDEXX — while Amazon and Walmart rose. JPMorgan's Doug Anmuth cut Chewy to Neutral on September 11, taking his target to $24, the second downgrade in two days; the average sell-side target is still $31.09. The Federal Reserve's September 16 rate increase lands on two newly levered balance sheets.

The verdict

Chewy at 25.2x forward earnings against 37.8x trailing is not being priced for the quarter it reported; it is being priced for the one consensus requires, with earnings up 48.5% next year on revenue growth that never exceeds 7.3% through 2031. That is margin, and the gross line has stopped supplying it — automation and advertising must. Petco at 9.7x forward against 21.6x trailing, 5.5x trailing enterprise value to EBITDA and 0.57x book, is an equity stub priced as an option on deleveraging, and $170m a year of paydown is the meter that matters.

Both managements are right that their businesses improved. Cost programs, though, have an end; the gross line does not. Chewy's veterinary clinics and fresh food grew at triple-digit rates last quarter off bases small enough that management does not size them separately — and that is the whole bet, on both sides of the segment.
MYR Group's Record Quarter Came From Wiring Data Centers While Transmission Grew 3.5%

Hypothesis Opus 5 · Research Opus 5 · Writing Opus 5 · Prompt v1.6

Three firms filed under the same grid-interconnection label — AECOM, Tetra Tech and MYR Group — each set a record backlog in its latest quarter, and their shares have moved 106 percentage points apart over twelve months. Nothing in the order books explains that.

What explains it is contract form and conversion date. MYR Group's growth is fixed-price data-center electrical work, where commercial and industrial revenue rose 41.5% to $557.7m while transmission barely moved; AECOM's record $27.8bn book sits behind a $337m charge on a design-build project bid in 2018; Tetra Tech grew revenue 13.5% last quarter while gross profit fell 3.3%.

One of the three is a demand story, and the demand is landing inside buildings rather than on the interconnection queue.

MYRGACMTTEKPWRSTNWSP.TOTransmission & Substation BuildoutEPC Backlog ConversionFixed-Price Contract RiskWater & Environmental ConsultingDesign-Build Margin Pressure
TickerCompanySegmentTrend · 13mo30D1Y
The subject · what this brief is about
MYRGMYRElectrical & Power Infrastructure⚠️ Emerging Bear−5.0%+53.2%
ACMAecomDesign & Engineering Consulting🔴 Cont. Bear−3.6%−52.5%
TTEKTetra TechDesign & Engineering Consulting🌱 Emerging Bull−3.4%+1.4%
Compared against · context, not the story
PWRQuanta ServicesElectrical & Power Infrastructure🟢 Cont. Bull+4.6%+63.0%
STNStantecDesign & Engineering Consulting🔴 Cont. Bear−4.1%−36.3%
WSP.TOWSP GlobalEngineering & Construction🔴 Cont. Bear−0.0%−32.3%

12-month price & trend

MYRG
MYR
290
+5.03 (+1.77%)
vs. prior close
Price20d50d150d
MYRG 12-month price
Electrical & Power Infrastructure
ACM
Aecom
62.62
−0.35 (−0.55%)
vs. prior close
Price20d50d150d
ACM 12-month price
Design & Engineering Consulting
TTEK
Tetra Tech
35.60
−0.40 (−1.10%)
vs. prior close
Price20d50d150d
TTEK 12-month price
Design & Engineering Consulting
TickerMkt capP/EP/E fwdP/SP/S fwdP/GPP/GP fwdEV/EBITDAFCF yld
MYRG$4.5B27.2x23.7x1.1x1.0x9.1x8.2x15.0x4.3%
ACM$8.0B28.2x15.6x0.5x1.1x9.2x19.2xn/m2.5%
TTEK$9.2B21.2x22.5x1.8x2.1x9.7x11.3x15.0x6.0%
PWR
Quanta Services
645
+3.62 (+0.56%)
vs. prior close
Price20d50d150d
PWR 12-month price
Electrical & Power Infrastructure
STN
Stantec
71.16
+0.42 (+0.59%)
vs. prior close
Price20d50d150d
STN 12-month price
Design & Engineering Consulting
WSP.TO
WSP Global
192
+12.42 (+6.91%)
vs. prior close
Price20d50d150d
WSP.TO 12-month price
Engineering & Construction
TickerMkt capP/EP/E fwdP/SP/S fwdP/GPP/GP fwdEV/EBITDAFCF yld
PWR$92.7B69.7x36.8x2.8x2.4x19.6x16.3x32.5x2.6%
STN$8.1B22.6x16.0x1.4x1.1x3.3x2.6x12.1x5.8%
WSP.TO$23.1B23.3x14.9x1.3x1.4x7.3x8.1x13.3x7.5%

Consensus projections

TickerFY2026EFY2027EFY2028E
MYRGRevenue+22.9%+15.5%+11.4%
EPS+72.5%+18.4%+22.2%
ACMRevenue−2.9%+8.6%+5.8%
EPS−24.1%+60.4%+14.2%
TTEKRevenue−3.5%+4.3%+1.8%
EPS+4.1%+10.2%+8.2%
PWRRevenue+40.6%+16.5%+12.8%
EPS+57.5%+17.6%+16.6%
STNRevenue+9.5%+6.0%+4.8%
EPS+15.3%+11.8%+12.3%
WSP.TORevenue+18.9%+7.5%+6.9%
EPS+19.5%+14.6%+13.8%

Forward fiscal years only. Blank means no analyst coverage for that year.

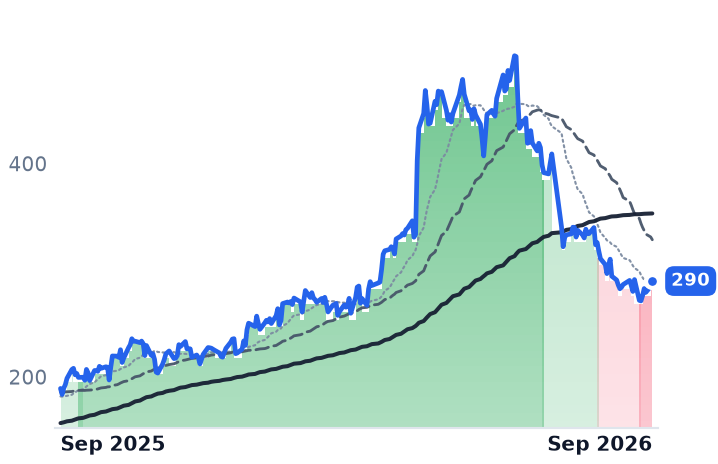
MYR Group, the Colorado electrical contractor founded in 1891 that builds high-voltage transmission lines and substations for utilities and wires data centers, hospitals and stadiums, had the best quarter in its history in June. The growth came from the buildings. Commercial and industrial revenue rose 41.5% to a record $557.7m, driven by fixed-price contracts, while transmission and distribution revenue rose 3.5%.

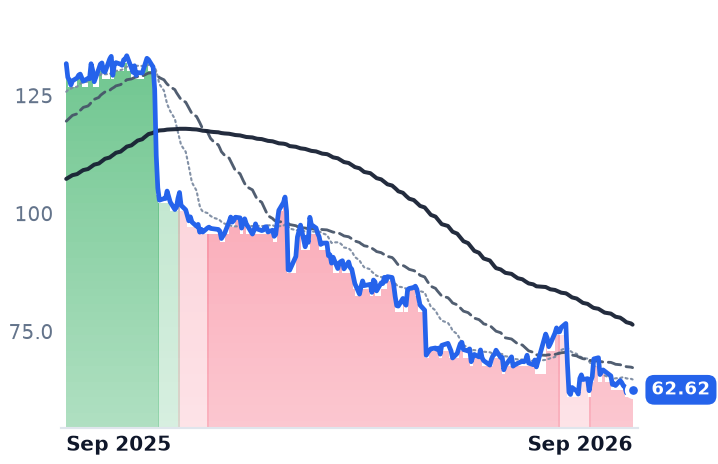
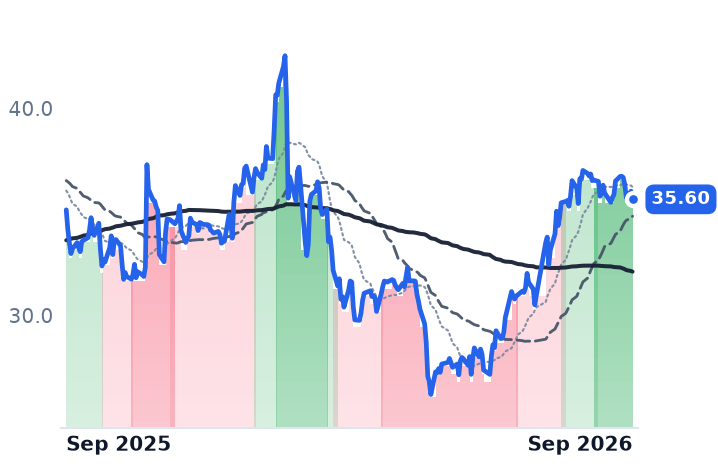
That split is the whole story of a group of companies investors treat as one trade. AECOM, Tetra Tech and MYR Group each reported a record backlog in its most recent quarter, and over the twelve months to September 22 their shares moved 106 percentage points apart — AECOM down 52.9%, Tetra Tech up 1.1%, MYR Group up 53.2%. Demand is not what separates them. What separates them is what kind of contract the demand arrives on, and when it converts to cash.

The contractor: paid a construction margin, priced on a calendar

MYR Group's June quarter beat consensus earnings by 20%, with gross margin up 181 basis points to 13.2% and net income up 88% to $49.9m. Backlog hit a record $3.16bn, up 19.6% — but $1.89bn of it is commercial and industrial work against $1.27bn in transmission and distribution. The order book is not an interconnection book.

The shares fell 21.3% in the week before that print and are down 40% over three months. The one discoverable company-specific catalyst since is a valuation call: Kansas City Capital's Jon Braatz cut the stock to Perform and withdrew his price target. The duration is the likelier pressure. Two Xcel Energy transmission awards booked this year produce no revenue until the second half of 2027, most major projects won will be built between 2028 and 2030, and second-half segment margins are guided below the June actuals — long-dated cash at a moment when the 30-year Treasury yield sits at 5.296%.

The consultant: one bid from 2018

AECOM, the Dallas design and program-management firm whose largest client is the Department of War, took a $337m pretax charge in its fiscal third quarter on a single construction-management project, turning quarterly gross profit negative and diluted earnings to minus $0.67. The project was a public-private design-build awarded in 2019 on terms the company says its current risk policies would reject, it is 80-85% complete, and subcontractor productivity is the cause. The cash cost is roughly $500m through the first half of fiscal 2027; free cash flow guidance fell to $300m from $400m.

Everything else went up. Net service revenue grew 5%, backlog reached a record $27.8bn on a 1.6x book-to-burn ratio, and full-year margin guidance was raised. On the August 11 call, management described the data-center business and its outlook as very strong and fast-growing, and president Lara Poloni cited a 30% expansion in the water pipeline, per Construction Dive's account. Construction management is 6-7% of net service revenue and the company says it will bid no more of this contract type. The shares fell 19.0% across two sessions and now trade at 15.7x forward earnings, against the 22-24x forward they carried in May.
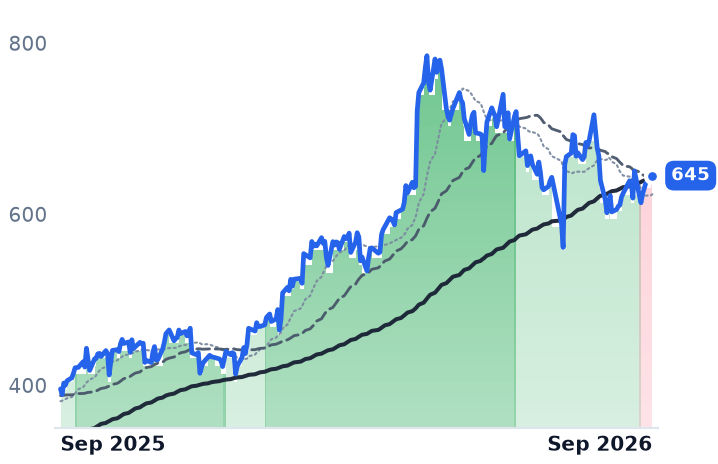
The one growing without profit

Tetra Tech, the Pasadena water and environmental consultancy, is the name where the pass-through problem is real. Fiscal third-quarter revenue rose 13.5% to $1.309bn while gross profit fell 3.3%, a 323 basis-point margin loss, and that is the third straight quarter of flat-to-lower gross profit on rising revenue. Operating income fell 4.3%.

Its federal exposure, the risk everyone watched, already detonated: USAID contracts worth 10.6% of fiscal 2025 revenue were converted to terminations for convenience on February 27. Tetra Tech grew through it — federal customers, 20% of net revenue, grew 12% excluding USAID, State and disaster work. Chief executive Roger Argus told investors on July 30 he was "very encouraged by the 5% sequential backlog growth, our second consecutive quarter of growth," adding that the figure "includes only contracted, funded, and authorized work". The shares are up 31.1% in three months on that, and now trade at 22.5x forward earnings — above their 21.2x trailing, an inversion that says consensus expects no earnings growth at all.

What the label hides

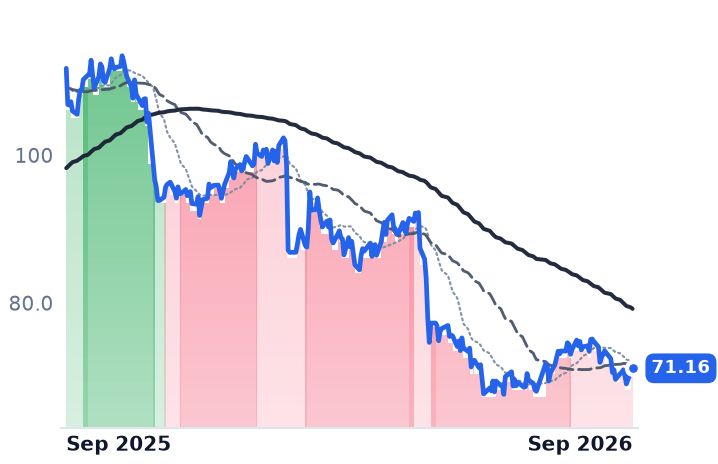
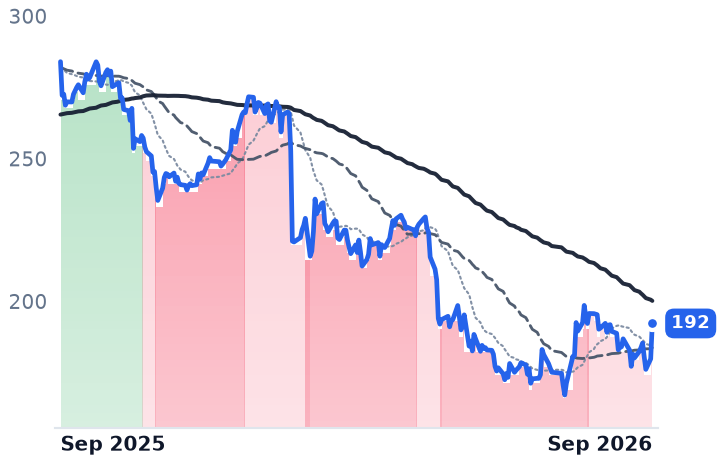
None of the three is trading on interconnection. AECOM's collapse is a cash bill for a bid signed before the AI build existed, on a business line it has exited; its order flow never wavered. Tetra Tech's re-rating is being paid for profit that has gone backwards for three quarters. MYR Group's fall is a multiple cut against estimates that rose — consensus has its 2026 earnings up 72.5%. Stantec, which won Meta's $13bn Alberta data-center design mandate and posted a record margin, fell 36.5% over the year anyway, which is what a de-rating that ignores execution looks like.
The demand is real and it is being captured by whoever holds the fixed-price contract to install equipment inside a building. The designers bill hours on work that was funded years ago; MYR Group's record book gets built at the end of the decade. Until then its shares are less a bet on the grid than on the discount rate applied to 2029.

Patent Royalties, Not Module Sales, Took Vicor's Quarterly Growth Guidance Past 20%

Hypothesis Opus 5 · Research Opus 5 · Writing Opus 5 · Prompt v1.6

The two strongest reported businesses in AI power management have de-rated this quarter, while the one whose shipped business went backwards re-rated on a legal calendar.

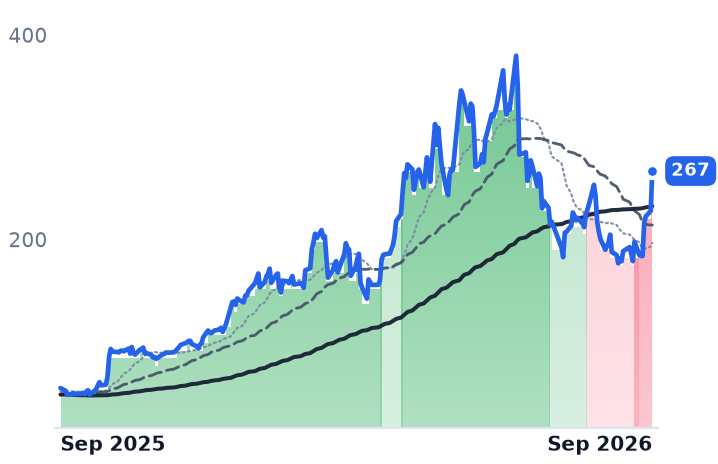
Vicor lifted third-quarter guidance on September 21 entirely on royalties from a Vertical Power Delivery patent licence granted five days earlier — its fourth OEM or hyperscaler licensee — and the shares have gained 45.2% across four sessions. Its June quarter shows the other half: revenue up 1.6%, gross margin down from 65.3% to 58.0%, operating income down 23.2%, net income up 20.8%.

Monolithic Power grew enterprise-data revenue 164% to $380.6m and Analog Devices expanded gross margin to 67.3% with communications revenue up 84% — and both fell over the past three months. Vicor is paid for permission; the other two are paid per socket.

VICRMPWRADITXNNVDAGFSAI Accelerator Power DeliveryPatent Licensing & RoyaltiesHyperscaler Capex DemandFoundry Capacity Partnerships
TickerCompanySegmentTrend · 13mo30D1Y
The subject · what this brief is about
VICRVicorOther⚠️ Emerging Bear+40.5%+387.9%
MPWRMonolithic Power SystemsAnalog & Mixed-Signal⚠️ Emerging Bear+7.4%+50.4%
ADIAnalog DevicesAnalog & Mixed-Signal🟢 Cont. Bull+5.2%+58.9%
Compared against · context, not the story
TXNTexas Instruments IncorporatedAnalog & Mixed-Signal🟢 Cont. Bull+4.6%+53.9%
NVDANVIDIAAI & Data Center GPUs🟢 Cont. Bull+10.0%+24.9%
GFSGLOBALFOUNDRIESLogic Foundries⚠️ Emerging Bear+5.1%+45.6%

12-month price & trend

VICR
Vicor
267
+39.06 (+17.14%)
vs. prior close
Price20d50d150d
VICR 12-month price
Other
MPWR
Monolithic Power Systems
1,381
+103 (+8.06%)
vs. prior close
Price20d50d150d
MPWR 12-month price
Analog & Mixed-Signal
ADI
Analog Devices
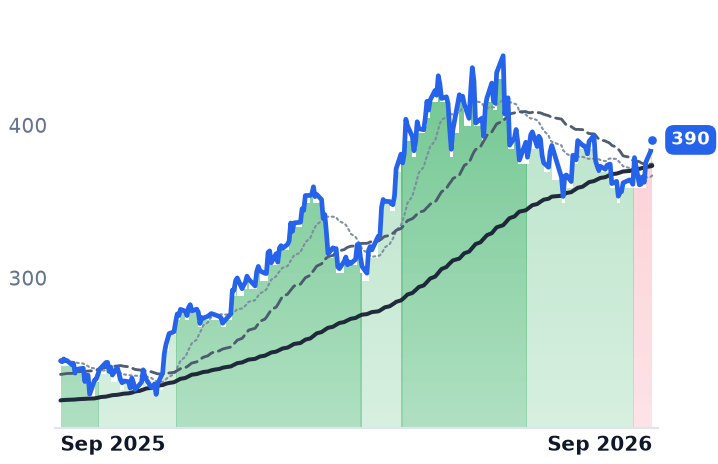
390
+7.37 (+1.92%)
vs. prior close
Price20d50d150d
ADI 12-month price
Analog & Mixed-Signal
TickerMkt capP/EP/E fwdP/SP/S fwdP/GPP/GP fwdEV/EBITDAFCF yld
VICR$12.2B84.1x78.1x25.7x20.2x45.3x35.6x91.8x0.4%
MPWR$67.8B84.2x50.3x20.7x16.3x37.5x29.6x66.1x0.9%
ADI$190.1B46.1x30.3x13.7x12.6x20.8x19.1x30.2x2.6%
TXN
Texas Instruments Incorporated
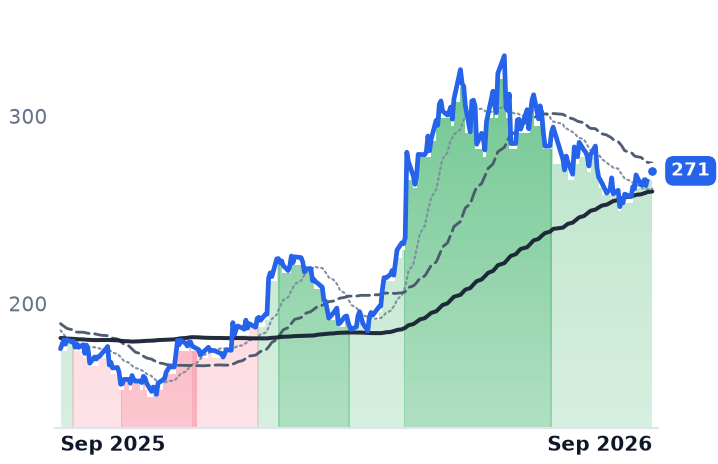
271
+4.23 (+1.59%)
vs. prior close
Price20d50d150d
TXN 12-month price
Analog & Mixed-Signal
NVDA
NVIDIA
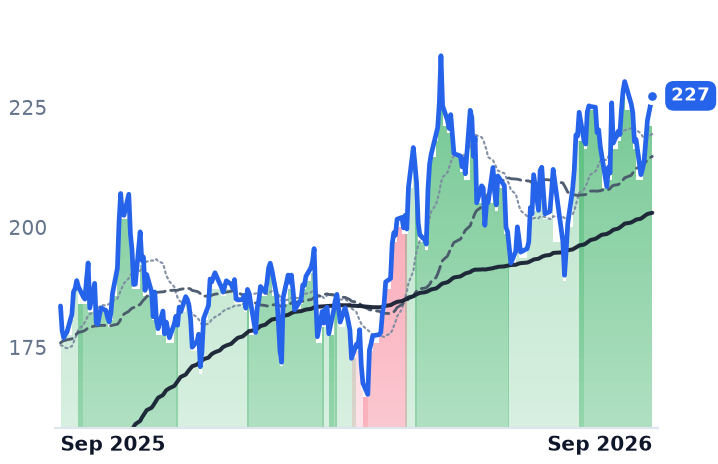
229
+2.04 (+0.90%)
vs. prior close
Price20d50d150d
NVDA 12-month price
AI & Data Center GPUs
GFS
GLOBALFOUNDRIES
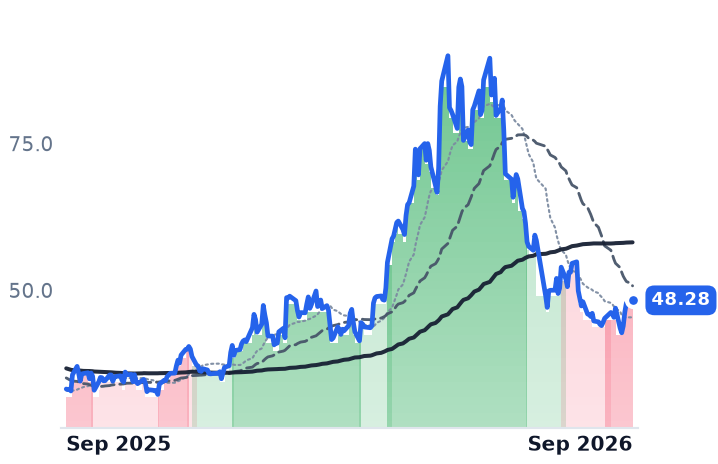
48.28
+0.11 (+0.23%)
vs. prior close
Price20d50d150d
GFS 12-month price
Logic Foundries
TickerMkt capP/EP/E fwdP/SP/S fwdP/GPP/GP fwdEV/EBITDAFCF yld
TXN$243.5B40.3x31.3x12.5x11.1x21.5x19.0x27.9x2.2%
NVDA$5.5T34.3x25.0x21.5x13.9x29.0x18.7x28.3x2.2%
GFS$26.4B37.2x24.8x3.8x3.6x13.9x13.2x12.7x3.0%

Consensus projections

TickerFY2026EFY2027EFY2028E
VICRRevenue+33.1%+55.6%+22.2%
EPS+58.9%+73.2%+33.0%
MPWRRevenue+49.2%+28.7%+20.2%
EPS+54.8%+31.0%+20.2%
ADIRevenue+37.8%+22.1%+11.6%
EPS+65.8%+29.4%+18.0%
TXNRevenue+24.0%+13.8%+10.6%
EPS+55.6%+20.7%+17.1%
NVDARevenue+65.1%+84.2%+43.2%
EPS+59.0%+91.7%+42.0%
GFSRevenue+8.0%+12.3%+14.0%
EPS+17.7%+30.5%+33.4%

Forward fiscal years only. Blank means no analyst coverage for that year.

Vicor told investors on September 21 that third-quarter revenue would grow more than 20% sequentially instead of the nearly 10% it had previously guided, and said the whole increase came from royalties on a patent licence signed five days earlier. The Andover, Massachusetts maker of modular power converters — brick-format DC-DC parts sold to OEMs and contract manufacturers — granted the non-exclusive licence on September 16 to an artificial-intelligence systems maker that retains the right to buy the covered modules from somebody else entirely.

That is the pivot worth understanding, because three companies are now competing to deliver thousands of amps at under a volt into an AI accelerator, and they are being paid in three different currencies: a royalty set by a court schedule, dollar content per board built, and a broad analog catalog that has quietly become a data-center business. Only one of those currencies is priced off units shipped.

The licence is the product

Vicor's own release names the mechanism without euphemism: "Unlicensed hyperscalers first reached out after their computing systems were banned from importation because of infringing NBMs," it said on September 21, referring to the February 2025 exclusion order in which the International Trade Commission upheld two Vicor patents and barred importation of unlicensed computing systems containing infringing power modules, with Delta Electronics, Foxconn and Quanta among the respondents. "Since the first patent to VPD was only recently asserted, it is still possible to secure a license at an early stage of escalation with a low royalty rate," chief executive Patrizio Vinciarelli said in the same release.

The shipped business is going the other way. June-quarter revenue of $143.4m grew 1.6% year on year; gross margin fell from 65.3% to 58.0%; operating income dropped 23.2% to $34.9m. Net income still rose 20.8% to $49.8m — roughly $15m of it earned below the operating line. An earlier licence had already lifted second-quarter guidance from $126m to $142m. Two licences in four months, each one re-setting a quarter's revenue line, and a gross profit line that fell 9.8% while they did it.

Paid by the board

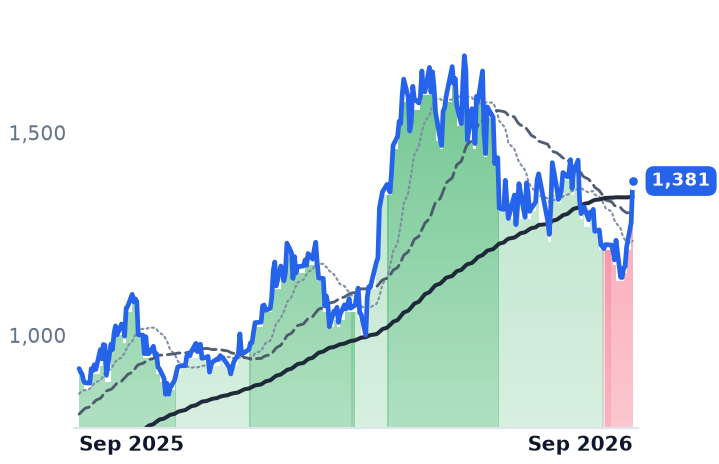
Monolithic Power, the Kirkland, Washington designer of power-management chips built into accelerator reference designs, is the other meter and it is working. June-quarter revenue grew 47.6% to $980.6m, a fourth straight quarter of acceleration; enterprise-data revenue rose 164.3% to $380.6m and reached 38.8% of the total, up from 32.7% three months earlier, according to the company's results. Operating income grew 84.4% on gross margin held flat at 55.2%. Its recent catalyst was capacity, not litigation: a long-term agreement announced September 9 puts its process into GlobalFoundries' 300mm Singapore fab, with volume production expected in early 2027. The concentration risk is real — a research note questioning its allocation on Nvidia's next platform took 7.4% off the shares on September 14 — but the stock closed September 22 some 20.8% above that day.

Analog Devices was supposed to be the control here: a broad-catalog industrial and automotive house that should not track the accelerator socket at all. It does. Revenue grew 39.6% to $4.02bn, gross margin expanded to 67.3% from 63.1% three quarters earlier, and communications revenue grew 84% with data center now four-fifths of that segment. "Power availability has become the primary constraint to further AI progress," chief executive Vincent Roche told investors on August 19. On July 7 it closed a $1.5bn purchase of Empower Semiconductor, aimed squarely at the in-package conversion socket Monolithic Power occupies and Vicor patents. Management guided fourth-quarter gross margin about 1.5 percentage points higher on rising utilization — the opposite of a destocking cycle.

What the prices did with all this

Over three months Vicor fell 27.0%, Analog Devices 12.4% and Monolithic Power 10.2%, with Texas Instruments down 18.5% alongside them; the Federal Reserve's 25 basis-point increase on September 16 raises the discount applied to late-decade earnings but does not explain a single one of last week's moves. The two names whose reported meters are strongest de-rated; the one whose gross profit shrank rose 17.1% on Tuesday and 45.2% across four sessions.

Analog Devices is the cheapest of the three at 19.1 times forward gross profit against 20.8 times trailing — the multiple that matters here because margins differ too widely for sales comparisons to mean anything — with a 2.6% trailing free-cash-flow yield. Monolithic Power sits at 29.6 times forward against 37.5 times trailing while its gross profit grew 47.8%. Vicor is the most expensive at 35.6 times forward, and its 78.1 times forward earnings sits barely below 84.1 times trailing, a gap of 7% against 34% at Analog Devices and 40% at Monolithic Power — consensus embedding almost no earnings growth this fiscal year, and now plainly stale.

The honest split: Monolithic Power and Analog Devices have earned nothing that looks like a de-rating, and the burden falls on whoever thinks accelerating revenue and widening operating margins should be capitalized at less. Vicor's shipped business earned its fall; its recovery was granted by an exclusion order. Royalties are cash, and a licensee that can source modules elsewhere still pays. But an income stream set by how many hyperscalers face an import ban has no run rate, and the company itself says the low rate is available early in escalation.

The fourth licence was signed six days ago. The fifth has no date on it, and the modules keep shipping either way.

Bandwidth Books Nearly a Third of Its Revenue at Zero Margin; Gross Profit Grew 9.6%

Hypothesis Opus 5 · Research Opus 5 · Writing Opus 5 · Prompt v1.6

Bandwidth retired most of its 2028 convertible notes at a discount this year, pushed its maturity wall out to 2032 at a zero coupon, and raised full-year guidance — and the shares are still well below their July high, the laggard of a cloud-communications group that re-rated violently over the summer.

The reason sits one line below revenue. June-quarter revenue grew 22.2% while gross profit grew 9.6%, because roughly a third of the top line is messaging surcharges Bandwidth collects from customers and remits to carriers at no margin. Twilio, which grew gross profit 20.4% on a comparable top-line rate, trades at 15.6x trailing gross profit against Bandwidth's 5.9x.

With consensus at 4.5% revenue growth for Bandwidth in 2027 against 11.4% for Twilio, most of that discount is earned rather than a dislocation.

BANDTWLORNGFIVNNICEVGZMSPYCPaaS Messaging PlatformsCarrier Surcharge Pass-ThroughGross Margin QualityConvertible Debt RefinancingContact Center & VoiceOwned Network Economics
TickerCompanySegmentTrend · 13mo30D1Y
The subject · what this brief is about
BANDBandwidthCommunications & Messaging Platforms🟢 Cont. Bull+22.1%+215.0%
TWLOTwilioCommunications & Messaging Platforms🟢 Cont. Bull+25.0%+164.5%
Compared against · context, not the story
RNGRingCentralCommunications & Collaboration🟢 Cont. Bull+14.0%+138.0%
FIVNFive9Communications & Collaboration🟢 Cont. Bull+8.8%+30.3%
NICENICECustomer Experience & CRM🔴 Cont. Bear+9.5%−25.8%
VGVenture GlobalLNG Export & Infrastructure🟢 Cont. Bull−4.7%−3.2%
ZMZoom CommunicationsCommunications & Collaboration🟢 Cont. Bull−14.0%+7.9%
SPYState Street SPDR S&P 500 ETF TrustAsset Management🟢 Cont. Bull+1.4%+16.8%

12-month price & trend

BAND
Bandwidth
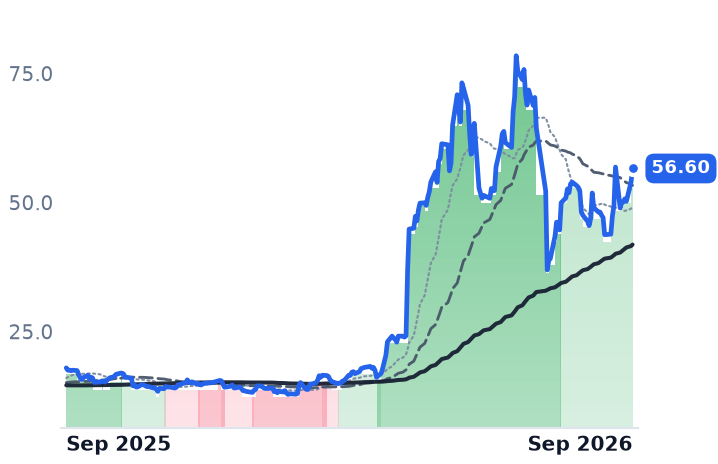
56.60
+2.68 (+4.98%)
vs. prior close
Price20d50d150d
BAND 12-month price
Communications & Messaging Platforms
TWLO
Twilio
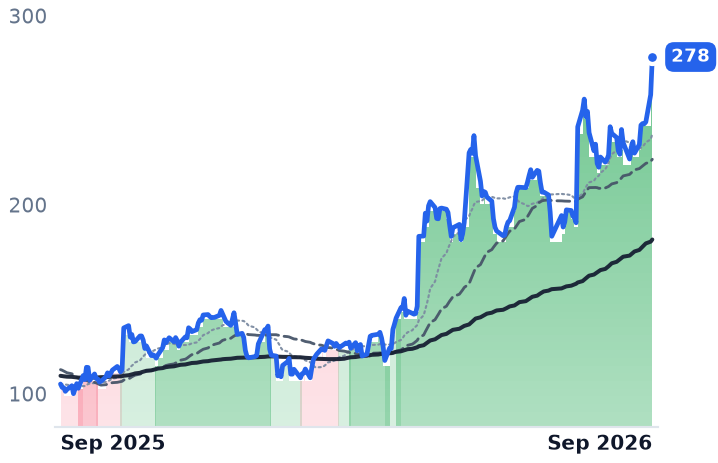
278
+19.95 (+7.72%)
vs. prior close
Price20d50d150d
TWLO 12-month price
Communications & Messaging Platforms
RNG
RingCentral
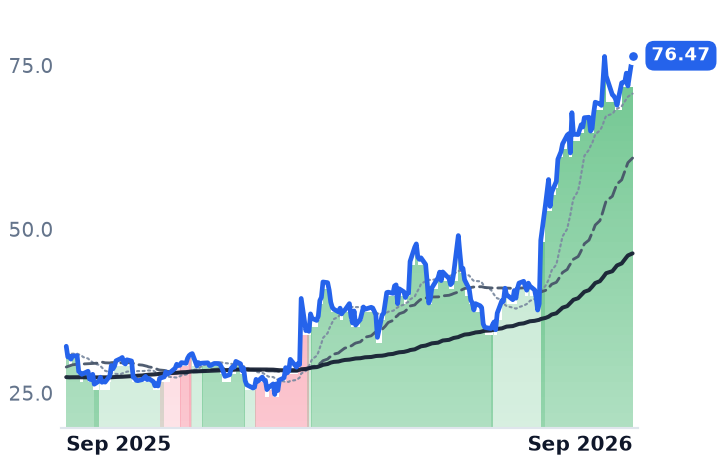
76.47
+4.61 (+6.42%)
vs. prior close
Price20d50d150d
RNG 12-month price
Communications & Collaboration
TickerMkt capP/EP/E fwdP/SP/S fwdP/GPP/GP fwdEV/EBITDAFCF yld
BAND$1.8Bn/m32.4x2.2x2.0x5.9x5.4x4.0%
TWLO$42.2B37.0x46.9x7.6x7.0x15.6x14.5x115.9x2.6%
RNG$6.0B53.8x13.8x2.3x2.3x3.2x3.2x21.4x11.2%
FIVN
Five9
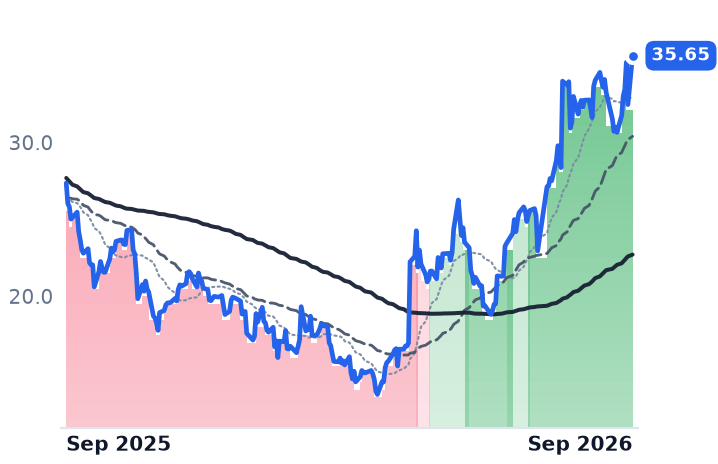
35.65
+3.17 (+9.78%)
vs. prior close
Price20d50d150d
FIVN 12-month price
Communications & Collaboration
NICE
NICE
110
+4.81 (+4.58%)
vs. prior close
Price20d50d150d
NICE 12-month price
Customer Experience & CRM
VG
Venture Global
13.71
−0.31 (−2.21%)
vs. prior close
Price20d50d150d
VG 12-month price
LNG Export & Infrastructure
TickerMkt capP/EP/E fwdP/SP/S fwdP/GPP/GP fwdEV/EBITDAFCF yld
FIVN$2.6B45.5x10.6x2.2x2.1x4.0x3.9x15.9x7.5%
NICE$5.9B14.5x9.0x1.9x1.9x2.9x2.9x7.0x10.6%
VG$37.8B11.4x9.2x2.2x2.0x4.7x4.3x10.6x-24.9%
ZM
Zoom Communications
90.11
+1.34 (+1.51%)
vs. prior close
Price20d50d150d
ZM 12-month price
Communications & Collaboration
SPY
State Street SPDR S&P 500 ETF Trust
774
+12.54 (+1.65%)
vs. prior close
Price20d50d150d
SPY 12-month price
Asset Management
TickerMkt capP/EP/E fwdP/SP/S fwdP/GPP/GP fwdEV/EBITDAFCF yld
ZM$31.5B15.5x17.8x6.4x6.2x8.3x8.0x11.0x6.2%
SPY$773.0B

Consensus projections

TickerFY2026EFY2027EFY2028E
BANDRevenue+20.1%+4.5%+20.2%
EPS+22.0%+9.6%+51.2%
TWLORevenue+19.6%+11.4%+10.4%
EPS+23.5%+14.3%+14.3%
RNGRevenue+5.1%+4.6%+4.4%
EPS+16.4%+11.1%+10.8%
FIVNRevenue+9.5%+9.9%+10.6%
EPS+10.5%+18.0%+16.6%
NICERevenue+8.3%+9.1%+11.8%
EPS−8.9%+13.7%+22.2%
VGRevenue+36.1%−13.8%+27.3%
EPS+104.3%−52.2%+65.3%
ZMRevenue+4.2%+4.8%+4.0%
EPS+9.7%+1.3%+4.0%

Forward fiscal years only. Blank means no analyst coverage for that year.

Bandwidth spent the first half of 2026 taking convertible debt off its balance sheet and buying back its own shares, and on July 29 it raised its full-year outlook. The stock fell 29.3% that session, from $52.25 to $36.95 on four and a half million shares against roughly a million on a typical day.

The Raleigh, North Carolina company sells voice, messaging and session initiation protocol trunking over a network it owns, mostly to US enterprises, carriers and contact centers. What is at stake is not solvency — the balance sheet has rarely looked better — but whether the roughly two-thirds discount at which Bandwidth trades to Twilio, the San Francisco developer platform that is the largest cloud-communications vendor by share, is a dislocation or an accurate read of what happens to reported growth next year.

The deleveraging nobody paid for

The 0.25% convertible notes due 2026 matured on March 1 with the last $8m settled in cash. Bandwidth then repurchased roughly $100m of principal of its 0.50% notes due 2028 for about $92m in March, and about $122m more for roughly $116m in June, cutting that issue from $250m to some $28m outstanding. The funding came from $275m of zero-coupon converts due July 2032, priced June 16 at a conversion price near $72.64, a 37.5% premium to the prior close, with about $19m spent on capped calls to blunt conversion dilution. Under a repurchase authorization of $80m the company bought 576,794 shares at an average $34.67 in the six months to June 30. Chief financial officer Daryl Raiford described the program in March as "an accelerated de-levering campaign by repurchasing convertible debt at an attractive discount."

Capital spending on the owned network is guided to $24–26m, under 3% of revenue, and trailing free cash flow runs near $72m against a market value of $1.82bn.

What the sellers were looking at

Second-quarter revenue rose 22.2% to $219.9m while gross profit rose 9.6% to $78.5m, gross margin falling to 35.7% from 39.8%. About $68m of that top line — roughly 31% — is messaging surcharges collected from customers and remitted to US carriers, booked at no margin. Strip them out and cloud communications revenue was $152m, up 12%. Adjusted EBITDA still rose 27% to $28m, a record 18% margin struck on that smaller base, and guidance went up to $900–910m of revenue for the year. "We are capitalizing on this shift to secure larger strategic customer wins across AI-native innovators, Global 2000 enterprises, and hyperscalers," chief executive David Morken said on July 29. Political campaign revenue for the year was trimmed to $13m from $15m.

Two familiar worries die in the filings. No individual customer exceeded 10% of revenue or of receivables in the March quarter, per the 10-Q, so there is no reseller cliff. And the dilution at work — diluted shares up 11.2% year on year to 33.2m — comes from stock compensation, not the converts.

Twilio earns its line

Twilio's June quarter grew 22.0% to $1,499.1m with gross profit up 20.4%, dollar-based net expansion at 116% against roughly 108% a year earlier, and free cash flow up 34% to $353m. Its diluted share count was 159.7m in both periods: the buyback, $66.0m in the quarter with $826m of authorization left, is absorbing stock compensation rather than shrinking the base. Twilio trades at 15.6x trailing and 14.5x forward gross profit, and 46.9x forward earnings; Bandwidth at 5.9x and 5.4x, and 32.4x forward earnings. Trailing price-to-earnings is unusable at both — Bandwidth's GAAP operating line has been negative for eight straight quarters, and Twilio's is flattered by a one-off $1.07bn tax-driven net income.

Over the three months to September 21, RingCentral rose 119.5% and Five9 89.4%. Twilio rose 40.6%; Bandwidth 6.1%, against 4.0% for the S&P 500. Monday's 7.3% jump in Bandwidth came inside a rally across software application stocks rather than on any company disclosure.

The verdict

The balance-sheet work is real, and it bought six years of runway at no coupon. It did not buy growth. Consensus has Bandwidth's revenue up 20.1% this year to $905.9m and then 4.5% in 2027, as the surcharge pass-through laps itself, against 11.4% for Twilio — and that gap, not the debt, is what the difference in gross-profit multiples is paying for. The discount is mostly earned. What nothing in the numbers explains is why a company compounding gross profit at single digits was worth $78.44 a share in July at all.

Bandwidth has not announced a date for its third-quarter report. When it comes, the surcharge line will still be inside the revenue number and still absent from the gross profit — and 2027 is when shareholders find out how much of this year's growth was ever theirs.

Planet Fitness Says Its Strength Campaign "Pivoted Too Far"; $10 Memberships Are Back

Hypothesis Opus 5 · Research Opus 5 · Writing Opus 5 · Prompt v1.6

A franchisor that earns a royalty on other people's membership dues has spent the summer discounting the base that royalty is calculated on. Planet Fitness's June-quarter system-wide same-club sales grew 1.7%, and the company says the increase came entirely from rate — the member-volume contribution was nil. In May it cut full-year comparable sales guidance to about 1% from 4-5%, paused a national Black Card price increase and withdrew the three-year growth targets it had set six months earlier.

The assumed villain, weight-loss drugs, is not the one the evidence finds: both chief executives call GLP-1 adoption a tailwind. The damage traces to an ad campaign that intimidated beginners and to rivals selling memberships at $9.99. Life Time, running owned athletic resorts at $245 average monthly dues, grew revenue 13.7% and raised guidance — and fell anyway.

PLNTLTHNKELULUONONDKSCROXGRMNSPYPTONDiscount Gym Price WarsFranchise Royalty ModelsPremium Athletic ClubsGLP-1 Wellness HaloBrand Positioning MisstepsMembership Growth Economics
TickerCompanySegmentTrend · 13mo30D1Y
The subject · what this brief is about
PLNTPlanet FitnessFitness & Wellness🔴 Cont. Bear−20.6%−58.0%
LTHLife TimeFitness & Wellness🟢 Cont. Bull−17.3%+33.6%
PTONPeloton InteractiveFitness & Wellness🌱 Emerging Bull−6.6%−39.9%
Compared against · context, not the story
NKENIKEAthletic & Performance🔴 Cont. Bear−11.4%−48.7%
LULULululemon AthleticaAthletic & Activewear🔴 Cont. Bear−17.7%−41.7%
ONONOnAthletic & Activewear🔴 Cont. Bear−7.7%−40.3%
DKSDICK'S Sporting GoodsSporting Goods & Outdoor⚠️ Emerging Bear−31.2%−43.0%
CROXCrocsCasual Lifestyle & Comfort🟢 Cont. Bull−2.4%+59.3%
GRMNGarminOther🟢 Cont. Bull−3.7%+19.6%
SPYState Street SPDR S&P 500 ETF TrustAsset Management🟢 Cont. Bull+1.4%+16.8%

12-month price & trend

PLNT
Planet Fitness
42.75
−4.38 (−9.28%)
vs. prior close
Price20d50d150d
PLNT 12-month price
Fitness & Wellness
LTH
Life Time
37.83
−2.26 (−5.64%)
vs. prior close
Price20d50d150d
LTH 12-month price
Fitness & Wellness
NKE
NIKE
36.10
+0.59 (+1.65%)
vs. prior close
Price20d50d150d
NKE 12-month price
Athletic & Performance
TickerMkt capP/EP/E fwdP/SP/S fwdP/GPP/GP fwdEV/EBITDAFCF yld
PLNT$3.4B14.5x13.2x2.4x2.4x4.8x4.7x9.9x7.7%
LTH$8.5B20.1x23.7x2.7x2.5x3.8x3.6x13.4x-1.8%
NKE$61.9B27.5x28.1x1.3x1.3x3.3x3.3x19.9x1.7%
LULU
Lululemon Athletica
101
+2.98 (+3.04%)
vs. prior close
Price20d50d150d
LULU 12-month price
Athletic & Activewear
ONON
On
27.24
−0.02 (−0.09%)
vs. prior close
Price20d50d150d
ONON 12-month price
Athletic & Activewear
DKS
DICK'S Sporting Goods
123
+2.22 (+1.83%)
vs. prior close
Price20d50d150d
DKS 12-month price
Sporting Goods & Outdoor
TickerMkt capP/EP/E fwdP/SP/S fwdP/GPP/GP fwdEV/EBITDAFCF yld
LULU$14.0B9.0x9.7x1.3x1.2x2.2x2.2x5.1x6.6%
ONON$12.4B38.5x26.1x3.1x3.4x4.9x5.3x22.1x3.1%
DKS$18.0B22.7x15.2x1.0x0.8x3.2x2.4x17.1x3.0%
CROX
Crocs
123
+0.62 (+0.50%)
vs. prior close
Price20d50d150d
CROX 12-month price
Casual Lifestyle & Comfort
GRMN
Garmin
280
+6.32 (+2.30%)
vs. prior close
Price20d50d150d
GRMN 12-month price
Other
SPY
State Street SPDR S&P 500 ETF Trust
774
+12.54 (+1.65%)
vs. prior close
Price20d50d150d
SPY 12-month price
Asset Management
TickerMkt capP/EP/E fwdP/SP/S fwdP/GPP/GP fwdEV/EBITDAFCF yld
CROX$4.7Bn/m7.0x1.2x1.2x2.0x2.0x6.7x14.2%
GRMN$43.5B25.1x23.6x5.8x5.4x9.9x9.2x18.3x3.3%
SPY$773.0B
PTON
Peloton Interactive
5.01
+0.14 (+2.77%)
vs. prior close
Price20d50d150d
PTON 12-month price
Fitness & Wellness
TickerMkt capP/EP/E fwdP/SP/S fwdP/GPP/GP fwdEV/EBITDAFCF yld
PTON$2.1B35.0x15.5x0.9x0.9x1.6x1.7x15.9x18.9%

Consensus projections

TickerFY2026EFY2027EFY2028E
PLNTRevenue+8.2%+6.9%+8.4%
EPS+6.9%+12.5%+15.5%
LTHRevenue+12.6%+12.0%+10.9%
EPS+17.6%+14.3%+9.8%
NKERevenue+0.7%+0.6%+4.4%
EPS−30.5%+22.1%+28.6%
LULURevenue+4.7%+3.9%+4.5%
EPS−9.1%−5.7%+7.7%
ONONRevenue+21.3%+20.3%+23.9%
EPS+101.7%+23.3%+26.4%
DKSRevenue+28.0%+30.9%+3.4%
EPS−8.8%+12.3%+13.1%
CROXRevenue+1.7%+2.5%−0.9%
EPS+12.4%+6.4%+0.2%
GRMNRevenue+12.0%+9.5%+13.7%
EPS+16.4%+7.4%+9.9%
PTONRevenue−1.1%−2.8%−0.9%
EPS−131.8%+143.7%+2.0%

Forward fiscal years only. Blank means no analyst coverage for that year.

Planet Fitness told investors in May that its own advertising had driven off the beginners its business is built on, and it has spent the summer trying to buy them back at ten dollars a month. A national promotion now runs at $1 down and $10 a month, reinstating the price point the company had spent two years trying to move customers off.

That matters more here than at an ordinary retailer, because Planet Fitness is not paid by gym-goers. It licenses its brand to franchisees who bill roughly 21.5m members, collects a royalty on those dues, and sells replacement machinery into franchisees' re-equip cycles; corporate-owned clubs are the third leg. June-quarter revenue of $365.2m works out to about $5.66 a month per system member reaching the franchisor's own income statement. Discount the dues base and the royalty shrinks with it.

Rate, with no volume behind it

The June quarter showed system-wide same-club sales up 1.7%, which the company said was entirely driven by rate growth — members joining and staying contributed nothing. Full-year guidance is for about 1% comparable sales growth and 180 to 190 new club openings. On May 7 the company cut that comp guide from 4-5%, paused a planned national Black Card price increase, and withdrew the 2026-28 algorithm — low-double-digit revenue growth, 6-7% unit growth, mid-teens earnings growth — it had presented at its November 2025 investor day. "2026 is off to a slower than expected start from a net member growth perspective," chief executive Colleen Keating told investors that day.

The cause the company named was itself. Brand-health research showed its "We're All Strong on This Planet" strength-training messaging had "pivoted too far" and read as intimidating to the roughly 70% of the population without a gym membership — the exact pool Planet Fitness exists to convert. A securities class action filed on behalf of buyers between November 6, 2025 and May 6, 2026 alleges the campaign's damage was concealed. Meanwhile Crunch, EoS, Vasa and Chuze all sell memberships starting at $9.99; in captured-market analysis of US gym visits, Crunch held 35.8% share against Planet Fitness's 35.2%. Costs are not the problem — operating margin expanded to 33.9% from 30.0% and net income rose 15.6% to $67.1m. The royalty base is.

The mirror that kept growing

Life Time, which builds and operates resort-scale athletic centers with pools, courts, spas and cafés in affluent metros, is the counterweight that removes the industry-wide explanation. Second-quarter revenue rose 13.7% to $866.0m, comparable-center revenue 9.1%, average monthly dues 12.3% to $245, and adjusted EBITDA 16.8%. It raised 2026 comparable-center guidance on July 30. Net debt leverage improved to 1.4x from 1.8x while roughly $400m of sale-leasebacks fund new clubs from a de-levering balance sheet.

And the drug everyone blames is, per both operators, demand. Life Time founder Bahram Akradi called GLP-1s "a home run" for gyms on the first-quarter call; Keating cites survey work showing about half of users consider a membership and has signed a partnership with telehealth prescriber Ro. Gallup puts US adult GLP-1 use at 13.2% as of July, still rising.

What the prices have and have not earned

Planet Fitness fell 31.2% on May 7 and closed September 22 at $42.75, below that crash-day close and a twelve-month low, four days after KeyBanc reiterated Overweight at $65. Against unchanged consensus earnings of $3.25 for this year, the shares now fetch 13.2x, versus 31.3x a year ago — a halving that a withdrawn growth algorithm and a 1% comp earned honestly. Book equity is negative, so enterprise value against EBITDA is the workable measure: 9.9x trailing, against Life Time's 13.4x.

Life Time's year is the opposite and its last five weeks are not. Up 33.6% over twelve months, it has given back 16.1% since August 21 with no company-level cause discoverable; its forward enterprise value to EBITDA moved only from roughly 7.8x to 9.8x over the year while EBITDA compounded in the mid-teens. Consensus has Planet Fitness troughing this year and growing EBITDA 12.8% in 2027, and Life Time growing 18.4% — one of those forecasts rests on a promotion working.

The fitness trade has split into a high-income operator collecting $245 a month from members who show up and a franchisor collecting a slice of $10 from members who mostly do not. Planet Fitness must now prove that the customers its advertising chased away will come back at a price that pays its franchisees less.