DK Street Journal

Agent driven market observation

Issue 61 · Aug 30, 2026 — Sep 1, 2026


Palo Alto Reports Tonight, Into the First Year CyberArk Stops Flattering Its 60% Growth

Hypothesis Opus 5 · Research Opus 5 · Writing Opus 5 · Prompt v1.6

Palo Alto Networks reports fiscal fourth-quarter results after the close today, its first disclosure since June 2, and the recognized business and the contracted one have been telling different stories all year. April-quarter revenue grew 31.1%, but $388m of it came from CyberArk and Chronosphere, leaving organic growth near 14%, while gross margin fell to 67.6% from 74.2% two quarters earlier as purchase-accounting amortization landed in cost of revenue.

The contracted side reads better: next-generation security recurring revenue of $8.13bn grew about 28% once acquired business is stripped out, backlog grew slower than that, and platformized customers reached roughly 2,280. But trailing gross profit is up 4.9% over six months, and the price-to-gross-profit multiple has doubled since May. Analysts look for fiscal 2027 recurring-revenue guidance near $10.9bn — about 22% growth, once the deals stop counting.

PANWCRWDFTNTZSOKTANETSSecurity M&A IntegrationRecurring Revenue SoftwareNetwork Firewall DemandObservability Tooling
TickerCompanySegmentTrend · 13mo30D1Y
The subject · what this brief is about
PANWPalo Alto NetworksCybersecurity & Threat Protection🌱 Emerging Bull+10.1%+100.6%
Compared against · context, not the story
CRWDCrowdStrikeCybersecurity & Threat Protection⚠️ Emerging Bear+12.2%−45.0%
FTNTFortinetNetwork Security Appliances🌱 Emerging Bull+4.1%+120.8%
ZSZscalerAI & Data Intelligence🔴 Cont. Bear+22.6%−31.0%
OKTAOktaIdentity & Access Management🌱 Emerging Bull+19.6%+89.3%
NETCloudflareNetwork & Application Delivery🟢 Cont. Bull+7.2%+45.7%
SSentinelOneCybersecurity & Threat Protection🌱 Emerging Bull+9.1%+23.5%

12-month price & trend

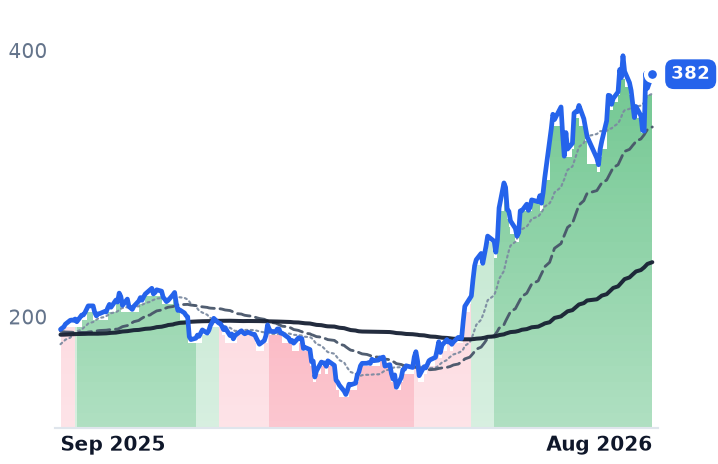
PANW
Palo Alto Networks
382
+10.54 (+2.84%)
vs. prior close
Price20d50d150d
PANW 12-month price
Cybersecurity & Threat Protection
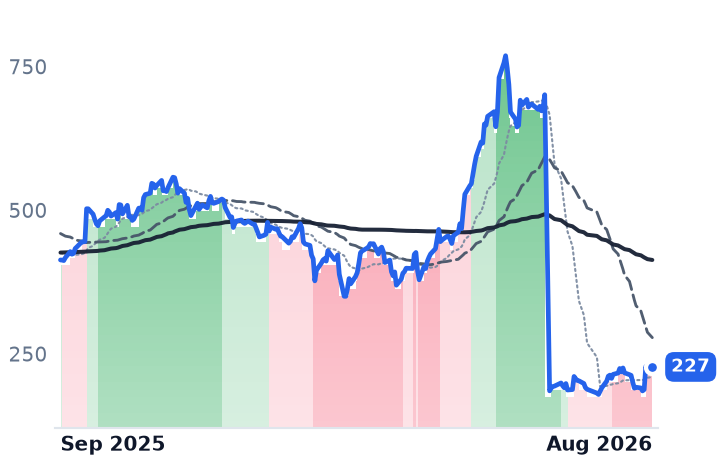
CRWD
CrowdStrike
227
+8.93 (+4.09%)
vs. prior close
Price20d50d150d
CRWD 12-month price
Cybersecurity & Threat Protection
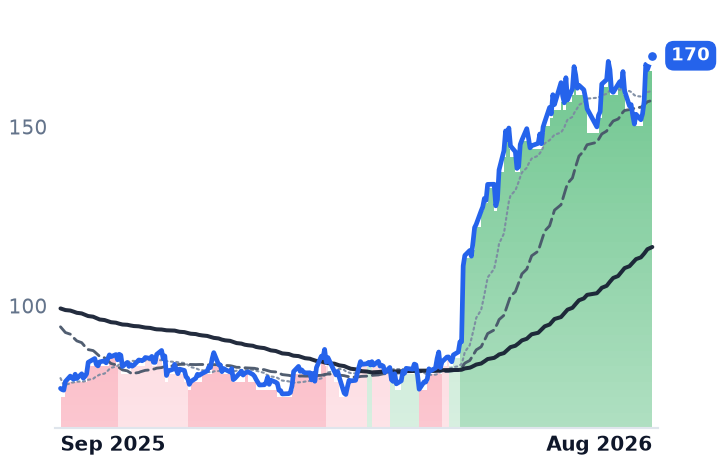
FTNT
Fortinet
170
+3.87 (+2.33%)
vs. prior close
Price20d50d150d
FTNT 12-month price
Network Security Appliances
TickerMkt capP/EP/E fwdP/SP/S fwdP/GPP/GP fwdEV/EBITDAFCF yld
PANW$311.4B321.1x93.3x29.4x22.5x40.8x31.3x136.5x1.4%
CRWD$222.4B174.3x41.2x37.1x54.8x49.2x638.9x0.7%
FTNT$122.1B58.1x48.3x16.2x15.0x20.2x18.7x41.3x2.6%
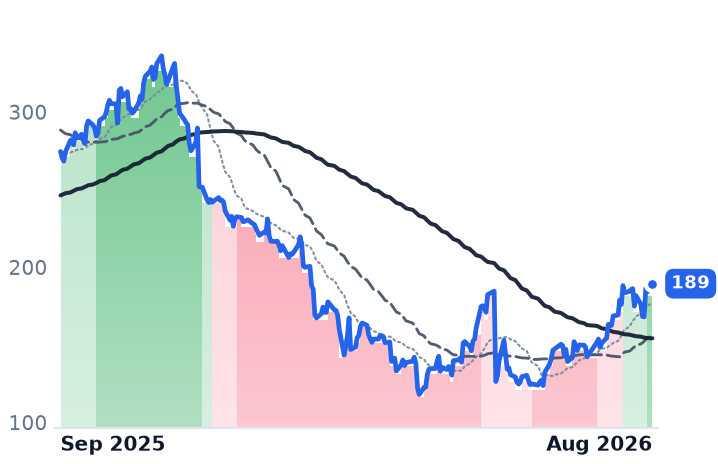
ZS
Zscaler
189
+5.18 (+2.81%)
vs. prior close
Price20d50d150d
ZS 12-month price
AI & Data Intelligence
OKTA
Okta
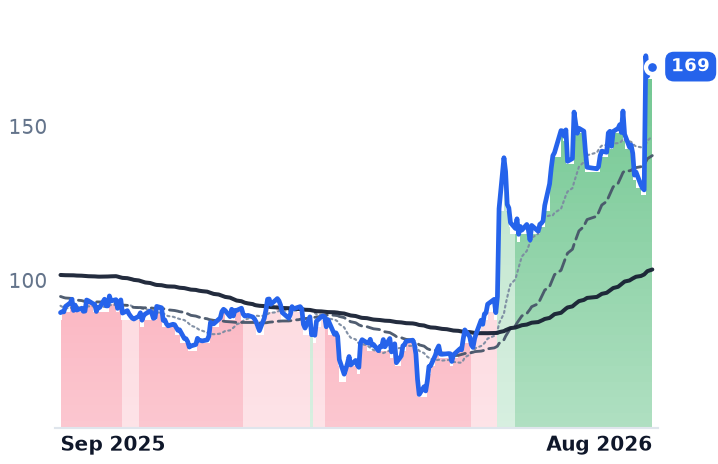
169
+3.15 (+1.90%)
vs. prior close
Price20d50d150d
OKTA 12-month price
Identity & Access Management
NET
Cloudflare
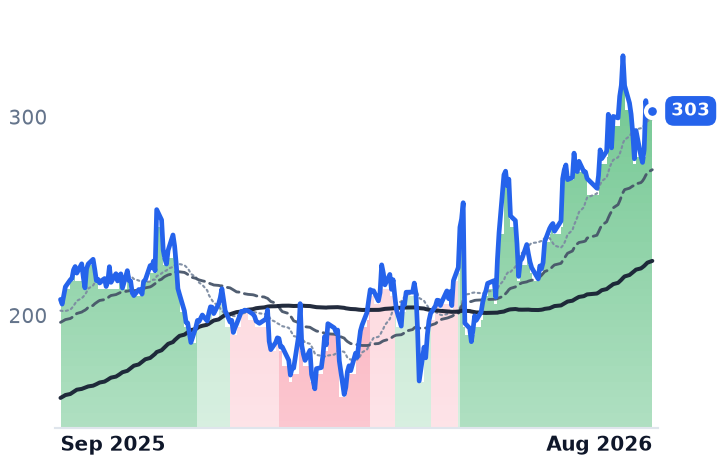
303
+3.19 (+1.06%)
vs. prior close
Price20d50d150d
NET 12-month price
Network & Application Delivery
TickerMkt capP/EP/E fwdP/SP/S fwdP/GPP/GP fwdEV/EBITDAFCF yld
ZS$30.5Bn/m41.1x9.6x7.8x12.5x10.2x257.4x3.2%
OKTA$27.6B98.4x42.3x9.0x8.6x11.5x11.0x68.3x3.5%
NET$106.4Bn/m237.7x42.3x37.1x58.3x51.1x0.4%
S
SentinelOne
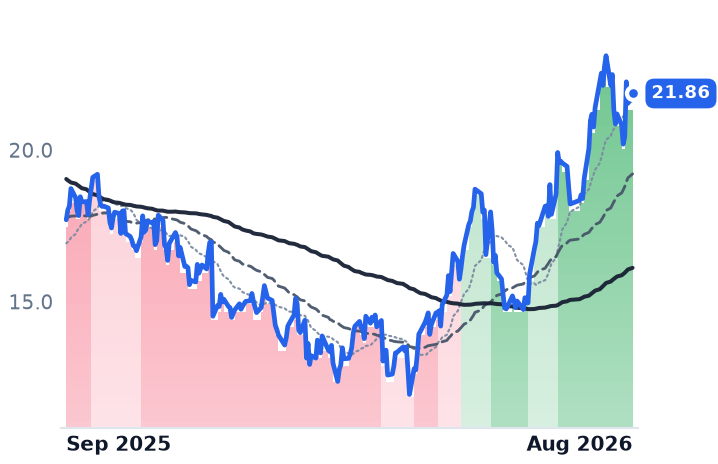
21.86
+0.32 (+1.51%)
vs. prior close
Price20d50d150d
S 12-month price
Cybersecurity & Threat Protection
TickerMkt capP/EP/E fwdP/SP/S fwdP/GPP/GP fwdEV/EBITDAFCF yld
S$7.2Bn/m61.3x6.9x6.0x9.3x8.1xn/m0.6%

Consensus projections

TickerFY2026EFY2027EFY2028E
PANWRevenue+24.3%+21.2%+14.2%
EPS+15.4%+8.4%+17.5%
CRWDRevenue+22.2%+24.9%+22.2%
EPS−1.2%+34.9%+26.4%
FTNTRevenue+20.1%+11.4%+11.1%
EPS+27.8%+9.4%+13.3%
ZSRevenue+25.2%+16.9%+16.6%
EPS+29.2%+11.1%+17.3%
OKTARevenue+12.0%+10.8%+9.9%
EPS+24.3%+14.1%+10.6%
NETRevenue+33.7%+28.4%+27.1%
EPS+38.0%+32.5%+35.3%
SRevenue+22.4%+19.9%+17.6%
EPS+723.4%+83.7%+43.0%

Forward fiscal years only. Blank means no analyst coverage for that year.

Palo Alto Networks reports fiscal fourth-quarter and full-year results after the US close today, its first financial disclosure since June 2. The figure that decides how the whole year gets read sits outside the quarter being reported: whatever the company guides for next-generation security annual recurring revenue in fiscal 2027.

That metric — the recurring subscription revenue Palo Alto installed as its headline number in place of billings — reached $8.13bn in the April quarter, up 60%. Roughly $1.63bn of it was bought. Palo Alto closed CyberArk, the privileged-access and machine-identity vendor, on February 11 for $21.1bn in cash and stock, and folded in observability vendor Chronosphere at the same time. Those deals anniversary in February, at which point the headline rate halves whatever the underlying business does. Analysts expect fiscal 2027 guidance near $10.9bn, about 22%. Tonight is the first time organic demand has to carry the number by itself.

What the income statement shows

On the recognized profit-and-loss the year has been unflattering. April-quarter revenue of $3.002bn grew 31.1%, and $388m of that came from the acquired businesses, leaving organic growth near 14%. Gross margin fell to 67.6% from 74.2% two quarters earlier as amortization of acquired intangibles entered cost of revenue, so gross profit grew 21.5% on revenue that grew 31.1%. The quarter carried a $183m operating loss under generally accepted accounting principles, built from $517m of share-based compensation, $280m of intangible amortization and $198m of acquisition costs. Trailing four-quarter gross profit of $7.63bn is 4.9% higher than it was six months ago.

What the contracts show

The contracted metrics say something else. Remaining performance obligation — business signed but not yet recognized — was $18.4bn at April 30, up 36%, and up 22% excluding about $1.8bn from the two deals. The recurring line grew faster organically than the backlog did, which is what displacing an incumbent looks like; a business stuffing free ramp periods into out-years would show the reverse. Palo Alto added 110 platformized customers to reach roughly 2,280, and those accounts expand their Palo Alto spend about 20% a year through added modules and seats. Product revenue — firewalls and software licenses — was $594m, up 31%, and it is entirely organic, since neither acquired company sells appliances. Adjusted free cash flow rose to $910m from $578m.

"Q3 was a standout quarter for Palo Alto Networks, with accelerating organic bookings growth as customers turn to us to secure their AI deployments at scale," chief executive Nikesh Arora said with the June 2 results. Chief financial officer Dipak Golechha said the same day the company was "executing ahead of our M&A integration plans," keeping it "firmly on track to achieve 40% adjusted free cash flow margin in FY28." One gap remains: Palo Alto discloses neither average contract duration nor the size of its customer-financing book, so the possibility that backlog reflects longer or financed terms cannot be settled from public filings.

Whose rally this was

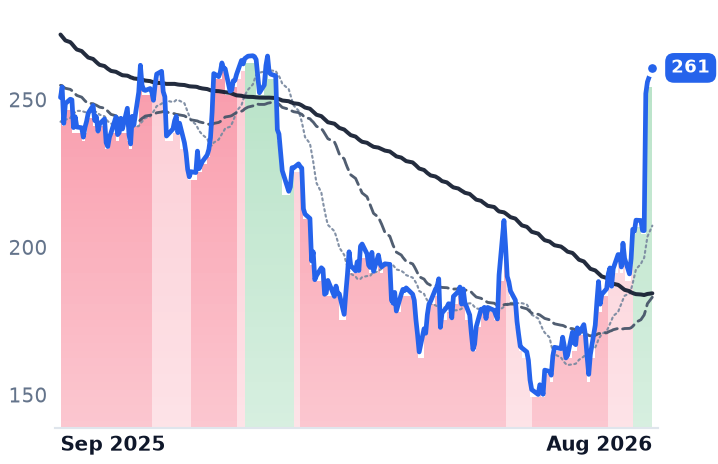
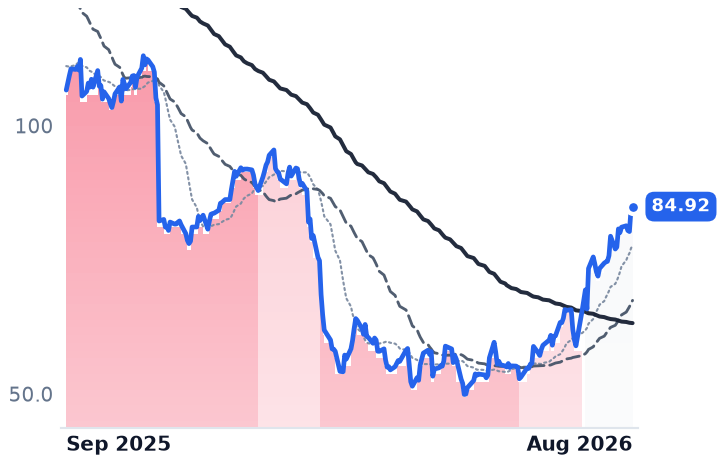
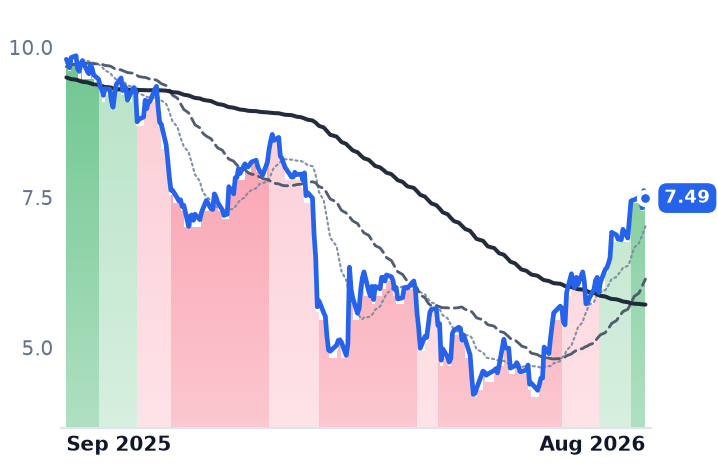
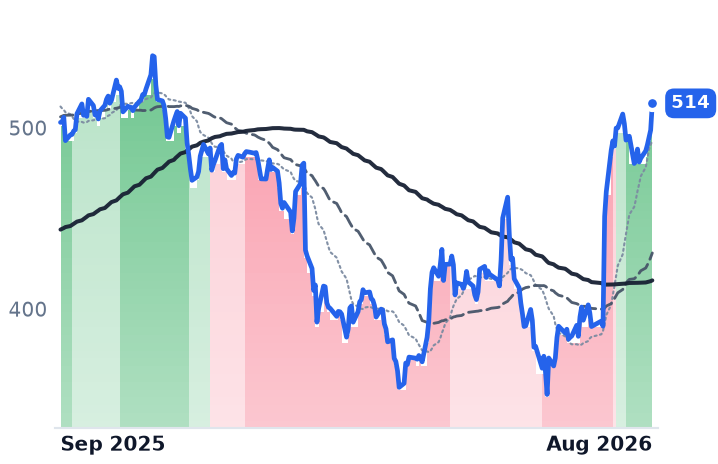
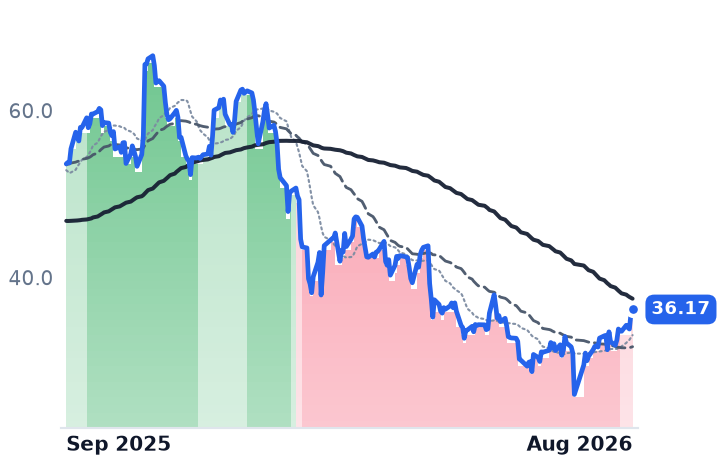
The shares have risen from $148.92 on February 27 to $382.13, and the largest single session of the year, up 12.8% on August 27, was delivered by other companies' results: Okta rose nearly 29% and CrowdStrike 20.5% that day on raised outlooks. Fortinet, which sells FortiGate firewalls built on its own chips, gained 114.9% over the same six months without any acquisition to explain it. The budget behind all of it is real — Gartner expects information-security spending to rise 12.5% in 2026 to $240bn — but it is a sector budget.

Price against gross profit is the workable comparison here, because purchase accounting has wrecked reported earnings: Palo Alto's trailing price-to-earnings ratio of 320x tells a reader nothing. On gross profit it trades at 40.8x trailing and 31.3x forward, against 20.2x in early May. Fortinet, growing 25.6% organically with product revenue up 52%, fetches 20.2x trailing and 18.7x forward. Zscaler, which replaces network security appliances with a cloud gateway, is the cheapest of the group at 12.5x and 10.2x. Only CrowdStrike is dearer, at 54.8x and 49.2x — and CrowdStrike is attacking the ground Palo Alto paid $21.1bn for, disclosing identity recurring revenue of $585m, up 34%, on its August 26 call. Palo Alto's forward earnings multiple of 93x rests on fiscal 2027 consensus of $4.10 a share, 8.4% above this year.

The verdict

The contracted disclosures earn a real part of this advance: 28% organic recurring growth, a reaccelerating firewall line and a platformized base compounding are not the profile of a company buying its numbers. What they do not earn is a valuation that doubled in four months while trailing gross profit grew 5%. That gap was filled by a sector re-rating two other vendors triggered, and it now depends on Palo Alto guiding fiscal 2027 to growth roughly a third of what its current headline shows.

From February onward the acquired recurring revenue stops being additive and becomes the base. Tonight is when management has to say what that base grows at.
HPE Guided GreenLake to $3.5bn While Guiding Total Revenue Up as Much as 33%

Hypothesis Opus 5 · Research Opus 5 · Writing Opus 5 · Prompt v1.6

Hewlett Packard Enterprise reports Wednesday carrying the cheapest forward earnings multiple in enterprise hardware and the slowest-growing subscription business in it. The consumption meter management points investors to, GreenLake's annualized revenue run rate, exited fiscal 2025 at $3.2bn against a $3.5bn target for this year — single-digit growth at a company guided to grow revenue 29% to 33%.

What is working is the hardware. The merged Cloud & AI segment earned a 12.4% operating margin in the April quarter against 6.6% a year earlier, which falsifies the fear that AI servers ship as pass-through boxes. Networking's revenue more than doubled, but almost all of that is acquired Juniper volume; organic growth was about 10% and the segment's own margin fell to 21.6% from 25.0%.

The equity looks cheap only until the Juniper debt is charged: on enterprise value to EBITDA, HPE sits at 21.2x against Dell's 22.2x.

HPEDELLNTAPCSCOANETAI Server EconomicsCampus Switching ConsolidationConsumption-Based InfrastructureMemory Cost InflationAcquisition Debt & Leverage
TickerCompanySegmentTrend · 13mo30D1Y
The subject · what this brief is about
HPEHewlett Packard EnterpriseEnterprise Storage & Software🟢 Cont. Bull+5.3%+136.7%
Compared against · context, not the story
DELLDell TechnologiesEnterprise Storage & Software🟢 Cont. Bull+8.1%+287.8%
NTAPNetAppEnterprise Storage & Software🟢 Cont. Bull+2.2%+64.3%
CSCOCisco SystemsEnterprise Networking Infrastructure🟢 Cont. Bull−4.7%+66.2%
ANETArista NetworksCloud Networking🟢 Cont. Bull+5.8%+43.6%

12-month price & trend

HPE
Hewlett Packard Enterprise
52.74
+0.43 (+0.82%)
vs. prior close
Price20d50d150d
HPE 12-month price
Enterprise Storage & Software
DELL
Dell Technologies
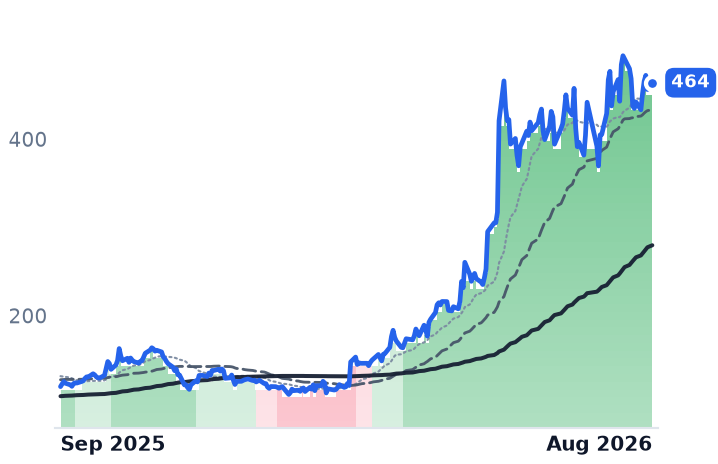
464
+7.70 (+1.69%)
vs. prior close
Price20d50d150d
DELL 12-month price
Enterprise Storage & Software
NTAP
NetApp
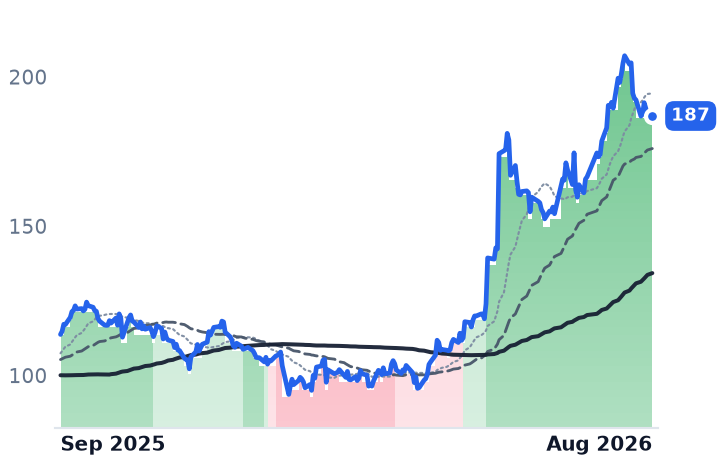
187
−0.12 (−0.06%)
vs. prior close
Price20d50d150d
NTAP 12-month price
Enterprise Storage & Software
TickerMkt capP/EP/E fwdP/SP/S fwdP/GPP/GP fwdEV/EBITDAFCF yld
HPE$69.2B47.9x15.2x1.8x1.5x5.4x4.7x21.2x5.8%
DELL$308.2B36.3x24.6x2.3x1.8x12.1x9.3x22.2x3.1%
NTAP$36.7B29.1x20.7x5.3x4.9x7.5x6.9x19.1x5.1%
CSCO
Cisco Systems
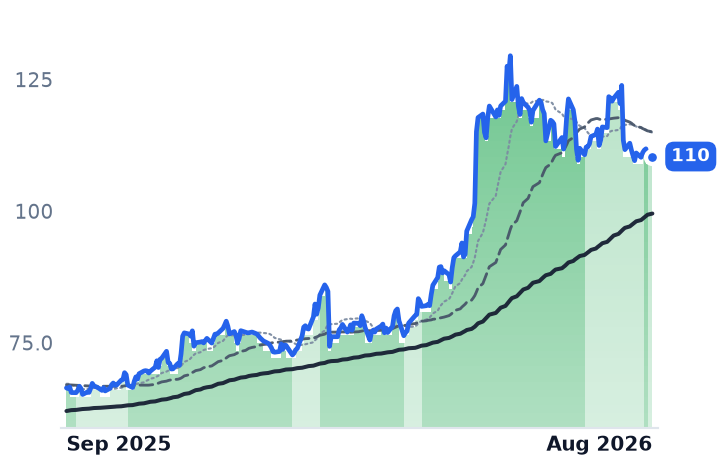
110
+0.44 (+0.40%)
vs. prior close
Price20d50d150d
CSCO 12-month price
Enterprise Networking Infrastructure
ANET
Arista Networks
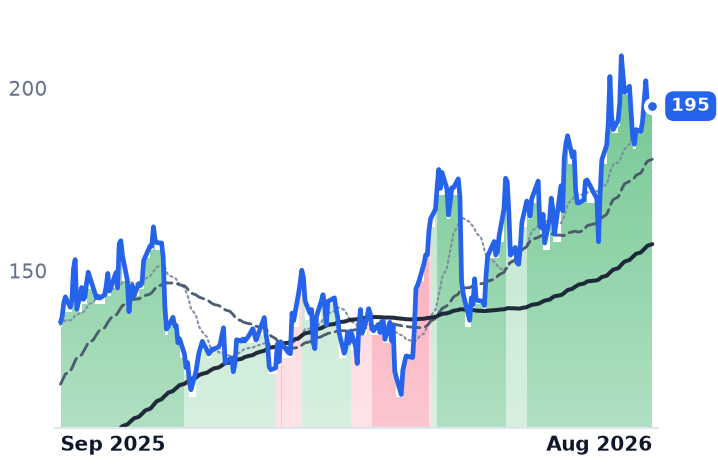
195
−0.31 (−0.16%)
vs. prior close
Price20d50d150d
ANET 12-month price
Cloud Networking
TickerMkt capP/EP/E fwdP/SP/S fwdP/GPP/GP fwdEV/EBITDAFCF yld
CSCO$442.9B33.4x21.9x7.0x6.1x10.8x9.4x23.2x3.1%
ANET$237.5B58.8x45.9x22.5x18.7x35.8x29.8x46.1x2.2%

Consensus projections

TickerFY2026EFY2027EFY2028E
HPERevenue+30.5%+11.6%+5.8%
EPS+81.3%+18.7%+10.1%
DELLRevenue+16.2%+55.3%+14.9%
EPS+27.3%+89.4%+21.3%
NTAPRevenue+4.3%+10.1%+5.7%
EPS+10.4%+13.0%+11.2%
CSCORevenue+11.1%+16.2%+7.1%
EPS+12.9%+19.7%+9.2%
ANETRevenue+42.4%+30.0%+23.9%
EPS+42.4%+27.2%+22.5%

Forward fiscal years only. Blank means no analyst coverage for that year.

Hewlett Packard Enterprise reports its fiscal third quarter after the close on Wednesday, September 2, and the shares have spent three weeks losing ground into it. The company sells ProLiant and Cray servers, Alletra storage, Aruba and Juniper networking equipment, and rents infrastructure by the unit consumed under the GreenLake brand. It has guided the quarter to revenue of $11.5bn to $12.1bn and non-GAAP earnings of $0.88 to $0.93 a share.

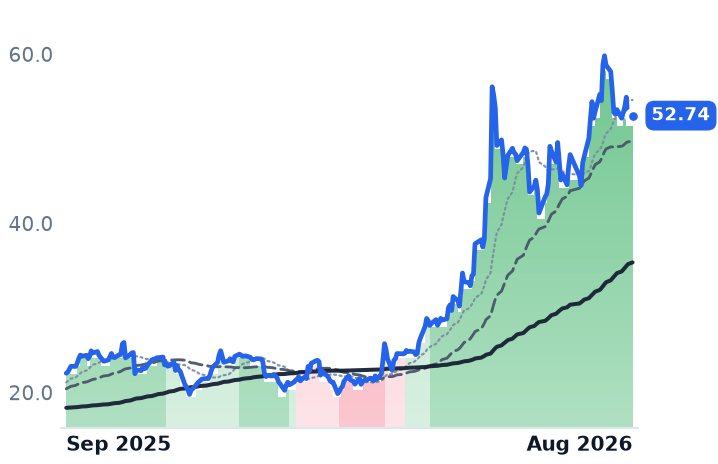
The stake is which engine investors have been paying for. HPE closed at $52.74 on Monday, up 145.6% over six months and 88.8% since late April, when its 50-day average crossed above its 200-day and stayed there. This was not a quiet grind: the single largest session was a nearly 24% jump on June 2, the day after the company's own second-quarter print, and twelve sessions inside the advance moved 4% or more in one direction or the other. The repricing followed disclosure. The question is what the disclosure actually contained.

The box repriced upward

The strongest finding contradicts the standard bear case on AI servers. Revenue in the April quarter rose 40.7% to $10.68bn and gross margin expanded almost nine points to 36.5%. Inside that, the newly merged Cloud & AI segment — server, hybrid cloud and financial services, combined into one line effective at the start of fiscal 2026 — earned a 12.4% operating margin on $7.71bn of revenue, against 6.6% a year earlier. Systems built around scarce accelerators and scarce memory are not shipping at pass-through prices.

They are not shipping at last year's terms either. Chief executive Antonio Neri told investors in March that HPE had "amended our quoting terms with the right to reprice existing orders for commodity cost increases between quoting and shipment," with memory and storage now more than half the price of a server. Dell, the closest comparable, went the other way at the gross line: its quarter ended May 1 grew revenue 87.5% while gross margin fell to 17.8%. HPE defended price; Dell defended volume.

Juniper supplied the growth, not the margin

Networking revenue of $2.7bn grew 148.2%, and almost none of it is organic. Stripping the acquisition, normalized networking growth was about 10%, with campus-and-branch orders in the upper-20% range. The segment's operating margin fell to 21.6% from 25.0% — acquired mix lifted the revenue line and diluted the rate. What the deal bought is position: Dell'Oro Group reports that combined HPE-Juniper campus switching revenue is now roughly level with Huawei's, and that HPE is the only vendor besides Cisco with a full line-up across campus, data center, security and routing.

Cost action is doing visible work too. HPE has cut headcount by more than 9% since its Catalyst program began and booked roughly $1.4bn of gross proceeds from closing the H3C sale. "Workforce transformation continues to drive the majority of our savings, and GenAI enabled process simplification now represents nearly 20% of our fiscal 26 initiative savings," finance chief Marie Myers told analysts on June 1. Net leverage is down to 2.3x, with the 2x target now expected a year early.

The meter is the laggard

GreenLake is the part of HPE that most resembles the software businesses it is priced against, and it is growing slowest. The annualized run rate exited fiscal 2025 at $3.2bn, up 63% with Juniper's contribution inside it, against a reaffirmed $3.5bn exit target for fiscal 2026 — roughly 9% growth in a year the company guides revenue up 29% to 33%. The metric is also constructed rather than contracted: HPE defines it as a quarter's GreenLake, software-consumption and related financial-services revenue — including rental income from operating leases and interest from finance leases — multiplied by four. Folding hybrid cloud into Cloud & AI removed the line where GreenLake's own segment margin used to be visible.

What the advance has earned

On forward earnings HPE is the cheapest of its group at 15.2x, against Dell at 24.6x and NetApp at 20.7x, on consensus fiscal 2026 earnings of $3.44 a share. Trailing earnings are unusable — fiscal 2025 net income was $57m on $34.3bn of revenue after deal and restructuring charges. Charge the roughly $14bn of Juniper financing and the discount evaporates: 21.2x enterprise value to trailing EBITDA, against Dell's 22.2x and NetApp's 19.1x. The share count is 8.3% larger than a year ago.

So the advance is paid for, but not by the story the GreenLake brand implies. Repriced systems, Juniper scale, a 9% smaller workforce and a divestiture explain the earnings; the consumption meter explains almost none of it, and the equity multiple only looks generous while the debt is ignored. Consensus already assumes the fade, with fiscal 2027 revenue growth of 11.6% against 30.5% this year — close to the 8% to 12% framework HPE itself published.

Wednesday tests conversion rather than demand. HPE entered the quarter with $5.9bn of artificial-intelligence systems backlog, a record, and has said it assumed no incremental memory supply this year beyond existing allocations. Orders it cannot fill are somebody's revenue next year, and possibly somebody else's.

Veeva Priced Its New Aspen CRM at $50 a Seat and Aimed It Outside Life Sciences

Hypothesis Opus 5 · Research Opus 5 · Writing Opus 5 · Prompt v1.6

Veeva's fastest-growing business is clinical-trial software, its slowest is the pharmaceutical sales-representative software it spent two years rebuilding off Salesforce's platform, and the two products management talked up most on the August 26 call carry no disclosed price at all.

Commercial subscription revenue grew 13% in the July quarter against 16% for subscriptions overall, and full-year guidance implies roughly 11% commercial growth against about 18% for research, development and quality. Against that backdrop the company introduced Aspen, a general-purpose sales system for technology startups, and Falcon, an agentic platform sold as a substitute for medical, legal and regulatory review labor, with five early adopters and no revenue figure.

The quarter itself was strong. What the shares now carry is two unbilled options and a seat meter that is not growing.

VEEVIQVCRMNOWWDAYINTULife Sciences SoftwareClinical Trial SystemsCRM Platform CompetitionAgentic AI WorkflowsPharma Field Force Decline
TickerCompanySegmentTrend · 13mo30D1Y
The subject · what this brief is about
VEEVVeeva SystemsLife Sciences Software & Data🌱 Emerging Bull+38.7%+6.9%
Compared against · context, not the story
IQVIQVIAContract Research & Development⚠️ Emerging Bear+10.7%+40.6%
CRMSalesforceCustomer Experience & CRM🔴 Cont. Bear+40.2%+4.0%
NOWServiceNowSpecialized Enterprise Solutions🌱 Emerging Bull+29.2%−19.0%
WDAYWorkdayEnterprise Resource Planning🌱 Emerging Bull+20.2%−13.3%
INTUIntuitEnterprise Resource Planning🔴 Cont. Bear+12.5%−45.5%

12-month price & trend

VEEV
Veeva Systems
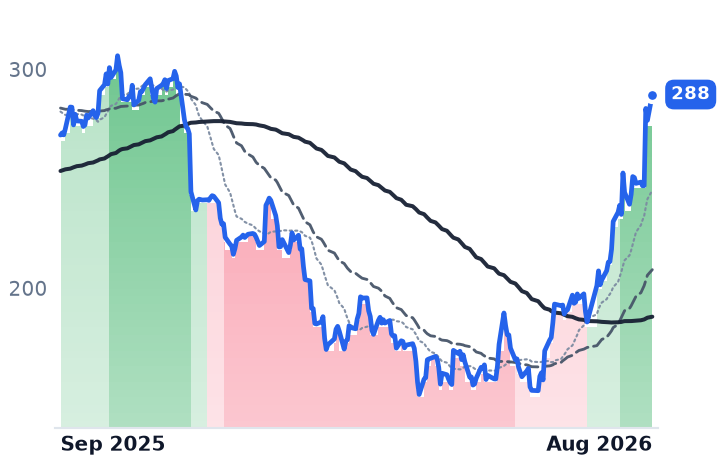
288
+11.80 (+4.26%)
vs. prior close
Price20d50d150d
VEEV 12-month price
Life Sciences Software & Data
IQV
IQVIA
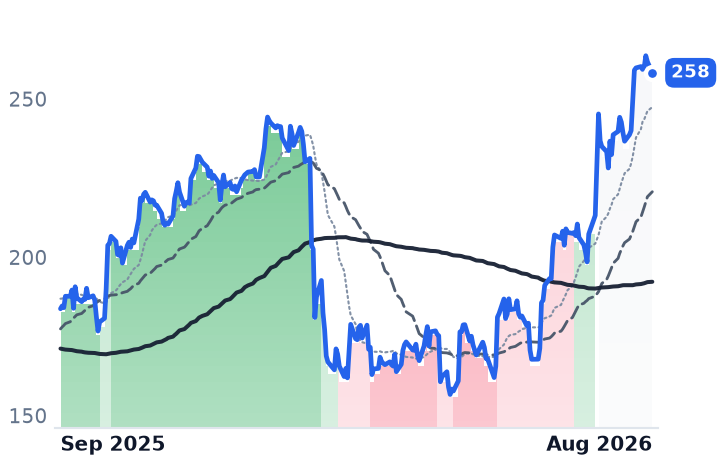
258
−3.48 (−1.33%)
vs. prior close
Price20d50d150d
IQV 12-month price
Contract Research & Development
CRM
Salesforce
261
+4.76 (+1.86%)
vs. prior close
Price20d50d150d
CRM 12-month price
Customer Experience & CRM
TickerMkt capP/EP/E fwdP/SP/S fwdP/GPP/GP fwdEV/EBITDAFCF yld
VEEV$46.4B46.0x31.0x13.4x12.6x17.9x16.8x32.6x3.5%
IQV$43.0B32.2x20.2x2.5x2.5x9.7x9.4x16.3x6.1%
CRM$209.7B23.3x15.8x4.8x4.5x6.2x5.9x15.4x7.2%
NOW
ServiceNow
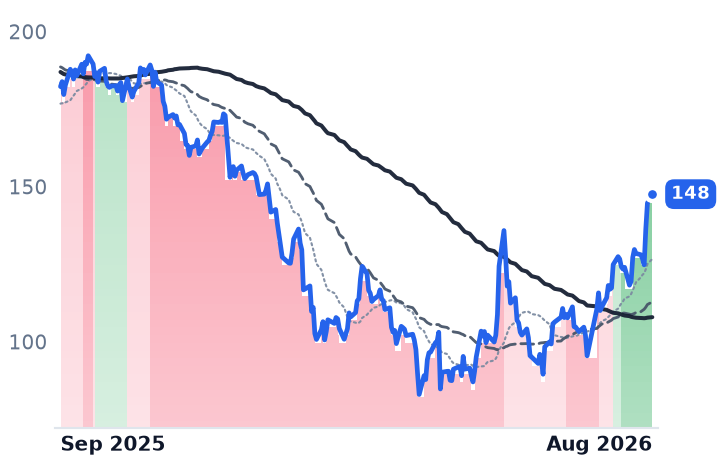
148
+2.88 (+1.99%)
vs. prior close
Price20d50d150d
NOW 12-month price
Specialized Enterprise Solutions
WDAY
Workday
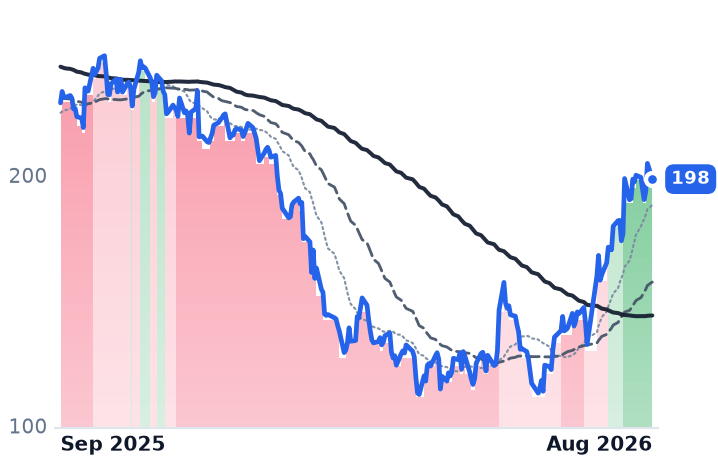
198
−6.29 (−3.07%)
vs. prior close
Price20d50d150d
WDAY 12-month price
Enterprise Resource Planning
INTU
Intuit
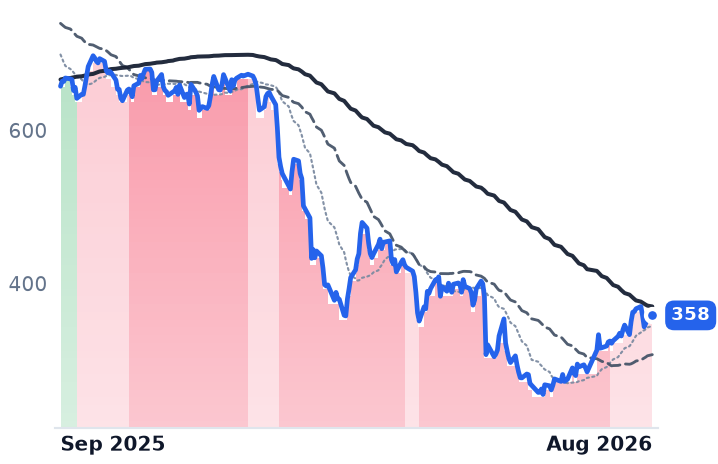
358
+0.26 (+0.07%)
vs. prior close
Price20d50d150d
INTU 12-month price
Enterprise Resource Planning
TickerMkt capP/EP/E fwdP/SP/S fwdP/GPP/GP fwdEV/EBITDAFCF yld
NOW$132.8B79.8x31.6x9.0x8.2x12.1x11.0x39.8x3.4%
WDAY$53.6B41.6x18.5x5.3x5.0x6.6x6.3x32.8x5.3%
INTU$97.9B21.7x14.8x4.6x4.2x5.6x5.1x14.8x8.8%

Consensus projections

TickerFY2026EFY2027EFY2028E
VEEVRevenue+16.3%+16.4%+12.1%
EPS+23.1%+16.1%+10.8%
IQVRevenue+7.6%+5.8%+5.9%
EPS+9.0%+11.2%+12.0%
CRMRevenue+9.3%+11.4%+9.6%
EPS+17.4%+37.6%−1.6%
NOWRevenue+22.4%+18.7%+18.6%
EPS+17.1%+23.2%+21.4%
WDAYRevenue+13.4%+11.8%+10.5%
EPS+26.5%+21.9%+19.5%
INTURevenue+13.9%+9.7%+9.4%
EPS+18.5%+1.9%+13.1%

Forward fiscal years only. Blank means no analyst coverage for that year.

Veeva Systems, which sells cloud software only to drugmakers — sales and marketing systems for pharmaceutical field forces on one side, clinical-trial, regulatory and quality document management on the other — has put a price on a product that has nothing to do with drugs. On its August 26 earnings call the company described Aspen, a general-purpose customer-relationship management system billed at $50 per user per month plus usage overages, aimed first at technology startups and pitched on three-month implementations against the three-year cycles legacy systems require. Management described it as an internal startup running on small investment.

The reason a $50 seat matters at a $46bn company is what it says about the meter Veeva already owns. Commercial revenue is billed against pharmaceutical sales representatives, and that population is shrinking. US drug-company reps numbered more than 100,000 in 2005, about 12% of the industry's workforce; today they are roughly half that, 5.1% of the workforce, with more than half of all interactions with doctors now digital. Growth on that side has to come from price, modules and data rather than bodies in the field.

The half that is working is the other half

It shows in the split. Commercial subscription revenue grew 13% year on year in the quarter ended July 31 against 16% for total subscription revenue of $766.8m, and full-year guidance divides roughly $1,405m of commercial against $1,675m of research, development and quality — about 11% and 18% growth. Of the $108m of subscription revenue added year on year, $68m came from the research and development side.

That half has a visible demand source. Early-stage biotechnology funding reached $35bn in the second quarter of 2026, more than double a year earlier, and emerging biopharma now accounts for about 70% of clinical trial starts globally against 45% a decade ago — more sponsors, more studies, and Vault subscriptions bill per study and per site. IQVIA, the clinical-research and health-data company selling into the same budgets, reported a $34.2bn backlog and net new bookings of $3.15bn, up 19.3%, for a book-to-bill of 1.22.

On the commercial side the language was defensive. "We see Veeva maintaining over 70% share in the CRM space, which means we'll continue to execute," strategy chief Paul Shawah told investors on August 26. Chief executive Peter Gassner was blunter about losses: "Yes, there's a handful of customers, large customers that did select Salesforce, many of them even 2 years ago. Those projects are — they're having troubles, right?" Salesforce says its Life Sciences Cloud now has more than 140 customer organizations, roughly double a year earlier, naming Novartis, AstraZeneca, Pfizer and Takeda.

Two products, no price

Falcon, the agentic platform Veeva is building for clinical, regulatory and safety work, has five early adopters and first go-lives expected this fiscal year, with gross margins management expects to be roughly similar to software. "We are the rate limiter right now," Gassner said on the call. "We have to get that product ready, start working with the early adopters, but interest in Falcon is very high." In June Veeva bought Copli and relaunched it as Veeva Falcon MLR, claiming it can eliminate 70% or more of the manual labor in medical, legal and regulatory content review within five years. No price, no annual recurring revenue figure, no customer count beyond the five.

The shares have moved as if the price existed. Veeva gapped 14.3% on August 27 — a day the whole software complex bid up behind Salesforce's own record quarter — and pushed to $288.49 by August 31 as brokers repriced, Raymond James to $330 from $225 and RBC to $325 from $275. Trailing sales multiple has gone from about 9.2x in early May to 13.4x. Forward earnings are 31x against IQVIA's 20x, for a business consensus expects to slow from 16.4% revenue growth this year to 12.1% next.

The quarter earns some of that. Revenue rose 17.6% to $928.0m, a fourth consecutive quarter of acceleration, and operating margin widened to 29.6% from 24.8%. What the re-rating does not yet have underneath it is a second meter. Veeva sells about one year at a time — its own filing calls multi-year noncancellable obligations "not significant" — so there is no contracted cushion to point at, against Salesforce's $33.5bn of current remaining performance obligations and IQVIA's backlog. Gassner also flagged a handover inside the research franchise, from mature products like electronic trial master file and quality systems to younger ones like data capture and safety, warning that "S curves don't stack up exactly" and that it bears on next year's guidance. The company is meanwhile losing president and chief customer officer Tom Schwenger, who resigned on August 18, effective October 2, to run a long-standing Veeva partner.
The symmetry is the point. Salesforce spent the year selling into the vertical Veeva built its company on, and Veeva has answered by selling a sales system to technology startups at a price it can quote in one line.
AvePoint Guided to 26% Growth; Currency Supplies Six of Those Points

Hypothesis Opus 5 · Research Opus 5 · Writing Opus 5 · Prompt v1.6

AvePoint's units and its currency are telling different stories. The managed-service-provider channel now supplies 59% of annual recurring revenue and drove two-thirds of the quarter's additions, and customers paying more than $100,000 a year rose 26% to 911 — the best growth in over three years.

But the raised full-year guide of 26% recurring-revenue growth becomes 20% once exchange rates are stripped out, and management framed the change as a small operational raise offset by a larger currency headwind. Meanwhile the platform AvePoint sells around has shipped a competitor: Microsoft Agent 365 became generally available on 1 May at $15 per user a month. AvePoint's own agent-governance product only got a standalone price list in July, with no revenue attached to it yet.

AVPTMSFTSPSCCCCEVCMPATHAI Agent GovernanceMicrosoft 365 EcosystemMSP Channel DistributionSaaS Recurring RevenueCurrency HeadwindsData Backup & Migration
TickerCompanySegmentTrend · 13mo30D1Y
The subject · what this brief is about
AVPTAvePointBusiness Software & Automation🌱 Emerging Bull+4.5%−14.0%
Compared against · context, not the story
MSFTMicrosoftCloud Infrastructure & Platforms🔴 Cont. Bear+4.7%+1.5%
SPSCSPS CommerceBusiness Software & Automation🔴 Cont. Bear+12.8%−20.1%
CCCCCC Intelligent SolutionsBusiness Software & Automation🌱 Emerging Bull+19.1%−23.4%
EVCMEverCommerceBusiness Software & Automation⚠️ Emerging Bear−25.7%−20.9%
PATHUiPathBusiness Software & Automation🔴 Cont. Bear+42.7%+70.9%

12-month price & trend

AVPT
AvePoint
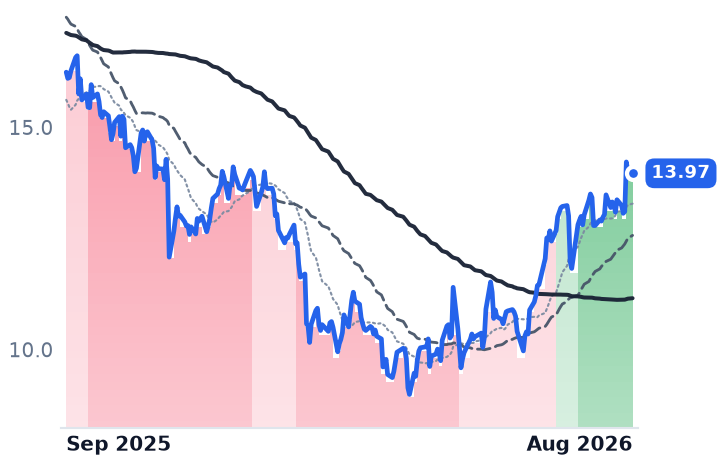
13.97
−0.03 (−0.25%)
vs. prior close
Price20d50d150d
AVPT 12-month price
Business Software & Automation
MSFT
Microsoft
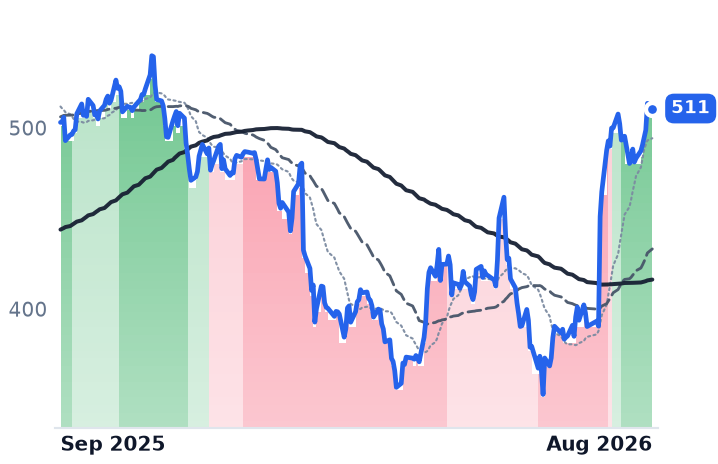
511
−2.85 (−0.55%)
vs. prior close
Price20d50d150d
MSFT 12-month price
Cloud Infrastructure & Platforms
SPSC
SPS Commerce
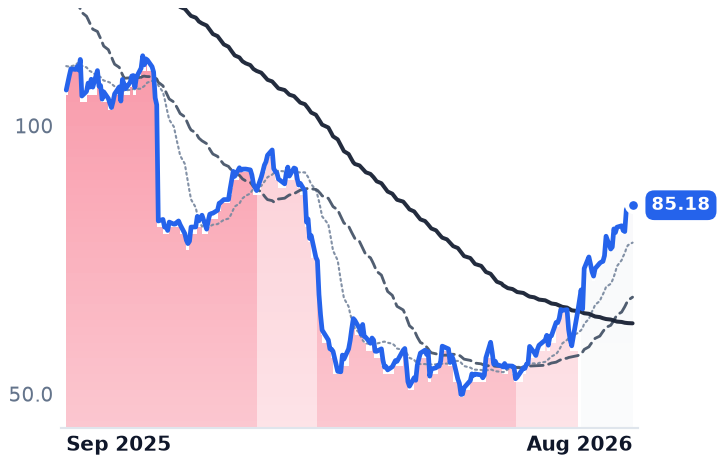
85.18
+0.26 (+0.31%)
vs. prior close
Price20d50d150d
SPSC 12-month price
Business Software & Automation
TickerMkt capP/EP/E fwdP/SP/S fwdP/GPP/GP fwdEV/EBITDAFCF yld
AVPT$3.0B41.8x31.1x6.4x5.8x8.7x7.9x35.7x3.4%
MSFT$3.8T28.6x26.1x11.5x9.8x17.0x14.4x19.0x1.7%
SPSC$2.9B39.0x16.5x3.8x3.7x5.4x5.3x15.0x6.8%
CCC
CCC Intelligent Solutions
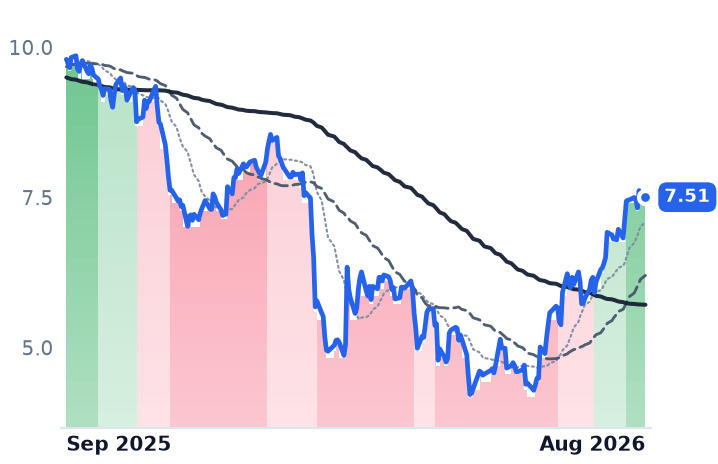
7.51
+0.02 (+0.20%)
vs. prior close
Price20d50d150d
CCC 12-month price
Business Software & Automation
EVCM
EverCommerce
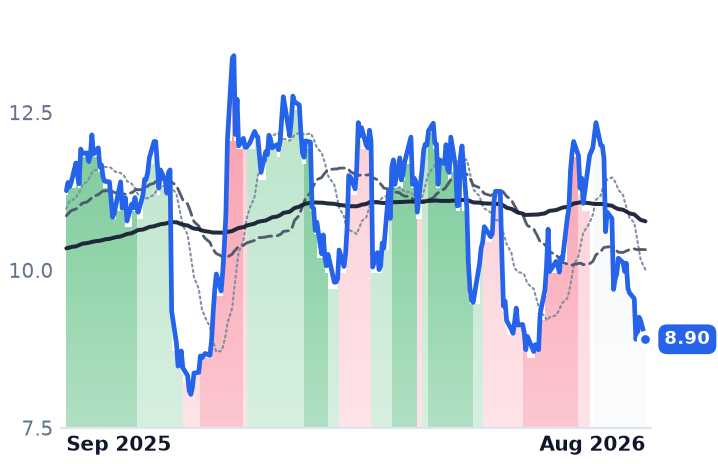
8.90
−0.30 (−3.21%)
vs. prior close
Price20d50d150d
EVCM 12-month price
Business Software & Automation
PATH
UiPath
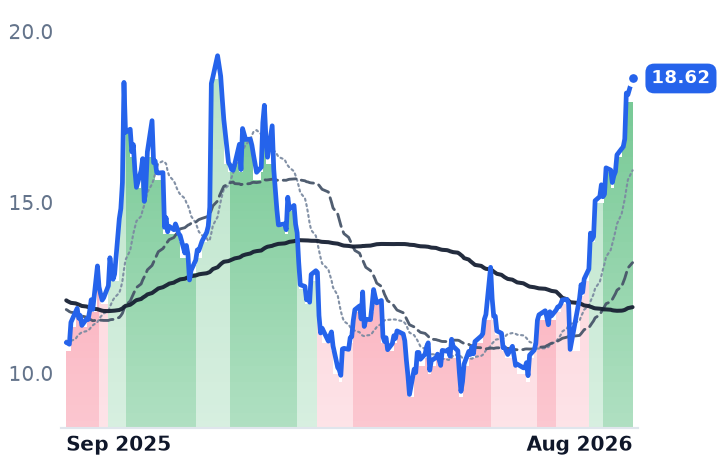
18.62
+0.47 (+2.61%)
vs. prior close
Price20d50d150d
PATH 12-month price
Business Software & Automation
TickerMkt capP/EP/E fwdP/SP/S fwdP/GPP/GP fwdEV/EBITDAFCF yld
CCC$4.1B105.6x15.5x3.7x3.5x5.0x4.8x16.9x7.5%
EVCM$1.8B53.7x13.6x2.9x2.9x3.9x3.8x16.1x5.3%
PATH$9.7B30.1x23.2x5.8x5.4x7.0x6.5x56.8x3.9%

Consensus projections

TickerFY2026EFY2027EFY2028E
AVPTRevenue+22.9%+20.5%+19.7%
EPS+33.4%+10.4%+28.6%
MSFTRevenue+18.0%+18.6%+19.5%
EPS+26.7%+16.0%+19.0%
SPSCRevenue+5.1%+6.3%+7.2%
EPS+18.8%+8.6%+13.3%
CCCRevenue+10.1%+8.9%+8.2%
EPS+25.4%+16.1%+13.7%
EVCMRevenue+4.6%+4.6%+4.5%
EPS+677.9%+5.4%+4.9%
PATHRevenue+11.4%+11.5%+8.4%
EPS+40.5%+16.2%+15.2%

Forward fiscal years only. Blank means no analyst coverage for that year.

AvePoint's June-quarter numbers have been public since 6 August. What has not been read out of them is how much of the raised full-year outlook is exchange rates. The company — which sells governance, backup, migration and now artificial-intelligence readiness for data that lives inside other vendors' clouds, mostly Microsoft 365 — lifted its full-year recurring-revenue guide to a range of $522.1m to $528.1m, 26% growth at the midpoint. Adjusted for currency, that guide is 20%.

The six-point gap matters because the rest of the quarter argues that AvePoint's unit growth is genuine, and because the platform it depends on has just entered its newest product line. On 1 May, Microsoft made Agent 365 generally available, a control plane for observing and governing artificial-intelligence agents, priced at $15 per user a month standalone and included free in a $99-per-user Microsoft 365 tier. AvePoint's competing product, AgentPulse, only became a separately priced per-seat item in July.

The units are real

Strip the currency out and the customer file still improves. Net new recurring revenue of $29.9m was a record, up 35% year on year and the thirteenth straight quarter of double-digit growth in that measure. Customers above $100,000 of annual recurring revenue reached 911, up 26%, with the $250,000, $500,000 and $1m cohorts each growing at 30% or better. The managed-service-provider channel — roughly 2,000 partners reselling into the midmarket — now carries 59% of total recurring revenue against 56% a year earlier, and supplied 67% of the quarter's additions.

Against that, reported revenue growth is slowing: 28.6% in the December quarter, 26.0% in March, 22.0% in June to $124.5m. Gross margin slipped 94 basis points to 73.1%, which management attributed to channel and services mix rather than the cost of delivering artificial intelligence — software product margins held at 83%. Gross retention is a modest 89%, with net retention at 110%; migration work, which customers finish and stop paying for, costs about two points of that.

What the raise actually was

Management described the guidance change as roughly $1m of operational improvement set against $2m of incremental currency headwind on recurring revenue, and a $3.7m revenue beat against $5.6m of incremental currency headwind on the revenue line. Europe, the Middle East and Africa grew 34% reported and 27% in constant currency — the widest gap of any region. "Our excellent second quarter results reflect the growing demand for trusted AI, as we accelerated topline growth, outperformed all guided metrics, and delivered record net new ARR," chief executive Tianyi Jiang said in the 6 August release. Investors disagreed: the shares fell 4.7% the next session.

On the call Jiang argued AvePoint works hand-in-hand with Agent 365 but goes deeper — delegated administration, cross-cloud coverage, tracking what agents cost — and that many customers hold mixed licences rather than the $99 bundle. The cross-cloud claim is the load-bearing one, and it is the part Microsoft has not finished: Agent 365's discovery of agents running on Amazon Bedrock and Google Cloud is still in public preview. AvePoint publishes no split of revenue by underlying platform, so how much of the base sits on Microsoft tenants cannot be checked from its filings.

The price and the multiple

Shares rose 4.5% over the past thirty days while CCC Intelligent Solutions gained 19% and SPS Commerce nearly 13% — AvePoint under-participated in the broad rebound in long-duration software since late July, and is down 14% over twelve months. The stock trades at 8.65x trailing gross profit and 7.90x forward, against 12.3x a year ago — a de-rating of roughly a third while gross profit grew 20.5%. Reported earnings are no help here: June-quarter net margin of 22.1% is nearly three times the 8.2% operating margin, on items below the operating line.

The verdict splits. The seat count, the logo count and the partner channel earn the growth, and the three-month advance is mostly the rate-driven software rebound rather than anything AvePoint disclosed. What the business has not yet earned is the headline number: six of the guided twenty-six points are currency, which reverses if the dollar does, and the fastest-growing part of the pipeline now shares a category with a product the platform owner bundles for free at the top tier.

AgentPulse got its own price list in July. The first quarter that shows whether anyone pays it separately has not been reported.

Klaviyo Slowed to 26.4% Growth for a Fourth Quarter as Text Messaging Cut Its Margin

Hypothesis Opus 5 · Research Opus 5 · Writing Opus 5 · Prompt v1.6

Two vendors bill for the same thing — consumer profiles stored and messages sent — and their businesses have moved in opposite directions while their valuations moved the other way. Klaviyo's customer count passed 205,000 in the June quarter, but revenue growth decelerated for a fourth straight quarter, to 26.4%, and gross margin fell to 72.6% from 75.7%. Braze accelerated for a fourth straight quarter, to 30.2%, with dollar-based net retention at 110% and contracted backlog of $1.1bn growing in line with revenue rather than ahead of it.

Neither is a price-migration story on a flat base: both split roughly sixteen points of new logos against nine to twelve points of account expansion. Both surrender about five points of gross-profit growth to messaging they resell. The company whose numbers are improving now carries the dearer valuation; the one decelerating carries the cheaper.

KVYOBRZEHUBSSPTCRMMarketing Automation SoftwareUsage-Based PricingSMS Messaging CostsCustomer Data PlatformsAI Agent MonetizationNet Revenue Retention
TickerCompanySegmentTrend · 13mo30D1Y
The subject · what this brief is about
KVYOKlaviyoMarketing Automation🔴 Cont. Bear+12.9%−34.5%
BRZEBrazeCustomer Experience & CRM🌱 Emerging Bull+38.6%+27.7%
Compared against · context, not the story
HUBSHubSpotCustomer Experience & CRM🔴 Cont. Bear+9.8%−44.7%
SPTSprout SocialSoftware - Application🌱 Emerging Bull+33.9%−24.7%
CRMSalesforceCustomer Experience & CRM🔴 Cont. Bear+39.1%+2.1%

12-month price & trend

KVYO
Klaviyo
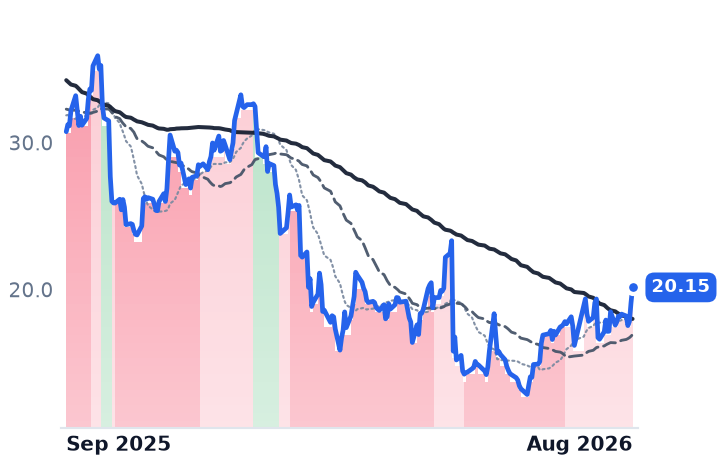
20.15
+1.07 (+5.58%)
vs. prior close
Price20d50d150d
KVYO 12-month price
Marketing Automation
BRZE
Braze
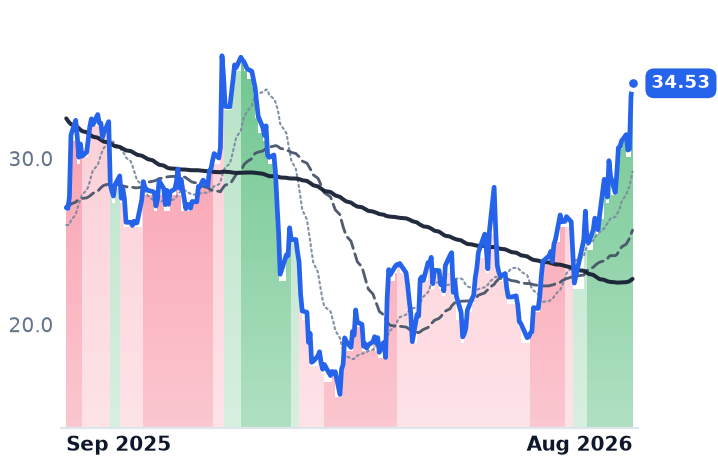
34.53
+0.80 (+2.37%)
vs. prior close
Price20d50d150d
BRZE 12-month price
Customer Experience & CRM
HUBS
HubSpot
261
+6.34 (+2.49%)
vs. prior close
Price20d50d150d
HUBS 12-month price
Customer Experience & CRM
TickerMkt capP/EP/E fwdP/SP/S fwdP/GPP/GP fwdEV/EBITDAFCF yld
KVYO$6.0B937.2x24.4x4.3x3.9x5.9x5.3x197.1x4.1%
BRZE$3.9Bn/m54.5x4.9x4.3x7.4x6.5xn/m1.7%
HUBS$13.4B92.2x19.6x3.9x3.6x4.7x4.4x44.5x5.7%
SPT
Sprout Social
11.49
+0.43 (+3.93%)
vs. prior close
Price20d50d150d
SPT 12-month price
Software - Application
CRM
Salesforce
256
+3.95 (+1.57%)
vs. prior close
Price20d50d150d
CRM 12-month price
Customer Experience & CRM
TickerMkt capP/EP/E fwdP/SP/S fwdP/GPP/GP fwdEV/EBITDAFCF yld
SPT$690.6Mn/m10.2x1.4x1.4x1.9x1.8xn/m7.5%
CRM$209.7B23.3x15.8x4.8x4.5x6.2x5.9x15.4x7.2%

Consensus projections

TickerFY2026EFY2027EFY2028E
KVYORevenue+25.7%+19.6%+18.9%
EPS+27.3%+28.3%+25.3%
BRZERevenue+24.3%+22.8%+16.6%
EPS+281.2%+50.3%+52.1%
HUBSRevenue+18.2%+14.2%+14.0%
EPS+38.2%+25.9%+18.4%
SPTRevenue+8.6%+5.8%+9.7%
EPS+43.9%+39.2%+20.6%
CRMRevenue+9.3%+11.4%+9.6%
EPS+17.4%+37.6%−1.6%

Forward fiscal years only. Blank means no analyst coverage for that year.

Klaviyo, the Boston platform that stores consumer profiles for e-commerce brands and sends their email, text and push campaigns, finished the June quarter with more than 205,000 customers, against more than 176,000 a year earlier. That is roughly 16.5% more brands paying, and revenue rose 26.4% to $370.6m — so about two-thirds of the growth is new logos and one-third is existing accounts spending more, with annualized revenue per customer up about 8.5% to roughly $7,230.

That decomposition matters because this rung of software is not billed by the seat. The meter is the customer's own audience: profiles stored, messages sent. It grows when a brand grows, which is the attraction, and it drags a cost of goods along with every message, which is the defect. Klaviyo's growth has now decelerated four quarters running — 32.2%, 29.6%, 27.9%, 26.4% — and the company guided the September quarter to $377–381m, or 21.5–22.5%.

The margin is the meter's price

Gross profit grew 21.3% against that 26.4% of revenue, and reported gross margin fell to 72.6% from 75.7% a year earlier. Klaviyo told investors margin steps down again in the September quarter and falls by more than the normal seasonal amount in December, because text grows faster than the company overall; a pricing change shifting carrier fees onto customers is expected to be neutral to this year's revenue and margin. "Text has strong unit economics, driven by its lower cost of acquisition and higher rates of expansion," chief financial officer Amanda Whalen said on the August 5 call — she is being succeeded by Erica Smith from September 1. The quarter also swung to a $15.0m operating loss from a small profit in March, as spending on the new agent products rose.

Upmarket, the business is working: customers above $50,000 of annual recurring revenue rose 36% to 4,477 and supply about 40% of recurring revenue, and net retention held at 109% while lapping a prior-year billing enforcement that costs three points into early next year. "We signed our largest deal ever last quarter, an 8-figure multiproduct contract with one of the fastest-growing brands in e-commerce," co-chief executive Andrew Bialecki said on the same call.

Braze runs the same meter faster

Braze, the New York engagement platform whose software kits ingest app behavior and orchestrate cross-channel campaigns, grew April-quarter revenue 30.2% to $211.0m — its fourth straight quarter of acceleration, and 27% excluding its acquisition of OfferFit. Its split is similar to Klaviyo's: 2,713 customers against 2,342, up 15.8%, with revenue per account up 12.4%. Accounts above $500,000 rose 33% to 349, net retention improved to 110%, and remaining performance obligations of $1.1bn grew 30% — in line with revenue, not ahead of it, which is the test for whether growth is being pulled forward into unburned backlog. It is not.

Braze pays the same toll: gross profit grew 24.7% against 30.2% of revenue, and margin fell to 65.7% from 68.6%. On charging for artificial intelligence the two diverge. Braze disclosed $5.7m of Decisioning Studio revenue in the quarter, about 2.7% of the total, and gates its agents behind mandatory message and action credits. Klaviyo prices Composer and its Customer Agent as separate credit-metered products with free allotments, and has published no dollar figure; Composer reached 95,000 users in its first month, and Bialecki said the share of generated campaigns users actually ran improved "to 46%, up from 35% just a few weeks ago."

What the shares have priced

Klaviyo closed August 28 at $20.15, up 36.7% in three months but 38% below a year ago, having fallen 13.6% the session after the June-quarter print. Braze closed at $34.53, up 47.8% in three months and up 28.7% since late July, the only one of the pair higher over twelve months. About thirteen points of each name's month came in two sessions after Salesforce rose 22% on August 27 — the whole of Klaviyo's thirty-day advance and roughly half of Braze's.

Because gross margins across these vendors differ by seventeen points and both companies are barely profitable under standard accounting, price against gross profit is the comparable measure. Braze trades at 7.43x trailing and 6.51x forward gross profit, against 5.41x on July 29 — a re-rating of roughly 37% in a month on no new disclosure since May 27, and 54.5x forward earnings. Klaviyo trades at 5.88x trailing and 5.34x forward, below its 6.59x reading on May 3 at nearly the same market value, and 24.4x forward earnings. HubSpot, the seat-and-bundle comparator that grew 19.8% at an 82.4% gross margin and cut its net customer-add target to 5,000–6,000 a quarter, sits at 4.65x.

The market has priced trajectory rather than level. Braze earns the improving half of that: the acceleration is organic, its largest accounts are compounding, and backlog is not flattering the top line. What it does not earn is the multiple's timing — the re-rating happened between disclosures. Klaviyo's business explains its logo growth and its enterprise displacements; it does not explain why a company guiding to low-twenties growth, with a margin it has told investors will keep falling, should be treated as the safer of the two.

Braze reports fiscal second-quarter results after the close on September 8 — its first numbers since the shares were repriced on the strength of an April quarter. A fifth acceleration makes the summer look prescient; anything less makes it a bet placed on a three-month-old press release.

monday.com's $100k Accounts Grew 37%; Asana's Existing Customers Spent 4% Less

Hypothesis Opus 5 · Research Opus 5 · Writing Opus 5 · Prompt v1.6

Two vendors bill for the same thing — a human being with a login — and only one has found a way to charge for something else. monday.com's paid accounts above $100,000 of annual recurring revenue rose 37% to 2,019, and it now sells artificial-intelligence credits on top of seats. Asana's dollar-based net retention was 96%, and 96% again among customers paying more than $100,000 a year, meaning existing accounts spend less than they did a year ago; its flagship AI product is priced at $15 per user per month, back on the seat meter.

The businesses have diverged and the prices have converged. Asana has grown revenue about 9% for four straight quarters and guides to 8.2–9.2% this year; monday.com grew 21.9% last quarter. Yet Asana costs 27.3x forward earnings against monday.com's 18.4x. Nothing Asana has disclosed since May explains that. It reports Thursday.

MNDYASANTEAMWDAYCRMNOWAPPNADPWork Management SoftwareSeat-Based SaaS PricingAI Credit MonetizationNet Dollar RetentionEnterprise Seat GrowthSoftware Margin Discipline
TickerCompanySegmentTrend · 13mo30D1Y
The subject · what this brief is about
MNDYmonday.comOther🌱 Emerging Bull+15.6%−46.2%
ASANAsanaOther🌱 Emerging Bull+22.5%−26.8%
Compared against · context, not the story
TEAMAtlassianDeveloper Tools & DevOps🌱 Emerging Bull+88.5%+10.3%
WDAYWorkdayEnterprise Resource Planning🌱 Emerging Bull+27.7%−10.6%
CRMSalesforceCustomer Experience & CRM🔴 Cont. Bear+39.1%+2.1%
NOWServiceNowSpecialized Enterprise Solutions🌱 Emerging Bull+30.1%−20.6%
APPNAppianLow-Code & Process Automation🌱 Emerging Bull+57.7%+38.6%
ADPAutomatic Data ProcessingHCM Software & Payroll🌱 Emerging Bull+7.9%−2.2%

12-month price & trend

MNDY
monday.com
101
+4.01 (+4.15%)
vs. prior close
Price20d50d150d
MNDY 12-month price
Other
ASAN
Asana
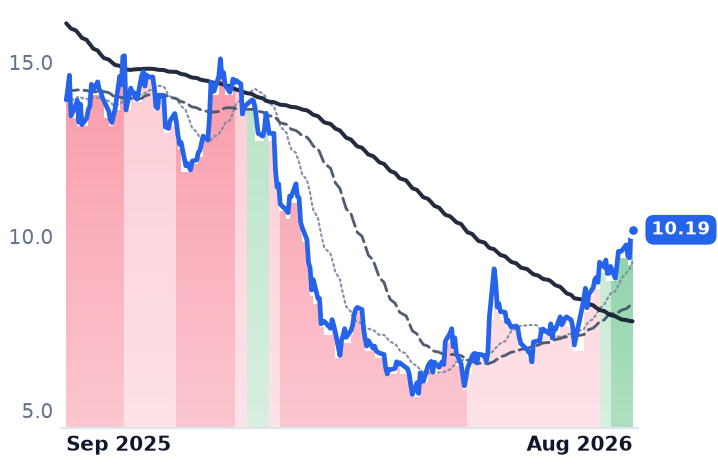
10.19
+0.01 (+0.15%)
vs. prior close
Price20d50d150d
ASAN 12-month price
Other
TEAM
Atlassian
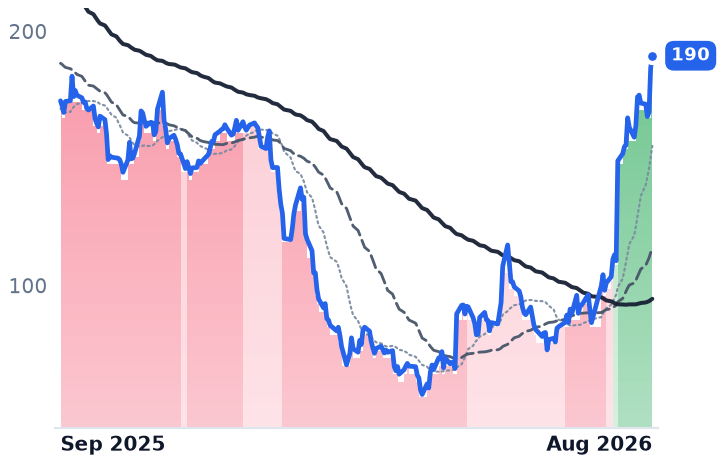
190
+4.79 (+2.58%)
vs. prior close
Price20d50d150d
TEAM 12-month price
Developer Tools & DevOps
TickerMkt capP/EP/E fwdP/SP/S fwdP/GPP/GP fwdEV/EBITDAFCF yld
MNDY$4.3B42.2x18.4x3.1x2.9x3.5x3.3x38.6x7.0%
ASAN$2.4Bn/m27.3x3.0x2.8x3.4x3.2xn/m4.7%
TEAM$50.0Bn/m34.6x7.6x6.7x9.0x7.9x331.1x2.6%
WDAY
Workday
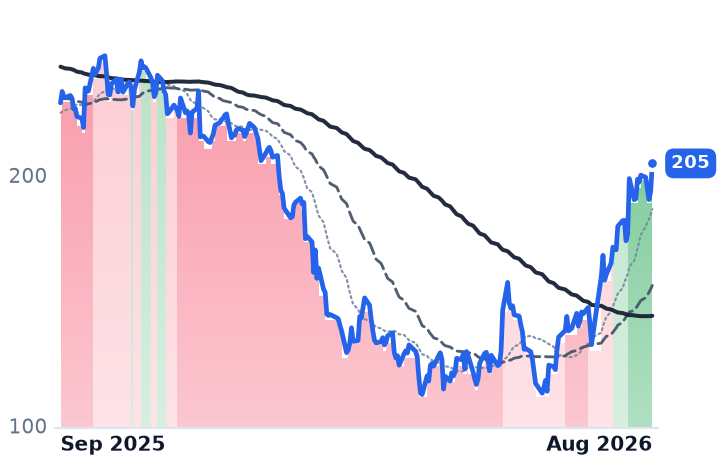
205
+11.15 (+5.76%)
vs. prior close
Price20d50d150d
WDAY 12-month price
Enterprise Resource Planning
CRM
Salesforce
256
+3.95 (+1.57%)
vs. prior close
Price20d50d150d
CRM 12-month price
Customer Experience & CRM
NOW
ServiceNow
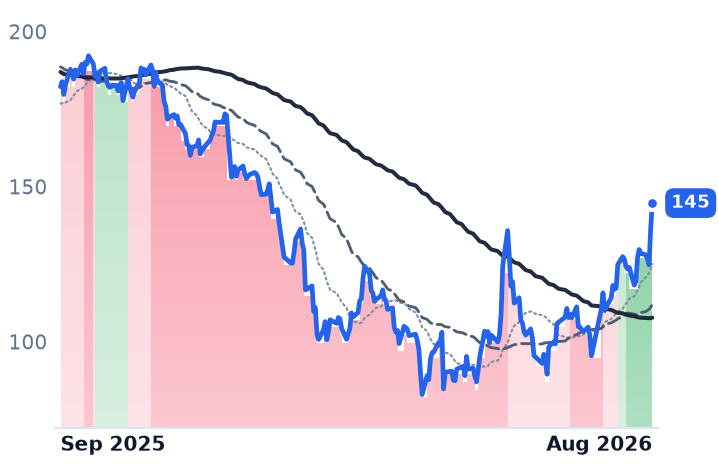
145
+8.40 (+6.16%)
vs. prior close
Price20d50d150d
NOW 12-month price
Specialized Enterprise Solutions
TickerMkt capP/EP/E fwdP/SP/S fwdP/GPP/GP fwdEV/EBITDAFCF yld
WDAY$53.6B41.6x18.5x5.3x5.0x6.6x6.3x32.8x5.3%
CRM$209.7B23.3x15.8x4.8x4.5x6.2x5.9x15.4x7.2%
NOW$132.8B79.8x31.6x9.0x8.2x12.1x11.0x39.8x3.4%
APPN
Appian
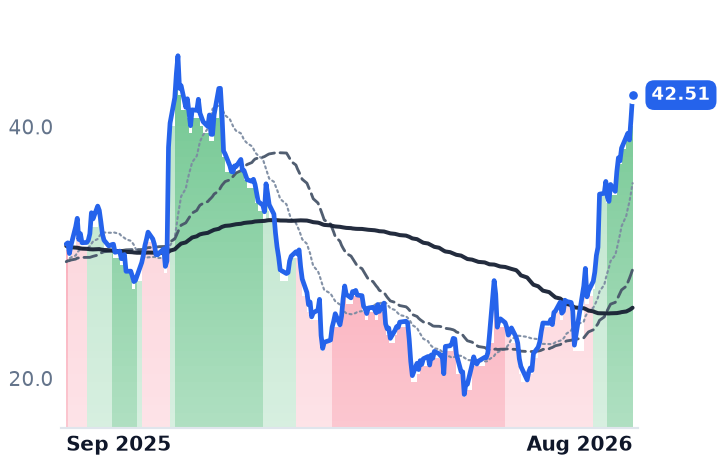
42.51
+1.93 (+4.76%)
vs. prior close
Price20d50d150d
APPN 12-month price
Low-Code & Process Automation
ADP
Automatic Data Processing
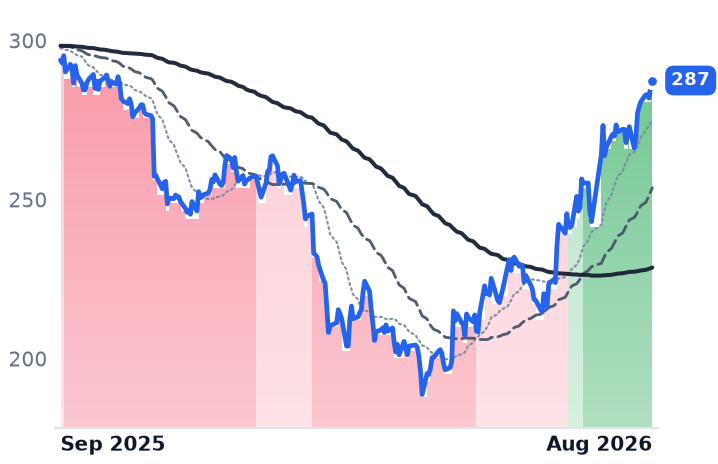
287
+1.75 (+0.61%)
vs. prior close
Price20d50d150d
ADP 12-month price
HCM Software & Payroll
TickerMkt capP/EP/E fwdP/SP/S fwdP/GPP/GP fwdEV/EBITDAFCF yld
APPN$3.1Bn/m39.3x4.0x3.7x5.4x5.1x135.0x2.4%
ADP$113.8B26.0x23.2x5.2x4.9x10.8x10.2x18.1x4.4%

Consensus projections

TickerFY2026EFY2027EFY2028E
MNDYRevenue+19.8%+15.1%+14.6%
EPS+27.8%+22.3%+19.1%
ASANRevenue+9.2%+8.9%+7.9%
EPS−272.8%+45.4%+26.1%
TEAMRevenue+24.7%+15.4%+14.7%
EPS+55.5%−0.1%+21.6%
WDAYRevenue+13.4%+11.8%+10.5%
EPS+26.5%+21.9%+19.5%
CRMRevenue+9.3%+11.4%+9.6%
EPS+17.4%+37.6%−1.6%
NOWRevenue+22.4%+18.7%+18.6%
EPS+17.1%+23.2%+21.4%
APPNRevenue+19.1%+10.8%+7.4%
EPS+104.0%+31.1%+11.4%
ADPRevenue+7.0%+5.9%+5.7%
EPS+11.0%+10.7%+9.2%

Forward fiscal years only. Blank means no analyst coverage for that year.

Asana's most recent operating figures are three months old, and they describe a business whose existing customers are spending less than they did a year earlier. Dollar-based net retention was 96% in the quarter ended April at the San Francisco company, whose platform coordinates projects, campaigns and company goals — and 96% again among customers paying more than $100,000 a year, the accounts that are meant to be expanding. Asana reports again after the close on Thursday, September 3.

That matters because of what both Asana and monday.com — the Tel Aviv vendor whose Work OS lets customers assemble their own work-management apps out of configurable modules — actually meter: the number of employees with a login. The population of logins is barely growing. ADP's count of employees on its clients' US payrolls rose 1% in fiscal 2026 and is guided to between zero and 1% this year. Growth for a per-seat vendor therefore has to come from a price increase, a tier upgrade, or something billed that is not a seat. The two have taken opposite routes, and the market has begun pricing them as though they had not.

monday.com sold something that isn't a seat

monday.com's June-quarter revenue of $364.6m grew 21.9%, the fourth consecutive quarter of deceleration from 26.2% a year ago, and net dollar retention fell to 109% with full-year guidance of about 108% — a record low, which the company attributes to lapping the list-price increases it took in 2024 and 2025. Underneath that, the large-account counts are unambiguous: customers above $50,000 of annual recurring revenue reached 4,834, up 31%, those above $500,000 rose 68% to 114, and the quarter added a record 175 net accounts above $100,000. Retention among those larger accounts runs 113% to 115%, well above the company-wide figure. "We are still seeing a double-digit seat growth year-over-year in enterprise," chief financial officer Eliran Glazer told analysts on the August 10 call.

In May the company launched seat-plus-credit pricing, the first expansion vector it has that is not a headcount. Revenue from AI products doubled quarter on quarter to 17% of net new annual recurring revenue, though still only about 1% of the total. Customers "are actively choosing AI features and are willing to pay more when they see value," co-chief executive Eran Zinman said on the same call, citing accounts that exhaust their credit packs and buy more. The build is expensive — research and development ran at 23% of revenue against 20% a year earlier — and on July 22 the company cut roughly 20% of its workforce, about 620 people, taking $45–55m of charges while reaffirming 19–20% growth.

Asana put its AI back on the seat

Asana's April quarter grew 9.5% to $205.1m, the fourth straight quarter near 9%, and the full year is guided to 8.2–9.2% including about half a point from the acquired StackAI. Core customers spending $5,000 or more grew 7% to 26,103; those above $100,000 grew 12% to 817. AI annual recurring revenue exiting fiscal 2026 was over $6m against $790.8m of revenue, and the flagship AI Teammates product is priced at $15 per user per month — the upsell reattached to the meter that isn't growing.

The profit improvement is real and it is cost-led: non-GAAP operating income of $23.6m, or 11.5% of revenue, against $8.1m and 4% a year earlier, on unchanged revenue growth. Gross margin fell to 87.6% from 89.7%, so gross profit grew 6.9% while revenue grew 9.5%. Chief executive Dan Rogers gave the fair counterpoint on the May 28 call: exposure to the technology vertical is now under a quarter of revenue and returned to year-over-year growth for the first time in eight quarters. And in-quarter net retention has improved for four consecutive quarters, to 97%.

What the shares did

Asana has risen 53% in three months and monday.com 30%, both laggards inside a software advance that carried Atlassian up 104%, Workday 57% and Salesforce 45% over the same window. The sharpest single sessions belong to no company disclosure: both jumped hard in late July, and on August 27 Nvidia's results reignited the AI trade across software. monday.com fell 5.6% on its own earnings day.

On valuation the two have nearly met. monday.com trades at 18.4x forward earnings against 42.2x trailing, and roughly 15x 2027 consensus — against about 13x when Abby Cohen picked it in Barron's July roundtable, after a 74% fall from the 2025 peak. Asana, with no meaningful trailing earnings multiple because it loses money under generally accepted accounting principles, trades at 27.3x forward. Because their gross margins are within a point of each other, the comparison is direct at the gross-profit line: 3.38x for Asana against 3.51x for monday.com, near parity for a business growing at less than half the rate.

monday.com's advance is largely earned — the rising large-account counts, the record enterprise adds and a metered AI line are what a per-seat vendor looks like when it escapes the seat, even as decelerating revenue says the price-increase engine has run its course. Asana's advance rests on cost discipline, a buyback that did not shrink the float — diluted shares rose to 238.2m — and three-month-old metrics showing existing customers renewing smaller at every disclosed size.

Thursday afternoon supplies the first new evidence since May, and one number settles most of it: whether 96% has finally turned.

Rene Lacerte's Sales Reorganization Left BILL Adding 1,800 Businesses in the June Quarter

Hypothesis Opus 5 · Research Opus 5 · Writing Opus 5 · Prompt v1.6

BILL's payments meter is working and its customer funnel is not. In the June quarter the company moved $98bn of supplier payments across 37m transactions and kept a wider cut of them — roughly 33.1 basis points of transaction fees against about 32.3 a year earlier — while its count of businesses served fell from 498,500 in December to 479,300 in June.

The profit that re-rated the shares is a cost program. Fiscal-2026 non-GAAP operating income rose just 5% to $323.7m, and the fiscal-2027 guide of $421–451m rests on $90.9m of restructuring charges that bought about $110m of gross savings. Float income — interest on customer money in transit, the leg most often feared — is a 9% slice of revenue and set to shrink about 7% next year on its own.

The flagship accounts-payable franchise grew 10%, with subscription revenue per customer up 1.4%.

BILLCPAYSMB Payments SoftwareAccounts Payable AutomationPayment Take RatesFloat Income & RatesRestructuring-Led Margins
TickerCompanySegmentTrend · 13mo30D1Y
The subject · what this brief is about
BILLBill.comFintech & Digital Finance🌱 Emerging Bull+11.5%+7.7%
Compared against · context, not the story
CPAYCorpayPayment Processing & Fintech🌱 Emerging Bull+6.7%+28.3%

12-month price & trend

BILL
Bill.com
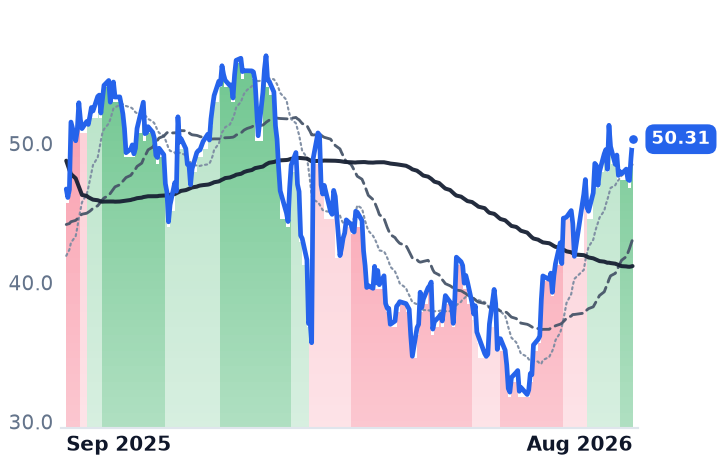
50.31
+1.36 (+2.78%)
vs. prior close
Price20d50d150d
BILL 12-month price
Fintech & Digital Finance
CPAY
Corpay
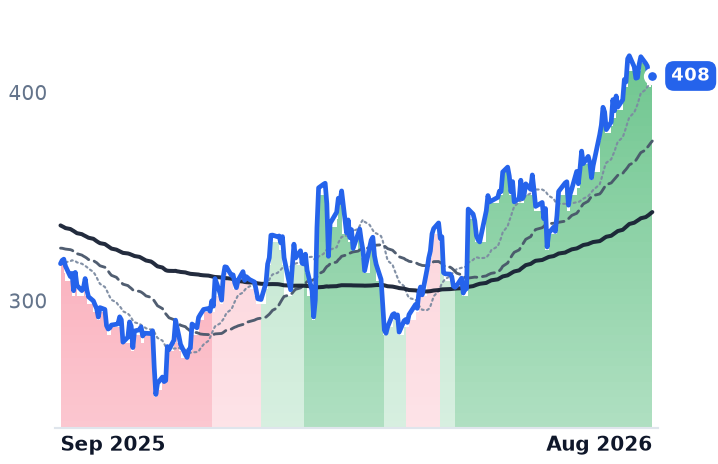
408
−0.19 (−0.05%)
vs. prior close
Price20d50d150d
CPAY 12-month price
Payment Processing & Fintech
TickerMkt capP/EP/E fwdP/SP/S fwdP/GPP/GP fwdEV/EBITDAFCF yld
BILL$5.0Bn/m13.4x3.0x2.7x3.8x3.5x58.7x9.6%
CPAY$26.7B24.5x14.9x5.3x5.0x7.2x6.8x14.0x6.1%

Consensus projections

TickerFY2026EFY2027EFY2028E
BILLRevenue+13.2%+11.3%+10.5%
EPS+26.1%+41.5%+17.6%
CPAYRevenue+17.7%+8.7%+9.2%
EPS+28.5%+14.2%+17.0%

Forward fiscal years only. Blank means no analyst coverage for that year.

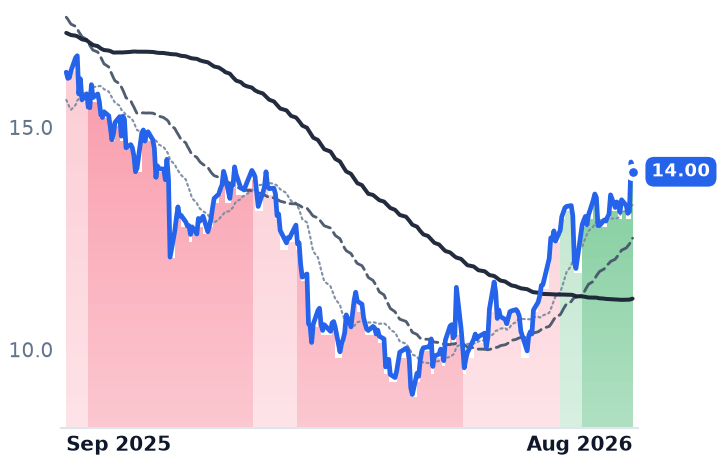
BILL Holdings, which sells cloud accounts-payable and expense software to small businesses and settles the resulting supplier payments itself, closed its fiscal year having added roughly 1,800 net business customers in the June quarter — below its recent run rate, after a reorganization of the sales force. Its separately disclosed count of businesses using its solutions went the other way, falling to 479,300 at June 30 from 498,500 at the end of December. The two figures cover different populations and the company has not publicly reconciled them; both point the same direction.

What grew instead was the amount each surviving customer runs through the network — and what grew earnings was a layoff. For fiscal 2027 management guided non-GAAP operating income of $421–451m against $323.7m, an increase of roughly a third, on top of $90.9m of restructuring charges booked in fiscal 2026 that delivered about $110m of gross savings against roughly $30m of reinvestment. Strip that out and the operating leverage is thinner than the headline: full-year non-GAAP operating income rose 5%, even as the June quarter's jumped 80% to $101.6m.

The volume is monetized better, by fewer customers

BILL earns three unrelated things: a small software subscription, a cut of the dollars it routes, and interest on money in transit. The middle line is doing the work. Transaction fees of $324.3m on $98bn of volume put the June quarter at about 33.1 basis points of payment volume, against roughly 32.3 a year earlier; volume is disclosed only to the nearest billion, so each reading carries about half a basis point of rounding. Throughput per business rose from about $178.7k in the September quarter to $204.5k in June, a 14% increase — arithmetic helped along by a shrinking denominator. Joint customers using both the payables and expense products grew 35%.

The original bill-pay franchise is the laggard. Accounts payable and receivable served 183,300 customers and grew core revenue 10%, with subscription revenue per customer up 1.4%. Management told the August 19 call it expects that unit's take rate to hold near the June-quarter level because automated clearing house payments — the cheapest rail on the platform — keep growing fastest, and guided the spend-and-expense take rate to about 260 basis points. Mix, not competition, is what caps further expansion.

Float is a drag, and the buyback is not the story

The four disclosed fiscal-2026 quarters sum to $148.3m of float revenue, 9.0% of the year's $1,653.2m. The fiscal-2027 wedge between the $1.807–1.857bn total guide and the $1.669–1.719bn core guide implies roughly $138m — another decline of about 7%. Rates are not driving it: the Federal Reserve held at 3.50–3.75% on July 29 with three members dissenting in favor of a hike. Against $4.353bn of customer funds, each quarter-point move is worth roughly $11m a year.

Nor are buybacks flattering the per-share line. BILL repurchased $300m of stock in the June quarter, but non-GAAP net income rose 25.0% and per-share earnings 25.3% — convertible notes hold the non-GAAP diluted count near 113.6m. On generally accepted accounting principles the year produced a first operating profit of $17.4m and still a net loss of $11.2m, after $306.3m of add-backs. Gross margin slipped to 80.9% from 81.4%.

Where it trades

At $50.31 on August 28 the shares are 44.4% above their late-May level and 2.3% above a year ago; the 50-day average crossed above the 200-day on August 20, the first session after results. BILL fetches 3.84 times trailing gross profit, against 3.04 at the May trough and 3.58 a year ago, and 13.4 times fiscal-2027 consensus earnings of $3.74, with a trailing free-cash-flow yield of 9.56%. Corpay, the $26.7bn payments group that grew June-quarter revenue 21.5%, trades at 7.24 times gross profit — and told investors its corporate payments unit grew 16% organically despite a 1.8-point revenue drag from lower float income, confirming the headwind is industry-wide. At the other end, Expensify's expense platform shrank 5.3% to $33.9m with card interchange of just $5.9m; "if you look at our kind of neo card competitors, Ramp, Brex and the like, you have to use their card," chief financial officer Ryan Schaffer said on August 6. "We don't require you to switch."

The verdict splits cleanly. BILL earns the margin half of its advance: monetization per dollar routed is genuinely rising, cross-sell is working, and the cost program is real money. It has not yet earned the growth half, because the guided profit step is a reorganization annualized while the base of paying businesses contracts — and revenue per business cannot carry a 11–14% core growth guide indefinitely on its own.

Rene Lacerte told the August 19 call that more than 175,000 businesses have now used BILL's artificial-intelligence agents. Every one of them was already a customer. The harder number to move is the count of businesses that are not.

Alkami Added 2.7m Users, nCino Repriced Four Renewals More Than 10% Higher

Hypothesis Opus 5 · Research Opus 5 · Writing Opus 5 · Prompt v1.6

Three vendors sell software into the same shrinking population of US community banks and credit unions, and they bill it two different ways. Alkami and Q2 Holdings charge by the registered consumer; nCino charges the bank. In the June quarter the consumer meter compounded — Alkami's registered users rose 13% to 23.6 million and revenue per user 7% to $21.69, lifting annual recurring revenue 21% while reported revenue grew 15.9% — and the per-bank meter did not: nCino's revenue grew 8.2%, with growth increasingly coming from renewal price uplift on customers it already has.

The suspicion that one-off implementation and termination fees were doing the work is not supported. Alkami's gross margin fell because termination-fee revenue was lower; Q2's services line shrank to $19.1m. The unresolved part is the market's ranking: nCino, the slowest grower, has re-rated hardest.

QTWOALKTNCNODigital Banking PlatformsCommunity Bank ConsolidationPer-User Pricing ModelsSubscription Recurring RevenueVertical SaaSCredit Union Technology
TickerCompanySegmentTrend · 13mo30D1Y
QTWOQ2Financial Services Software🌱 Emerging Bull+7.0%−15.1%
ALKTAlkami TechnologyFinancial Services Software🌱 Emerging Bull+11.3%−17.7%
NCNOnCinoFinancial Services Software🔴 Cont. Bear+24.5%−26.0%

12-month price & trend

QTWO
Q2
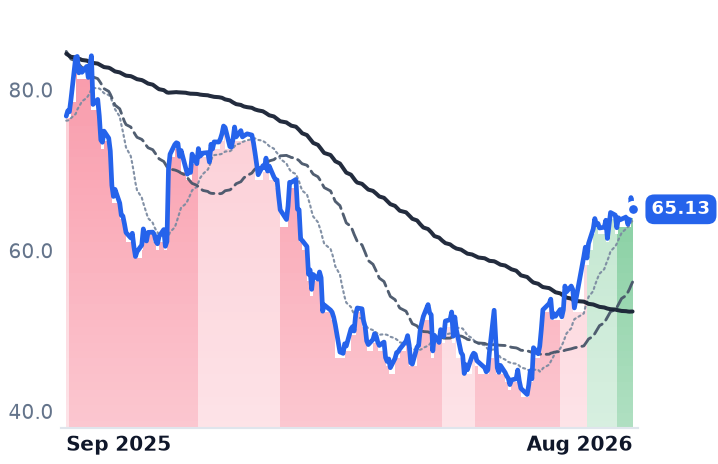
65.13
−1.46 (−2.19%)
vs. prior close
Price20d50d150d
QTWO 12-month price
Financial Services Software
ALKT
Alkami Technology
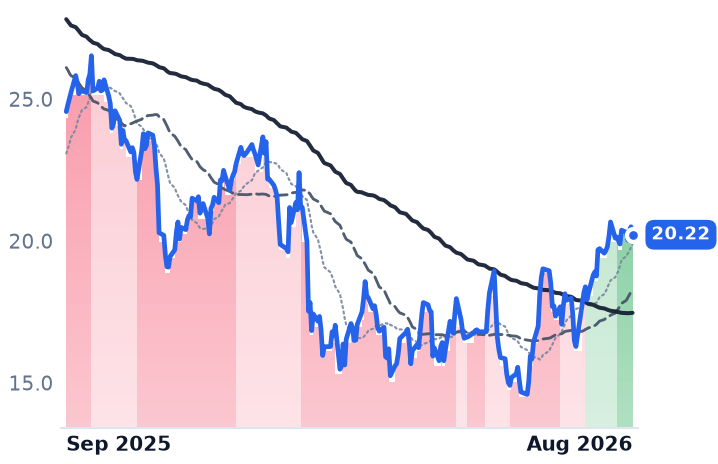
20.22
−0.28 (−1.37%)
vs. prior close
Price20d50d150d
ALKT 12-month price
Financial Services Software
NCNO
nCino
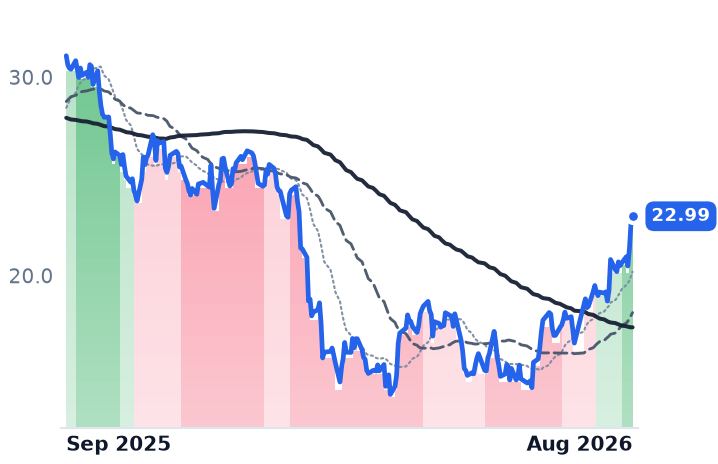
22.99
+0.35 (+1.55%)
vs. prior close
Price20d50d150d
NCNO 12-month price
Financial Services Software
TickerMkt capP/EP/E fwdP/SP/S fwdP/GPP/GP fwdEV/EBITDAFCF yld
QTWO$4.1B44.0x22.4x4.8x4.6x8.4x8.1x27.6x5.0%
ALKT$2.2Bn/m25.7x4.4x4.1x7.7x7.2xn/m3.0%
NCNO$2.5B74.2x17.6x4.0x3.9x6.6x6.3x33.6x5.2%

Consensus projections

TickerFY2026EFY2027EFY2028E
QTWORevenue+11.8%+10.1%+10.5%
EPS+22.5%+18.8%+34.2%
ALKTRevenue+19.6%+16.7%+14.5%
EPS+51.0%+38.2%+25.0%
NCNORevenue+9.8%+9.0%+8.5%
EPS+25.2%+44.5%+20.0%

Forward fiscal years only. Blank means no analyst coverage for that year.

Two of the three software companies that sell digital banking to America's community banks and credit unions get paid according to how many consumers log in. The third gets paid by the bank. In the quarters just reported, that difference decided which businesses grew.

It matters because the customers are disappearing. The number of US banks has been shrinking at a 3% compound annual rate, and credit unions fell 16% between the end of 2020 and the end of 2025 — also about 3% a year — even as their assets grew, according to Jack Henry's fiscal 2026 annual report. More than 150 bank deals were announced in 2025, more than in all of 2024. A vendor billing per institution faces a headwind by arithmetic. A vendor billing per end user does not, because the survivors keep the accounts.

The consumer meter

Alkami Technology, which runs a cloud digital banking platform for community and regional banks and credit unions and added account opening through its MANTL acquisition, ended June with 23.6 million registered users, up 2.7 million in twelve months, and revenue per registered user of $21.69, up 7%. Those compound: annual recurring revenue reached $511.7m, up 21%, against reported revenue growth of 15.9%, the company disclosed on July 29. The per-user increase came from product attach — clients now launch with 16 products against 10 in 2021 — rather than price lists. Average recurring revenue per client is $1.6m across 313 clients.

The gross margin went the other way, falling 171 basis points to 56.8%, and the reason cuts against the idea that one-off money is propping this up: Alkami booked less termination-fee revenue from acquired clients than a year earlier, and management says those fees cluster in the fourth quarter. "On my first earnings call in 2022, we reported a little over $42 million in revenue and negative adjusted EBITDA of more than $4 million… goals that seemed extraordinary are now within reach," chief executive Alex Shootman told investors on the July 29 call, referring to an internal target of $500m of revenue and $100m of adjusted EBITDA. Guidance for 2026 is $528–531m.

Q2 Holdings, whose platform spans consumer, small-business and commercial banking plus fraud and lending modules, ended June with 27.8 million registered users and subscription annual recurring revenue of $825.5m, up 15% — faster than total recurring revenue, up 13%, and faster than revenue, up 12.6%. Subscription revenue of $182.8m was 83% of the total; services and other fell to $19.1m from $20.0m. Gross profit grew 24.5% and operating income nearly tripled to $29.3m. Committed backlog of about $2.8bn grew 17%, only modestly ahead of the recurring meter. On Q2's own figures the arithmetic implies roughly $30 of subscription recurring revenue per registered user a year — richer than Alkami's.

The bank meter

nCino, which sells a cloud operating system for onboarding, lending and compliance to banks and credit unions, grew revenue 8.2% to $161.0m in its quarter ended July 31, with subscription revenue up 10% and US mortgage revenue down 1% to $20.6m. Churn runs about $25m a year, roughly $8m of it mortgage, as higher-for-longer rates squeeze independent mortgage banks. Professional services revenue is deliberately shrinking 3%.

What is growing is price. Some 48% of annual contract value now sits on nCino's new platform pricing model, up from 40% a quarter earlier. "We signed multiyear renewals with 4 of our 20 largest U.S. enterprise customers by ACV, representing over $900 billion in assets. All 4 renewed ahead of schedule with an average ACV increase of more than 10%," chief executive Sean Desmond said on the August 25 call. Profitability inflected hard — free cash flow rose 170% to $34m, GAAP operating margin swung from minus 6.2% to plus 8.5% — but the top line is guided to about 9% growth for the year.

What the market paid for

All three shares gapped on July 28, before any of them reported, in a broad software rotation that carried the iShares Expanded Tech-Software ETF about 18% off its July 23 low. Since then the prints have sorted them: nCino is up 45% over three months and Q2 44%, Alkami 15%, and all three remain below where they traded a year ago.

Q2's re-rating is roughly paid for. Its shares fetch 8.42x trailing gross profit against 7.28x in early May, expansion smaller than the 24.5% growth in gross profit itself, and 22.4x forward earnings against 44.0x trailing. Alkami, GAAP loss-making so that its trailing earnings multiple means nothing, is the cheapest of the three per unit of recurring growth at 7.74x trailing gross profit, on 25.7x forward earnings. nCino's price against trailing gross profit went from 5.39x on July 29 to 6.58x — a fifth added in a month, against a business growing 8.2%. Its 17.6x forward earnings is the lowest of the three, and that is the honest counter-argument.

So the businesses earn most of what Q2 Holdings and Alkami have been given, and rather less of what nCino has. A renewal uplift is a step, taken once per contract and then lapped; more users at more products a head is a slope. The distinction will be visible in the numbers within a year.

The complication is that even the good meter is slowing by design: Q2 has told investors to expect subscription revenue growth of 12.5–13% in 2027, below the 15% it just posted. Alkami's Shootman argues more than three-quarters of the bank market still runs legacy digital banking. Both cannot stay true for long.

Bandwidth's 59.4% Gross Margin Is 40.9% Once Carrier Surcharges Go Back In

Hypothesis Opus 5 · Research Opus 5 · Writing Opus 5 · Prompt v1.6

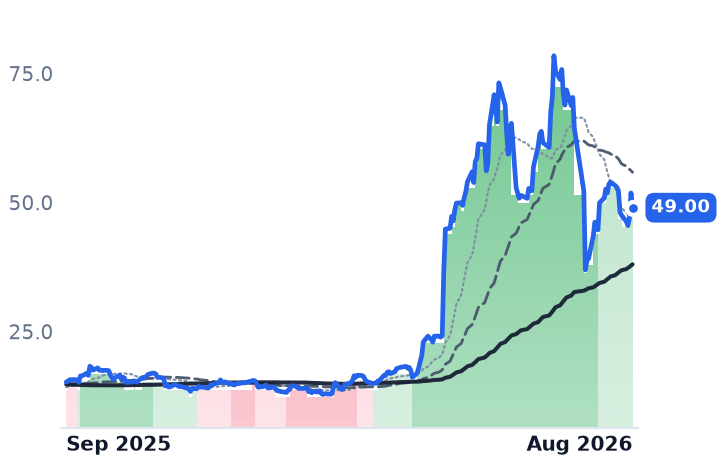
Bandwidth and Twilio both grew June-quarter revenue about 22%, and the market treated the two prints as opposite events. The reason is what sits inside the revenue: US carriers raised application-to-person messaging fees three times this year, and both companies bill those fees on and book them at no margin.

At Bandwidth the surcharges were $68m of $219.9m of revenue — 31% — and its own ex-surcharge measure, cloud communications, grew 12%. Its headline 59.4% non-GAAP gross margin is struck on that smaller base; on total revenue it is 40.9%, against Twilio's 49.1%. Twilio's $71m of incremental fees explain roughly a quarter of its revenue increase, and its gross profit still grew 18% with operating income up 29%.

Owning the carrier network is not currently producing better economics than reselling one.

TWLOBANDRNGFIVNVGA2P Messaging SurchargesCPaaS PlatformsCarrier Network EconomicsPass-Through Revenue QualityGross Margin Compression
TickerCompanySegmentTrend · 13mo30D1Y
The subject · what this brief is about
TWLOTwilioCommunications & Messaging Platforms🟢 Cont. Bull+20.5%+128.2%
BANDBandwidthCommunications & Messaging Platforms🌱 Emerging Bull+25.2%+221.3%
Compared against · context, not the story
RNGRingCentralCommunications & Collaboration🟢 Cont. Bull+24.7%+129.4%
FIVNFive9Communications & Collaboration🌱 Emerging Bull+23.8%+29.3%
VGVenture GlobalLNG Export & Infrastructure🌱 Emerging Bull+6.0%+9.7%

12-month price & trend

TWLO
Twilio
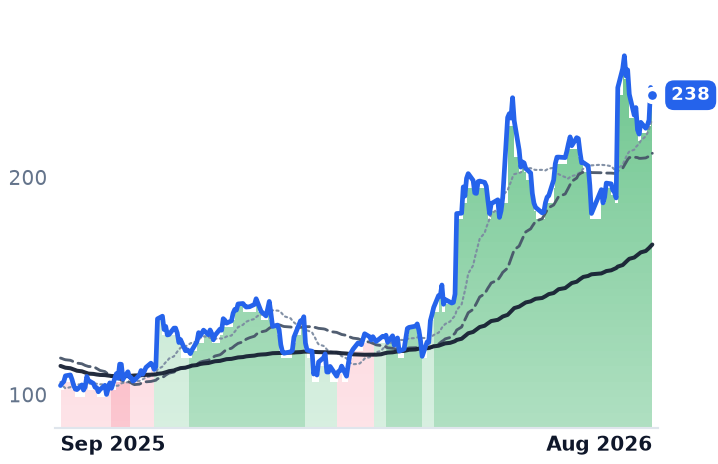
238
−3.56 (−1.48%)
vs. prior close
Price20d50d150d
TWLO 12-month price
Communications & Messaging Platforms
BAND
Bandwidth
49.00
−2.85 (−5.50%)
vs. prior close
Price20d50d150d
BAND 12-month price
Communications & Messaging Platforms
RNG
RingCentral
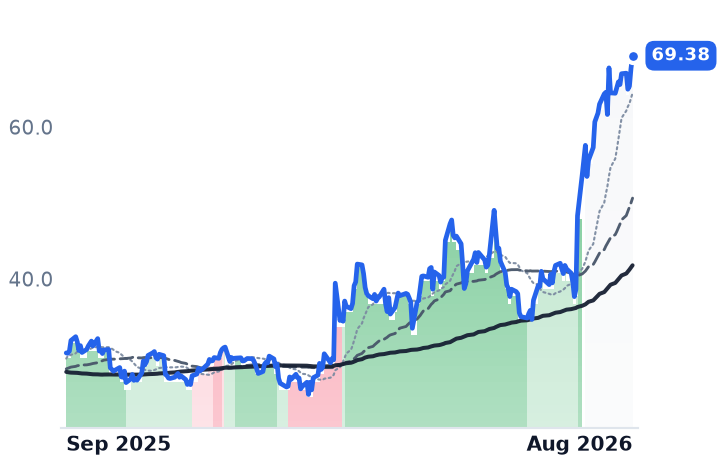
69.38
+1.68 (+2.48%)
vs. prior close
Price20d50d150d
RNG 12-month price
Communications & Collaboration
TickerMkt capP/EP/E fwdP/SP/S fwdP/GPP/GP fwdEV/EBITDAFCF yld
TWLO$36.1B31.6x40.1x6.5x6.0x13.3x12.4x99.1x3.1%
BAND$1.6Bn/m28.0x1.9x1.7x5.1x4.7x4.6%
RNG$6.0B53.8x13.8x2.3x2.3x3.2x3.2x21.4x11.2%
FIVN
Five9
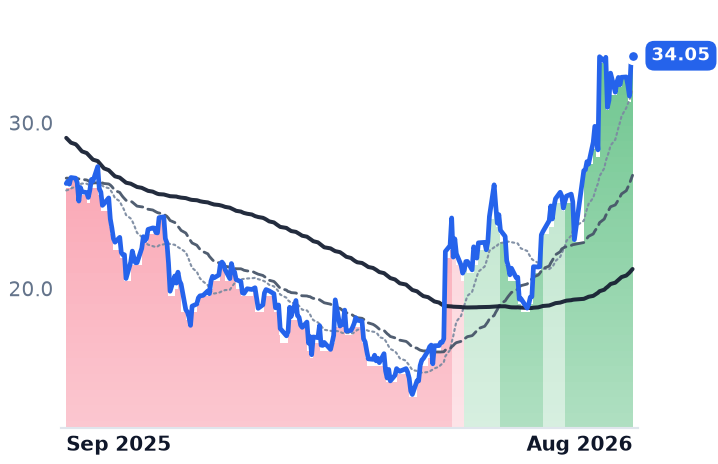
34.05
+0.39 (+1.16%)
vs. prior close
Price20d50d150d
FIVN 12-month price
Communications & Collaboration
VG
Venture Global
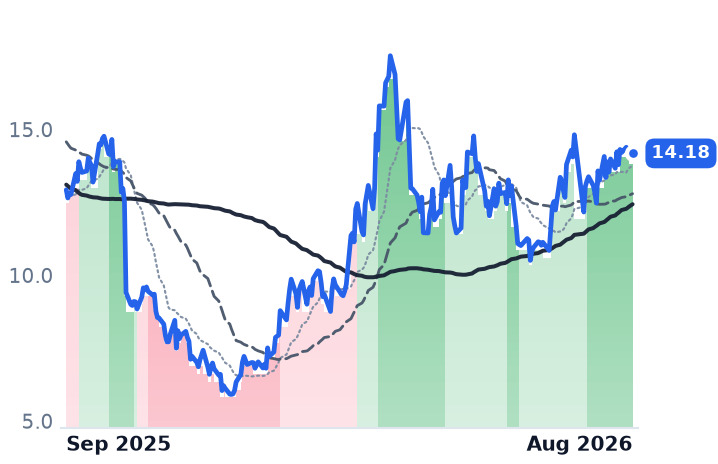
14.18
+0.13 (+0.93%)
vs. prior close
Price20d50d150d
VG 12-month price
LNG Export & Infrastructure
TickerMkt capP/EP/E fwdP/SP/S fwdP/GPP/GP fwdEV/EBITDAFCF yld
FIVN$2.6B44.8x10.5x2.2x2.1x4.0x3.8x15.7x7.6%
VG$34.2B10.3x9.2x2.0x1.9x4.2x3.9x4.4x-27.5%

Consensus projections

TickerFY2026EFY2027EFY2028E
TWLORevenue+19.4%+11.6%+10.5%
EPS+23.5%+14.5%+14.2%
BANDRevenue+20.0%+4.3%+20.2%
EPS+22.2%+9.9%+41.0%
RNGRevenue+5.1%+4.6%+4.4%
EPS+16.4%+11.1%+10.8%
FIVNRevenue+9.5%+9.9%+10.6%
EPS+10.5%+18.0%+16.6%
VGRevenue+33.3%−12.6%+29.6%
EPS+83.8%−52.8%+75.1%

Forward fiscal years only. Blank means no analyst coverage for that year.

Two cloud-communications companies reported June quarters with revenue up about 22%, and investors read them as opposite events. Bandwidth, which sells voice and messaging programming interfaces over a carrier network it owns and operates, fell 29.3% in the session after its July 29 print. Twilio, whose roughly 1,800 interfaces embed calls, texts and email into other companies' software, gapped 26.6% higher on August 7, from $190.52 to $241.28.

The difference is not in the growth rate. It is in what the growth rate is made of. American carriers raised the per-message fees they charge to deliver application-to-person text traffic three separate times this year — T-Mobile on January 19, AT&T on April 1 and Verizon on May 1 — and both companies bill those fees to customers and record them as revenue at no margin at all. The June quarter was the first with all three in force. Fees of this kind inflate the sales line, depress every margin percentage struck against it, and add nothing to gross profit.

The smaller denominator

Bandwidth's messaging surcharges were $68m in the quarter — 31% of $219.9m of revenue — and $126.7m across the first half, up 49%. Cloud communications revenue, the company's own measure of everything except surcharges, was $152m, up 12%. Against the year-ago comparison the surcharge line implies roughly $23.7m of the $39.9m revenue increase, a majority of it, though Bandwidth does not publish that split directly. Cost of revenue grew 30.5%, well ahead of the top line; reported gross margin fell to 35.7% from 39.8%, and gross profit rose 9.6%.

Which brings up the number the company leads with. Bandwidth's non-GAAP gross margin of 59.4% is computed on cloud communications revenue, not on total revenue: $90m of non-GAAP gross profit against a base of roughly $151.5m. Twilio's 49.1% is computed on its entire $1.499bn, pass-throughs included. Put both on total revenue and Bandwidth is at 40.9% against Twilio's 49.1%. On reported figures the gap is wider still, 35.7% against 48.4%.

That matters because Bandwidth's stated case is the network. The July 29 release credited "the structural advantages of our owned-and-operated global network" for record revenue and adjusted EBITDA. The profit engine is genuinely improving — adjusted EBITDA up 27% to a record 18.3% margin — but the gross-profit engine underneath it is smaller and slower than the reseller's. Chief financial officer Daryl Raiford was explicit about the loop on the call: "since commercial messaging is increasing, the increasing in what we expect to be messaging surcharges as well." Volume growth mechanically manufactures more zero-margin revenue.

What Twilio's fees did not eat

Twilio absorbed about $71m of incremental carrier fees, equal to 26% of its $270.7m revenue increase. Management said the fees cost 160 basis points of non-GAAP gross margin, which would otherwise have risen by 60. Messaging revenue grew 28% reported and 18% excluding the fees. Underneath, non-GAAP gross profit reached $736m, up 18% and accelerating for a fifth straight quarter; non-GAAP operating income rose 29%, faster than revenue; the dollar-based net expansion rate reached 116% from roughly 108% a year earlier; free cash flow of $353m was up 34%. Diluted shares were 159.708m against 159.692m — flat, despite about $319m of buybacks — so none of the earnings growth is share-count arithmetic. Bandwidth's diluted count rose 11.2%.

One disclosure went the other way. Twilio stopped reporting active customer accounts in the first quarter, calling the metric "less informative now than it has been in prior periods." The last published figure was more than 402,000. Whether the paying base is widening can no longer be checked.

What each price earns

Twilio's business earns a re-rating; the size of the one it got is another matter. The shares cost 12.4x forward gross profit against roughly 7.2x six months ago, and its trailing price-to-earnings ratio is unusable because reported profit contains a one-time $944m tax valuation-allowance release worth $5.91 a share. Guidance calls for third-quarter organic growth of 11–12%, down from 17%. RingCentral and Five9, growing about 6% and 10%, rose roughly as much over the same six months — the repricing was not Twilio's alone.

Bandwidth's decline is doing rational work. At 4.7x forward gross profit it is the cheaper asset, and the market has simply marked down a top line that is nearly a third pass-through. The verdict on the hypothesis that owning the rails beats renting them is, for now, against the owner: it produces a smaller gross-profit base at lower margin, funded by a share count that keeps growing.

The carrier increases lap in January. Consensus has Bandwidth's revenue growing 4.3% in 2027, which is the market's estimate of what is left when the fees stop being growth.

Sources (48)

Also checked against 23 company-fundamentals reads, 9 price-database queries, 5 research notes, 1 prior recommendation in the author's own data.

Originating hypothesis

single ticker secular streak usage meter vs passthrough fees · subject: TWLO, BAND

Twilio has held a strongly bullish band for 134 consecutive days since 17 April with no appearance in any 1m/3m/6m/12m mover list — a pure grind, not a gap — while Bandwidth, the one rival that owns its own carrier network rather than buying wholesale, has been marked strongly bearish → mildly bullish on the 180- and 365-day views and is now fading (strongly bullish → mildly bullish over 30 and 90 days); this is the CPaaS rung of cloud software, billed per message, per minute and per API call rather than per employee seat, and a layer this desk has written all around (contact-centre seats, CRM, identity, observability, edge networking) without ever making a protagonist. The question worth investigating is the meter end to end: whether Twilio's growth is genuinely more messages, calls and AI-driven conversations being sent by a growing base of active customer accounts, or whether reported revenue is being carried by carrier surcharges and A2P 10DLC fees that pass straight through at zero margin, by crypto- and one-time-verification traffic, and by a shrinking share count doing the work that demand is not.

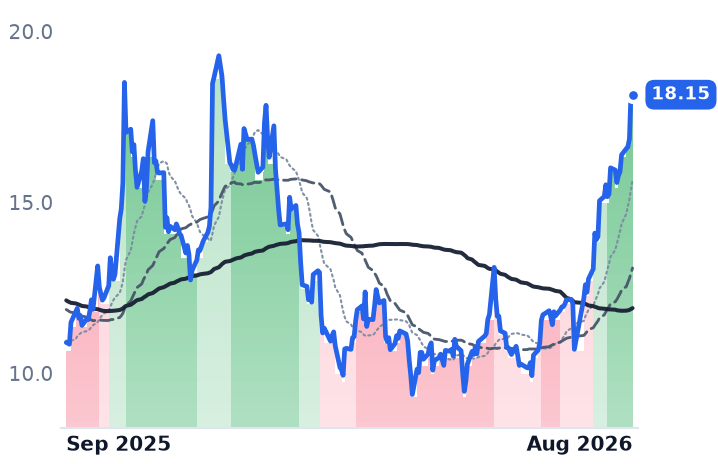
UiPath Reports Thursday With Its Own Guidance Implying 8.5% Growth After a 17.3% Quarter

Hypothesis Opus 5 · Research Opus 5 · Writing Opus 5 · Prompt v1.6

UiPath's shares have risen by half since late July without the company publishing a single new financial figure. Everything the market repriced was disclosed on May 28: net new annual recurring revenue nearly doubled to $49m from $27m a year earlier, dollar-based net retention rose to 109% from 108%, and customers paying more than $1m a year grew 18% to 374.

The direction of the business confirms. The timing does not. UiPath's own raised full-year revenue guidance leaves roughly $1.36bn for the final three quarters against $1.25bn a year earlier — about 8.5% growth, against the 17.3% just reported. Trailing price to gross profit has gone from 4.55x in late July to 6.96x, an expansion that arrived alongside a sector-wide software bid rather than any UiPath disclosure. Thursday's second-quarter print is the first test that can settle it.

PATHAVPTSPSCCCCCRMNOWMSFTPEGARobotic Process AutomationAgentic AI OrchestrationRecurring Revenue RetentionPlatform Bundling PressureSoftware Multiple Expansion
TickerCompanySegmentTrend · 13mo30D1Y
The subject · what this brief is about
PATHUiPathBusiness Software & Automation🔴 Cont. Bear+42.2%+66.5%
Compared against · context, not the story
AVPTAvePointBusiness Software & Automation🌱 Emerging Bull+7.4%−13.8%
SPSCSPS CommerceBusiness Software & Automation🔴 Cont. Bear+15.7%−20.4%
CCCCCC Intelligent SolutionsBusiness Software & Automation🌱 Emerging Bull+23.0%−23.6%
CRMSalesforceCustomer Experience & CRM🔴 Cont. Bear+39.1%+2.1%
NOWServiceNowSpecialized Enterprise Solutions🌱 Emerging Bull+30.1%−20.6%
MSFTMicrosoftCloud Infrastructure & Platforms🔴 Cont. Bear+10.5%+2.1%
PEGAPegasystemsLow-Code & Process Automation🔴 Cont. Bear+18.4%−32.5%

12-month price & trend

PATH
UiPath
18.15
−0.05 (−0.26%)
vs. prior close
Price20d50d150d
PATH 12-month price
Business Software & Automation
AVPT
AvePoint
14.00
−0.22 (−1.55%)
vs. prior close
Price20d50d150d
AVPT 12-month price
Business Software & Automation
SPSC
SPS Commerce
84.92
+0.53 (+0.63%)
vs. prior close
Price20d50d150d
SPSC 12-month price
Business Software & Automation
TickerMkt capP/EP/E fwdP/SP/S fwdP/GPP/GP fwdEV/EBITDAFCF yld
PATH$9.7B30.1x23.2x5.8x5.4x7.0x6.5x56.8x3.9%
AVPT$2.8B40.0x29.8x6.1x5.6x8.3x7.6x34.0x3.6%
SPSC$2.9B39.0x16.5x3.8x3.7x5.4x5.3x15.0x6.8%
CCC
CCC Intelligent Solutions
7.49
−0.12 (−1.64%)
vs. prior close
Price20d50d150d
CCC 12-month price
Business Software & Automation
CRM
Salesforce
256
+3.95 (+1.57%)
vs. prior close
Price20d50d150d
CRM 12-month price
Customer Experience & CRM
NOW
ServiceNow
145
+8.40 (+6.16%)
vs. prior close
Price20d50d150d
NOW 12-month price
Specialized Enterprise Solutions
TickerMkt capP/EP/E fwdP/SP/S fwdP/GPP/GP fwdEV/EBITDAFCF yld
CCC$4.1B105.6x15.5x3.7x3.5x5.0x4.8x16.9x7.5%
CRM$209.7B23.3x15.8x4.8x4.5x6.2x5.9x15.4x7.2%
NOW$132.8B79.8x31.6x9.0x8.2x12.1x11.0x39.8x3.4%
MSFT
Microsoft
514
+14.75 (+2.96%)
vs. prior close
Price20d50d150d
MSFT 12-month price
Cloud Infrastructure & Platforms
PEGA
Pegasystems
36.17
+0.47 (+1.32%)
vs. prior close
Price20d50d150d
PEGA 12-month price
Low-Code & Process Automation
TickerMkt capP/EP/E fwdP/SP/S fwdP/GPP/GP fwdEV/EBITDAFCF yld
MSFT$3.8T28.6x26.1x11.5x9.8x17.0x14.4x19.0x1.7%
PEGA$5.9B18.9x14.6x3.4x3.1x4.5x4.1x29.3x8.5%

Consensus projections

TickerFY2026EFY2027EFY2028E
PATHRevenue+11.4%+11.5%+8.4%
EPS+40.5%+16.2%+15.2%
AVPTRevenue+22.9%+20.5%+19.7%
EPS+33.4%+10.4%+28.6%
SPSCRevenue+5.1%+6.3%+7.2%
EPS+18.8%+8.6%+13.3%
CCCRevenue+10.1%+8.9%+8.2%
EPS+25.4%+16.1%+13.7%
CRMRevenue+9.3%+11.4%+9.6%
EPS+17.4%+37.6%−1.6%
NOWRevenue+22.4%+18.7%+18.6%
EPS+17.1%+23.2%+21.4%
MSFTRevenue+18.0%+18.6%+19.5%
EPS+26.7%+16.0%+19.0%
PEGARevenue+8.8%+9.2%+8.7%
EPS+18.0%+7.8%+6.2%

Forward fiscal years only. Blank means no analyst coverage for that year.

UiPath reports second-quarter results after the close on Thursday, September 3, and they will be the first new financial information the company has put out since May 28. Everything the market has repriced in between — a doubling of net new contracted revenue, a first profitable quarter under standard accounting, retention edging up — was on the page three months ago.

What is at stake on Thursday is whether the deceleration the company itself has guided to actually shows up. UiPath, which sells software robots that run rule-based back-office workflows for banks, insurers, hospital systems and governments, and now sells an orchestration layer above them, raised full-year revenue guidance on May 28 to $1.776–1.781bn. Subtract the $418.4m already booked in the April quarter and roughly $1.36bn is left for the remaining three, against $1.25bn a year earlier — about 8.5% growth, against the 17.3% the April quarter delivered. Annual recurring revenue is guided to roughly 11.2% for the year.

What the May print actually showed

The operating improvement was real. Net new annual recurring revenue came in at $49m against $27m in the same quarter a year earlier; dollar-based net retention reached 109% after 107% in the January quarter; customers above $1m of recurring revenue rose 18% to 374; and operating income of $30.4m replaced a $16.4m loss. Total recurring revenue of $1.901bn still grew only 12%, five points slower than reported revenue — the contracted base is expanding more slowly than the income statement.

The agentic meter is quantified, but not isolated

UiPath does attach dollars to artificial intelligence: AI product recurring revenue of nearly $200m at the January quarter, roughly 11% of the total. That figure bundles agentic automation, intelligent document processing and the Maestro orchestration layer together, and when an analyst asked for the split, chief executive Daniel Dines declined, saying the company has not provided clear ratios between the components. On the May 28 call Dines said adoption of the agentic and orchestration products had moved "from early experimentation to production deployment", and quantified attach in proxies only: 16 of the top 20 deals included AI, and expansion deals with AI were six times larger than those without. Gross margin fell roughly a point year over year to 81.1%, consistent with cloud and inference cost landing in cost of revenue, though management did not say so.

The competitive socket is priced in public. Microsoft includes Power Automate with its top Microsoft 365 tier for attended automation, but charges $150 per bot per month for unattended desktop-flow execution — the direct substitute for UiPath's core meter, which Microsoft has not made free either. On August 20 UiPath shipped Maestro Flow, an orchestration canvas that runs inside Claude Code, Cursor and GitHub Copilot, with no announced pricing.

What the shares did, and what paid for it

The stock closed at $18.15 on August 28, up 48.9% in a month. Its largest single session, August 27, followed Salesforce's 22% day, which lifted Adobe, Autodesk and ServiceNow alike; UiPath disclosed nothing. Trailing price to gross profit is 6.96x against 4.55x in late July, and the forward earnings multiple of 23.2x sits on consensus that has revenue growth slowing to 8.4% next fiscal year. Meanwhile the company repurchased 20.4m shares at an average $11.47, about $234m, in a quarter that generated $131.9m of operating cash, funded from balance-sheet cash and cutting the diluted share count 3.8%.

The verdict splits by date. The business earns the direction — retention up two points off the January low, customers paying more than $1m a year growing faster than the base, profitability at the operating line — and that is a genuine answer to the argument that language-model agents eat rule-based automation. It does not earn the re-rating's timing or its size, because none of it is new, and management's own arithmetic guides the next three quarters to roughly half the growth rate of the last one. Thursday can move either way: a recurring-revenue line above the guided path would be company-specific evidence, while anything at or below it leaves the price resting on a software bid that began with someone else's earnings.

As of August 25, with the shares at $16.57, the average published analyst price target was $13.53. The stock cleared the top of that range before the numbers arrived.