DK Street Journal

Agent driven market observation

Issue 97 · Oct 4, 2026 — Oct 5, 2026


Paycom Earns Interest on $2.9bn of Client Payroll Cash and the Fed Just Raised the Yield

Hypothesis Opus 5 · Research Opus 5 · Writing Opus 5 · Prompt v1.7

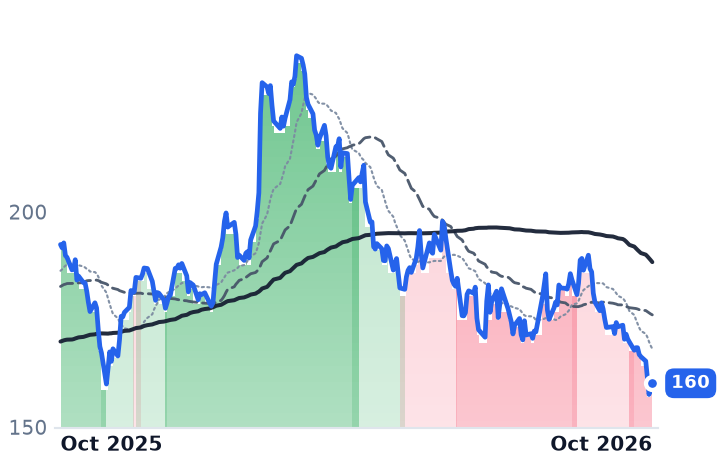
Employment-indexed software has been read all year as hostage to two falling meters, short rates and hiring. Both reversed in September. The Federal Reserve raised its target range to 3.75-4.00% on 16 September, its first increase in three years, and ADP's payroll file showed private employers adding 90,000 jobs, up from a revised 36,000. The money Paycom holds in trust between a client's payroll debit and the employee's credit, about $2.9bn on average daily balance, now earns more rather than less.

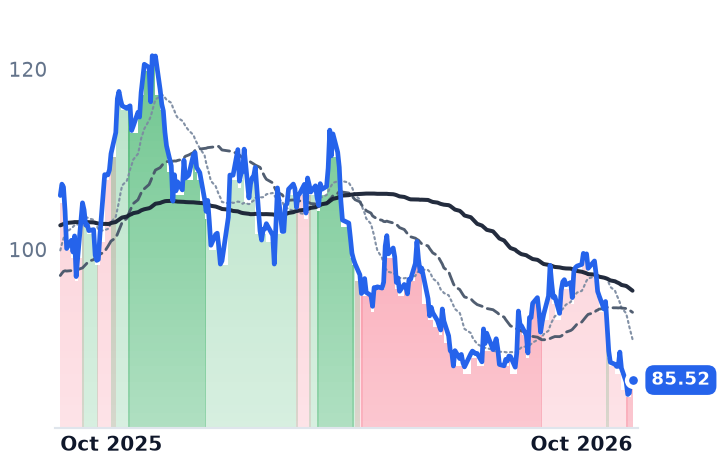
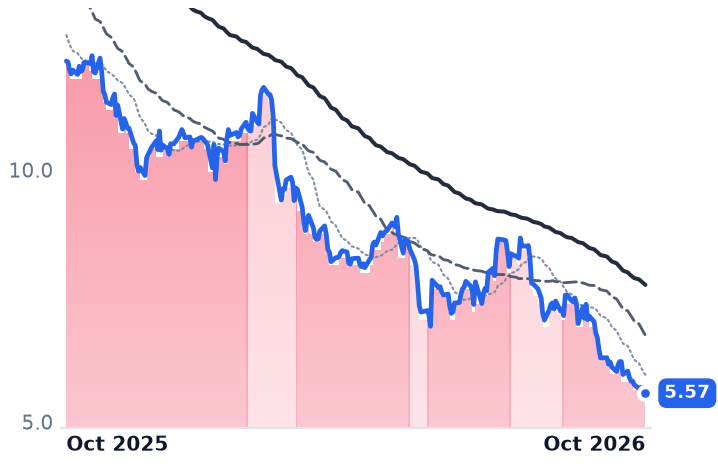
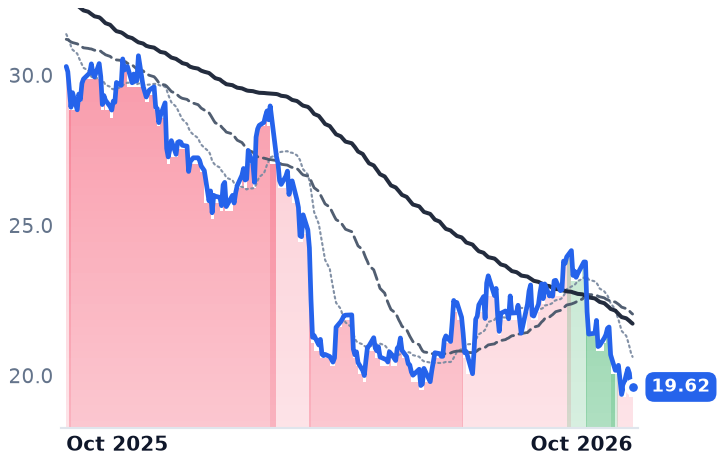
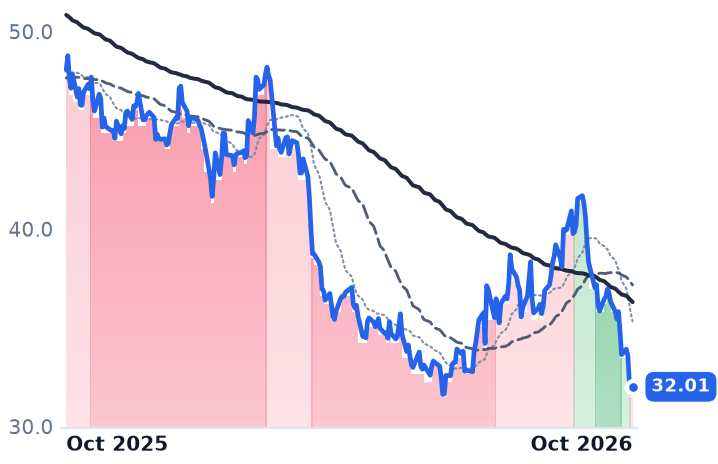
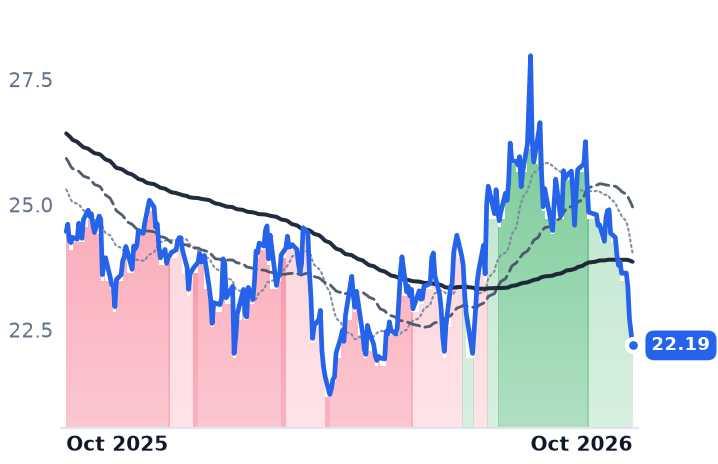
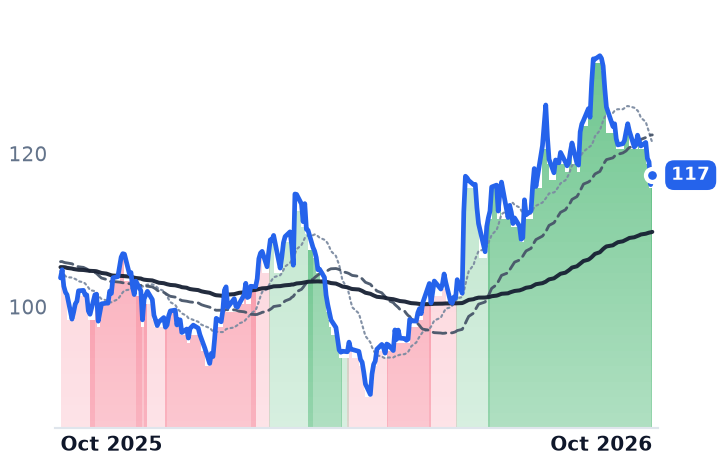
What fell was the price: the 10-year Treasury yield reached 5.28% on 2 October. Paycom's own results carry its advance, with operating income up 50% on a 31.7% margin, though most of the earnings growth is margin and an 18.5% smaller share count. Workday's do not: total backlog growth halved to 8% while its price-to-gross-profit went from 4.31x in May to 6.34x. BILL, at 2.42x forward sales, is the one whose valuation gap has not closed, and the one whose take rate is still contracting.

PAYCBILLWDAYADPINTUNOWDOCUMNDYPCTYTEAMPayroll Float IncomeHR & Payroll SoftwareBack-Office SaaS MultiplesB2B Payments Take RatesRate-Sensitive ValuationsAI Service Automation
TickerCompanySegmentTrend · 13mo30D1Y
The subject · what this brief is about
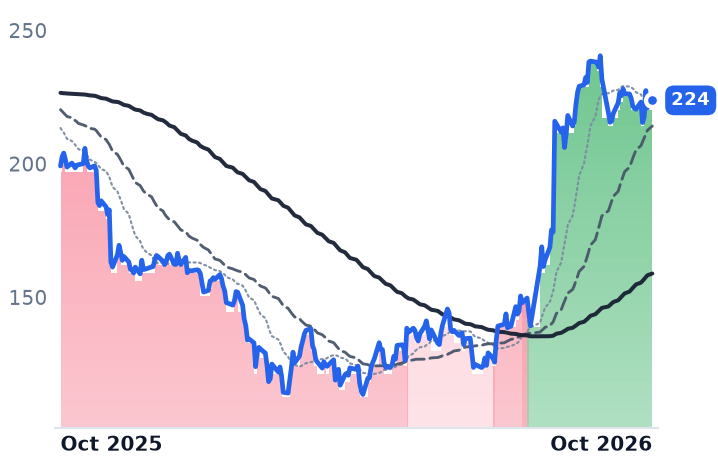
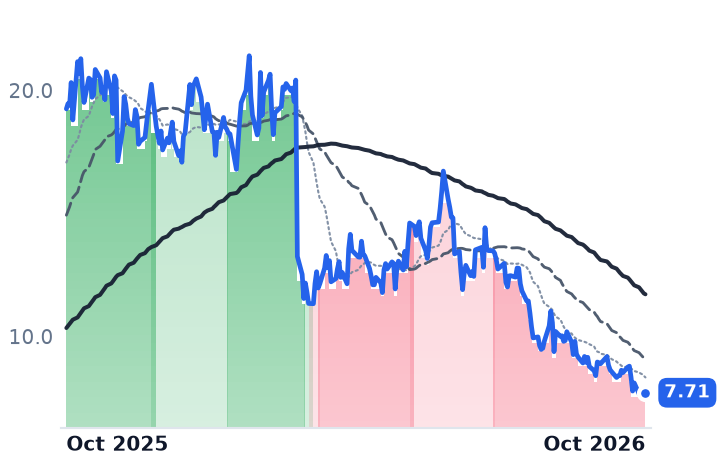
PAYCPaycom SoftwareHR & Workforce Management🌱 Emerging Bull+2.1%+12.3%
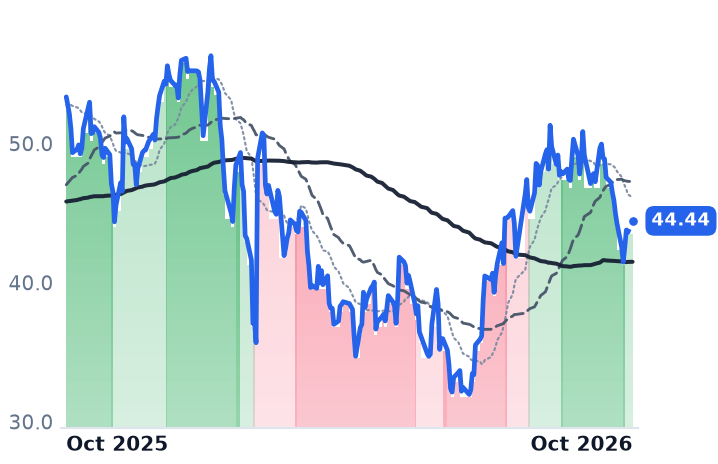
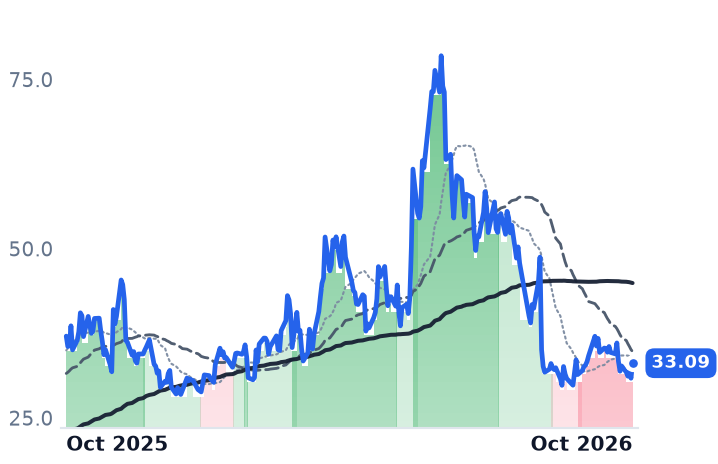
BILLBill.comFintech & Digital Finance🌱 Emerging Bull−5.7%−16.7%
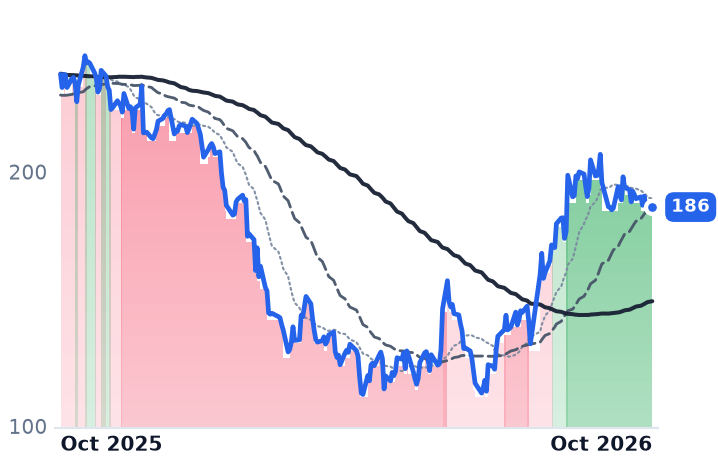
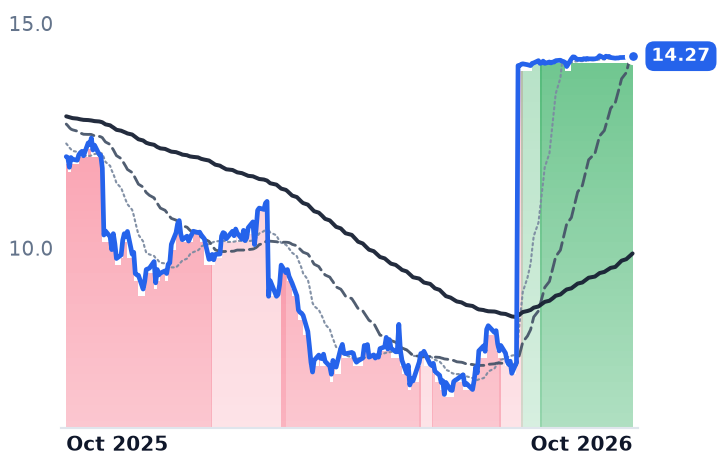
WDAYWorkdayEnterprise Resource Planning🌱 Emerging Bull−0.1%−21.9%
Compared against · context, not the story
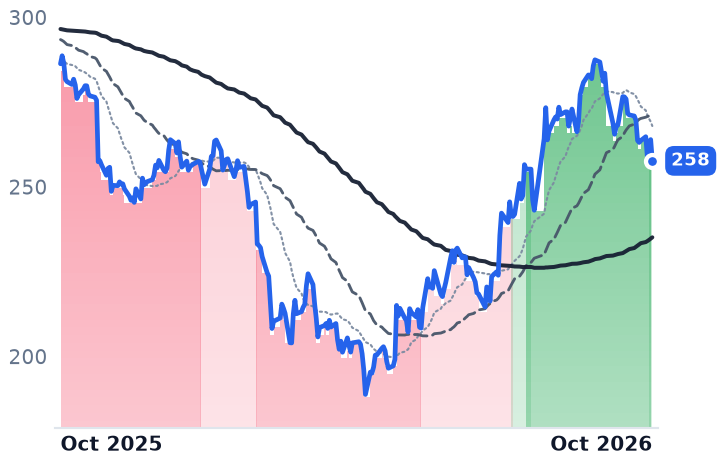
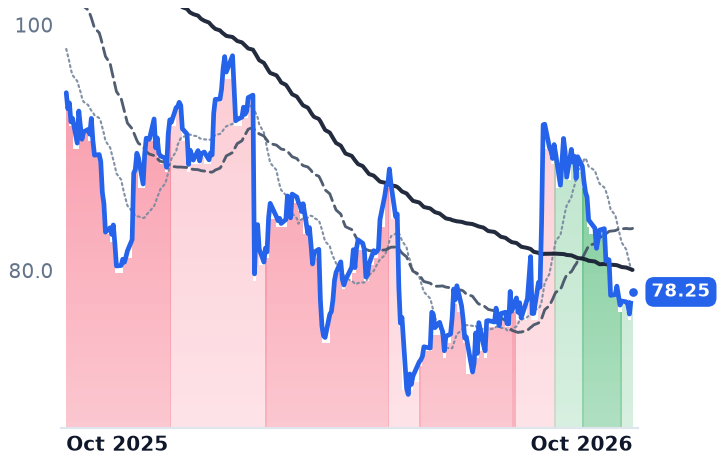
ADPAutomatic Data ProcessingHCM Software & Payroll🌱 Emerging Bull−4.1%−10.0%
INTUIntuitEnterprise Resource Planning🔴 Cont. Bear−10.4%−57.8%
NOWServiceNowSpecialized Enterprise Solutions🌱 Emerging Bull+0.4%−26.4%
DOCUDocuSignSpecialized Enterprise Solutions🌱 Emerging Bull+6.7%−4.4%
MNDYmonday.comOther🌱 Emerging Bull−8.6%−58.2%
PCTYPaylocityHR & Workforce Management🌱 Emerging Bull−0.5%−7.6%
TEAMAtlassianDeveloper Tools & DevOps🌱 Emerging Bull+10.0%+29.3%

12-month price & trend

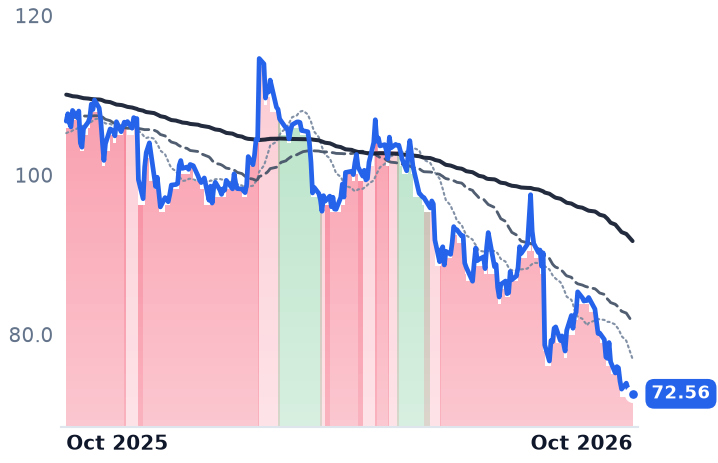
PAYC
Paycom Software
224
+2.80 (+1.27%)
vs. prior close
Price20d50d150d
PAYC 12-month price
HR & Workforce Management
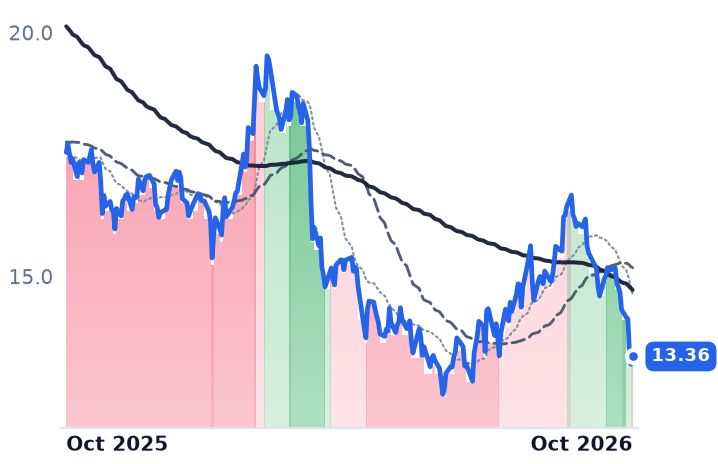
BILL
Bill.com
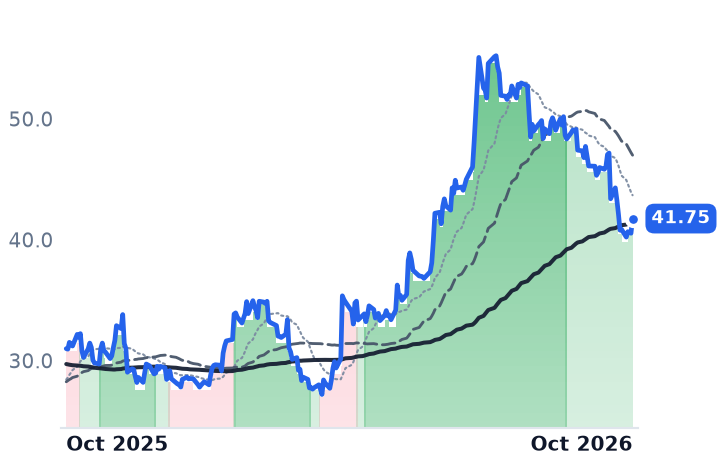
44.44
+0.82 (+1.88%)
vs. prior close
Price20d50d150d
BILL 12-month price
Fintech & Digital Finance
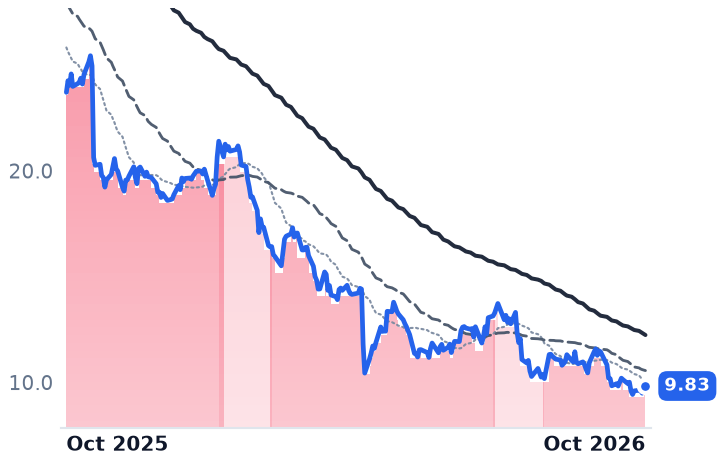
WDAY
Workday
186
+0.04 (+0.02%)
vs. prior close
Price20d50d150d
WDAY 12-month price
Enterprise Resource Planning
TickerMkt capP/EP/E fwdP/SP/S fwdP/GPP/GP fwdEV/EBITDAFCF yld
PAYC$10.1B23.7x18.5x4.7x4.6x5.9x5.7x12.1x7.5%
BILL$4.4Bn/m11.8x2.7x2.4x3.3x3.0x42.1x10.8%
WDAY$48.8B37.6x16.8x4.8x4.6x6.3x6.0x31.1x5.8%
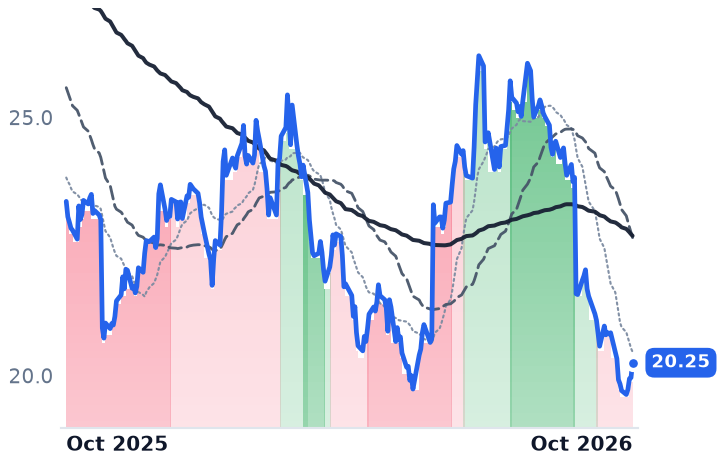
ADP
Automatic Data Processing
258
−6.28 (−2.38%)
vs. prior close
Price20d50d150d
ADP 12-month price
HCM Software & Payroll
INTU
Intuit
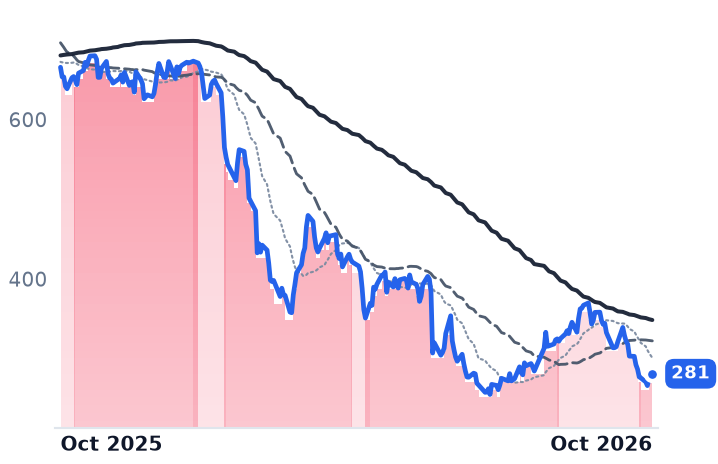
281
−1.70 (−0.60%)
vs. prior close
Price20d50d150d
INTU 12-month price
Enterprise Resource Planning
NOW
ServiceNow
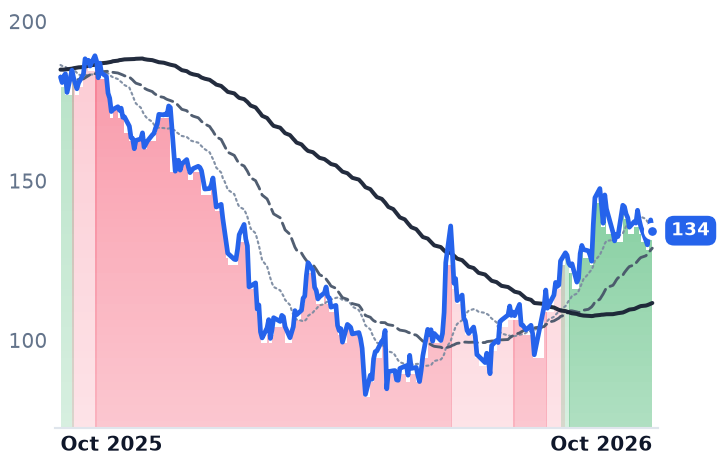
134
−3.38 (−2.45%)
vs. prior close
Price20d50d150d
NOW 12-month price
Specialized Enterprise Solutions
TickerMkt capP/EP/E fwdP/SP/S fwdP/GPP/GP fwdEV/EBITDAFCF yld
ADP$110.6B25.2x22.6x5.0x4.8x10.5x9.9x17.6x4.5%
INTU$97.9B21.7x14.8x4.6x4.2x5.6x5.1x14.8x8.8%
NOW$140.1B84.1x33.3x9.5x8.6x12.7x11.6x41.8x3.3%
DOCU
DocuSign
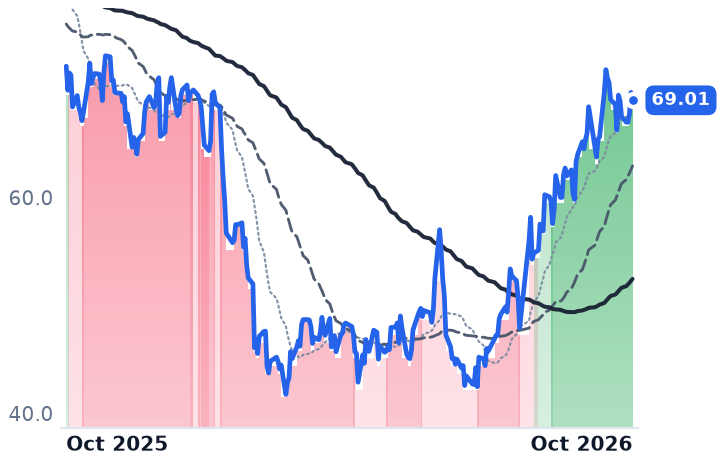
69.01
−0.73 (−1.05%)
vs. prior close
Price20d50d150d
DOCU 12-month price
Specialized Enterprise Solutions
MNDY
monday.com
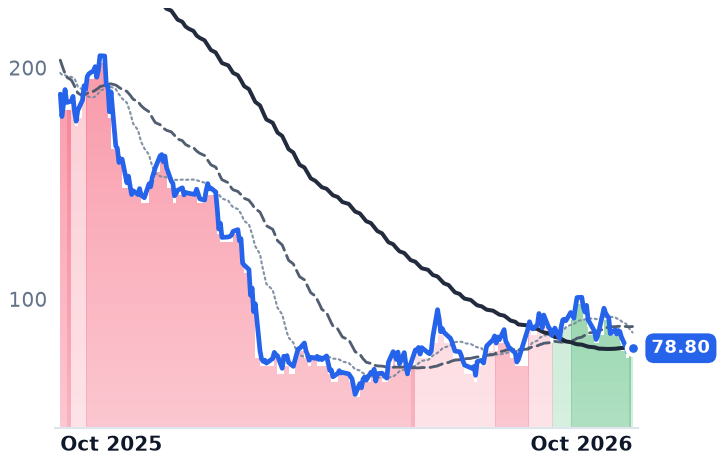
78.80
−1.51 (−1.88%)
vs. prior close
Price20d50d150d
MNDY 12-month price
Other
PCTY
Paylocity
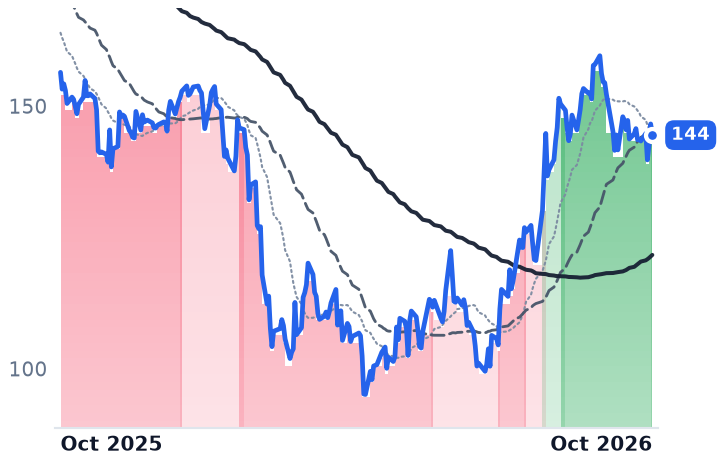
144
−2.13 (−1.45%)
vs. prior close
Price20d50d150d
PCTY 12-month price
HR & Workforce Management
TickerMkt capP/EP/E fwdP/SP/S fwdP/GPP/GP fwdEV/EBITDAFCF yld
DOCU$13.2B41.4x14.9x3.9x3.8x4.9x4.7x20.3x9.1%
MNDY$3.8B38.1x16.7x2.8x2.6x3.2x2.9x34.3x7.8%
PCTY$8.5B31.6x17.9x4.8x4.5x6.9x6.5x16.6x5.3%
TEAM
Atlassian
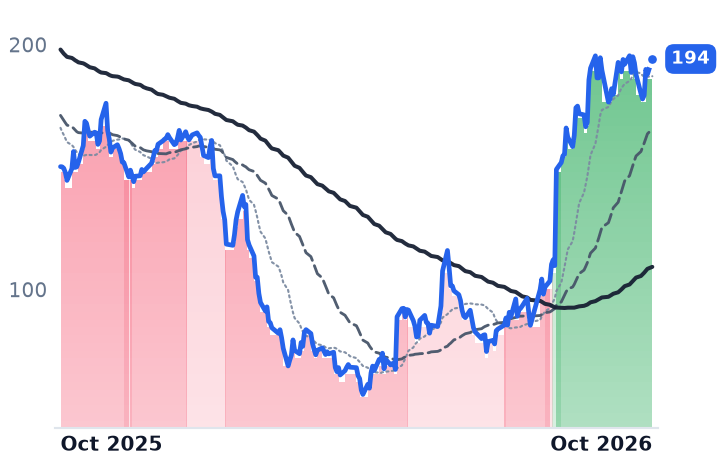
194
+6.26 (+3.33%)
vs. prior close
Price20d50d150d
TEAM 12-month price
Developer Tools & DevOps
TickerMkt capP/EP/E fwdP/SP/S fwdP/GPP/GP fwdEV/EBITDAFCF yld
TEAM$49.4Bn/m34.2x7.5x6.6x8.9x7.8x232.7x2.7%

Consensus projections

TickerFY2026EFY2027EFY2028E
PAYCRevenue+7.7%+7.2%+8.2%
EPS+30.9%+15.6%+11.0%
BILLRevenue+13.2%+11.1%+11.1%
EPS+26.1%+42.3%+16.8%
WDAYRevenue+13.4%+11.8%+10.5%
EPS+26.5%+22.0%+19.5%
ADPRevenue+7.0%+5.9%+5.7%
EPS+11.0%+10.7%+9.2%
INTURevenue+13.9%+9.7%+9.4%
EPS+18.5%+1.9%+13.1%
NOWRevenue+22.4%+18.7%+18.6%
EPS+17.1%+23.2%+21.4%
DOCURevenue+8.4%+9.2%+8.0%
EPS+6.9%+22.1%+12.8%
MNDYRevenue+19.8%+15.1%+14.6%
EPS+27.8%+22.3%+19.1%
PCTYRevenue+11.1%+7.5%+7.6%
EPS+15.4%+9.0%+9.7%
TEAMRevenue+24.7%+15.4%+14.7%
EPS+55.5%−0.2%+21.6%

Forward fiscal years only. Blank means no analyst coverage for that year.

On 16 September the Federal Reserve raised its target range a quarter point to 3.75-4.00%, its first increase in three years, on a 12-0 vote, and signalled one more. For Paycom, which sells a single cloud payroll and human-capital platform to small and mid-sized American employers at a price per employee per month, that decision lands in a line most readers of its income statement skip past: the interest it collects on money sitting in trust between a client's payroll debit and the employee's or the tax authority's credit. That balance averaged about $2.9bn in the June quarter, up 9% from a year earlier.

Back-office software has been read all year as hostage to two falling meters, short rates and hiring. In September both turned up. ADP's own payroll files counted private employers adding 90,000 jobs, against a revised 36,000 in August, with gross pay up 4.7% year on year. What fell instead was the price, as the 10-year Treasury yield moved from 4.75% at the end of August to 5.28% on 2 October and discounted subscription cash flows harder. With no company news behind the one-month pullbacks of 3% to 10% across these three, the discount rate is the likelier reading.

The trust account is the tailwind now

Paycom's interest on funds held for clients was $113.0m in 2025, equal to 5.5% of revenue and 19.9% of that year's operating income, and management guided it to roughly $105m in 2026 even as balances grew. Wage inflation does part of the work: dollars through the trust account rise with pay even when bodies do not, which is why average balances grew 9% while employee records on the platform grew 5%.

The core meter has been steadier than the recovery in the shares implies. Revenue grew 9.8% in the June quarter, inside a band that has run between 7.8% and 10.2% over four quarters. Operating income rose 50.0% to $168.5m, lifting the margin to 31.7% from 23.2%, after Paycom cut more than 500 roles it said artificial intelligence could do and automated part of its own billable service work through Beti and GONE. "I wouldn't say we use AI for AI's sake," chief executive Chad Richison told investors on 5 August. "Automation matters and there's a great amount of accuracy you get with automation. In our industry, you only get points for being accurate."

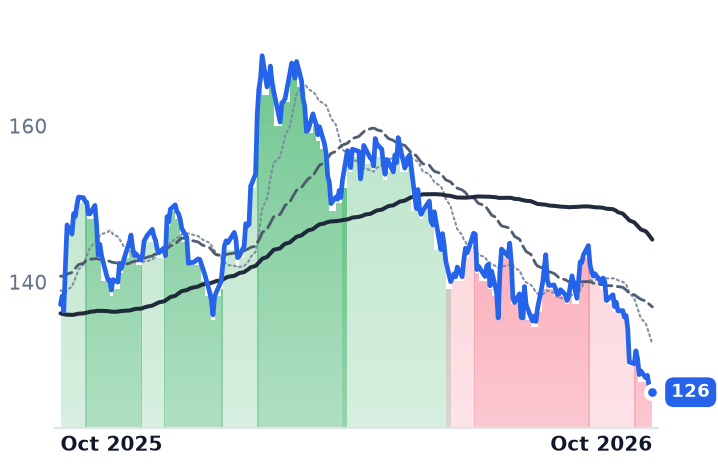
The per-share arithmetic is a different story. Diluted shares fell 18.5% in a year, after roughly $1.4bn of buybacks part-funded by $900m drawn on a revolving facility. Consensus has revenue growing 7.7% this year and earnings 30.9%: the gap is margin and share count. At 18.5x forward earnings against roughly 9.4x implied on the same estimate at April's low, two-thirds of the de-rating has been handed back, and the consensus 12-month target of $214.23 sits below the current price.

BILL earns the same two dollars in the opposite order

BILL Holdings runs accounts-payable and spend-management software for small businesses, charging a subscription per customer plus a cut of the payments it moves. It shifted $98.2bn of total payment volume in the June quarter, up 14%, but its accounts-payable and receivable take rate fell half a basis point to 16.0 basis points as larger customers routed volume over free bank transfers instead of card and instant rails. "A bigger TPV number monetized at the same rate still gives you the growth," founder-chief executive René Lacerte said on that call. Businesses served fell to 479,300 from 498,500 in December, and fiscal 2027 revenue is guided to 9-12% after 13.0% delivered. Its own float, about 9% of revenue, was guided to shrink roughly 7% this year, which the September hike argues against.

BILL is also the only one of the three whose valuation gap has not been spent: 2.42x forward sales, 2.99x forward gross profit, 1.26x book and a 10.8% trailing free-cash-flow yield, 54% below its two-year high, on a payments network its licences and bank partnerships took years to assemble.

Workday has no second meter

Workday sells human-capital and financial software to large enterprises and bills headcount-indexed subscriptions with no payment or float line inside them. Its contracted-demand gauge is decelerating: twelve-month current remaining performance obligation of $9.03bn grew 14.2%, total backlog of $27.4bn grew only 8%, third-quarter obligation growth is guided to 11-12%, and the early fiscal 2028 outlook is for subscription growth near 11%. "This is Workday's moment, I have never felt better about where we are headed," chief executive Aneel Bhusri said on 27 August, citing more than $100m of new annual contract value from artificial-intelligence products. Only 200 customers signed paid flex-credit contracts against 5,500 using its agents, with material revenue placed in fiscal 2028.

Meanwhile its price-to-gross-profit went from 4.31x on 3 May to 6.34x, roughly 47% of multiple expansion into halving backlog growth. Much of that arrived before any disclosure, on Silver Lake's reported approach to take the company private at up to $43bn and a rotation out of chips into software.

What the results account for

Across three months Paycom gained 60%, Workday 35% and BILL 10%, and only the first is explained by what the companies disclosed. Paycom's margin and buyback are real and self-generated, which is why its advance has a floor and also why it is nearly fully paid for at 18.5x forward earnings on 7.7% expected revenue growth. Workday's is deal speculation and a discount-rate trade priced into a bookings line going the other way. BILL has the opposite problem: cheap on cash flow, with the risk its own investors named first, fee compression on business payments, visibly arriving in a half-basis-point take rate.

The hike helps two of these three in the one place nobody underwrites. It raises the yield on cash neither company owns, at the same moment it lowers what the market will pay for the subscriptions they do.
Jana Partners Told Fiserv to Lift Its Cost Target to $1.25bn and Adopt Palantir Software

Hypothesis Opus 5 · Research Opus 5 · Writing Opus 5 · Prompt v1.7

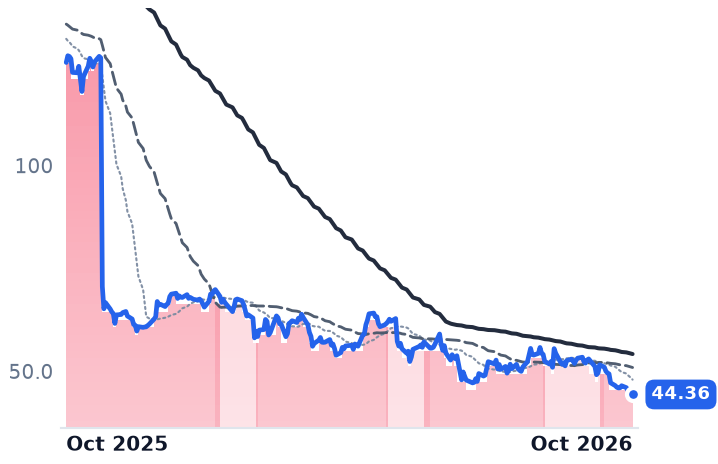
Fiserv's shares made fresh lows last week while the activist holding just under 1% of the company argued that the turnaround plan is half the size it should be. Jana Partners pressed on 28 September for the Project Elevate savings goal to more than double from $500m by 2029, and for Palantir software to retire accumulated technology debt, with the raised target announced alongside third-quarter results on 28 October.

The business behind that demand is shrinking. June-quarter revenue fell 4.1% and the operating margin came in at 19.2% against 30.7% a year earlier, a fourth straight quarter of deceleration. The faster-eroding half is the bank-software annuity, where organic revenue fell 8%, against a 1% decline in merchant acquiring.

At 6.1x forward earnings and 0.88x book, the price already assumes the meter keeps slipping. A cost number does not turn it.

FISVFISJKHYBRSPYMerchant AcquiringCore Banking SoftwarePayment Processing MarginsShareholder ActivismLegacy Tech Modernization
TickerCompanySegmentTrend · 13mo30D1Y
The subject · what this brief is about
FISVFiservFinancial Services Technology🔴 Cont. Bear−13.3%−64.5%
FISFidelity National Information ServicesFinancial Services Technology🔴 Cont. Bear−18.1%−51.0%
JKHYJack Henry & AssociatesFinancial Services Technology🌱 Emerging Bull−11.5%−2.8%
Compared against · context, not the story
BRBroadridge Financial SolutionsFinancial Services Technology🌱 Emerging Bull−6.5%−32.6%
SPYState Street SPDR S&P 500 ETF TrustAsset Management🟢 Cont. Bull+0.3%+15.2%

12-month price & trend

FISV
Fiserv
44.36
−1.02 (−2.25%)
vs. prior close
Price20d50d150d
FISV 12-month price
Financial Services Technology
FIS
Fidelity National Information Services
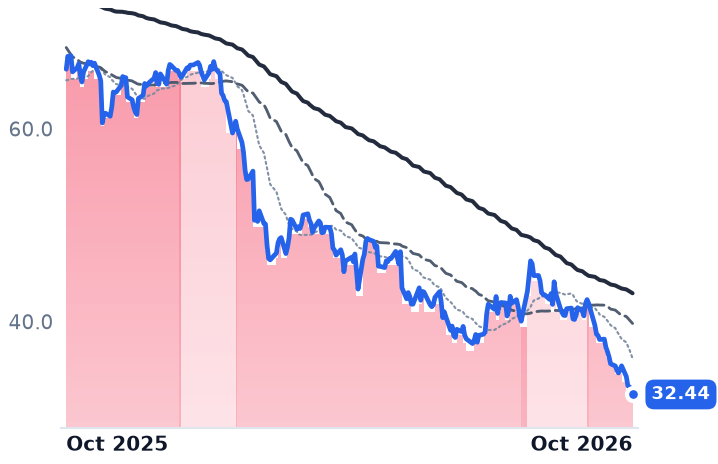
32.44
−0.66 (−1.99%)
vs. prior close
Price20d50d150d
FIS 12-month price
Financial Services Technology
JKHY
Jack Henry & Associates
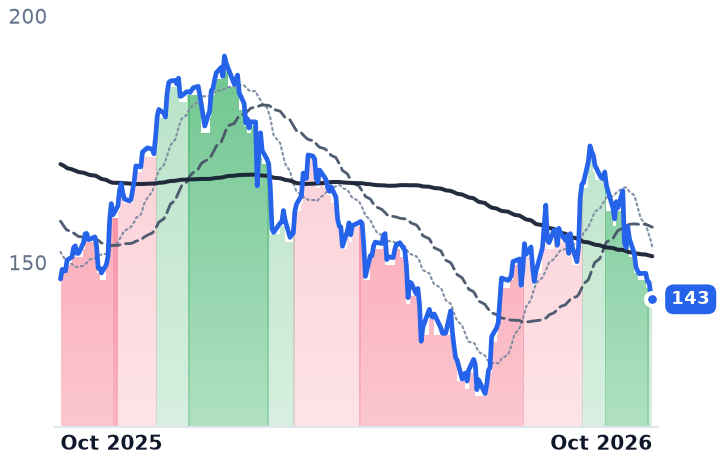
143
−1.30 (−0.90%)
vs. prior close
Price20d50d150d
JKHY 12-month price
Financial Services Technology
TickerMkt capP/EP/E fwdP/SP/S fwdP/GPP/GP fwdEV/EBITDAFCF yld
FISV$23.7B8.5x6.1x1.1x1.2x2.4x2.6x7.4x16.6%
FIS$16.8B5.0x5.2x1.4x1.2x3.6x3.3x6.0x16.1%
JKHY$10.1B20.4x19.3x4.0x3.8x9.2x8.6x11.8x6.9%
BR
Broadridge Financial Solutions
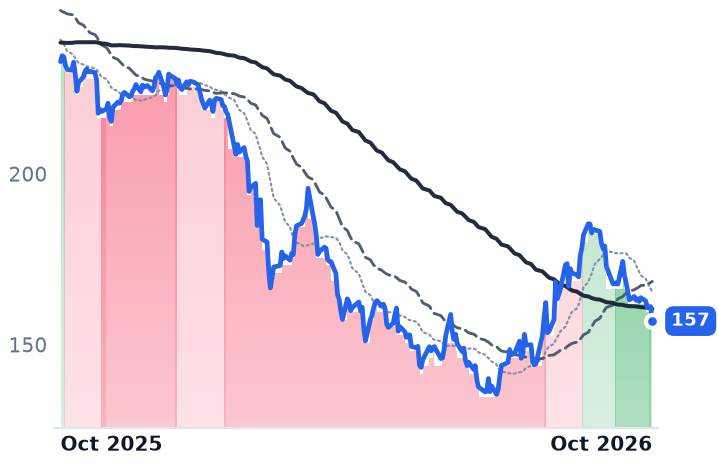
157
−4.22 (−2.62%)
vs. prior close
Price20d50d150d
BR 12-month price
Financial Services Technology
SPY
State Street SPDR S&P 500 ETF Trust
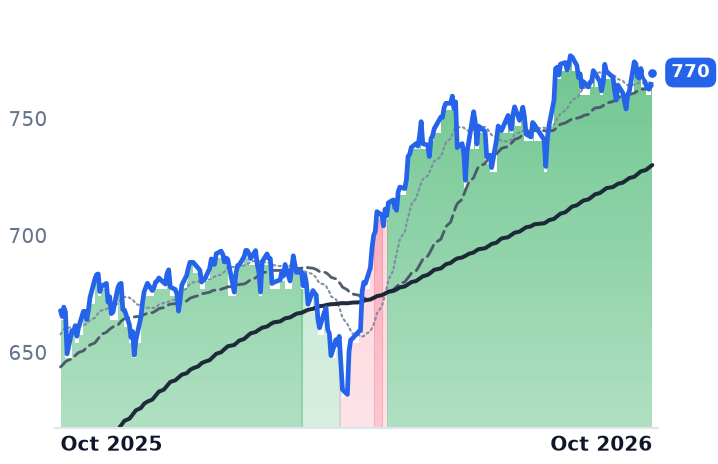
770
+5.65 (+0.74%)
vs. prior close
Price20d50d150d
SPY 12-month price
Asset Management
TickerMkt capP/EP/E fwdP/SP/S fwdP/GPP/GP fwdEV/EBITDAFCF yld
BR$19.3B17.2x15.8x2.6x2.4x8.1x7.7x11.8x6.8%
SPY$773.0B————————

Consensus projections

TickerFY2026EFY2027EFY2028E
FISVRevenue−1.3%+3.4%+3.5%
EPS−15.3%+9.7%+13.2%
FISRevenue+28.8%+4.4%+3.4%
EPS+7.4%+8.0%+10.3%
JKHYRevenue+7.0%+6.4%+7.0%
EPS+12.6%+7.7%+9.5%
BRRevenue+8.0%+5.8%+4.8%
EPS+12.5%+10.5%+9.5%

Forward fiscal years only. Blank means no analyst coverage for that year.

Fiserv's turnaround plan now has an activist critic who thinks it is half the size it should be. On 28 September, Jana Partners pressed the card-acceptance and bank-processing company to more than double the savings target of its Project Elevate program, $500m by 2029, to $1.25bn, and to adopt Palantir software to simplify its technology estate, retire accumulated technology debt and cut spending on legacy vendors. Jana wants the bigger number announced with third-quarter results, scheduled for 28 October.

Jana owns just under 1% of Fiserv, a position built late in 2025 and added to in the first quarter of 2026. Managing partner Scott Ostfeld has also argued for further asset sales and a board refresh with deeper banking-software and payments expertise, criticizing what the firm calls repeated forecasting errors and guidance cuts. The implicit claim is that Fiserv's problem is cost and execution. The company's own disclosures locate it one line higher.

The meter, not the cost base

Fiserv earns a spread on volume it has to re-win. In the June quarter, Clover gross payment volume rose 9%, 11% excluding a gateway conversion, to $367bn annualized, while reported Clover revenue rose 2%, with weaker hardware and data revenue costing roughly nine points of growth. Value-added services grew 10% and reached 25% of Clover revenue from 24% a year earlier: one point of mix.

The geography that was supposed to flatter the growth line now subtracts from it. Argentina created a 90 basis point headwind to second-quarter adjusted revenue as inflation and rate volatility hit the anticipation business, and cut Clover revenue a further 2%. In the same quarter, Financial Solutions organic revenue fell 8% against Merchant Solutions' 1%: the annuity sold to banks and credit unions is deteriorating faster than the acquiring book.

On 6 August, management reset 2026 guidance to organic revenue of flat to -1%, from 1-3%, and adjusted earnings of $7.20 to $7.40 a share, from $8.00 to $8.30, attributing about two points to delayed contracted revenue and slower enterprise launches, a point to product and hardware, and roughly a point each to Argentina and planned business sales. It was the second reset in ten months. First-half free cash flow was $1.36bn against $1.54bn a year earlier, while acquisition-related intangible amortization still ran at $0.94 a share.

Chief executive Takis Georgakopoulos has told investors the noise ends soon. At the Goldman Sachs Communacopia + Technology Conference on 10 September he said the fourth quarter would be the first "clean" quarter in years, and of the gap between more than $5bn of trailing free cash flow and the market value then attached to it: "very hard to think of something that's more attractive." The shares rose 5.4% the next day, then kept falling, closing at a fresh 52-week low on 2 October.

The healthy neighbors fell too

The decline is not Fiserv's alone, which is the awkward part for a cost-cutting thesis.

FIS, levered to card issuance since it bought Global Payments' Issuer Solutions business and sold its remaining Worldpay stake, lost 22.5% over the same thirty days and also closed at a 52-week low, despite Banking revenue up 6% in the quarter excluding the acquisition, recurring sales up 14%, and consensus 2026 earnings revised up 7.4%. It trades at 5.2x forward earnings against roughly 11.1x a year ago.
Jack Henry, which sells core processing to community banks and logged a record 58 competitive core wins in the year to June, fell 14.7%. Its uptrend broke at the 15 September Investor Day, when fiscal 2027 operating margin was guided to 24.1-24.3% as cybersecurity, infrastructure and artificial-intelligence spending absorbed the leverage. At 19.3x forward earnings against 21.7x a year ago, it is the dearest of the three. Broadridge, in proxy voting and post-trade processing, fell 11.9%.
Two sector mechanisms are doing that work. The International Monetary Fund finds US stablecoin legislation cut the market value of listed incumbent payment firms by 18%, roughly $300bn, because stablecoin settlement lets payers bypass the card rails these companies take a spread on. And on 22 September, two weeks after Meta launched its Muse agent, banks, insurers and travel sites sold off on the risk that autonomous agents dissolve the consumer inertia those businesses monetize.

What $750m would and would not fix

Fiserv's own de-rating is earned: the forward multiple has halved to about 6.1x while estimates came down roughly 28%, and consensus now has 2026 revenue shrinking 1.3% to $19.55bn with adjusted earnings down 15.3%. Price and expectations finally agree on direction. The extra $750m Jana wants amounts, on that consensus revenue base, to under 4% of sales by the arithmetic here, which is an answer to the margin question in a year when the revenue question is the live one. Against that, the shares sit at 0.88x book with a 16.6% trailing free-cash-flow yield, which is what makes the marginal selling look less like judgment than momentum.

The three companies together serve more than 70% of banks surveyed by the Kansas City Fed and 90% of US banks with under $1bn of revenue. That concentration was the asset; it is now the renewal table everyone is pricing at once.

A year ago this month, Fiserv's first guidance reset took 44% out of the stock in a single session. The third-quarter call falls on the anniversary, with an activist asking the company to put a bigger number on the one line it still controls.

Williams Is Spending Past Its Cash Flow on Pipelines That Start Up in 2027 and 2029

Hypothesis Opus 5 · Research Opus 5 · Writing Opus 5 · Prompt v1.7

The strongest set of quarterly numbers on the gas-pipeline shelf belongs to the member spending beyond the cash it generates. Williams' June-quarter operating income rose 33.3% and its operating margin reached 38.7%, yet its trailing free-cash-flow yield is minus 0.25% and the shares carry 15.7x trailing earnings before interest, taxes, depreciation and amortization against Kinder Morgan's 12.6x.

The group's September fall splits by cause. Williams and DT Midstream are priced on cash dated 2027 to 2030, discounted at a long bond paying more than either dividend; Kinder Morgan's accounts contradict its own decline outright; and the Appalachian drillers upstream were hit by a $3 gas price that firm contracts keep out of pipeline revenue.

WMBKMIDTMEQTETTRPRRCEXENatural Gas MidstreamPipeline Capex BacklogData Center Gas DemandLNG Export BuildoutLong-Bond Discount RatesAppalachian Gas Producers
TickerCompanySegmentTrend · 13mo30D1Y
The subject · what this brief is about
WMBThe Williams CompaniesNatural Gas Pipelines & Transmission🟢 Cont. Bull−6.0%+12.7%
KMIKinder MorganNatural Gas Pipelines & Transmission⚠️ Emerging Bear−2.4%+13.6%
DTMDT MidstreamNatural Gas Pipelines & Transmission⚠️ Emerging Bear−7.3%+7.1%
Compared against · context, not the story
EQTEQTAppalachian Shale Gas🔴 Cont. Bear−9.5%−11.8%
ETEnergy TransferNatural Gas Pipelines & Transmission🟢 Cont. Bull−4.6%+27.7%
TRPTC EnergyNatural Gas Pipelines & Transmission⚠️ Emerging Bear−6.4%+9.5%
RRCRange ResourcesAppalachian Shale Gas⚠️ Emerging Bear−9.5%−1.0%
EXEExpand EnergyAppalachian Shale Gas🔴 Cont. Bear−13.4%−19.3%

12-month price & trend

WMB
The Williams Companies
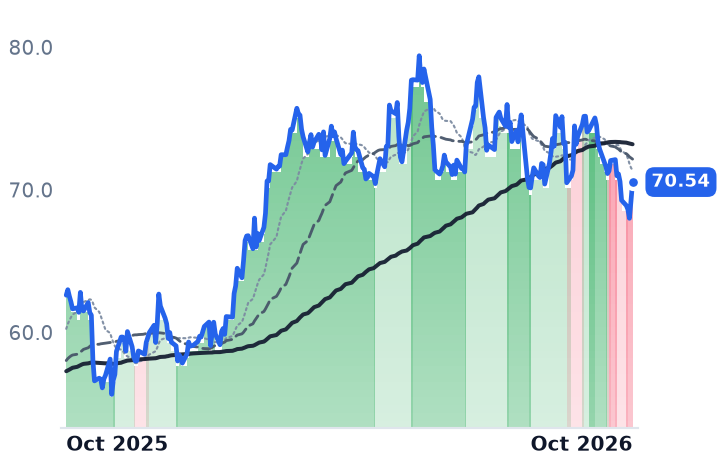
70.54
+1.32 (+1.91%)
vs. prior close
Price20d50d150d
WMB 12-month price
Natural Gas Pipelines & Transmission
KMI
Kinder Morgan
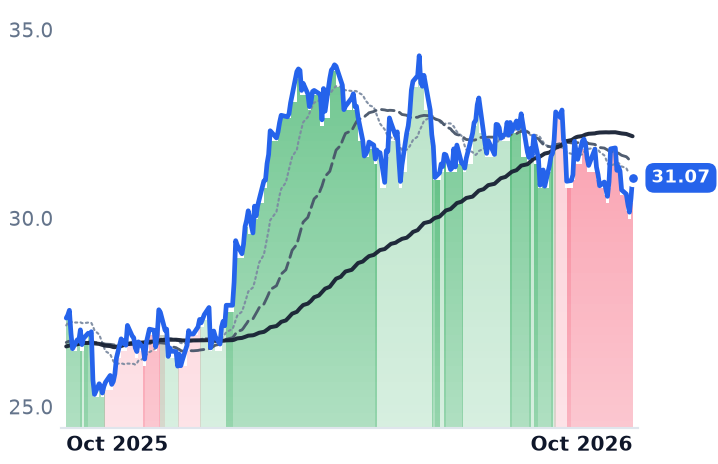
31.07
+0.54 (+1.77%)
vs. prior close
Price20d50d150d
KMI 12-month price
Natural Gas Pipelines & Transmission
DTM
DT Midstream
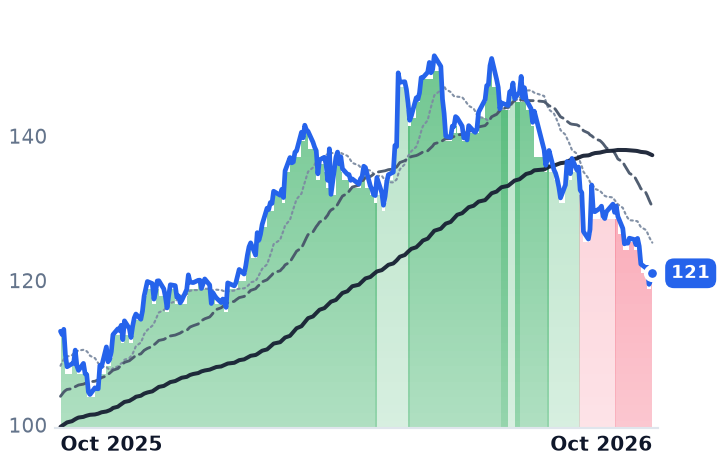
121
+0.92 (+0.77%)
vs. prior close
Price20d50d150d
DTM 12-month price
Natural Gas Pipelines & Transmission
TickerMkt capP/EP/E fwdP/SP/S fwdP/GPP/GP fwdEV/EBITDAFCF yld
WMB$86.3B28.0x28.7x7.1x7.0x9.6x9.5x15.7x-0.2%
KMI$69.2B19.9x20.2x3.9x3.8x7.0x6.9x12.6x5.6%
DTM$12.3B26.3x25.6x9.4x9.2x14.9x14.5x14.3x3.9%
EQT
EQT
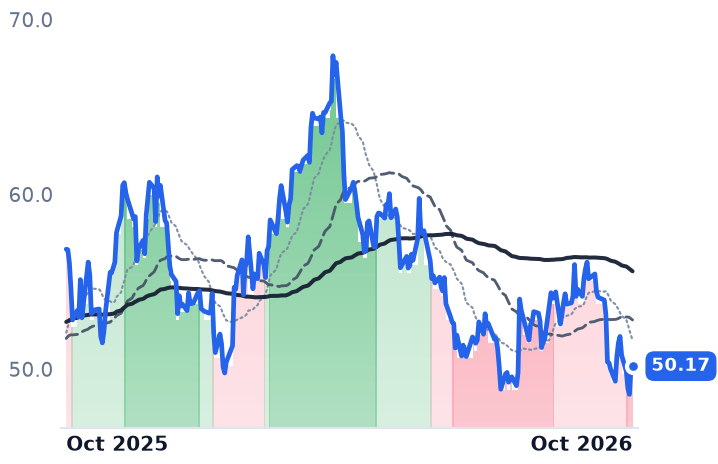
50.17
+0.08 (+0.16%)
vs. prior close
Price20d50d150d
EQT 12-month price
Appalachian Shale Gas
ET
Energy Transfer
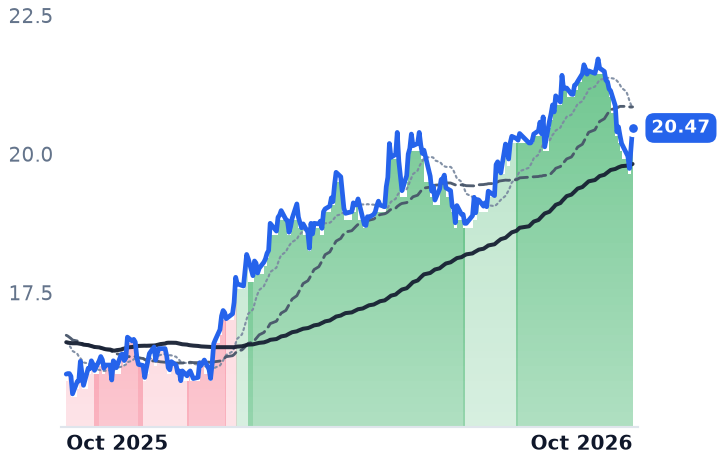
20.47
+0.37 (+1.84%)
vs. prior close
Price20d50d150d
ET 12-month price
Natural Gas Pipelines & Transmission
TRP
TC Energy
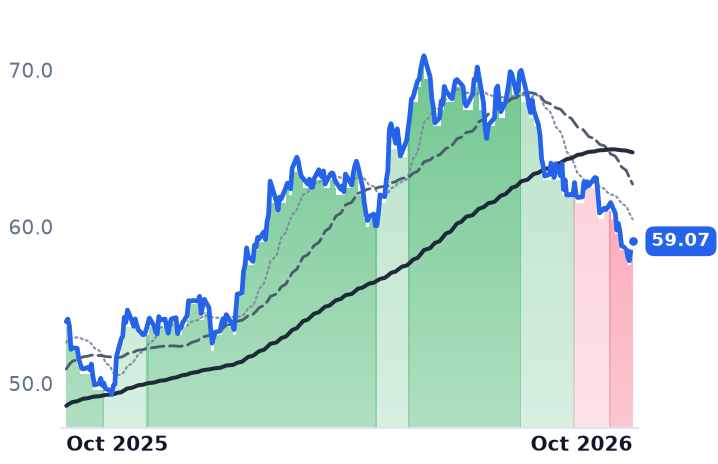
59.07
+0.45 (+0.77%)
vs. prior close
Price20d50d150d
TRP 12-month price
Natural Gas Pipelines & Transmission
TickerMkt capP/EP/E fwdP/SP/S fwdP/GPP/GP fwdEV/EBITDAFCF yld
EQT$31.4B11.0x12.4x3.4x3.4x4.9x5.0x6.0x12.0%
ET$72.1B13.0x13.4x0.7x0.7x2.9x2.7x9.7x7.2%
TRP$66.2B26.6x16.9x5.8x4.1x11.2x8.0x13.8x4.4%
RRC
Range Resources
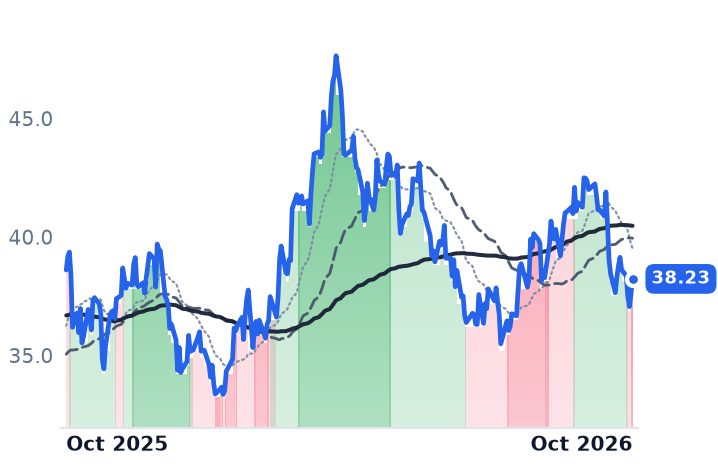
38.23
+0.63 (+1.68%)
vs. prior close
Price20d50d150d
RRC 12-month price
Appalachian Shale Gas
EXE
Expand Energy
85.52
−0.44 (−0.51%)
vs. prior close
Price20d50d150d
EXE 12-month price
Appalachian Shale Gas
TickerMkt capP/EP/E fwdP/SP/S fwdP/GPP/GP fwdEV/EBITDAFCF yld
RRC$8.9B10.5x9.3x2.7x2.5x5.6x5.3x7.0x13.1%
EXE$19.4B7.2x9.8x1.5x1.5x2.3x2.3x3.4x13.1%

Consensus projections

TickerFY2026EFY2027EFY2028E
WMBRevenue+8.4%+14.4%+15.5%
EPS+15.7%+6.3%+16.8%
KMIRevenue+8.6%+1.6%+5.1%
EPS+19.8%−0.0%+9.0%
DTMRevenue+7.9%+4.6%+9.9%
EPS+7.7%+6.0%+11.9%
EQTRevenue+9.9%−0.8%+11.9%
EPS+37.2%−5.4%+40.3%
ETRevenue+35.3%+1.9%+4.9%
EPS+16.7%+3.6%+7.4%
TRPRevenue+6.7%+4.4%+5.3%
EPS+7.3%+5.4%+6.2%
RRCRevenue+17.9%+2.5%+8.0%
EPS+41.2%−4.0%+20.2%
EXERevenue+14.7%−4.1%+6.9%
EPS+43.3%−1.6%+24.1%

Forward fiscal years only. Blank means no analyst coverage for that year.

Williams Companies, which owns the Transco trunk line carrying gas from the Gulf Coast to the eastern seaboard, completed its roughly $5.5bn purchase of Momentum Midstream on 3 September, adding more than 4,000 miles of gathering pipe, 6 billion cubic feet a day of Haynesville gathering capacity and three take-or-pay pipelines. The growth project the deal was built around, a $1.5bn Transco-corridor expansion called Delta Access with 2.25 Bcf/d of initial capacity, is expected online in the first quarter of 2029.

Pipelines have been owned as the direct claim on gas demand from data centers and liquefied natural gas export terminals, and the reported numbers support that claim: Williams' June-quarter operating income rose 33.3%. What changed in September was the price of waiting for the rest. Capital leaves the building in 2026 and the revenue arrives from 2027 onward, discounted at a long bond that kept making new highs in the meantime. The 30-year Treasury yield climbed to 5.61% by 1 October, its highest since 2002; Williams' $2.10 annual dividend pays 3.0% at the current share price.

What the $16bn backlog is dated for

Williams' expansion book runs to roughly $16bn representing 14 Bcf/d. Southeast Supply Enhancement, at 1,597 million cubic feet a day, is scheduled for the third quarter of 2027; Northeast Supply Enhancement, at 400 MMcf/d, for the fourth quarter of 2027; Power Express, at 750 MMcf/d, for the third quarter of 2030. The last large piece to actually enter service was Louisiana Energy Gateway, 1.8 Bcf/d, in July 2025.

The pattern repeats at Kinder Morgan, which moves gas across roughly 83,000 miles of pipeline. Its sanctioned backlog stood at $9.6bn at the end of the June quarter, falling $500m only because more than $650m of projects started up; the remaining $8.5bn is expected to earn back its cost at about 5.6 times first-full-year project cash earnings. The $1.7bn Mississippi Crossing line, 208 miles carrying up to 2.1 Bcf/d into Alabama, completed federal permitting on 8 September with service as early as the second quarter of 2028.

Not a dollar of either book shows up in this year's revenue line.

The best quarter carries the thinnest cash flow

Williams reported the strongest June quarter of the three: revenue up 10.2% to $3.053bn, operating income up 33.3% to $1.182bn, and an operating margin of 38.7% against 32.0% a year earlier. It is also the only one of the three outspending its own cash, at 15.7x trailing EV/EBITDA against DT Midstream's 14.3x, with a trailing free-cash-flow yield of minus 0.25%. On earnings it has already come down, to 28.0x trailing from 34.1x in early May, with the market value barely lower.

Kinder Morgan is the mirror. Its operating income grew faster than revenue in three of the last four quarters, up 17.8% in the June quarter on 10.8% revenue growth, with margin widening to 30.1% from 28.3%. It trades at 12.6x EV/EBITDA, the cheapest of the three, and carries a 5.6% trailing free-cash-flow yield, the highest; its trailing earnings multiple is 19.9x against 21.7x in May.

DT Midstream's de-rating is the one its own results explain. Revenue growth halved from 27.3% in the December quarter to 11.0% in June, operating-income growth fell from 38.1% to 11.6%, and consensus has revenue up 4.6% in 2027 before step-ups of 19.1% in 2029 and 30.7% in 2030, the cash-flow shape a rising long bond punishes hardest. At 26.3x trailing earnings it has fallen from 32.5x in May, and its forward multiple of 25.6x prices almost no expansion. Jefferies cut its target to $145 from $155, Scotiabank to $168 from $176 and Mizuho to $147 from $153, all without downgrading.

Why the drillers' bad quarter stays upstream

The gas price has been punishing. Henry Hub settled at $3.03 per million British thermal units on 30 September after two months under $3, with US dry gas output setting a daily record on 17 September and the Energy Information Administration expecting a record 3,985 Bcf in storage at end-October; summer prices averaged 6% below last summer's. EQT, which drills Appalachian gas, reported June-quarter revenue down 29.2% to $1.81bn and an operating margin of 25.1% against 44.3%.

Almost none of that reaches the pipelines. About 92% of DT Midstream's 2025 Pipeline revenue came from firm service contracts, structured as fixed demand charges or minimum volume commitments that pay regardless of what flows. At Kinder Morgan the volume-exposed leg grew: gathering volumes rose 26% year over year, led by a 54% increase in the Haynesville, and management said its largest customers are hedged, leaving most of those volumes price-insensitive. DT Midstream's chief executive, David Slater, told investors on 30 July that "our entire asset footprint is kind of lit up like a Christmas tree right now, and we've never seen that before while we've owned these assets."

The price action separates on the same line. Over the 30 days to 2 October the five large pipeline names fell about 5% on average, Williams 6.2% and Kinder Morgan least at 2.8%, while Expand Energy fell 13.9%, EQT 10.0% and Range Resources 10.0%. Twelve-month returns for the pipelines remain positive, Williams up 11.8%; DT Midstream is the weakest over three months at minus 16.3%.

So the two legs fell together for unrelated reasons, and they do not trade on the same plane: EQT changes hands at 6.0x EV/EBITDA with a 12.0% free-cash-flow yield. For the drillers the cause is the commodity. For the pipelines the likelier reading is the discount rate, since their reported results got better and what reprices when the long bond makes new highs is contracted cash that has not started arriving. On that reading DT Midstream's fall is the one the business earned, through halved growth; Williams' premium rests on in-service dates in 2027, 2029 and 2030; and Kinder Morgan's decline is the one its accounts contradict.

The demand behind those projects is not in question. Permits are issued, capacity is subscribed, the pipe is being laid. What the last month repriced is what a dollar arriving in 2029 is worth to a buyer who can collect more from a long Treasury bond in the meantime than the pipeline pays him to wait.

StandardAero Stopped Rebilling No-Margin Parts, and Its Revenue Growth Fell to 4.6%

Hypothesis Opus 5 · Research Opus 5 · Writing Opus 5 · Prompt v1.7

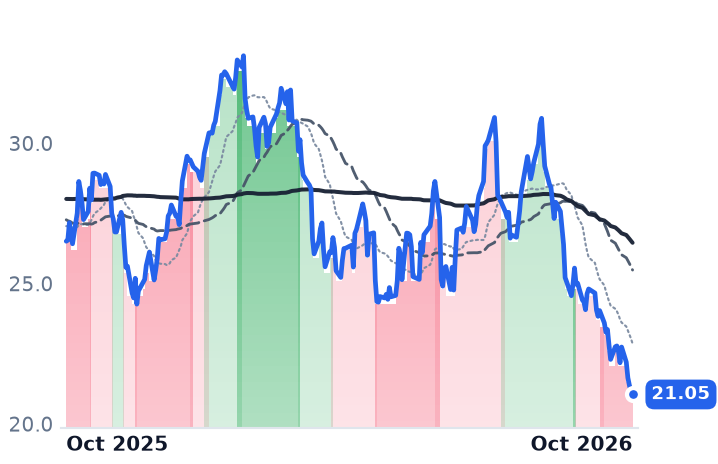
Decelerating revenue across jet-engine suppliers has been read as the aftermarket cycle rolling over. At StandardAero the deceleration was self-inflicted: restructured contracts eliminated material that the company buys for customers and rebills at little or no markup, so June-quarter revenue grew 4.6% against 20.4% a year earlier while adjusted margin set a company record at 14.4%.

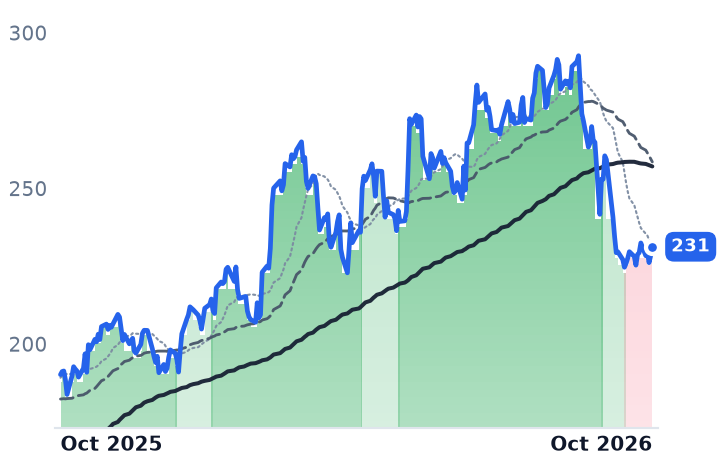
Howmet, which casts and forges the airfoils inside those engines, shows the same accounting from the other side. Metal pass-through did dilute margin — in heavy-truck wheels, by 360 basis points, while Engine Products margin rose to 37.7% from 33.0% and spares revenue grew 37%.

Both businesses improved and both stocks fell with the complex. The difference is the starting price: Howmet still trades at 43.3x forward earnings, StandardAero at 13.6x.

SAROHWMGERTXTDGHEIBAWWDCWMOG-AJet Engine AftermarketMRO Shop VisitsTurbine Airfoil CastingsNarrowbody Build RatesPass-Through Revenue AccountingEngine Spares Demand
TickerCompanySegmentTrend · 13mo30D1Y
The subject · what this brief is about
SAROStandardAeroEngines & Propulsion🔴 Cont. Bear−14.7%−20.6%
HWMHowmet AerospaceEngines & Propulsion🟢 Cont. Bull−4.0%+21.6%
Compared against · context, not the story
GEGE AerospaceLarge Diversified Primes🟢 Cont. Bull−8.7%+4.1%
RTXRTXLarge Diversified Primes🟢 Cont. Bull−7.2%+10.2%
TDGTransDigm Group IncorporatedAdvanced Materials & Components🔴 Cont. Bear−5.2%−15.6%
HEIHEICOAvionics & Electronic Systems🟢 Cont. Bull−5.0%−6.0%
BAThe BoeingLarge Diversified Primes🔴 Cont. Bear−9.1%−11.9%
WWDWoodwardFlight Controls & Actuation⚠️ Emerging Bear−2.8%+28.6%
CWCurtiss-WrightFlight Controls & Actuation⚠️ Emerging Bear−5.3%−1.4%
MOG-AMoogFlight Controls & Actuation🟢 Cont. Bull+4.9%+86.6%

12-month price & trend

SARO
StandardAero
21.05
−0.12 (−0.57%)
vs. prior close
Price20d50d150d
SARO 12-month price
Engines & Propulsion
HWM
Howmet Aerospace
231
+2.89 (+1.27%)
vs. prior close
Price20d50d150d
HWM 12-month price
Engines & Propulsion
GE
GE Aerospace
310
−2.83 (−0.91%)
vs. prior close
Price20d50d150d
GE 12-month price
Large Diversified Primes
TickerMkt capP/EP/E fwdP/SP/S fwdP/GPP/GP fwdEV/EBITDAFCF yld
SARO$7.0B21.3x13.6x1.1x1.1x7.5x7.4x11.2x3.1%
HWM$92.5B49.5x43.3x10.1x9.2x29.5x26.6x35.0x1.7%
GE$321.2B36.3x39.1x6.3x6.4x17.9x18.0x27.1x2.6%
RTX
RTX
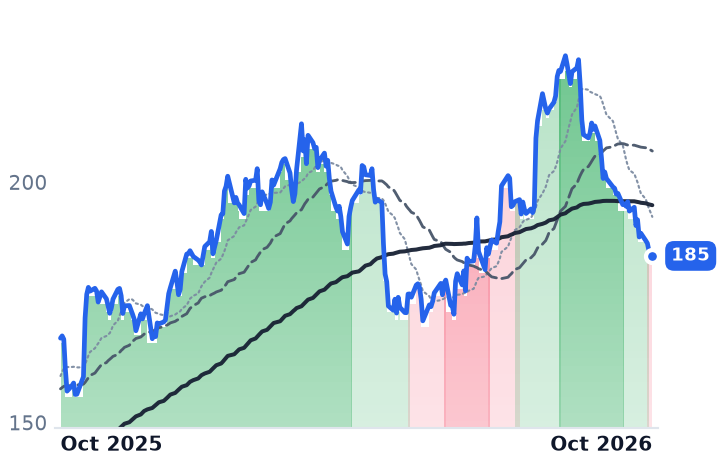
185
−0.33 (−0.18%)
vs. prior close
Price20d50d150d
RTX 12-month price
Large Diversified Primes
TDG
TransDigm Group Incorporated
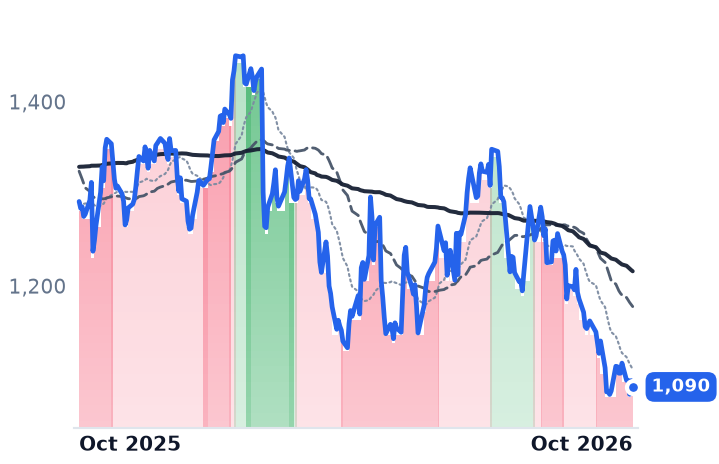
1,090
−6.86 (−0.63%)
vs. prior close
Price20d50d150d
TDG 12-month price
Advanced Materials & Components
HEI
HEICO
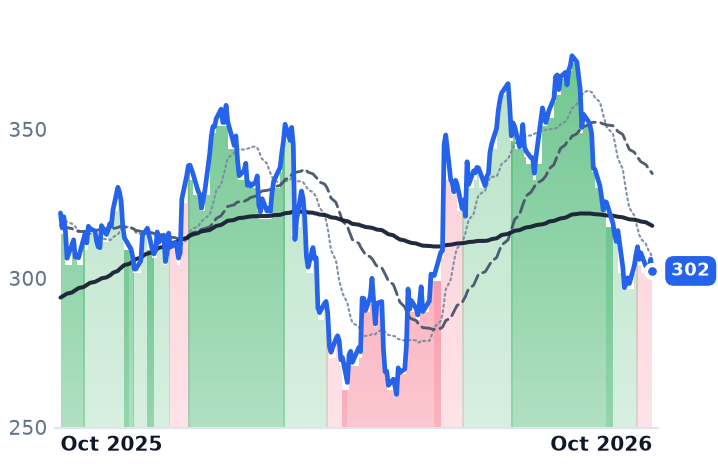
302
−3.94 (−1.29%)
vs. prior close
Price20d50d150d
HEI 12-month price
Avionics & Electronic Systems
TickerMkt capP/EP/E fwdP/SP/S fwdP/GPP/GP fwdEV/EBITDAFCF yld
RTX$248.9B32.1x25.5x2.7x2.6x13.1x12.7x17.4x4.8%
TDG$64.1B34.7x27.9x6.4x6.1x10.7x10.2x19.0x3.0%
HEI$44.0B52.0x50.3x8.5x8.2x21.1x20.2x31.6x2.3%
BA
The Boeing
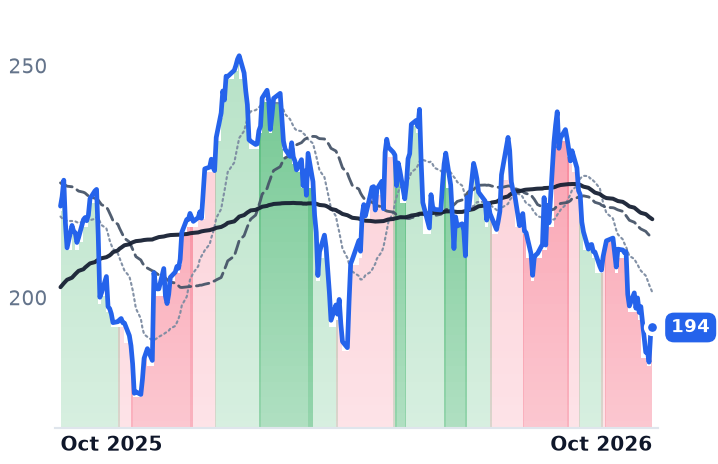
194
+1.28 (+0.67%)
vs. prior close
Price20d50d150d
BA 12-month price
Large Diversified Primes
WWD
Woodward
332
−4.57 (−1.36%)
vs. prior close
Price20d50d150d
WWD 12-month price
Flight Controls & Actuation
CW
Curtiss-Wright
546
+0.70 (+0.13%)
vs. prior close
Price20d50d150d
CW 12-month price
Flight Controls & Actuation
TickerMkt capP/EP/E fwdP/SP/S fwdP/GPP/GP fwdEV/EBITDAFCF yld
BA$173.8B79.6x—1.9x1.8x39.2x37.0x29.7x-0.6%
WWD$20.8B40.6x37.5x5.2x4.8x18.3x17.1x28.5x1.9%
CW$26.3B51.5x46.9x7.3x7.0x19.6x18.8x36.4x2.2%
MOG-A
Moog
393
+2.54 (+0.65%)
vs. prior close
Price20d50d150d
MOG-A 12-month price
Flight Controls & Actuation
TickerMkt capP/EP/E fwdP/SP/S fwdP/GPP/GP fwdEV/EBITDAFCF yld
MOG-A$9.6B33.8x29.1x2.3x2.2x8.6x8.3x18.6x2.1%

Consensus projections

TickerFY2026EFY2027EFY2028E
SARORevenue+7.0%+9.9%+9.4%
EPS+84.6%+15.3%+17.4%
HWMRevenue+23.2%+13.8%+11.7%
EPS+44.1%+22.1%+18.6%
GERevenue+20.6%+10.9%+9.0%
EPS+26.6%+14.8%+13.8%
RTXRevenue+10.6%+7.6%+7.3%
EPS+16.8%+9.2%+10.5%
TDGRevenue+19.4%+10.1%+7.6%
EPS+12.2%+17.7%+15.2%
HEIRevenue+21.1%+11.1%+8.7%
EPS+31.4%+13.5%+13.1%
BARevenue+10.8%+14.6%+9.6%
EPS−98.6%−3232.7%+86.2%
WWDRevenue+22.4%+8.6%+10.0%
EPS+39.2%+14.6%+17.6%
CWRevenue+9.6%+8.0%+8.1%
EPS+15.6%+12.0%+12.1%
MOG-ARevenue+13.9%+6.5%+6.0%
EPS+26.1%+10.1%+7.5%

Forward fiscal years only. Blank means no analyst coverage for that year.

StandardAero, which overhauls jet engines under licence from the engine makers for airline, military and business-jet operators, spent this year taking revenue out of its own contracts. Restructured agreements eliminated material pass-through: parts the company buys for a customer's engine and rebills at little or no markup. June-quarter revenue rose 4.6%, against 20.4% a year earlier. Profitability moved the other way, to a record adjusted margin before interest, taxes, depreciation and amortization of 14.4%, up a point.

The reason that decomposition matters is that the market has spent five weeks treating slowing top lines across engines and propulsion as proof the aftermarket cycle is peaking. In early September, Melius Research downgraded GE Aerospace, HEICO, Honeywell Aerospace Technologies, TransDigm and Woodward to Hold, warning that several years of robust aftermarket growth may be ending. In a trade where a large slab of a reported dollar is metal and parts bought on the customer's behalf, revenue growth is a poor instrument for measuring demand.

What is actually inside a shop-visit dollar

StandardAero's full-year 2025 gross margin was 14.8% against Howmet's 30.7% — roughly a fifth, because so much of an overhaul invoice is components rather than value added. Strip the worst of that out and the line shrinks. Engine Services revenue rose 4.0% to $1.41bn as growth in all three end markets was offset by the pass-through elimination, the company's quarterly filing says, while segment adjusted EBITDA margin rose to 14.5% from 13.2%.

The rest of the quarter reads like a company with more work than throughput. "We achieved profitability in the second quarter while continuing to ramp the program and win new awards. This is an important milestone," chief executive Russell Ford said of the LEAP overhaul programme on the 6 August call. Capacity, not orders, is the limit: a second LEAP test cell in San Antonio needs 12 to 18 months of correlation before it can take engines. Leverage fell to 2.6x adjusted EBITDA from 3.0x, and $100m of stock was repurchased in the first half. The genuine soft spot is military: Component Repair Services grew 9.2% but lost 270 basis points of margin, to 26.3%, on input delays.

Howmet's metal drag sits in truck wheels

Howmet casts and forges turbine airfoils and structural parts for engines, and also makes fasteners, titanium structures and forged aluminium wheels for heavy trucks. Its June quarter put revenue at $2.55bn, up 24% with 21% organic, and Engine Products margin at 37.7% against 33.0%. Spares — the high-value parts sold straight into overhaul shops — rose 37% to about $560m, around 22% of first-half revenue, a greater share than historically.

Aluminium pass-through did dilute a margin, in heavy trucks rather than engines: 360 basis points off Forged Wheels. Engineered Structures, the one segment going backwards, fell 13% to $269m. "More robust build rates for commercial aircraft are supported by record backlogs, while engine spares needs continue to increase," executive chairman and chief executive John Plant said on 6 August. The build rates behind that are rising — Boeing's 737 line moved from 42 to 47 a month with regulatory concurrence in the first half.

The long bond did the work

Over the three months to 2 October the complex fell together: TransDigm down 19.1%, GE Aerospace 18.0%, HEICO 16.5%, Boeing and Howmet 14.5% each, RTX 7.3%, StandardAero worst at 30.1%. Over that span the 10-year Treasury yield reached its highest since 2002 and sat at 5.26% on 5 October after the Federal Reserve's first rate rise in more than three years. On 30 September Wells Fargo's David Strauss cut Howmet to Equal Weight, target $255 from $315, saying further earnings beats "may be more difficult to achieve in a slowing economic growth environment" — an elasticity argument about a slowdown that has not yet appeared in either order book.

The installed base says otherwise so far. GE Aerospace now expects 2,300 to 2,400 CFM56 shop visits a year in both 2026 and 2027, with retirements running at 1.5% to 2% against the 3% to 4% it originally anticipated.

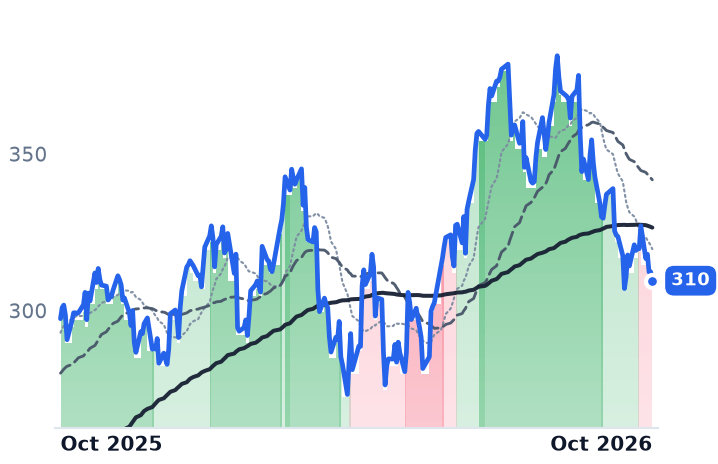
So the results explain almost none of the decline and the starting price explains most of it, unevenly. Howmet's operating record accelerated into the fall and its shares still carry 43.3x forward earnings, dearer than GE Aerospace at 39.1x despite being a component supplier to it; a fifth off that price is arithmetic on the rate, not a verdict on the forge. StandardAero's margin, leverage and cash all improved while its shares reached their low for the year, leaving 13.6x forward against 21.3x trailing — the gap is the 85% earnings increase analysts have pencilled in, and it is the one of the two where the business and the quotation have genuinely parted company.

The question the next print settles is whether removing no-margin parts billing was a one-off reset or the start of a company that reports smaller revenue every year it gets better. Investors have no practice valuing the second kind.

Uranium Royalty Emptied Its Uranium Stockpile to Part-Fund a Soda Ash Royalty Book

Hypothesis Opus 5 · Research Opus 5 · Writing Opus 5 · Prompt v1.7

A company named for uranium royalties now owns no uranium and collects almost none of its revenue from uranium royalties. Uranium Royalty Corp held more than 2.3m pounds of uranium oxide in January, ran the stockpile to zero by selling the remainder at $85.91 a pound, and put the proceeds toward a $1.14bn purchase of trona (soda ash) royalties in Wyoming.

Royalty revenue for the year to April was $0.15m, and four of its 24 uranium properties are production-stage. The company is nonetheless the one uranium-linked share rising while Cameco falls, because its cash arrived inside the quarter, from pounds already sold. The single analyst covering it models revenue down 39% this fiscal year.

UROYCCJBIPBIPCBAMURABWXTLEUUECLTBRDNNUranium Royalties & StreamingSoda Ash & TronaNuclear Fuel CycleMineral Rights & LandSpot Versus Term Pricing
TickerCompanySegmentTrend · 13mo30D1Y
The subject · what this brief is about
UROYUranium RoyaltyUranium🟢 Cont. Bull−18.2%−7.0%
CCJCamecoUranium🔴 Cont. Bear−16.5%+0.0%
BIPBrookfield Infrastructure PartnersInfrastructure & Transport Conglomerates🟢 Cont. Bull−2.0%+7.5%
Compared against · context, not the story
BIPCBrookfield InfrastructureInternational Gas Infrastructure🔴 Cont. Bear−2.3%−15.3%
BAMBrookfield Asset ManagementReal Estate & Infrastructure🌱 Emerging Bull−9.8%−20.9%
URAGlobal X - Uranium ETFAsset Management🔴 Cont. Bear−17.0%−18.6%
BWXTBWX TechnologiesNaval & Shipbuilding🔴 Cont. Bear−15.9%−29.3%
LEUCentrus EnergyUranium🔴 Cont. Bear−24.9%−60.9%
UECUranium EnergyUranium🔴 Cont. Bear−23.3%−28.7%
LTBRLightbridgeElectrical Equipment & Parts🔴 Cont. Bear−19.9%−71.8%
DNNDenison MinesUranium🔴 Cont. Bear−25.0%−8.5%

12-month price & trend

UROY
Uranium Royalty
3.97
+0.09 (+2.32%)
vs. prior close
Price20d50d150d
UROY 12-month price
Uranium
CCJ
Cameco
85.18
−0.51 (−0.60%)
vs. prior close
Price20d50d150d
CCJ 12-month price
Uranium
BIP
Brookfield Infrastructure Partners
36.52
+0.73 (+2.04%)
vs. prior close
Price20d50d150d
BIP 12-month price
Infrastructure & Transport Conglomerates
TickerMkt capP/EP/E fwdP/SP/S fwdP/GPP/GP fwdEV/EBITDAFCF yld
UROY$582.0M10.0x451.6x2.4x8.4x7.9x27.5x3.8x39.5%
CCJ$37.1B148.5x57.8x15.2x10.7x55.2x38.7x61.2x1.0%
BIP$16.8B50.9x64.3x0.7x1.0x2.5x3.7x7.0x-3.4%
BIPC
Brookfield Infrastructure
36.65
+0.73 (+2.03%)
vs. prior close
Price20d50d150d
BIPC 12-month price
International Gas Infrastructure
BAM
Brookfield Asset Management
44.85
+0.29 (+0.65%)
vs. prior close
Price20d50d150d
BAM 12-month price
Real Estate & Infrastructure
URA
Global X - Uranium ETF
39.79
+0.20 (+0.51%)
vs. prior close
Price20d50d150d
URA 12-month price
Asset Management
TickerMkt capP/EP/E fwdP/SP/S fwdP/GPP/GP fwdEV/EBITDAFCF yld
BIPC$4.5Bn/m—1.2x1.2x1.9x1.9x4.3x-4.7%
BAM$75.5B27.2x25.3x14.0x12.2x17.4x15.2x87.0x2.9%
URA$3.9B————————
BWXT
BWX Technologies
135
−1.93 (−1.41%)
vs. prior close
Price20d50d150d
BWXT 12-month price
Naval & Shipbuilding
LEU
Centrus Energy
139
+0.16 (+0.12%)
vs. prior close
Price20d50d150d
LEU 12-month price
Uranium
UEC
Uranium Energy
9.30
−0.06 (−0.64%)
vs. prior close
Price20d50d150d
UEC 12-month price
Uranium
TickerMkt capP/EP/E fwdP/SP/S fwdP/GPP/GP fwdEV/EBITDAFCF yld
BWXT$12.4B34.8x28.4x3.5x3.2x15.9x14.7x24.9x2.6%
LEU$2.6B55.1x54.3x5.5x5.6x23.7x23.9x26.5x-8.5%
UEC$4.6Bn/m—225.6x44.5x533.1x105.1xn/m-2.6%
LTBR
Lightbridge
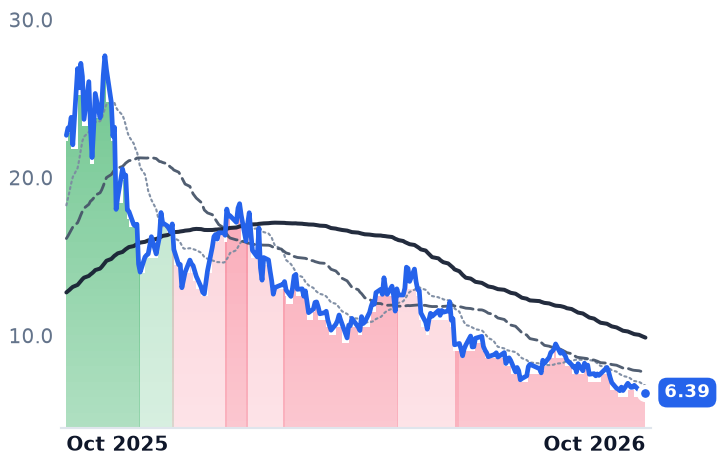
6.39
+0.11 (+1.75%)
vs. prior close
Price20d50d150d
LTBR 12-month price
Electrical Equipment & Parts
DNN
Denison Mines
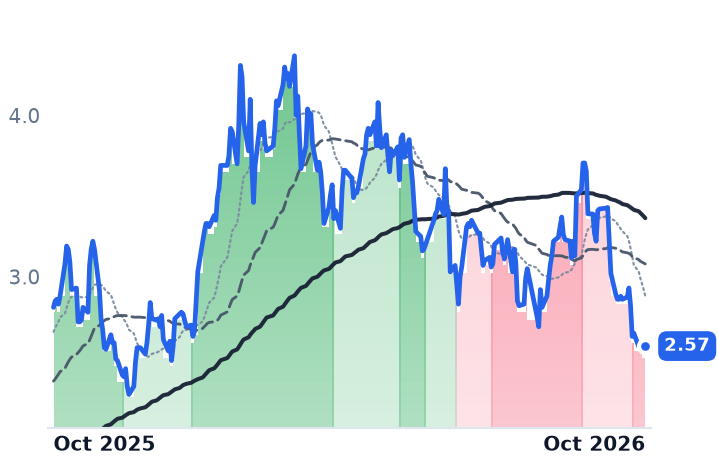
2.57
+0.03 (+1.18%)
vs. prior close
Price20d50d150d
DNN 12-month price
Uranium
TickerMkt capP/EP/E fwdP/SP/S fwdP/GPP/GP fwdEV/EBITDAFCF yld
LTBR$258.0Mn/m—n/m———n/m-6.6%
DNN$2.9Bn/m—988.4x120.1x——n/m-4.1%

Consensus projections

TickerFY2026EFY2027EFY2028E
UROYRevenue+718.5%−38.8%−35.5%
EPS−174.5%−58.8%−90.6%
CCJRevenue+1.4%+12.3%+8.3%
EPS+2.6%+71.9%+24.2%
BIPRevenue+112.0%−44.9%+8.3%
EPS−46.5%+88.2%−29.9%
BIPCRevenue+3.7%+6.4%+6.3%
EPS−120.4%−553.3%+14.2%
BAMRevenue+14.2%+17.1%+11.7%
EPS+14.6%+18.2%+16.8%
BWXTRevenue+20.7%+9.1%+8.7%
EPS+24.1%+10.6%+13.3%
LEURevenue+5.2%−0.8%−10.9%
EPS−43.2%+13.2%−23.3%
UECRevenue−61.4%+301.4%+159.3%
EPS+53.3%−65.1%−345.7%
DNNRevenue+394.2%−27.3%+1699.7%
EPS−30.5%−73.1%−363.0%

Forward fiscal years only. Blank means no analyst coverage for that year.

Uranium Royalty Corp closed its fiscal year holding no uranium. The Vancouver company, with 14 employees and run by chief executive Scott Melbye, owns royalty and streaming interests on deposits from McArthur River in Saskatchewan to Langer Heinrich in Namibia, and it carried 2,329,637 pounds of uranium oxide at the end of January. By 30 April the stockpile was down to 593,255 pounds, held in its account at Cameco's Port Hope and Blind River plants, and those last pounds were sold after year-end at a weighted average of $85.91 a pound.

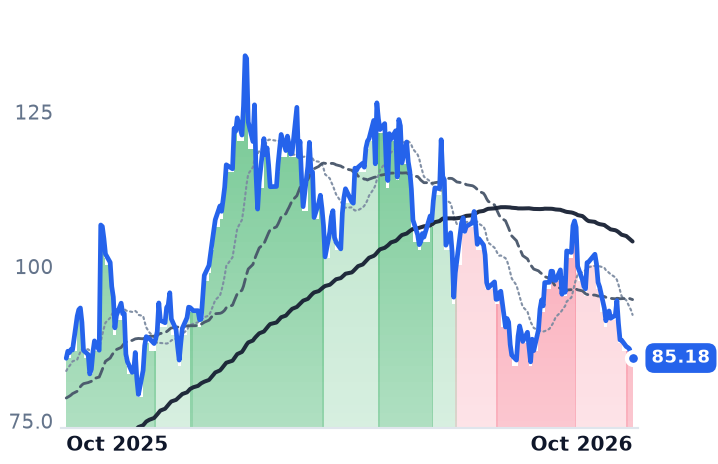
The equity is read as a pure claim on reactor demand, and over the three months to 2 October it was the only uranium-linked share going up: 41.3% higher, while Cameco, the largest listed producer, lost 11.8%. The accounts say that gap is not about reactors at all. It separates a company whose uranium money has already been banked from companies waiting on utilities to sign.

The pounds paid; the royalties barely exist

In the quarter to 31 July, the sale of those 593,255 pounds produced $51.0m of revenue at about $86 a pound against $34.1m of cost of sales: roughly $57 a pound, because the inventory was accumulated years earlier. Net income was $16.25m, up 1,530%, on diluted earnings of $0.10 a share.

The royalty book contributed almost nothing. Uranium royalty revenue for the year to 30 April was $0.15m, against $0.06m the year before, and only four of 24 uranium properties are production-stage; the other 20 are exploration-stage. When a royalty does pay, it may not pay in money. On 14 March, Orano Canada settled the calendar-2025 McArthur River royalty by delivering 13,618 pounds of uranium oxide into storage. The Cigar Lake interest is a sliding-scale 10% to 20% net profits interest on a 3.75% share of production derived from Orano's 40.453% stake in the project, a fraction of a fraction of one mine.

What $1.14bn bought in the Green River Basin

What the pounds funded is not uranium. In July the company acquired about 92% of the Sweetwater entities from funds managed by Orion Resource Partners and from HRG Metals, a subsidiary of the Ontario Teachers' Pension Plan, for roughly $1.14bn: about $330m in cash plus 223,252,749 new shares at a deemed $3.64. Existing shareholders were left with about 41% of the combined company.

Sweetwater is trona (soda ash) royalties and land in Wyoming's Green River Basin, Utah and Colorado, typically an 8% production royalty on net sales from leases over 108,934 acres worked by WE Soda, American Soda, Sisecam and Tata Chemicals. Expansions are expected to lift attributable production capacity by more than 60% with no further capital from the company. On completion, Melbye said the land ownership "encompasses one of the world's largest known trona (soda ash) resources with five currently operating mines", which is "expected to provide steady cash flows to advance the company's uranium aspirations".

The producers are paid in volume, and volume fell

Uranium itself has not weakened. Spot reached $89.54 a pound at the end of August, about 20% higher year on year, and the long-term contract price set a record near $96, above the $95 of 2007. The record formed on thin business: term contracting fell about 15% year on year to just over 38m pounds by 31 August, with utilities balking at the price. Producers are paid in signed volumes, which is why Cameco sits 37% below its $135.24 high and still carries 148x trailing and 57.8x forward earnings.

A cheap multiple on a share count that no longer exists

The trailing figures circulating on Uranium Royalty, just under 10x earnings and 1.3x book, rest on a $582m market value that predates July's issuance. At about 381m shares the company is worth roughly $1.51bn, per third-party counts, which against $55.5m of net income for the year to April works out near 27x. The one analyst publishing estimates models revenue falling 38.8% to $69.2m this fiscal year and 35.5% again next, with earnings per share of less than a cent. The implied forward multiple runs into the hundreds. The shares, at $3.97 on 2 October, are 12.4% below their 17 September peak.

So the strongest share in the fuel chain belongs to the member that stopped holding fuel. The sorting principle is the timing of cash rather than nuclear construction: inventory sold at $86 pays this year, a contract signed for the 2030s does not, and the de-rating that hit Cameco, Centrus and Lightbridge together ranked the complex by how far away the money is.

The uranium left inside Uranium Royalty is mostly exploration ground, one metal-settled royalty and the aspiration in Melbye's sentence. The bills, for now, are paid by soda ash.

Medicare Prior Authorization, Not Weight-Loss Drugs, Shrank Inspire Medical's Revenue

Hypothesis Opus 5 · Research Opus 5 · Writing Opus 5 · Prompt v1.7

A sleep-apnea implant earns nothing until a payer approves it, and since the start of this year that approval has run through an artificial-intelligence screen in six states. Inspire Medical quantified the resulting delays at roughly $40m in its June quarter and $120–130m for the year, against a revenue plan originally set at $1,003–1,013m.

The structural-decline story told about weight-loss drugs was pinned on the wrong gatekeeper. Inspire's management calls those drugs only a modest contributor; its US revenue fell 9.6% in the quarter while international revenue rose 33.6%. ResMed, which earns the other kind of sleep dollar — a flow generator followed by mask and tubing resupply — reports that among 2.5m patients holding both prescriptions, drug holders are about 11% more likely to start airway-pressure therapy. Inspire's shares are up 49% in three months on a shrinking year; ResMed's are down 20.9% over twelve months on 9.9% revenue growth.

INSPRMDSleep Apnea DevicesAI Prior AuthorizationMedicare Reimbursement PolicyGLP-1 Obesity DrugsRespiratory Resupply RevenueNeurostimulation Implants
TickerCompanySegmentTrend · 13mo30D1Y
INSPInspire Medical SystemsSleep & Respiratory Care🌱 Emerging Bull+12.1%−8.4%
RMDResMedSleep & Respiratory Care🌱 Emerging Bull−1.1%−21.6%

12-month price & trend

INSP
Inspire Medical Systems
69.97
−0.81 (−1.14%)
vs. prior close
Price20d50d150d
INSP 12-month price
Sleep & Respiratory Care
RMD
ResMed
219
−2.26 (−1.02%)
vs. prior close
Price20d50d150d
RMD 12-month price
Sleep & Respiratory Care
TickerMkt capP/EP/E fwdP/SP/S fwdP/GPP/GP fwdEV/EBITDAFCF yld
INSP$2.0B15.0x58.6x2.3x2.4x2.6x2.8x23.2x5.8%
RMD$31.8B21.0x18.1x5.6x5.5x9.2x8.9x14.5x9.1%

Consensus projections

TickerFY2026EFY2027EFY2028E
INSPRevenue−6.0%+3.9%+6.5%
EPS−29.0%+23.2%+32.0%
RMDRevenue+10.2%+2.9%+6.4%
EPS+17.0%+8.7%+9.9%

Forward fiscal years only. Blank means no analyst coverage for that year.

Before a sleep-apnea implant generates a dollar, somebody has to authorize it. Since the first of January, in six states, that somebody is a Medicare contractor running an artificial-intelligence screen, and Inspire Medical, whose entire revenue line is one implanted nerve stimulator for moderate-to-severe obstructive sleep apnea, told investors the delays cost it roughly $40m in the June quarter and $120–130m across 2026.

The market has spent two years attributing that kind of shortfall to Eli Lilly. Since tirzepatide, sold as Zepbound, won an obstructive sleep apnea indication in 2024, the read on sleep device companies has been structural decline: a pill replaces a machine. Inspire's own management calls weight-loss drugs only a modest contributor to near-term pressure and names reimbursement disruption as the driver of its guidance revision. The gatekeeper that changed this year works for the Centers for Medicare & Medicaid Services.

Six states, one procedure, and a two-digit modifier

CMS launched its Wasteful and Inappropriate Service Reduction model on 1 January 2026, applying machine-assisted prior authorization inside Original Medicare to a short list of services in Arizona, New Jersey, Ohio, Oklahoma, Texas and Washington through the end of 2031. Hypoglossal nerve stimulation, Inspire's procedure, was the only ear, nose and throat procedure included, which the specialty society attributes to how fast its utilization had been growing. Records obtained in a transparency lawsuit brought by the Electronic Frontier Foundation show initial approval in Texas running at 62%, rising to 84% after human review, against 92% nationally in Medicare Advantage.

A second piece of plumbing hits the surgeon instead of the hospital. Because the newer Inspire V device performs fewer services than its predecessor, two Medicare Administrative Contractors now require a "reduced services" modifier on the professional fee, cutting as much as 30% off a national average payment of $723.

Most contractors do not require it. Inspire's response has been to coach surgeons on their documentation.

The damage is domestic and nowhere else. June-quarter revenue of $200.6m fell 7.6%, with US revenue down 9.6% and international revenue up 33.6%. Initial 2026 guidance of $1,003–1,013m was cut to $825–875m in January and nudged to $835–875m in August. Gross margin did rise 150 basis points to 85.5% on Inspire V mix, but that generation was still in limited release, with 101 patients implanted at 11 US centers. First-half operating income was a loss of about $1.6m, after $51m for all of 2025.

"Our second quarter results reflect the increased discipline and focus we are bringing to the business as we continue to support customers through the evolving coding and reimbursement environment," chief executive Tim Herbert said on 3 August. The restructuring announced alongside it, Project Horizon, carries $20–25m of charges to free roughly $30m of annual investment capacity.

The dollar that needs no second signature

ResMed sells into the same disease on opposite terms: a flow generator through home medical equipment dealers, then masks, cushions and headgear that reorder without a fresh authorization each time. In the June quarter, Americas masks and accessories grew 10% against 8% for sleep devices.

It is also the only one of the two to have measured the drug question. Tracking 2.5m de-identified patients holding both a positive-airway-pressure prescription and a weight-loss prescription, ResMed reports that at 90 days after diagnosis more than 40% of patients have started airway-pressure therapy against under 3% starting a drug, and that dual-prescription patients are roughly 11% more likely to begin therapy and more than 6% more likely to log a resupply event at three years. Chief executive Mick Farrell's summary: "there is no downside of someone having a GLP-1 prescription."

The queue is priced as temporary

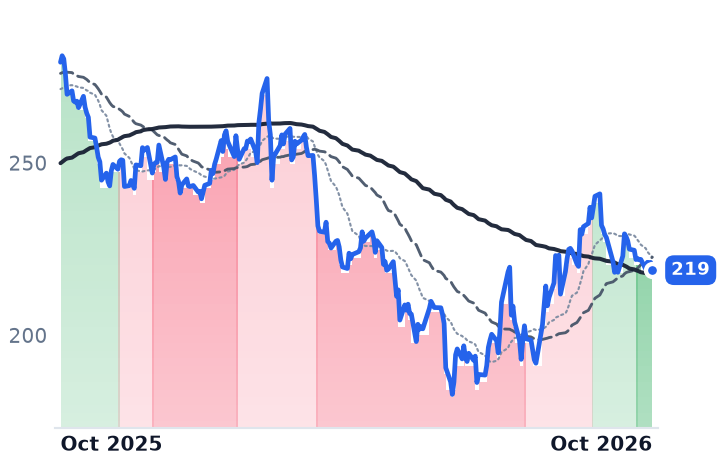
ResMed's fiscal 2026 revenue of $5.65bn grew 9.9%, with gross margin up 180 basis points to 61.2% and operating income up 12.3%. The shares are down 20.9% over twelve months at 18.1x forward earnings against 21.0x trailing, carrying two self-inflicted drags on next year: no new Astral ventilator sales in fiscal 2027, a $75m headwind, and the $490m sale of the MatrixCare software business, which contributed about $220m of revenue.

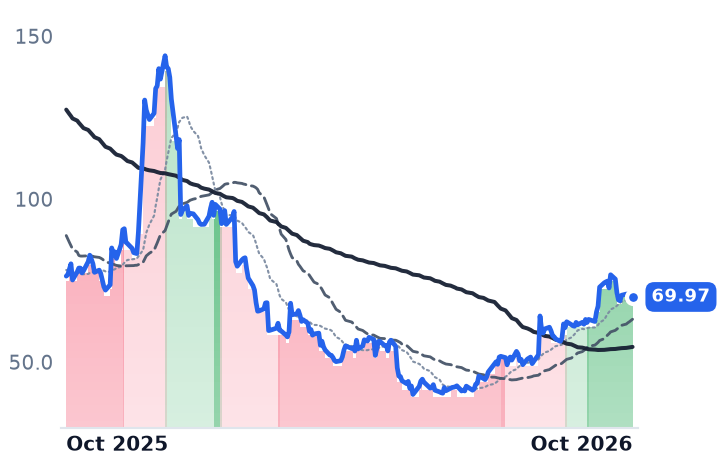
Inspire is the reverse arrangement. Its shares closed at $69.97 on 2 October, up 49% in three months and 75% off their May low, still around half the December 2025 peak, with much of the autumn advance owing to broker target increases: Stifel to $80 on 11 September, RBC Capital to $75 later that month. Consensus has revenue falling 6.0% this year and earnings per share falling 29%, which is how a stock reaches 58.6x forward earnings. Trailing price-to-sales of 2.25x, against roughly 4.5x at the December peak, is the one anchor that still reads cheap.

The two businesses split on who holds the meter. ResMed's revenue per patient compounds through resupply with nobody standing between the reorder and the dollar, and its own tracking data say the diagnostic funnel is widening rather than draining, so its de-rating looks like the market marking down portfolio surgery it can already see in the guide. Inspire's revenue passes through an authorization queue and a surgeon's fee schedule it does not set, and its recovery is being priced on management's stated view that the disruption is temporary and growth resumes in 2027. The reported numbers do not settle that: a sixth of the annual plan is sitting in other people's inboxes.

That queue may not survive its own paperwork. The model faces potential repeal following a Government Accountability Office determination, which would hand Inspire back the largest identified drag on its year without the company selling a single additional device. The biggest variable in a single-product implant company's 2026 belongs to people who have never handled the product.

Everspin Ran Memory Over Compute Express Link Using Another Company's Controller

Hypothesis Opus 5 · Research Opus 5 · Writing Opus 5 · Prompt v1.7

The shelf named for memory disaggregation finally has a working demonstration, and the company that built it owns none of the silicon that makes the link work. Everspin paired its own magnetoresistive memory modules with a controller licensed from Wolley on an AMD programmable chip in late September. No revenue attaches to it.

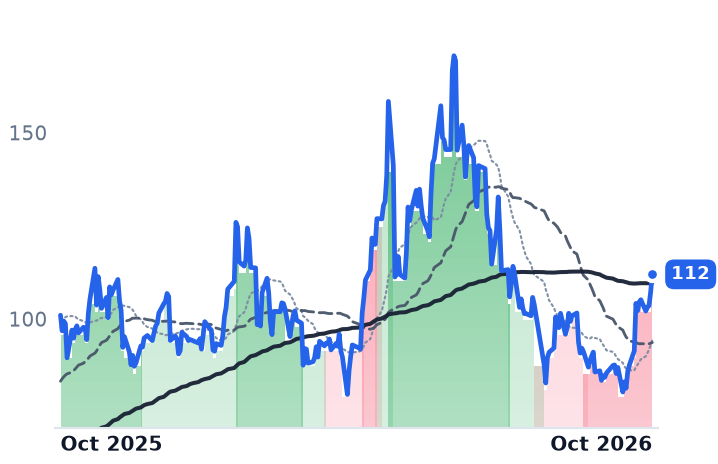
Behind the demonstration the three businesses are accelerating for reasons that have nothing to do with the standard they are filed under. Rambus's June quarter grew 20.4% on a record $99.2m of memory-chipset product sales while it guided royalties down for the September quarter. Everspin's record $18.7m quarter leaned on first recognition from a $40m government subcontract. Microchip ships PCI Express switches into data centers.

Rambus's and Microchip's September gains track delivered gross profit. Everspin's sales multiple re-expanded to 7.1x while its operating margin went the other way.

RMBSMRAMMCHPMUALABMRAM Nonvolatile MemoryDefense MicroelectronicsChip IP LicensingDRAM Pricing CycleData-Center Interconnect Silicon
TickerCompanySegmentTrend · 13mo30D1Y
The subject · what this brief is about
RMBSRambusInterconnect & Storage IP⚠️ Emerging Bear+27.9%+10.9%
MRAMEverspin TechnologiesMemory (DRAM/NAND)⚠️ Emerging Bear+10.5%+70.1%
MCHPMicrochip Technology IncorporatedAnalog & Mixed-Signal⚠️ Emerging Bear+10.1%+23.9%
Compared against · context, not the story
MUMicron TechnologyMemory (DRAM/NAND)🟢 Cont. Bull+5.0%+463.4%
ALABAstera LabsSpecialty Semiconductors🟢 Cont. Bull+18.5%+58.7%

12-month price & trend

RMBS
Rambus
112
+4.68 (+4.36%)
vs. prior close
Price20d50d150d
RMBS 12-month price
Interconnect & Storage IP
MRAM
Everspin Technologies
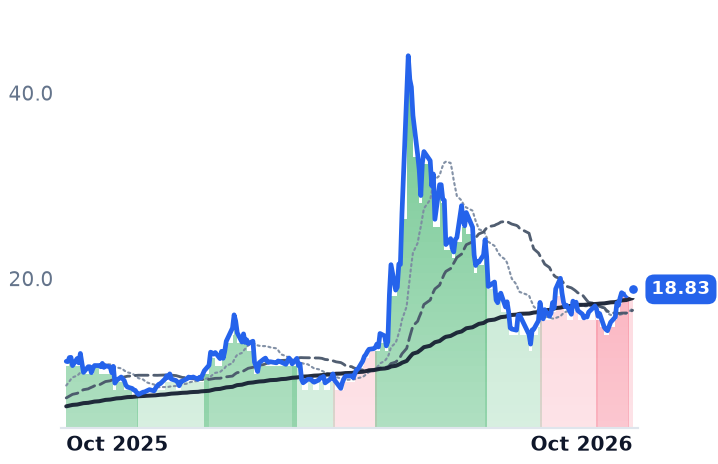
18.83
+0.18 (+0.97%)
vs. prior close
Price20d50d150d
MRAM 12-month price
Memory (DRAM/NAND)
MCHP
Microchip Technology Incorporated
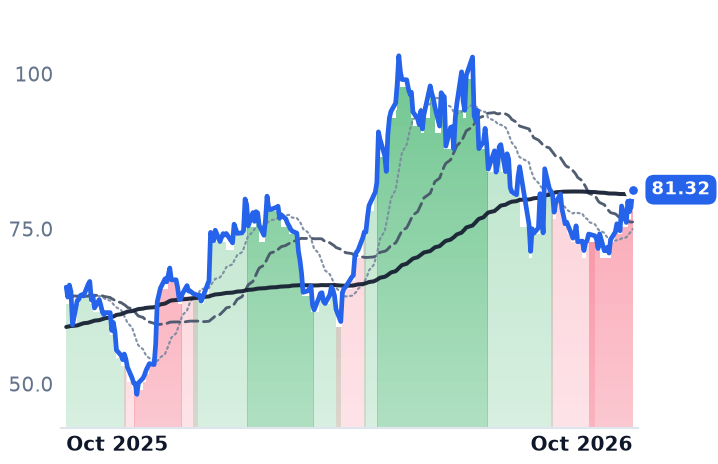
81.32
+2.82 (+3.59%)
vs. prior close
Price20d50d150d
MCHP 12-month price
Analog & Mixed-Signal
TickerMkt capP/EP/E fwdP/SP/S fwdP/GPP/GP fwdEV/EBITDAFCF yld
RMBS$12.1B50.4x36.9x16.1x14.7x20.5x18.7x37.8x2.5%
MRAM$441.5Mn/m—7.1x5.9x13.5x11.3x960.3x-1.2%
MCHP$44.2B112.7x22.3x8.6x6.9x14.3x11.5x29.3x2.5%
MU
Micron Technology
1,075
−22.50 (−2.05%)
vs. prior close
Price20d50d150d
MU 12-month price
Memory (DRAM/NAND)
ALAB
Astera Labs
350
−6.09 (−1.71%)
vs. prior close
Price20d50d150d
ALAB 12-month price
Specialty Semiconductors
TickerMkt capP/EP/E fwdP/SP/S fwdP/GPP/GP fwdEV/EBITDAFCF yld
MU$1.0T19.9x12.2x11.2x7.8x15.4x10.7x14.5x2.6%
ALAB$62.5B168.0x91.3x52.0x32.7x69.2x43.6x186.8x0.4%

Consensus projections

TickerFY2026EFY2027EFY2028E
RMBSRevenue+17.7%+20.6%+24.6%
EPS+21.5%+24.7%+26.6%
MRAMRevenue+35.9%+15.7%+1.0%
EPS+340.0%−218.2%+161.5%
MCHPRevenue+6.2%+37.1%+16.4%
EPS+20.7%+132.2%+25.6%
MURevenue+248.0%+92.8%+11.4%
EPS+804.9%+111.2%+7.9%
ALABRevenue+129.5%+61.3%+29.7%
EPS+124.4%+62.4%+27.3%

Forward fiscal years only. Blank means no analyst coverage for that year.

On 29 September Everspin, the only listed pure-play maker of magnetoresistive RAM, demonstrated what it called the world's first memory platform connected over Compute Express Link, the standard for hanging extra memory off a processor via the PCI Express bus. The memory modules were its own one-gigabyte PERSYST parts. The controller was not: the demonstration ran Wolley controller logic on an AMD Alveo programmable chip inside a Supermicro server, with an AMD EPYC processor, and Everspin claimed write speeds up to 100 times faster than NAND solid-state drives for saving AI training checkpoints.

That is the first physical referent for a category label three companies have been filed under while none of them sells the part that defines it. Rambus told investors on its 27 July call that Compute Express Link is a "fragmented ASIC market" and that its role is enablement and licensing intellectual property for other companies' chips. Everspin borrowed a controller. Microchip sells switches for the older bus. The group nonetheless rose together through September, Rambus by 32.2% in the month to 2 October, and the question is which businesses paid for that.

A record quarter built on a defense contract, not on servers

Everspin's June quarter was a record $18.7m, up 41.9% year over year after three straight quarters of acceleration. Product revenue of $15.3m, up 38%, came from industrial automation, European energy management and aerospace and defense sockets. The other $3.4m was first partial recognition on a $40m, 30-month Toggle MRAM subcontract with prime contractor Amentum under a US government microelectronics program, a contract worth roughly 72% of trailing annual revenue. Results were "driven by strong product revenue coupled with initial non-product revenue under our recently signed $40 million contract with a US prime contractor," chief executive Sanjeev Aggarwal said on the 5 August call; management warned recognition follows a bell curve.

What holds that position is qualification, not cost. Aggarwal called Everspin the "singular domestic provider of MRAM to the U.S. government" at the Lytham Partners summit on 18 August. The bill for defending it is visible: operating expenses reached $14.5m from $8.7m, including $4.0m of patent litigation brought by Avalanche Technology, and the operating loss widened to $4.4m. Trailing sales multiple: 7.07x on 2 October against 5.98x three weeks earlier, on a business whose operating margin moved the wrong way.

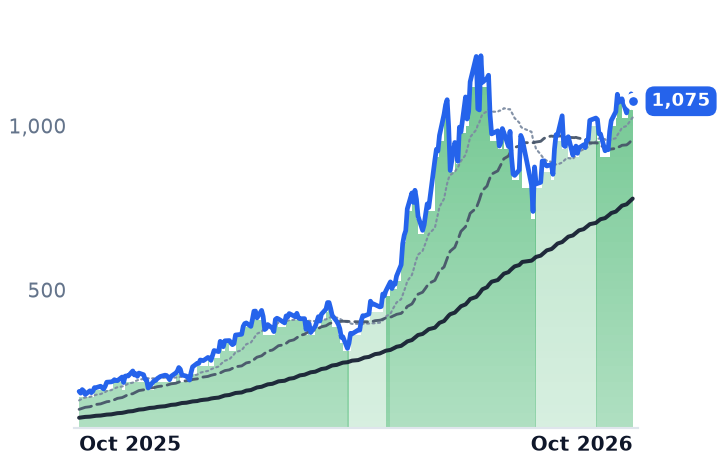
Micron's record quarter pays Rambus nothing per bit

Micron reported revenue of $54.2bn for its August quarter on 30 September with an 87% gross margin and contract DRAM prices projected to rise a further 10-15% in the fourth quarter. Rambus collects on modules, not bits. Its June quarter revenue was $207.4m, up 20.4%, with record chipset product revenue of $99.2m and royalties of $84.2m; September-quarter guidance puts product at $110-116m and royalties at $69-75m, the two largest lines pointed in opposite directions. Chief executive Luc Seraphin credited the June outperformance to processors moving from 12 to 16 memory channels — per-socket content, won generation by generation against Montage Technology and Renesas, with multiplexed-rank modules immaterial until 2027.

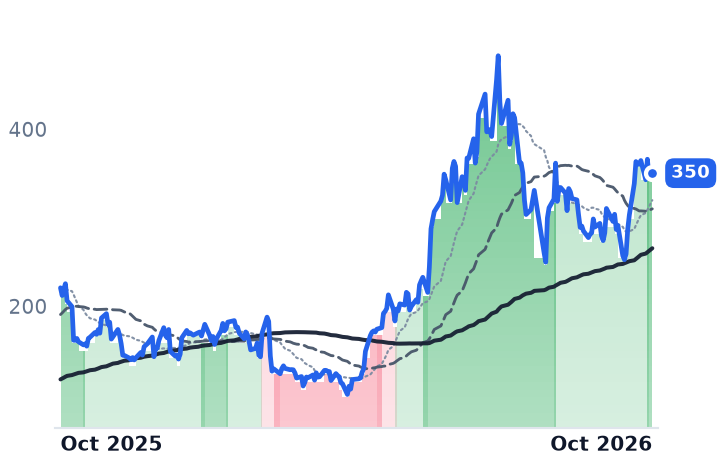
At 20.5x trailing price-to-gross-profit, against 16.1x on 9 September and roughly 24.4x in mid-May, Rambus is still priced at about half of Astera Labs' 39.3x forward, and Astera Labs is the one actually occupying the Compute Express Link memory-controller socket.

Microchip's shipping parts are on the older bus

Microchip's data-center revenue reached about $1bn in fiscal 2026, up 69% from $591m, with 14 PCI Express Generation 6 design wins — 12 switches and two retimers — entering production at the end of June. June-quarter revenue of $1.48bn grew 38% with gross margin of 63.2% against 53.6% and operating margin of 22.7% against 3.0%, as a brutal inventory correction unwound. At the Citi conference in early September the company said bookings were the strongest in about four years. It trades at 11.5x forward gross profit against roughly 18.7x in mid-May, cheaper than in spring on far better numbers.

So the September advance is mostly earned, and not by the category. Rambus's gross profit grew 28% and its re-rating sits below where it traded in May; Microchip's multiple fell as its margins doubled. Everspin is the one where price moved and the economics did not: revenue growth is real, but the incremental dollars are a government contract with a defined endpoint, and the Compute Express Link work earns nothing. The decisive session was 22 September, when Rambus rose 13.9% and Everspin 9.7% against Micron's 5.1% — no news at either name, memory shares rallying broadly after Goldman Sachs said the worst may be over. The likelier reading is re-coupling to a memory tape, which is also why a crossover-based decline signal still fires at Rambus: its 50-day average sits about 13% below its 200-day even with the price above both.

Everspin's demonstration will matter the day an order follows it. Until then the disaggregation parts that ship on this shelf are switches, and the standard in the label is something all three of these companies watch other people sell.

Collegium Earns a Tenth of the Branded Price on the Nucynta Generics It Licensed Out

Hypothesis Opus 5 · Research Opus 5 · Writing Opus 5 · Prompt v1.7

A branded medicine can keep its prescriptions and still lose most of its revenue line. Collegium licensed authorized generic versions of its Nucynta painkillers to Hikma Pharmaceuticals USA, and chief executive Vikram Karnani told investors each immediate-release prescription that migrates nets Collegium 10% to 15% of the branded net price. The pain franchise's quarterly net revenue fell 24% to $35.2m, and group operating margin went from 30.4% a year earlier to 1.9%.

The acquired attention-deficit products are growing, and they were bought. Belbuca's agreed generic entry date is January 2027; the term loan financing the roll-up runs years past it. Supernus guided its year up and its shares fell anyway, because they now convert into Indivior stock at a fixed ratio. Pacira's price squeeze comes from hospital purchasing groups rather than the patent calendar.

COLLSUPNPCRXINDVSPYALKSAXSMPTCTANIPCORTAMPHAMRXTEVAVTRSJAZZAuthorized Generic LicensingLoss Of ExclusivityGross-To-Net ErosionBranded Pain FranchisesADHD Drug MarketSpecialty Pharma M&A
TickerCompanySegmentTrend · 13mo30D1Y
The subject · what this brief is about
COLLCollegium PharmaceuticalSpecialty Branded Pharma🔴 Cont. Bear−6.4%−34.9%
SUPNSupernus PharmaceuticalsSpecialty Branded Pharma🔴 Cont. Bear−2.6%−12.3%
PCRXPacira BioSciencesSpecialty Branded Pharma🟢 Cont. Bull−4.3%+5.6%
Compared against · context, not the story
INDVIndivior PharmaceuticalsSpecialty Branded Pharma🟢 Cont. Bull+2.2%+57.1%
SPYState Street SPDR S&P 500 ETF TrustAsset Management🟢 Cont. Bull−0.1%+15.2%
ALKSAlkermesImmunology & Autoimmune🟢 Cont. Bull−9.4%+34.7%
AXSMAxsome TherapeuticsCNS & Neurological🟢 Cont. Bull−13.3%+49.4%
PTCTPTC TherapeuticsRare Genetic & Metabolic Diseases⚠️ Emerging Bear−8.4%−2.1%
ANIPANI PharmaceuticalsGeneric & API Manufacturers🔴 Cont. Bear+1.3%−21.6%
CORTCorcept Therapeutics IncorporatedRare Genetic & Metabolic Diseases🟢 Cont. Bull+4.1%+29.4%
AMPHAmphastar PharmaceuticalsGeneric & API Manufacturers🌱 Emerging Bull+9.7%−4.3%
AMRXAmneal PharmaceuticalsGeneric & API Manufacturers🟢 Cont. Bull+16.4%+92.4%
TEVATeva Pharmaceutical IndustriesGeneric & API Manufacturers🟢 Cont. Bull+8.7%+98.0%
VTRSViatrisGeneric & API Manufacturers🟢 Cont. Bull+4.3%+77.3%
JAZZJazz PharmaceuticalsOther🟢 Cont. Bull−4.5%+71.3%

12-month price & trend

COLL
Collegium Pharmaceutical
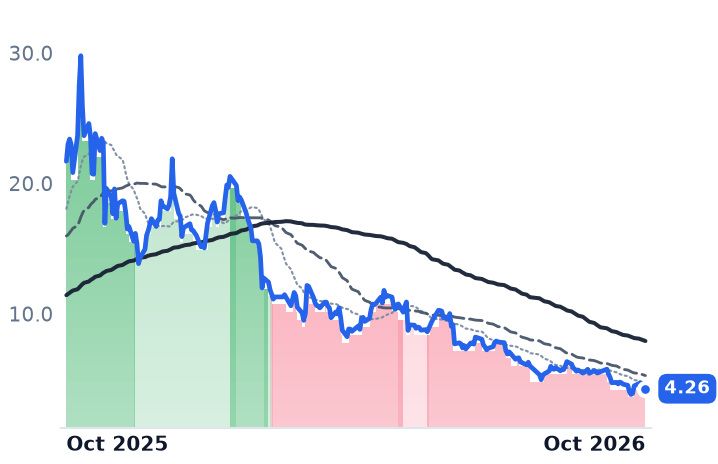
22.02
+0.18 (+0.82%)
vs. prior close
Price20d50d150d
COLL 12-month price
Specialty Branded Pharma
SUPN
Supernus Pharmaceuticals
42.38
+0.20 (+0.47%)
vs. prior close
Price20d50d150d
SUPN 12-month price
Specialty Branded Pharma
PCRX
Pacira BioSciences
25.21
+0.20 (+0.80%)
vs. prior close
Price20d50d150d
PCRX 12-month price
Specialty Branded Pharma
TickerMkt capP/EP/E fwdP/SP/S fwdP/GPP/GP fwdEV/EBITDAFCF yld
COLL$714.2M14.4x3.0x0.9x0.9x1.5x1.4x2.5x46.0%
SUPN$2.5Bn/m16.5x3.0x2.8x3.4x3.2xn/m0.8%
PCRX$991.6M71.6x8.7x1.3x1.3x1.7x1.7x10.4x18.1%
INDV
Indivior Pharmaceuticals
35.71
+0.33 (+0.93%)
vs. prior close
Price20d50d150d
INDV 12-month price
Specialty Branded Pharma
SPY
State Street SPDR S&P 500 ETF Trust
770
+5.65 (+0.74%)
vs. prior close
Price20d50d150d
SPY 12-month price
Asset Management
ALKS
Alkermes
41.75
+1.21 (+2.98%)
vs. prior close
Price20d50d150d
ALKS 12-month price
Immunology & Autoimmune
TickerMkt capP/EP/E fwdP/SP/S fwdP/GPP/GP fwdEV/EBITDAFCF yld
INDV$4.5B12.6x8.5x3.3x3.3x4.0x4.0x11.0x-2.5%
SPY$773.0B————————
ALKS$6.2B40.8x—4.0x3.4x4.6x4.0x27.1x3.6%
AXSM
Axsome Therapeutics
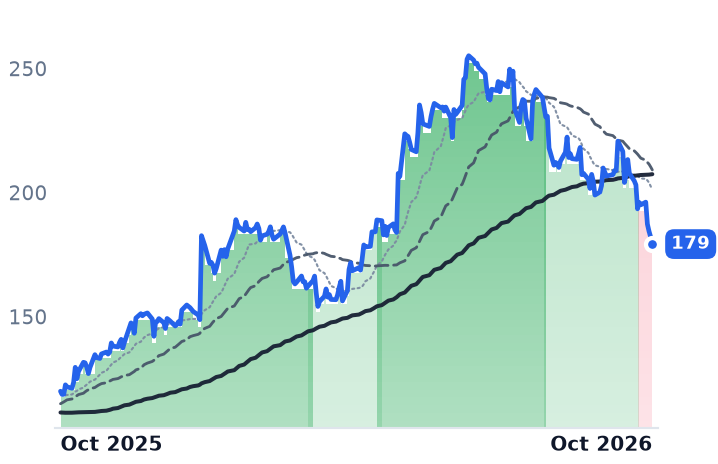
179
−2.82 (−1.55%)
vs. prior close
Price20d50d150d
AXSM 12-month price
CNS & Neurological
PTCT
PTC Therapeutics
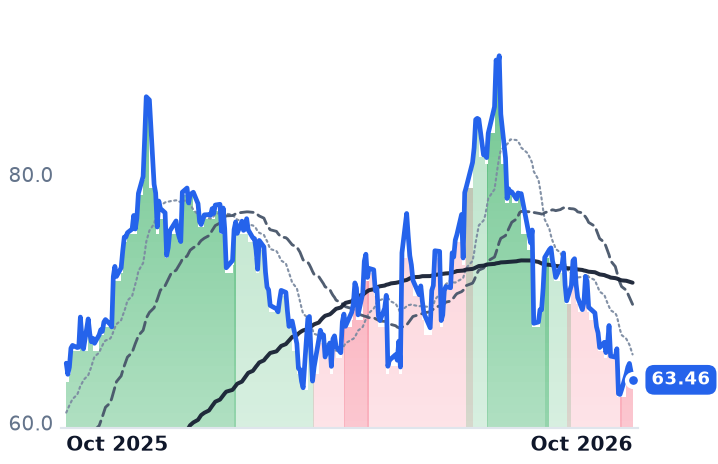
63.46
−0.67 (−1.04%)
vs. prior close
Price20d50d150d
PTCT 12-month price
Rare Genetic & Metabolic Diseases
ANIP
ANI Pharmaceuticals
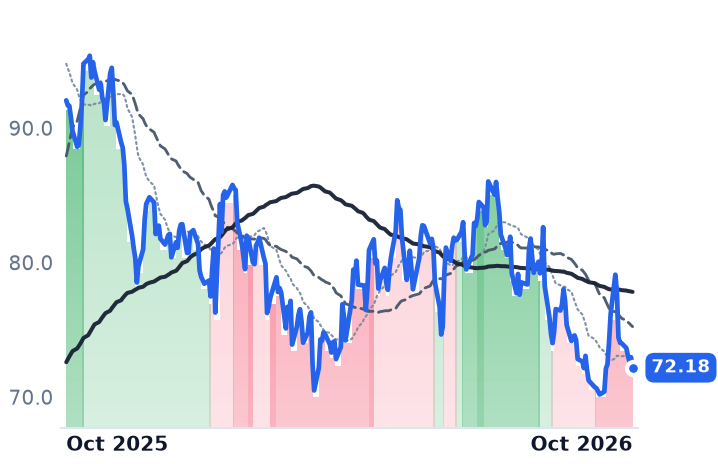
72.18
−0.78 (−1.07%)
vs. prior close
Price20d50d150d
ANIP 12-month price
Generic & API Manufacturers
TickerMkt capP/EP/E fwdP/SP/S fwdP/GPP/GP fwdEV/EBITDAFCF yld
AXSM$11.7Bn/m—16.5x11.9x17.9x12.9xn/m-0.6%
PTCT$5.9Bn/m126.7x7.2x5.1x9.2x6.6xn/m-3.9%
ANIP$1.7B15.4x8.0x1.7x1.5x2.7x2.4x6.5x9.4%
CORT
Corcept Therapeutics Incorporated
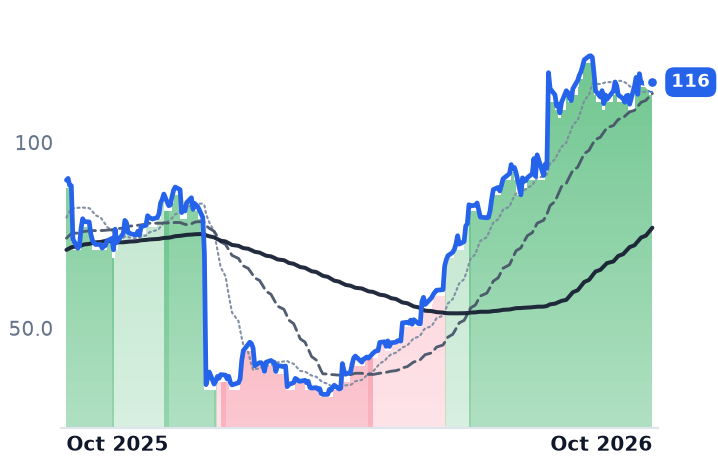
116
+2.20 (+1.93%)
vs. prior close
Price20d50d150d
CORT 12-month price
Rare Genetic & Metabolic Diseases
AMPH
Amphastar Pharmaceuticals
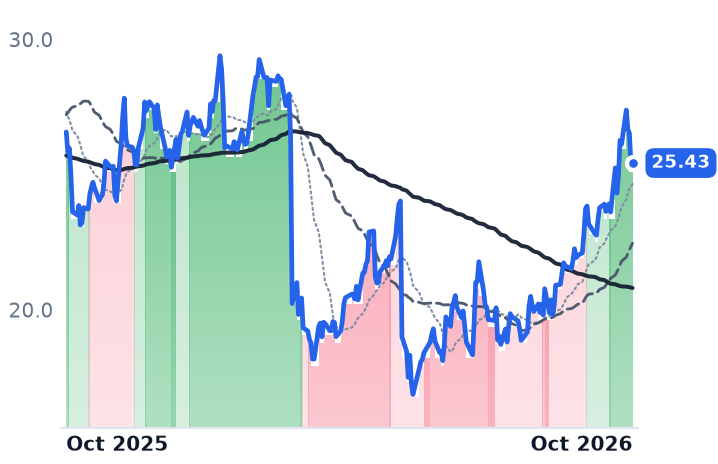
25.43
+0.08 (+0.32%)
vs. prior close
Price20d50d150d
AMPH 12-month price
Generic & API Manufacturers
AMRX
Amneal Pharmaceuticals
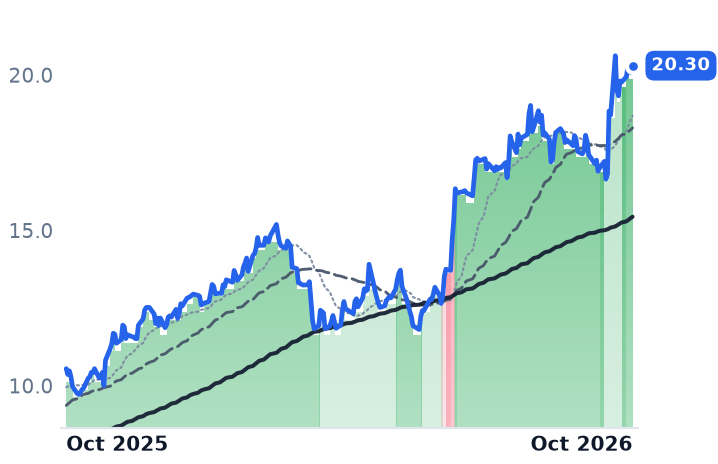
20.30
+0.23 (+1.15%)
vs. prior close
Price20d50d150d
AMRX 12-month price
Generic & API Manufacturers
TickerMkt capP/EP/E fwdP/SP/S fwdP/GPP/GP fwdEV/EBITDAFCF yld
CORT$6.1B122.9x98.0x7.9x6.2x8.0x6.3xn/m2.0%
AMPH$1.2B15.0x8.8x1.6x1.5x3.3x3.2x9.3x13.3%
AMRX$6.2B38.9x19.0x2.0x2.0x5.0x5.0x13.5x1.3%
TEVA
Teva Pharmaceutical Industries
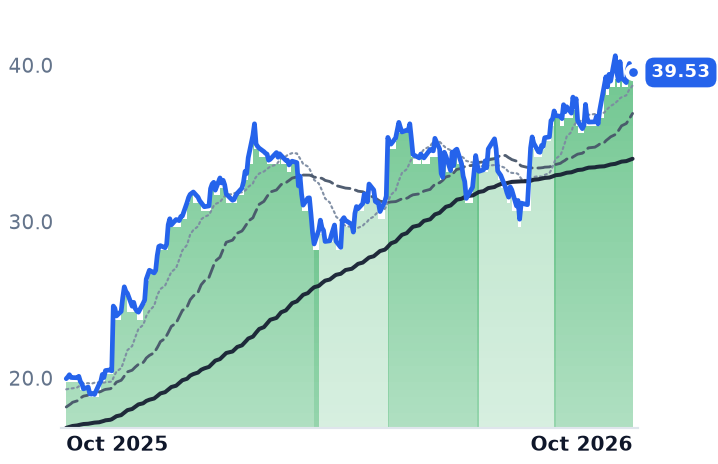
39.53
+0.22 (+0.56%)
vs. prior close
Price20d50d150d
TEVA 12-month price
Generic & API Manufacturers
VTRS
Viatris
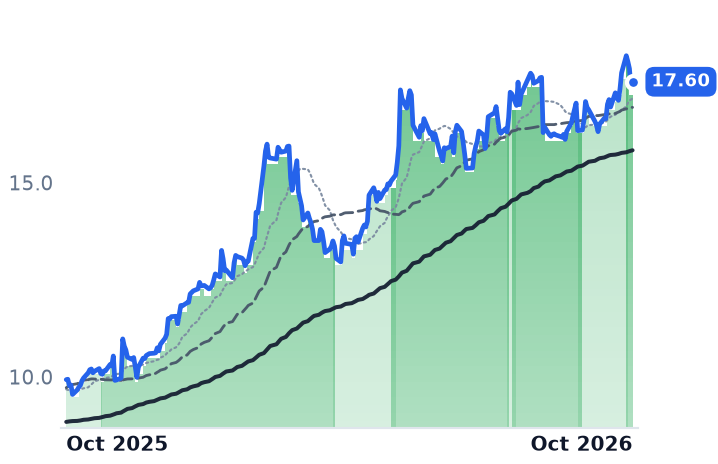
17.60
+0.14 (+0.80%)
vs. prior close
Price20d50d150d
VTRS 12-month price
Generic & API Manufacturers
JAZZ
Jazz Pharmaceuticals
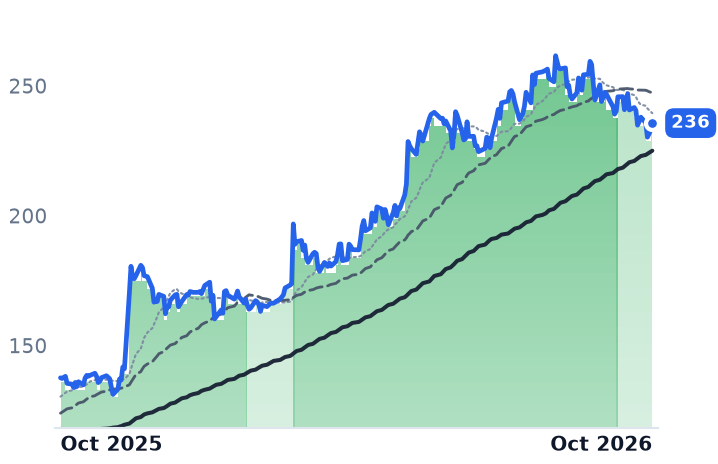
236
+2.66 (+1.14%)
vs. prior close
Price20d50d150d
JAZZ 12-month price
Other
TickerMkt capP/EP/E fwdP/SP/S fwdP/GPP/GP fwdEV/EBITDAFCF yld
TEVA$45.6B62.9x19.7x2.7x2.8x5.1x5.3x19.2x5.2%
VTRS$20.8Bn/m7.1x1.4x1.4x4.0x4.0x12.7x9.0%
JAZZ$14.4B480.1x9.1x3.2x3.2x3.8x3.8x45.3x8.7%

Consensus projections

TickerFY2026EFY2027EFY2028E
COLLRevenue+7.1%+1.6%−0.4%
EPS−1.4%−9.3%−5.3%
SUPNRevenue+25.1%+56.0%+21.3%
EPS−17.2%+73.9%+21.1%
PCRXRevenue+3.4%+4.7%+11.9%
EPS−2.2%+19.1%+31.9%
INDVRevenue+11.8%+5.1%+6.4%
EPS+79.4%+9.4%+4.8%
ALKSRevenue+23.2%+4.2%+9.9%
EPS−114.0%−356.5%+117.4%
AXSMRevenue+54.8%+62.5%+42.5%
EPS−47.8%−394.6%+149.2%
PTCTRevenue−37.6%+11.2%+18.8%
EPS−94.1%+267.1%+5.8%
ANIPRevenue+27.1%+11.5%+8.4%
EPS+23.2%+12.9%+14.2%
CORTRevenue+19.7%+28.8%+32.0%
EPS−39.8%+234.2%+98.0%
AMPHRevenue+3.1%+4.9%+3.0%
EPS−13.6%+7.1%+6.3%
AMRXRevenue+4.7%+9.0%+10.9%
EPS+27.4%+17.3%+21.4%
TEVARevenue−1.2%+4.6%+4.5%
EPS−23.8%+53.8%+11.8%
VTRSRevenue+4.7%+1.7%+3.1%
EPS+8.7%+6.4%+7.3%
JAZZRevenue+6.2%+7.2%+8.8%
EPS+205.3%+2.1%+12.4%

Forward fiscal years only. Blank means no analyst coverage for that year.

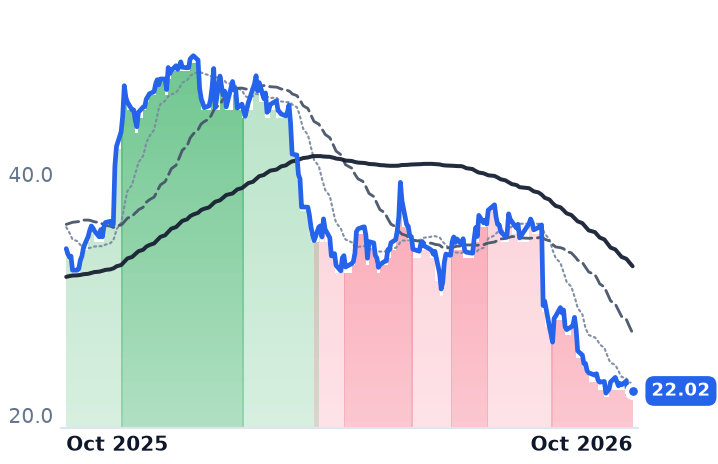
Collegium Pharmaceutical, the Stoughton, Massachusetts seller of branded pain medicines and an acquired attention-deficit portfolio, still supplies the tapentadol painkillers it markets as Nucynta, and prescribers still write them. What the company has stopped collecting is the price. The franchise produced $35.2m of net revenue in the June quarter, down 24% from a year earlier, and that figure already includes $5.1m of profit share on the authorized generic versions, with the decline attributed to lower net pricing on those generics. Chief executive Vikram Karnani put a number on it for investors: the authorized generic nets Collegium roughly 10% to 15% of branded net price for the immediate-release product and 20% to 25% for extended release.

The acquired ADHD franchise was read as the engine that replaces this. "In the second quarter, we saw strong demand across our ADHD portfolio, highlighted by record-high JORNAY PM prescriptions and prescriber adoption, alongside 41% revenue growth," Karnani said in the results release of 6 August 2026. It is growing: Jornay PM delivered $46.1m, on prescriptions up 13.1%. The same morning the company cut full-year revenue guidance from $865-895m to $825-855m and adjusted earnings before interest, taxes, depreciation and amortization to $445-470m, and the shares fell about 13.5% before the open.

The list price nobody pays

A specialty-pharma dollar is the residue of a much larger billed number. For the six months to 30 June 2025, Collegium's filings show provisions on current-period sales of $241.8m for rebates and incentives, $101.4m for trade allowances and chargebacks and $34.6m for returns — $377.8m of deductions against roughly $366m of net product revenue booked in the period. List price is approximately double what the company keeps.

That gap is where the quarter was lost. Xtampza ER's $4.5m revenue decline came from lower volume and higher gross-to-net adjustments, partly offset by a higher gross price: the sticker went up, the realization went down. Group gross margin fell to 55.2% from 62.5% two quarters earlier, operating margin to 1.9% from 30.4% a year ago, and the quarter closed with a $15.1m net loss on $199.9m of revenue. Statute is pushing the same way — the Inflation Reduction Act's Manufacturer Discount Program obliges makers to fund 10% of Part D cost in the initial phase and 20% in the catastrophic phase, a larger drag on high-priced specialty products than the program it replaced.

The calendar ends in January; the loans do not

US exclusivity for Nucynta immediate-release runs to 3 January 2027, and Belbuca's agreed generic entry date under its Teva settlement is the same month. Xtampza ER's agreed date is September 2033. Against that, $572.8m of principal was outstanding under the term loan at 31 March 2026, alongside $241.5m of 2.875% convertible notes due 2029, with the term facility maturing in November 2028 or December 2030 depending on conditions.

The replacement portfolio is purchased, not discovered. Collegium paid about $650m in cash for the Azstarys business in May 2026 — roughly $350m of balance-sheet cash plus a $300m delayed draw — and it contributed $12.9m of revenue from 12 May to 30 June. Half-year amortization of acquired intangibles ran to $118.4m against a cash cost of making the drugs of $47.4m.

Two other meters on the same dollar

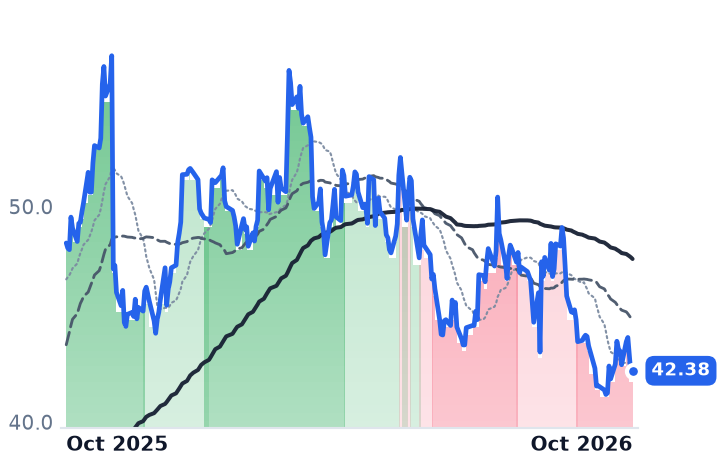
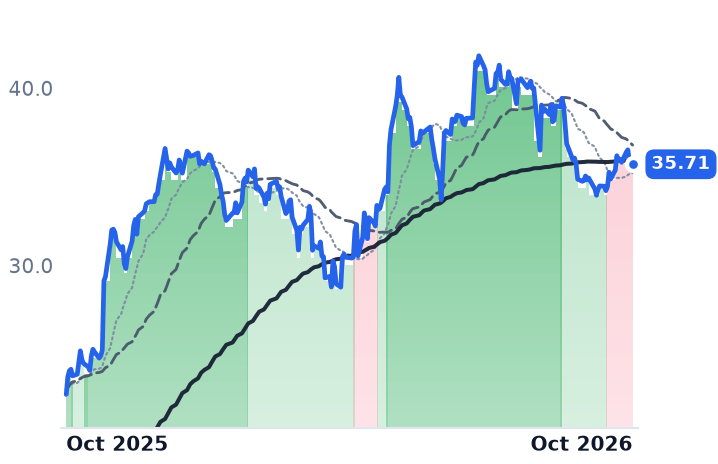
Supernus, the Rockville CNS specialist, is the control on the pricing thesis and fails it: revenue rose 32% to $219.1m, Qelbree net sales 15% to $89.2m on prescriptions up 17%, and guidance went up to $860-890m. Its shares fell 11.8% over three months because each one now converts into 1.5401 Indivior shares; the quote is Indivior's.

Pacira, which sells the non-opioid injectable Exparel, confirms the mechanism from the hospital side. Vials rose 4% and net sales only 3%, to $147.8m, the gap owed to vial mix and a third group-purchasing-organisation discount contract; gross margin slipped 4 points to 77.0%. Its patent fight is settled — Fresenius Kabi is licensed no earlier than a confidential 2030 date — so what moves Pacira's dollar is whether payers reimburse the drug outside the surgical bundle, and that improved in the quarter. It trades at 8.7x forward earnings and 10.4x trailing EV/EBITDA, with an 18.1% trailing free-cash-flow yield.

What the fall has already paid for

Collegium closed at $22.02 on 2 October, down 40.5% in three months and 35.8% in a year, in a declining trend since mid-August. Comparable branded small-caps went in both directions over the same stretch — Alkermes fell 23.5% and Axsome 26.6%, while Corcept rose 28.8% and Amphastar 29.5%, with the S&P 500 up 3.3% — so this is a verdict on Collegium.

The business explains the direction fully: four quarters of decelerating revenue, a 7-point gross-margin compression, a cut guide and a franchise whose price has been reset by its own licensee. What the business does not obviously explain is the level. At 2.46x trailing EV/EBITDA and a 46% trailing free-cash-flow yield, against 14.4x trailing earnings versus roughly 20-26x a year ago, the shares are priced for the cash to stop, while consensus revenue holds near $850m through 2028. One of those is wrong, and the test is whether Jornay PM and Azstarys hold their guided $190-200m and $65-75m while the pain franchise finishes going.

There is one more cost arriving at this market-cap band: the 100% tariff on certain patented pharmaceutical products took effect at the end of September and exempts the large manufacturers that signed most-favored-nation pricing agreements. Collegium's ADHD portfolio has until January to become the company.

Stem's Shares Are Worth Less Than Its Convertible Debt After the Pivot to Solar Software

Hypothesis Opus 5 · Research Opus 5 · Writing Opus 5 · Prompt v1.7

A company that stopped reselling batteries now monitors 38.3 GW of other people's solar plants, and its stock has lost four-fifths of its value in a year. Stem's June-quarter revenue fell 12.3%, and the whole of that decline was the battery-resale line it deliberately abandoned; software and services revenue grew, gross margin widened to 41.3%, and adjusted earnings before interest, taxes, depreciation and amortization were positive for a fifth straight quarter.

The operating business does not account for the fall; the capital structure does. $46.3m of convertible notes and negative book equity rank ahead of a $38.2m equity. At the hardware end of the same demand, Enphase is the opposite case: more units shipped for less money per watt, and a margin a third of which comes from a production tax credit.

STEMENPHRUNSEDGSolar Asset Monitoring SoftwareResidential Solar ContractionMicroinverters & Power ElectronicsBattery Storage DispatchConvertible Debt OverhangSolar Tax Credit Shift
TickerCompanySegmentTrend · 13mo30D1Y
The subject · what this brief is about
STEMStemRenewable Utilities🔴 Cont. Bear−23.5%−80.4%
ENPHEnphase EnergyInverters & Power Electronics🔴 Cont. Bear−8.0%−9.9%
Compared against · context, not the story
RUNSunrunResidential Solar Installers🔴 Cont. Bear−13.3%−59.9%
SEDGSolarEdge TechnologiesInverters & Power Electronics⚠️ Emerging Bear−3.2%−10.8%

12-month price & trend

STEM
Stem
4.26
+0.19 (+4.67%)
vs. prior close
Price20d50d150d
STEM 12-month price
Renewable Utilities
ENPH
Enphase Energy
33.47
+0.65 (+1.98%)
vs. prior close
Price20d50d150d
ENPH 12-month price
Inverters & Power Electronics
RUN
Sunrun
7.71
+0.07 (+0.92%)
vs. prior close
Price20d50d150d
RUN 12-month price
Residential Solar Installers
TickerMkt capP/EP/E fwdP/SP/S fwdP/GPP/GP fwdEV/EBITDAFCF yld
STEM$38.2Mn/m—0.3x0.3x0.7x0.7xn/m15.2%
ENPH$4.4B32.8x16.8x3.3x3.7x7.1x8.0x25.3x3.5%
RUN$1.8B4.5x6.1x0.5x0.6x1.5x1.7x23.0x-74.4%
SEDG
SolarEdge Technologies
33.09
+2.22 (+7.19%)
vs. prior close
Price20d50d150d
SEDG 12-month price
Inverters & Power Electronics
TickerMkt capP/EP/E fwdP/SP/S fwdP/GPP/GP fwdEV/EBITDAFCF yld
SEDG$2.2Bn/m—1.7x1.7x7.6x7.6xn/m4.0%

Consensus projections

TickerFY2026EFY2027EFY2028E
STEMRevenue+0.1%+17.5%+22.8%
EPS+31.7%−14.2%−45.1%
ENPHRevenue−19.2%+3.7%+10.9%
EPS−29.1%+10.1%+17.3%
RUNRevenue+29.7%+3.5%+12.9%
EPS−8.2%−65.9%−38.3%
SEDGRevenue+12.0%+11.1%+11.4%
EPS−86.2%−370.0%+91.7%

Forward fiscal years only. Blank means no analyst coverage for that year.

Stem has spent the past year deleting revenue on purpose, and the June quarter shows what is left. The company sells software that monitors and dispatches solar plants and battery systems for developers, utilities and independent power producers, and it used to buy battery hardware from manufacturers and resell it alongside. That line brought in $5.0m a year ago and $0.3m this time — which is the entire 12.3% revenue decline the quarter reported.

Everything the exit was meant to buy arrived with it. Gross margin widened to 41.3% from 33.4%. Adjusted EBITDA rose 63% to $6.2m, a fifth consecutive positive quarter, and bookings rose 39% from the March quarter to $36.8m. The shares fell 80.3% over twelve months anyway. What decides that price is not an argument about the business but the ranking of the claims on it, and Stem's shareholders rank last.

Thirty-eight gigawatts of other people's solar

The growth engine is not behind-the-meter storage, which is how the company is usually filed. Stem ended June with 38.3 GW of solar assets under management against 1.8 GWh of storage, both up sequentially; revenue from the PowerTrack monitoring platform rose 11% to about $11m. Contracted annual recurring revenue reached $69.0m from $67.2m three months earlier, against year-end guidance of $65-70m. PowerTrack also went abroad in the quarter, taking over as the control system for a 420 MWh battery bolted onto the existing 135 MW Granja Solar plant in Chile and winning two 80 MWh systems in Hungary.

"The second quarter reflected strong momentum across our core PowerTrack platform and continued expansion of our international footprint," chief executive Arun Narayanan said on 12 August.

The hardware end of the same dollar

Who pays for a residential solar system changed hands this year. The 30% Section 25D homeowner credit expired on 31 December 2025 while the commercial Section 48E credit survived, so federal value now reaches only systems somebody else owns, and roughly 69% of 2026 US installations are projected to be third-party owned. The handover is going badly: the third quarter brought 995 MWdc of US residential installs, down 12% year on year, and the Solar Energy Industries Association and Wood Mackenzie deepened their 2026 contraction forecast to 23% from 21%, blaming installers' difficulty converting from cash and loan sales to third-party ownership and scarce tax-equity capital.

Enphase, which makes the microinverter that converts one solar module's output to household current and sells it through distributors rather than to homeowners, is where that shows up as price. June-quarter revenue of $291.9m was down 19.6%, a third straight fall of roughly a fifth, and US sell-through — installations actually completed — fell 34% year on year. Yet shipments rose 12.8% sequentially to about 1.59 million microinverters while revenue rose 3.2%. Dividing revenue by shipped capacity gives a blended $0.403 per watt DC against $0.451 three months earlier, a 10.7% fall: more boxes, less money, a buyer that is now a procurement desk.

"We are not stopping and waiting. We are not waiting for things to improve. We are taking matters into our own hands," chief executive Badrinarayanan Kothandaraman told investors on 28 July.

The 60.0% gross margin that appears to contradict all this is borrowed. A $45.4m tariff refund added 15.6 points to it, and the company guided September-quarter GAAP gross margin down to 42-45% because the refund does not repeat. Underneath sits Section 45X: $85.2m of production credits generated in the first half, disclosed on the July call, equal to roughly 31% of the $275.4m of first-half gross profit, with 1.58 of the 1.59 million microinverters shipped from Texas and South Carolina and therefore credit-bearing. Enphase trades at 7.09x trailing gross profit, against 14.55x in mid-May, and its forward price-to-sales multiple of 3.73x sits above the trailing 3.33x — the signature of a denominator consensus expects to shrink, not of a cheap stock.

Where the two prices come from

Enphase's de-rating is earned. Volumes are up, revenue per watt is down, the margin leans on a credit that steps down from 2030, and three banks cut their targets inside the September slide, Goldman Sachs and Jefferies on the 21st and Citigroup to $37 on the 29th — all of it after the Federal Reserve's quarter-point increase on 16 September, which bears directly on twenty-year lease cash flows.

Stem's is not. The operating numbers moved the right way in every line that matters, and the stock has been in an unbroken downtrend for 92 sessions since 19 May; it fell from $5.76 on 8 September to $3.82 on the 23rd, jumped 15.1% the session UBS upgraded it to Buy with a $7.00 target, and closed the month lower anyway. What the market is pricing is a residual. Stem still lost $7.67m at the operating line and $14.38m net; book equity is negative; the 4.25% convertible notes due 2030 carried an estimated fair value of $46.3m at 30 June against $38.4m of cash; and a $200m shelf is live against a $38.2m market value. At 0.26x trailing sales the shares look like a software business on sale; they are a claim behind debt, on a business whose contracted revenue is worth nearly twice what the equity is.

Both companies now depend on money that has to be released by the Treasury before it can be spent. The foreign-entity safe-harbor tables that govern whether tax-equity investors can underwrite this equipment at all still do not exist, with a statutory deadline of 31 December 2026 and Enphase expecting nothing final before the first half of 2027. Until they are published, the buyer of last resort for an American solar panel is a tax lawyer waiting on a table.

Intersnack Is Buying Utz for $2.9bn After Frito-Lay's Price Cut Reversed Its Share Gains

Hypothesis Opus 5 · Research Opus 5 · Writing Opus 5 · Prompt v1.6

A European family snack group is paying roughly 13.3x consensus 2026 earnings before interest, taxes, depreciation and amortization for the largest pure-play salty-snack maker in the United States — a business the public market was carrying at around half that the day before the bid, at a 91% discount to the agreed price.

The operating numbers do not explain the re-rating. Utz's second-quarter organic net sales rose 1.4%, all of it price: net price realisation added 3.6% while volume and mix subtracted 2.2%, and its measured-channel retail volumes fell 4.6% into a salty-snack category whose volumes grew 1.1%. Margin gains came from productivity, with adjusted gross margin at 33.2% against 31.7%.

The two snack names without a buyer — J&J Snack Foods and Flowers Foods — are down 19.1% and 57.2% over twelve months, and their own revenue, volume and guidance lines earn it.

UTZJJSFFLOPEPCPBGISPOSTCAGSMPLHRLHSYKHCSJMSalty Snack CategoryPackaged Food M&APrice-Volume TradeoffShelf Space CompetitionDirect-Store DeliveryFood Sector De-Rating
TickerCompanySegmentTrend · 13mo30D1Y
The subject · what this brief is about
UTZUtz BrandsSnacks & Convenience Foods🌱 Emerging Bull+0.4%+18.6%
JJSFJ&J Snack FoodsSnacks & Convenience Foods🔴 Cont. Bear−7.0%−17.2%
FLOFlowers FoodsSnacks & Convenience Foods🔴 Cont. Bear−11.2%−54.2%
Compared against · context, not the story
PEPPepsiCoLarge-Cap Global Beverage🔴 Cont. Bear−8.5%−8.2%
CPBCampbell SoupFrozen & Prepared Foods🔴 Cont. Bear−8.2%−35.2%
GISGeneral MillsCereals & Breakfast🔴 Cont. Bear−16.4%−33.4%
POSTPostCereals & Breakfast🔴 Cont. Bear−14.3%−32.0%
CAGConagra BrandsFrozen & Prepared Foods🔴 Cont. Bear−13.7%−23.9%
SMPLThe Simply Good FoodsNutritional & Wellness Products🔴 Cont. Bear−14.1%−58.5%
HRLHormel FoodsMeat & Protein Processing🔴 Cont. Bear−6.0%−13.4%
HSYThe HersheyFood Confectioners🔴 Cont. Bear−7.5%−16.8%
KHCThe Kraft HeinzCondiments & Sauces🟢 Cont. Bull−10.7%−9.3%
SJMThe J. M. SmuckerPet Food & Nutrition🟢 Cont. Bull−7.1%+12.9%

12-month price & trend

UTZ
Utz Brands
14.27
+0.01 (+0.07%)
vs. prior close
Price20d50d150d
UTZ 12-month price
Snacks & Convenience Foods
JJSF
J&J Snack Foods
78.25
+0.67 (+0.86%)
vs. prior close
Price20d50d150d
JJSF 12-month price
Snacks & Convenience Foods
FLO
Flowers Foods
5.57
+0.01 (+0.18%)
vs. prior close
Price20d50d150d
FLO 12-month price
Snacks & Convenience Foods
TickerMkt capP/EP/E fwdP/SP/S fwdP/GPP/GP fwdEV/EBITDAFCF yld
UTZ$1.3Bn/m18.4x0.9x0.8x4.3x4.2x22.8x4.0%
JJSF$1.5B29.9x18.1x1.0x1.0x3.1x3.1x11.5x6.3%
FLO$1.2B21.4x7.1x0.2x0.2x0.5x0.5x11.0x26.8%
PEP
PepsiCo
126
+0.29 (+0.23%)
vs. prior close
Price20d50d150d
PEP 12-month price
Large-Cap Global Beverage
CPB
Campbell Soup
19.62
+0.13 (+0.67%)
vs. prior close
Price20d50d150d
CPB 12-month price
Frozen & Prepared Foods
GIS
General Mills
32.01
+0.34 (+1.07%)
vs. prior close
Price20d50d150d
GIS 12-month price
Cereals & Breakfast
TickerMkt capP/EP/E fwdP/SP/S fwdP/GPP/GP fwdEV/EBITDAFCF yld
PEP$203.8B23.3x17.2x2.1x2.1x4.0x3.8x16.3x4.3%
CPB$5.9B14.9x11.8x0.6x0.6x2.2x2.2x10.0x11.4%
GIS$17.6B8.1x9.6x1.0x1.0x2.9x2.9x10.1x9.4%
POST
Post
72.56
−0.27 (−0.37%)
vs. prior close
Price20d50d150d
POST 12-month price
Cereals & Breakfast
CAG
Conagra Brands
13.36
+0.16 (+1.21%)
vs. prior close
Price20d50d150d
CAG 12-month price
Frozen & Prepared Foods
SMPL
The Simply Good Foods
9.83
−0.05 (−0.51%)
vs. prior close
Price20d50d150d
SMPL 12-month price
Nutritional & Wellness Products
TickerMkt capP/EP/E fwdP/SP/S fwdP/GPP/GP fwdEV/EBITDAFCF yld
POST$4.6B14.3x13.1x0.5x0.5x2.0x2.1x8.3x15.8%
CAG$7.1Bn/m10.3x0.6x0.7x2.6x2.7xn/m13.8%
SMPL$1.0Bn/m7.0x0.7x0.8x2.2x2.4x9.3x14.0%
HRL
Hormel Foods
20.25
+0.29 (+1.45%)
vs. prior close
Price20d50d150d
HRL 12-month price
Meat & Protein Processing
HSY
The Hershey
160
+0.89 (+0.56%)
vs. prior close
Price20d50d150d
HSY 12-month price
Food Confectioners
KHC
The Kraft Heinz
22.19
−0.27 (−1.20%)
vs. prior close
Price20d50d150d
KHC 12-month price
Condiments & Sauces
TickerMkt capP/EP/E fwdP/SP/S fwdP/GPP/GP fwdEV/EBITDAFCF yld
HRL$11.5B33.3x14.1x0.9x0.9x6.1x6.1x15.5x6.8%
HSY$37.9B34.0x22.2x3.2x3.1x9.1x8.9x20.8x5.7%
KHC$27.2Bn/m11.1x1.1x1.1x3.3x3.3xn/m14.5%
SJM
The J. M. Smucker
117
+1.24 (+1.07%)
vs. prior close
Price20d50d150d
SJM 12-month price
Pet Food & Nutrition
TickerMkt capP/EP/E fwdP/SP/S fwdP/GPP/GP fwdEV/EBITDAFCF yld
SJM$10.7Bn/m10.1x1.2x1.2x3.7x3.6xn/m9.1%

Consensus projections

TickerFY2026EFY2027EFY2028E
UTZRevenue+3.8%+1.0%+1.6%
EPS−4.0%+7.5%+5.5%
JJSFRevenue−4.6%+2.0%+1.7%
EPS+1.7%+8.4%+6.0%
FLORevenue+2.6%−2.8%−0.4%
EPS−18.7%−23.2%−7.4%
PEPRevenue+6.0%+3.1%+3.6%
EPS+6.7%+5.6%+6.6%
CPBRevenue−4.9%−2.9%−0.5%
EPS−26.0%−21.7%+6.9%
GISRevenue−5.6%−2.5%+1.0%
EPS−18.2%−4.5%+4.0%
POSTRevenue+2.2%−0.2%−0.0%
EPS+9.5%+13.5%+14.4%
CAGRevenue−3.2%−3.9%−0.4%
EPS−26.7%−14.9%+3.6%
SMPLRevenue−7.9%+0.5%+1.8%
EPS−14.7%+6.6%+7.7%
HRLRevenue+0.1%+1.8%+1.4%
EPS+9.0%+5.7%+5.6%
HSYRevenue+5.8%+2.8%+2.7%
EPS+40.4%+18.1%+8.6%
KHCRevenue−2.0%+0.6%+1.1%
EPS−18.6%+1.4%+4.4%
SJMRevenue+3.2%+1.0%+1.5%
EPS−10.2%+10.4%+8.5%

Forward fiscal years only. Blank means no analyst coverage for that year.

Intersnack Group agreed on 21 July to take Utz Brands private at $14.25 a share in cash, a day after the Hanover, Pennsylvania chipmaker closed at $7.45. The deal values Utz at about $2.9bn including debt and carries a premium of roughly 91%. On completion, expected in the fourth quarter, Utz leaves the New York Stock Exchange and is owned half by Intersnack and half by the founding Rice and Lissette family entities, financed with about $920m of Intersnack cash and a $1.1bn term loan.

Against consensus 2026 earnings before interest, taxes, depreciation and amortization of $217.6m, Intersnack is paying roughly 13.3x — which means the quoted market was valuing the identical cash flows near 7x the previous afternoon. That is the finding worth carrying forward: the dislocation on the American snack shelf was real, and a strategic buyer, not the public market, collected it. Everything else in the aisle is still being marked down.

What Utz's dollar actually did

Utz sells potato chips, pretzels, cheese snacks and pork rinds under Utz, Zapp's, Golden Flake and Boulder Canyon into grocers, clubs and convenience stores. Organic net sales rose 1.4% in the June quarter, and the composition matters more than the total: favourable net price realisation of 3.6% offset by lower volume and mix of 2.2%. In measured retail channels its volumes fell 4.6% while the salty-snack category's grew 1.1%, and its retail dollars grew 0.3% against the category's 0.8%. A year earlier the arrows pointed the other way — Utz volumes up 3.4% against a category down 0.9%.

The reversal has an author. PepsiCo, whose Frito-Lay unit holds roughly 62% of the US salty-snack market, cut prices on its core brands in February and won back shelf space, and its North America food volume turned positive at 2% for the first time in over two years. The category's volume recovery was bought by the leader's discount, and Utz was raising net price into it.

What improved was cost. Adjusted gross margin reached 33.2% from 31.7%, driven by productivity savings that more than offset supply-chain inflation, and net leverage fell 0.6 turns to 3.5x. "I was pleased with our execution in the quarter and the business performance through the first half, including the continued year-over-year improvement in adjusted free cash flow and net leverage," chief executive Howard Friedman said with the 5 August results. The delivery-route programme that once flattered selling costs is over: substantially all of Utz's direct-store-delivery routes were independent-operator managed as of 28 September 2025, and the company's own accounting notes that the saved selling cost comes back as a permanent discount to independent operators, reducing both net sales and gross profit.

The names nobody bid for

J&J Snack Foods sells nearly the same calories through a different meter — soft pretzels, churros and ICEE frozen beverages billed to stadiums, theatres and school cafeterias, with a machine estate it owns and services. Fiscal third-quarter net sales fell 6.2% to $426.0m, Food Service down 8.3%, and the razor-and-blade inverted: beverage sales rose 5.9% on theatre and mass traffic while machine sales fell $7.3m and service fell $3.4m. Gross margin expanded to 35.45% from 33.03% as management exits low-margin bakery items, yet operating income fell 23.6%. "Fiscal 2026 has been a year of disciplined transformation," chief executive Dan Fachner told investors on 5 August, promising a return to top-line growth in fiscal 2027. The shares, at 29.9x trailing earnings and 18.1x forward, already price that promise; consensus has revenue falling 4.6% this year before rising 2.0%.

Flowers Foods, the baker of Nature's Own and Dave's Killer Bread, is the harder case. Second-quarter revenue fell 4.0% to $1.193bn with operating income down 27.1%, total volume down 5.8% and fresh bread down 9.5%. Guidance was cut and the dividend reset to $0.125 a quarter from $0.2475 to prioritise debt reduction. "Our second quarter results did not meet our expectations," chairman and chief executive Ryals McMullian said on the 21 August call, citing household budgets, shifting preferences and competitive activity; management added that rivals have not followed its 2026 pricing moves. The equity optics look like a bargain — 7.05x forward earnings, 0.89x book — but that multiple is struck on a fiscal 2027 estimate of $0.79 a share, itself down 23.2%, and at the enterprise level Flowers and J&J Snack Foods trade within half a turn of each other near 11x trailing earnings before interest, taxes, depreciation and amortization. Leverage is doing the flattering.

The shelf, not the ticker

The pressure is category-wide: Simply Good Foods is down 59.6% over twelve months, Campbell's 37.9%, General Mills 36.4%. Two input legs are confirmed — the USDA forecasts canola oil at 78 cents a pound, up 11%, and freight expenditures are running about 9% higher year on year — while demand leaks at the top: households starting GLP-1 medications cut grocery spending 5.3% within six months, with savory snacks off about 10%. Bernstein cut four large packaged-food names to underperform in June on exactly that pairing of cost and appetite.

So the verdict splits cleanly. Utz's share price earns nothing from its own trading — volume and share went backwards, and the gain is a contract, not a turn. What Intersnack is buying is brands, shelf coverage and a completed route structure at a price the public market refused to pay; the premium measures the market's error, not Utz's momentum. J&J Snack Foods' and Flowers' declines, by contrast, are paid for in full by their own revenue, volume and guidance lines, and the cheapest-looking of the two is cheap against an estimate that keeps falling.

When the vote clears and the listing ends, the snack aisle loses the one quote that was not being set by what happens at the register.