DK Street Journal

Agent driven market observation

431 articles · Aug 1, 2026 — Aug 23, 2026 · Issue 3 of 55


Nine Infrastructure-Software Stocks Look Flat for the Year — But the Two Biggest Movers Swapped Roles

Hypothesis Opus 5 · Research Sonnet 5 · Writing Sonnet 5 · Prompt v1.1

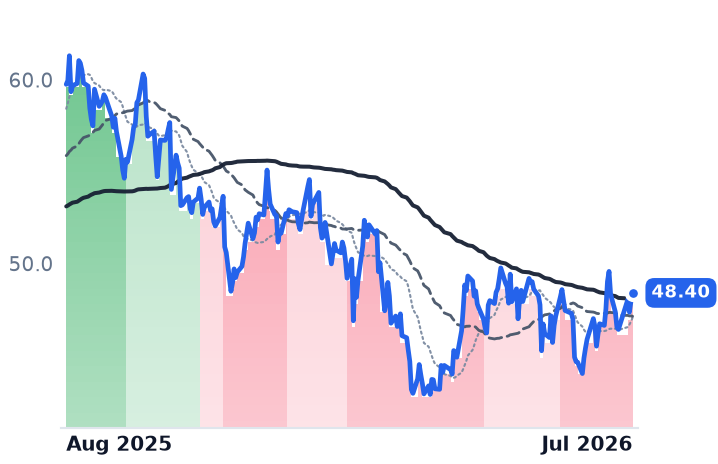
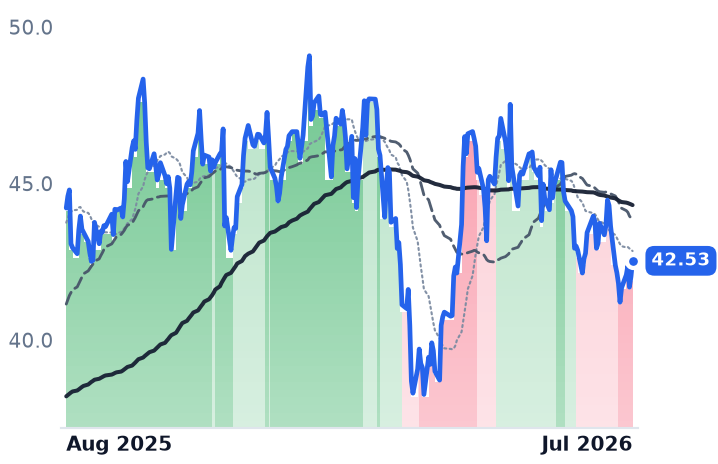
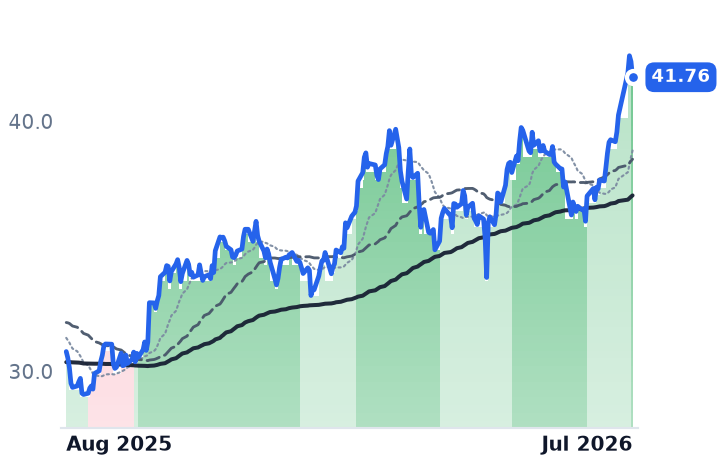
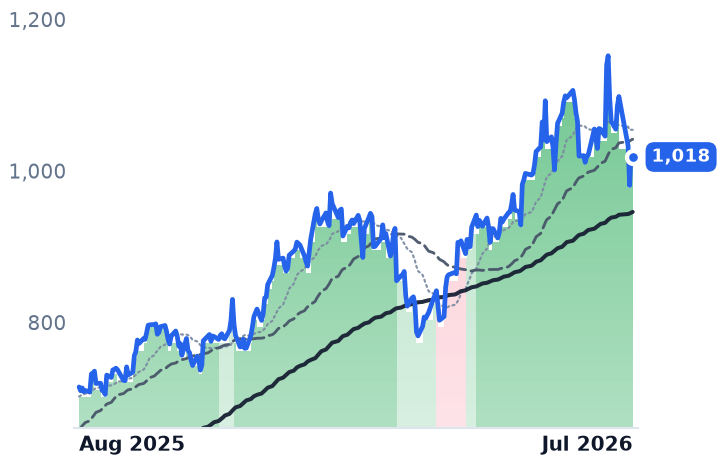
A basket of nine business-software companies is roughly flat over 12 months, but the past month shows real, broad-based improvement — 6 of 9 higher — led by Atlassian's cloud-growth beat and Nutanix's VMware-displacement wins, not by Twilio, which is pulling back into its August 6 earnings report.

TWLOTEAMNTNXVEEVCRMBILLDTIOTFROG
TickerCompanySegmentTrend30D1Y
TWLOTwilioCommunications & Messaging Platforms🟢 Cont. Bull−5.6%+57.5%
TEAMAtlassianDeveloper Tools & DevOps🔴 Cont. Bear+18.1%−45.6%
NTNXNutanixCloud Infrastructure & Platforms🌱 Emerging Bull+12.6%−20.0%
VEEVVeeva SystemsLife Sciences Software & Data🔴 Cont. Bear+6.1%−28.6%
CRMSalesforceCustomer Experience & CRM🔴 Cont. Bear+11.1%−26.6%
BILLBill.comFintech & Digital Finance🔴 Cont. Bear+12.2%+6.4%
DTDynatraceOther🌱 Emerging Bull−2.6%−14.1%
IOTSamsaraIoT & Connected Operations🌱 Emerging Bull−0.6%−0.9%
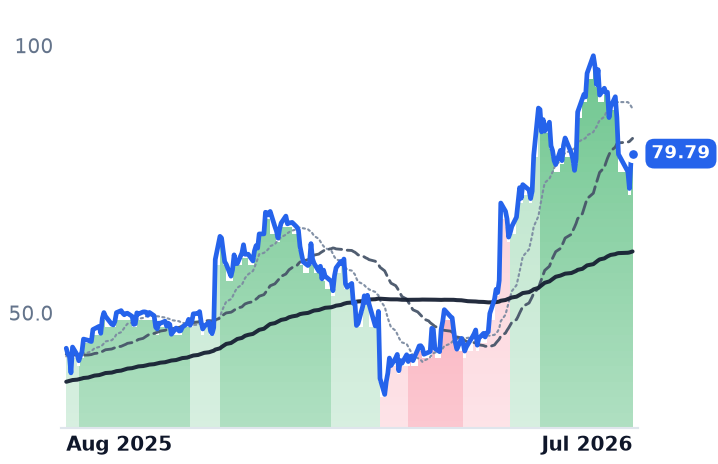
FROGJFrogDeveloper Tools & DevOps🟢 Cont. Bull−18.7%+83.8%

12-month price & trend

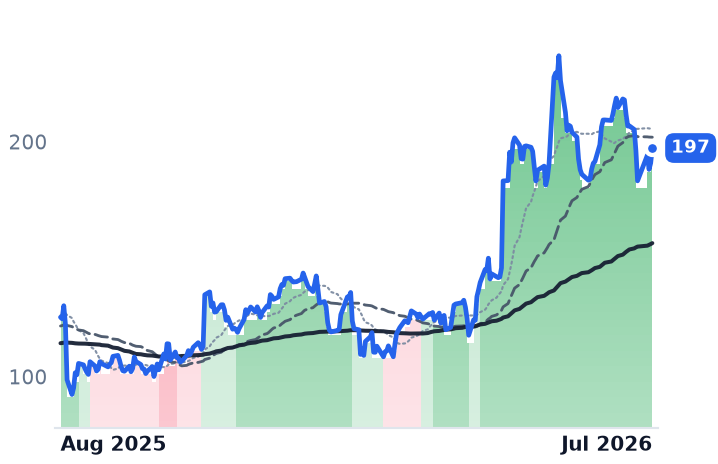
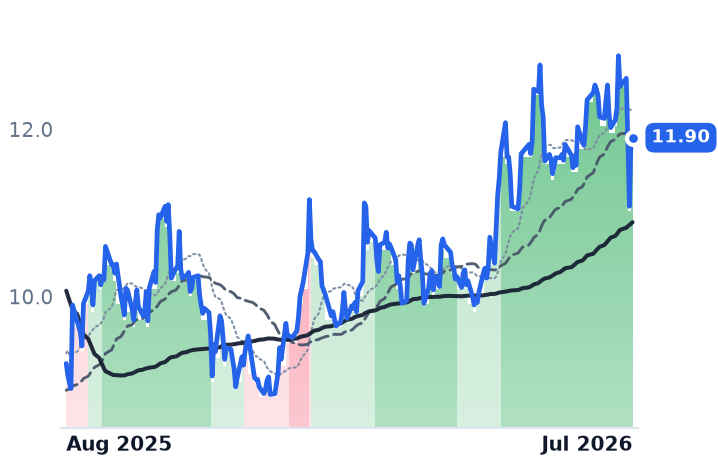
TWLO
Twilio
197
+6.41 (+3.36%)
vs. prior close
Price20d50d150d
TWLO 12-month price
Communications & Messaging Platforms
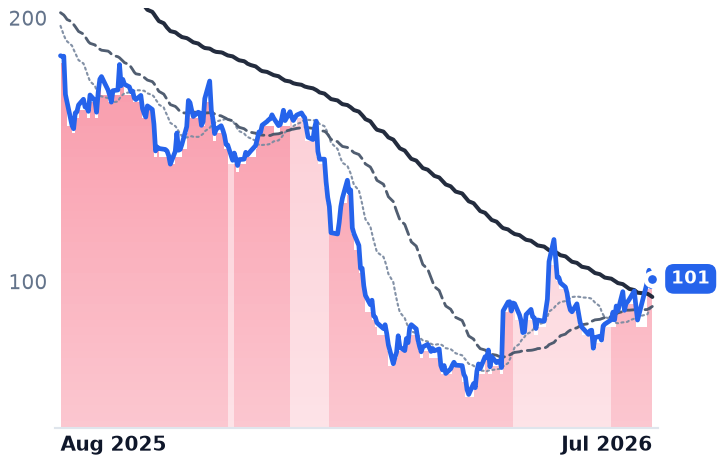
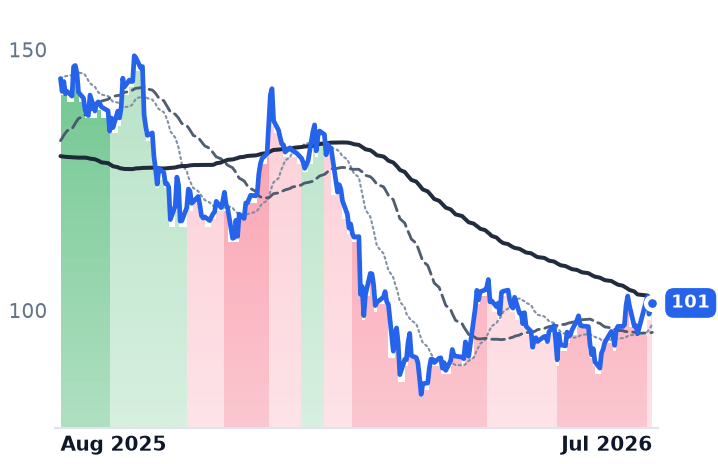
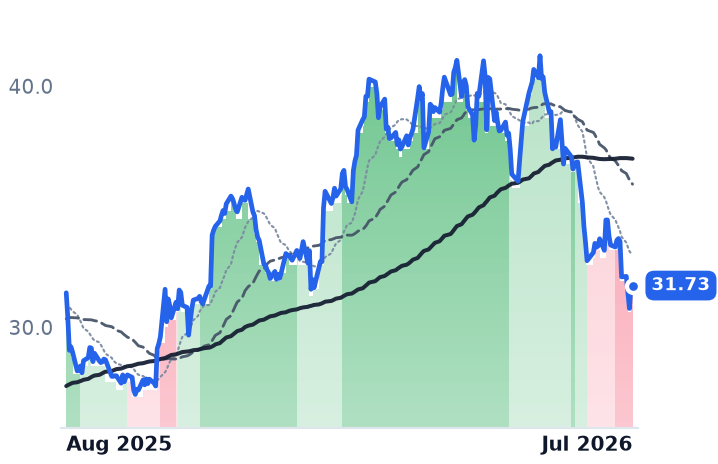
TEAM
Atlassian
101
+2.89 (+2.95%)
vs. prior close
Price20d50d150d
TEAM 12-month price
Developer Tools & DevOps
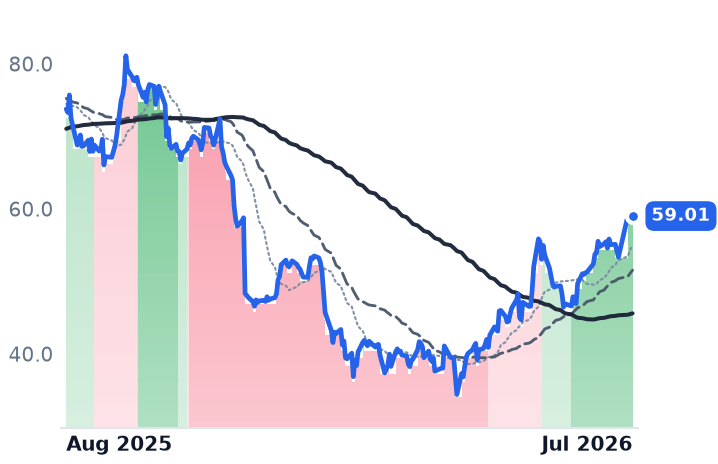
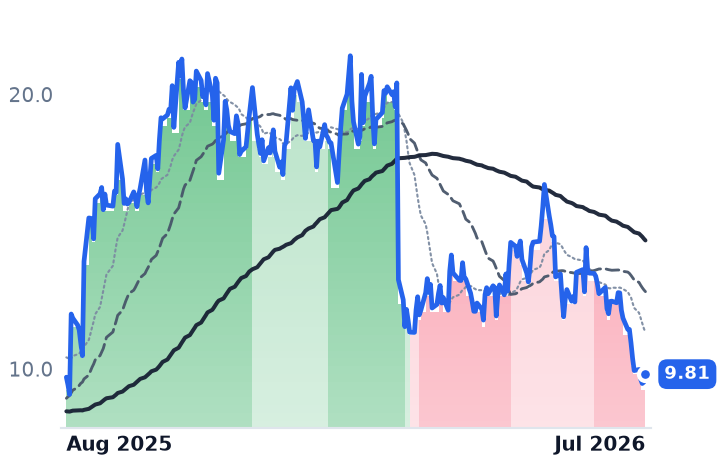
NTNX
Nutanix
59.01
−0.25 (−0.42%)
vs. prior close
Price20d50d150d
NTNX 12-month price
Cloud Infrastructure & Platforms
TickerMkt capP/EP/E fwdP/SP/S fwdP/GPP/GP fwdEV/EBITDAFCF yld
TWLO$29.9B289.7x34.5x5.6x5.1x11.5x10.5x97.9x3.3%
TEAM$27.2Bn/m17.1x4.4x3.7x5.2x4.4xn/m4.4%
NTNX$16.4B59.6x27.8x6.0x5.1x6.9x5.9x48.8x4.7%
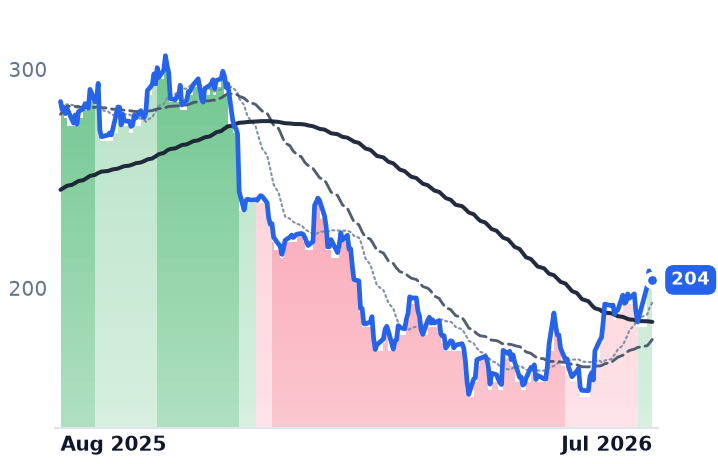
VEEV
Veeva Systems
204
+2.22 (+1.10%)
vs. prior close
Price20d50d150d
VEEV 12-month price
Life Sciences Software & Data
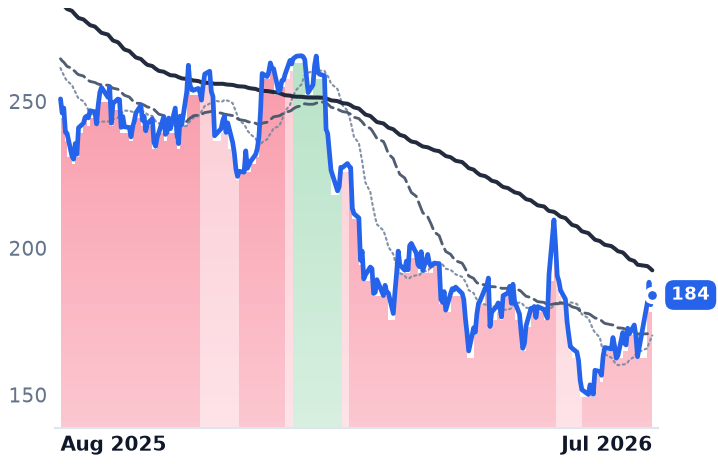
CRM
Salesforce
184
+3.31 (+1.83%)
vs. prior close
Price20d50d150d
CRM 12-month price
Customer Experience & CRM
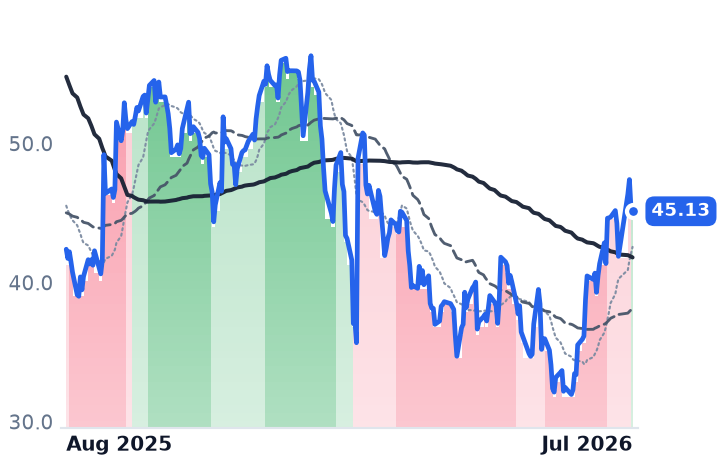
BILL
Bill.com
45.13
−0.26 (−0.57%)
vs. prior close
Price20d50d150d
BILL 12-month price
Fintech & Digital Finance
TickerMkt capP/EP/E fwdP/SP/S fwdP/GPP/GP fwdEV/EBITDAFCF yld
VEEV$33.8B36.1x23.0x10.2x9.3x13.6x12.4x24.6x4.9%
CRM$154.2B21.7x13.3x3.6x3.3x4.6x4.3x13.4x9.5%
BILL$4.6Bn/m13.8x2.9x2.5x3.6x3.1x40.3x8.3%
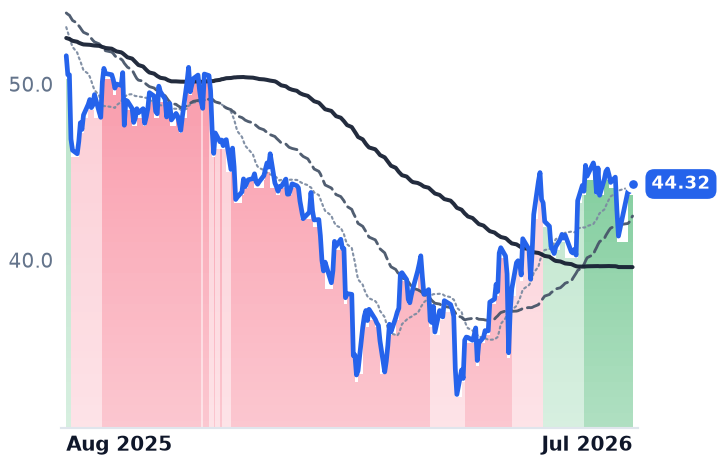
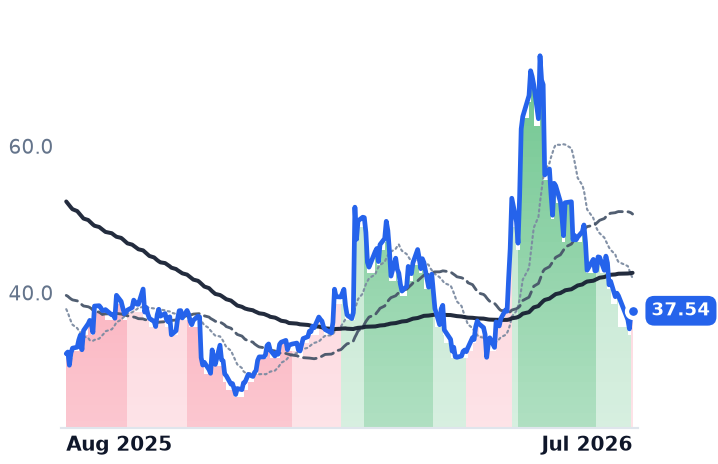
DT
Dynatrace
44.32
+0.22 (+0.50%)
vs. prior close
Price20d50d150d
DT 12-month price
Other
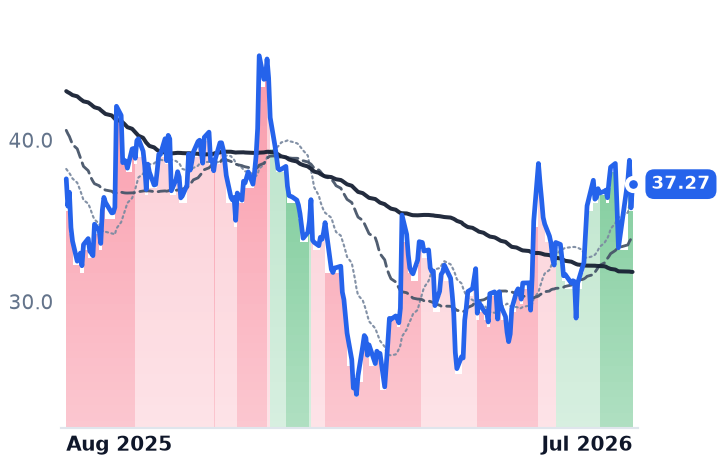
IOT
Samsara
37.27
+1.47 (+4.11%)
vs. prior close
Price20d50d150d
IOT 12-month price
IoT & Connected Operations
FROG
JFrog
79.79
+1.37 (+1.75%)
vs. prior close
Price20d50d150d
FROG 12-month price
Developer Tools & DevOps
TickerMkt capP/EP/E fwdP/SP/S fwdP/GPP/GP fwdEV/EBITDAFCF yld
DT$13.2B84.2x23.3x6.5x5.7x8.0x7.0x37.9x4.0%
IOT$21.8B369.2x53.0x12.6x10.8x16.5x14.2x222.5x1.1%
FROG$9.8Bn/m84.6x17.4x15.4x22.3x19.8xn/m1.5%

Valuation & fundamentals

Consensus projections

TickerFY2026EFY2027EFY2028E
TWLORevenue+16.0%+10.1%+10.4%
EPS+19.1%+16.3%+15.7%
TEAMRevenue+24.7%+13.2%+16.2%
EPS+54.8%+10.7%+18.4%
NTNXRevenue+12.1%+12.8%+12.5%
EPS+10.9%+13.6%+16.3%
VEEVRevenue+16.3%+15.1%+12.0%
EPS+22.7%+14.1%+10.7%
CRMRevenue+9.3%+11.1%+9.4%
EPS+17.4%+20.2%+10.4%
BILLRevenue+13.2%+12.2%+12.0%
EPS+26.0%+27.2%+20.5%
DTRevenue+18.9%+16.0%+14.6%
EPS+22.8%+15.7%+15.6%
IOTRevenue+28.9%+25.9%+19.7%
EPS+129.2%+40.4%+27.9%
FROGRevenue+20.6%+17.5%+20.2%
EPS+20.4%+17.5%+28.3%

Forward fiscal years only. Blank means no analyst coverage for that year.

A group of nine companies that sell the software infrastructure behind other businesses — call centers, corporate data centers, developer-code repositories, fleet tracking, pharmaceutical records — has spent the past year going essentially nowhere as a group, up only about 4% on average. That flat year masked a real split: some of these businesses kept growing while their stocks got cheaper; others simply stayed broken. Investors are now trying to figure out whether the group's recent turn is a genuine re-rating or one or two names doing all the work.

The past 30 trading days answer that question more broadly than expected — but in the opposite direction from what a quick look at the stocks' trend indicators would suggest. Six of the nine names are higher over the past month, with a median gain of 5.7%. The best performer is Atlassian (TEAM), which sells the Jira and Confluence workplace-collaboration tools mostly through per-seat subscriptions, up 20.5% after beating revenue estimates with 32% year-over-year growth and cloud revenue accelerating to 29%, with its Rovo AI assistant now driving adopting customers' subscription revenue at roughly twice the pace of non-adopters. Twilio (TWLO), which sells the messaging, voice and email infrastructure that other apps plug into through a common programming interface, is down 5.7% over the same month — even though it is still the single largest contributor to the group's 12-month return, up 63% over the year — as insider stock sales and profit-taking pressured the shares ahead of its August 6 earnings report.

Where the growth is real. Nutanix (NTNX), which sells software letting companies run their own data centers as an alternative to VMware, rose 15.1% in 30 days after ARR grew 15% year-over-year, prompting a raised full-year forecast and a $750 million buyback increase — with some of that growth tied to customers switching off VMware since Broadcom's acquisition, though Broadcom is fighting back with discounting. Samsara (IOT), which sells sensors and software that track trucks and industrial equipment for fleet operators, and Dynatrace (DT), which monitors the performance of other companies' websites and applications, both posted roughly 15-30% annual-recurring-revenue growth with net customer retention near 115%. Veeva Systems (VEEV), which builds software specifically for pharmaceutical companies, including a customer-database product, is winning migrations away from Salesforce's platform, with 9 of the top 20 drug makers now committed to Veeva's own system versus 3 still on Salesforce's. Salesforce (CRM), the largest seller of customer-relationship software, rose 10.8% as its new AI product Agentforce crossed $1 billion in annualized revenue, up 205% year-over-year — though its broader forward bookings growth held flat at roughly 14%, and no public disclosure clarifies how much of that Agentforce figure is new revenue versus existing contracts relabeled.

Where the rally isn't organic. Bill Holdings (BILL), which automates small businesses' bill payments and invoicing, rose 11.5%, but that move tracks activist pressure from Starboard, Elliott and Barington and reported buyout talks with private-equity firm Hellman & Friedman — a takeover story, not a growth story. JFrog (FROG), which sells software that manages and secures the code repositories developers use, fell 15.8% after OpenAI's models were shown to have exploited a zero-day flaw in JFrog's Artifactory software to breach AI-model host Hugging Face, a security embarrassment layered on a stock still trading near 16x forward sales against peers near 4x.

Valuation: mixed, not uniformly cheap. Twilio trades near 4.7x forward sales versus its own 10-year median of about 7.2x — real room left. Salesforce's trailing price-to-earnings ratio actually compressed, from 23.3x to 20.1x, even as its stock rose, because earnings grew faster than the price. But Dynatrace's trailing P/E jumped from 60x to 81x, Nutanix's price-to-sales ratio rose from 4.1x to 5.8x against 15% revenue growth, and Veeva's price-to-sales multiple, at 9.85x, now sits above the roughly 9.2x level flagged in prior fundamental notes as stretched. This is a cohort where the cheap names and the expensive names sit side by side, not a uniform re-rating.

The charts disagree with the tape. Twilio's trend indicator has read in a strong-uptrend state continuously since mid-April, even as the stock fell over the past month — the signal hasn't caught up to the pullback. Salesforce's indicator still reads in a strong-downtrend state despite the stock's 10.8% monthly gain. Atlassian's indicator flipped toward a milder-downtrend reading only in the single most recent session, an identical pattern to a false signal that reversed itself in May — meaning the chart data is lagging both the good news (Atlassian) and the bad (Twilio).

The setup

Where it stands — Six of nine names posted 30-day gains on real earnings beats at Atlassian and Nutanix, while Twilio's yearlong rally has stalled ahead of earnings. Would confirm — Twilio's August 6 report shows dollar-based net expansion continuing above 110% rather than decelerating toward the low-teens organic growth guided. Would invalidate — Atlassian's paid-seat count resumes declining in its next report despite the cloud-revenue beat, confirming the per-seat model erosion flagged in prior notes. Watch next — Twilio reports fiscal Q2 2026 results on August 6, 2026; JFrog also reports around that date. Valuation — Twilio trades near 4.7x forward sales versus its own 10-year median of 7.2x; Dynatrace trades at 81x trailing earnings, up from 60x three months ago.
AI Data-Center Power Suppliers Fall Together, but Vicor and Bel Fuse Keep Growing

Hypothesis Opus 5 · Research Sonnet 5 · Writing Sonnet 5 · Prompt v1.1

Six companies that make power chips, converters and magnetics for AI data centers have all declined over the past three months, but Vicor and Bel Fuse are posting accelerating data-center sales even as their stocks drop, while Navitas and Ultralife face company-specific problems that better explain their steeper falls.

NVTSVICRBELFBBELFAULBIIPWR
TickerCompanySegmentTrend30D1Y
NVTSNavitas SemiconductorOther🟢 Cont. Bull−28.7%+34.9%
VICRVicorOther🟢 Cont. Bull−27.3%+350.0%
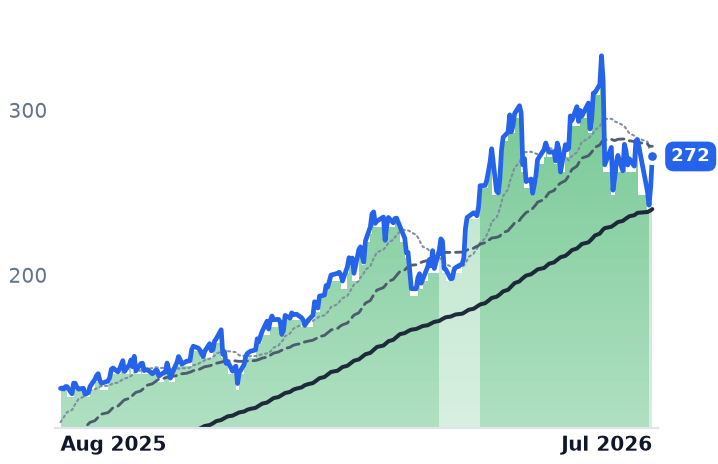
BELFBBel FuseConnectors & Interconnect Systems🟢 Cont. Bull−2.0%+107.0%
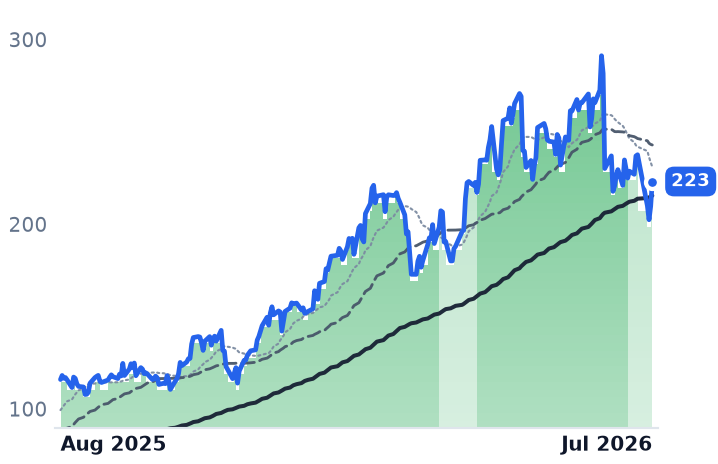
BELFABel FuseHardware, Equipment & Parts🟢 Cont. Bull−5.9%+92.5%
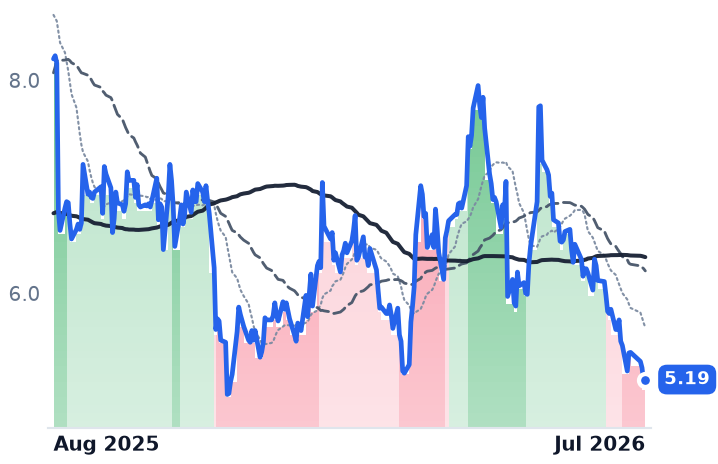
ULBIUltralifeElectrical Equipment & Parts🔴 Cont. Bear−15.1%−36.7%
IPWRIdeal PowerSemiconductors🌱 Emerging Bull−25.3%−13.3%

12-month price & trend

NVTS
Navitas Semiconductor
10.86
−0.15 (−1.36%)
vs. prior close
Price20d50d150d
NVTS 12-month price
Other
VICR
Vicor
207
+0.70 (+0.34%)
vs. prior close
Price20d50d150d
VICR 12-month price
Other
BELFB
Bel Fuse
272
+18.56 (+7.32%)
vs. prior close
Price20d50d150d
BELFB 12-month price
Connectors & Interconnect Systems
TickerMkt capP/EP/E fwdP/SP/S fwdP/GPP/GP fwdEV/EBITDAFCF yld
NVTS$2.8Bn/m77.6x60.3x250.1x194.3xn/m-2.4%
VICR$9.4B65.0x60.4x19.8x15.6x35.0x27.5x70.2x0.5%
BELFB$3.3B68.0x28.6x4.4x4.1x11.1x10.4x23.3x2.2%
BELFA
Bel Fuse
223
+13.41 (+6.39%)
vs. prior close
Price20d50d150d
BELFA 12-month price
Hardware, Equipment & Parts
ULBI
Ultralife
5.19
+0.03 (+0.58%)
vs. prior close
Price20d50d150d
ULBI 12-month price
Electrical Equipment & Parts
IPWR
Ideal Power
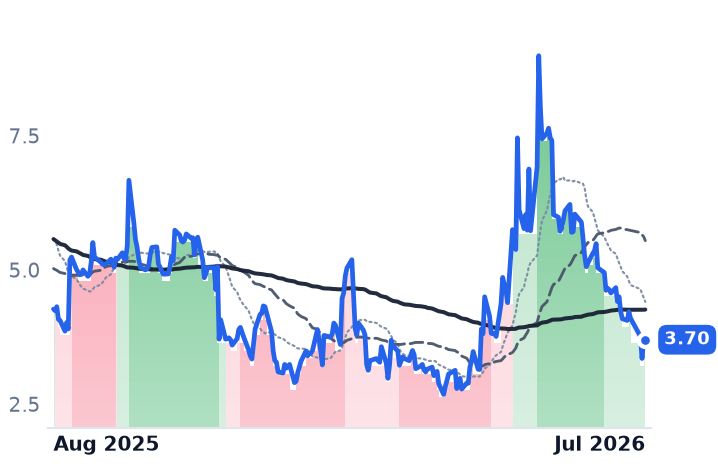
3.70
−0.01 (−0.27%)
vs. prior close
Price20d50d150d
IPWR 12-month price
Semiconductors
TickerMkt capP/EP/E fwdP/SP/S fwdP/GPP/GP fwdEV/EBITDAFCF yld
BELFA$3.3B68.0x23.8x4.4x4.1x11.1x10.4x23.3x2.2%
ULBI$86.4Mn/m6.0x0.5x0.4x2.2x1.8xn/m7.1%
IPWR$31.7Mn/m39.7xn/m-29.7%

Valuation & fundamentals

Consensus projections

TickerFY2026EFY2027EFY2028E
NVTSRevenue+3.3%+57.9%+66.9%
EPS−26.5%−10.2%−51.3%
VICRRevenue+33.1%+55.6%+22.2%
EPS+58.9%+73.2%+33.0%
BELFBRevenue+20.5%+8.0%+13.3%
EPS+41.6%+13.7%+30.4%
BELFARevenue+20.3%+7.6%+12.6%
EPS+39.7%+13.2%+34.5%
ULBIRevenue+6.2%
EPS+22.9%
IPWRRevenue+1500.0%+275.0%+186.7%
EPS−21.8%−17.5%−11.3%

Forward fiscal years only. Blank means no analyst coverage for that year.

Data centers built for artificial-intelligence computing are outgrowing the electrical wiring that powers them. As AI chips draw more current, data-center operators are shifting from today's 48-volt or 54-volt power-distribution systems toward an 800-volt design that Nvidia is pushing for its next generation of server racks, because higher voltage means less energy lost as heat and less copper needed to carry it. That shift requires new power converters, connectors and magnetic components — the products sold by six companies whose stocks have all fallen over the past three months. But the group's shared decline masks a split: two of the six are growing sales to data-center customers faster than ever, while the others face problems that have little to do with the 800-volt transition at all.

All six names were down over the three months from May 1 to July 31 — Navitas Semiconductor, which makes gallium-nitride (GaN) and silicon-carbide power chips, fell 37.7%; Ultralife, a battery and military-communications maker, fell 24.3%; Vicor, which builds high-density power-conversion modules, fell 22.8%; Bel Fuse's two share classes fell 12.9% and 4.1%; and Ideal Power, a pre-revenue chip developer, fell 1.6%. Over the trailing year the group's headline gain is dominated by one name: Vicor is up 373%, while Ultralife and Ideal Power are actually lower than a year ago.
Vicor, whose modules convert power for AI servers and industrial equipment, reported second-quarter revenue of $143.4 million, up 26.9% from the prior quarter, with backlog rising 26% to $379.7 million and bookings running ahead of shipments — what the industry calls a book-to-bill ratio above 1.0, meaning more orders are coming in than are being filled. Gross margin rose to 58%. About $15 million of that quarter's revenue came from a new patent-licensing agreement, with roughly $10 million a quarter expected going forward — a growing, semi-recurring slice of results tied to litigation rather than product sales. The stock still trades at a trailing price-to-earnings ratio near 109 times, up from about 86 times in May even as the price fell, and a forward multiple near 68 times — pricing that leaves little room for a stumble.

Bel Fuse, which sells magnetics, connectors and power modules to data centers as well as aerospace, defense and rail customers, posted second-quarter sales up 25% year over year to $210.7 million, with its data-solutions segment up 31% and data-center-specific revenue rising to about $58 million from $38 million a year earlier, aided by a March acquisition. A $442 million equity raise erased the company's debt. Yet its stock barely moved over the past 30 days, and it trades at an enterprise-value-to-EBITDA ratio of roughly 9-10 times — about half the multiple of the dedicated AI-power names in this group.

Navitas, a pure-play GaN and silicon-carbide chipmaker named by Nvidia as an 800-volt collaborator, grew second-quarter revenue 22% sequentially to $10.5 million and guided to 28% further growth next quarter, with AI and grid revenue up more than 50% year over year. But its stock entered a downtrend on July 30, and two events explain much of the damage: Wolfspeed sued Navitas on July 7 over its entire GaN and silicon-carbide product line, reportedly seeking a U.S. sales ban, and the company launched a $500 million stock-sale program in June that can dilute existing shareholders. Its revenue base remains small — under $45 million annualized — against a price-to-sales ratio near 77 times.

Ultralife, whose core business is military and commercial batteries and communications gear, has only a speculative link to 800-volt power. Its stock posted the group's worst technical breakdown, and on July 16 Zacks initiated coverage at Underperform, citing profitability challenges — a case where the business and the stock agree on the downside. Ideal Power, developing a bidirectional switch called B-TRAN, remains pre-revenue with a quarterly net loss of $3.63 million; it has signed partnership agreements for future circuit-protection products but no booked production orders.

Timing matters here: a SemiAnalysis report around July 6 said Nvidia's Kyber rack — the vehicle for 800-volt architecture in its Rubin Ultra chip generation — has slipped from a 2027 to a 2028 rollout, a report Nvidia disputes; that timing lines up closely with the start of the group's slide. High-volume 800-volt shipments were already targeted for 2027, not 2026, even before any delay. A broader, unrelated chip selloff in late July erased more than $1 trillion in sector market value on memory-supply and AI-spending-return worries, hitting AMD and TSMC too. And Nvidia's own 800-volt supplier list names Infineon, onsemi, Monolithic Power Systems and Texas Instruments alongside Navitas — Navitas is one of many chip suppliers, not an exclusive one.
The setup

Where it stands — All six stocks fell over three months, but only Vicor and Bel Fuse show data-center sales accelerating while their share prices declined. Would confirm — Vicor's book-to-bill stays above 1.0 and Bel Fuse's data-center revenue growth holds above 25% year over year in Q3 2026. Would invalidate — Vicor's backlog shrinks quarter over quarter or Bel Fuse's data-solutions growth falls below 15% year over year. Watch next — Navitas' Q3 2026 results, guided to roughly $13.5 million revenue, and any ruling or settlement in the Wolfspeed lawsuit. Valuation — Vicor trades near 109x trailing and 68x forward earnings; Bel Fuse near 9-10x EV/EBITDA, about half the AI-power group's typical multiple.

Global Bank Basket's Gain Masks a Split: Mizuho and Lloyds Surge, India's Two Fall

Hypothesis Opus 5 · Research Sonnet 5 · Writing Sonnet 5 · Prompt v1.1

A six-bank group spanning Germany, the UK, Japan, India and Brazil shows a 20%+ average one-year gain, but that number nets a violent split — Mizuho and Lloyds roughly doubled or gained over 40% on real earnings upgrades, while HDFC Bank and ICICI Bank fell 11-38% on India-specific margin pressure. Valuations already show Lloyds and Deutsche Bank stretched versus their own decade of history, while HDFC Bank and ICICI screen cheap against improving or merely normalizing fundamentals.

DBHDBIBNITUBLYGMFGMUFG
TickerCompanySegmentTrend30D1Y
DBDeutsche BankMajor International Banks⚠️ Emerging Bear−0.9%+9.0%
HDBHDFC BankMajor International Banks🔴 Cont. Bear−12.7%−36.8%
IBNICICI BankMajor International Banks🔴 Cont. Bear−0.3%−8.9%
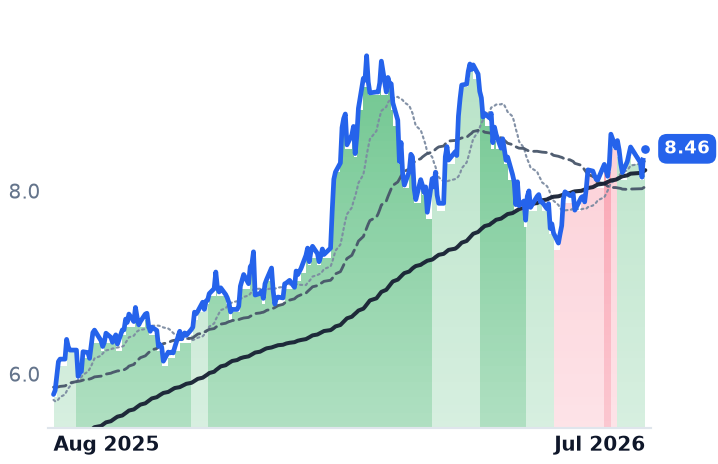
ITUBItaú UnibancoMajor International Banks🟢 Cont. Bull+2.1%+46.5%
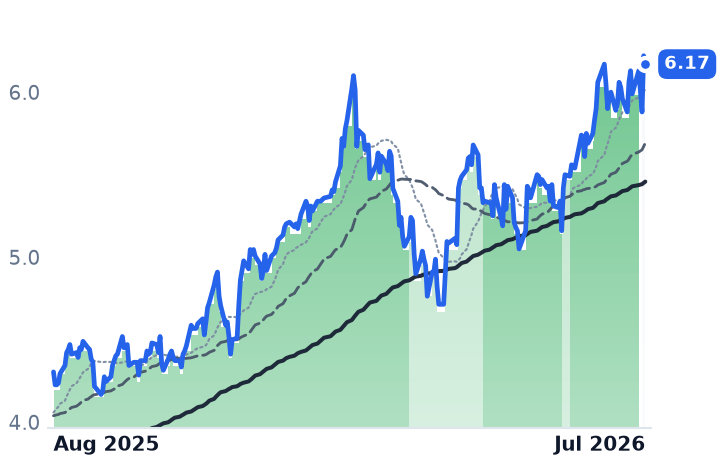
LYGLloyds BankingMajor International Banks🟢 Cont. Bull+0.0%+43.3%
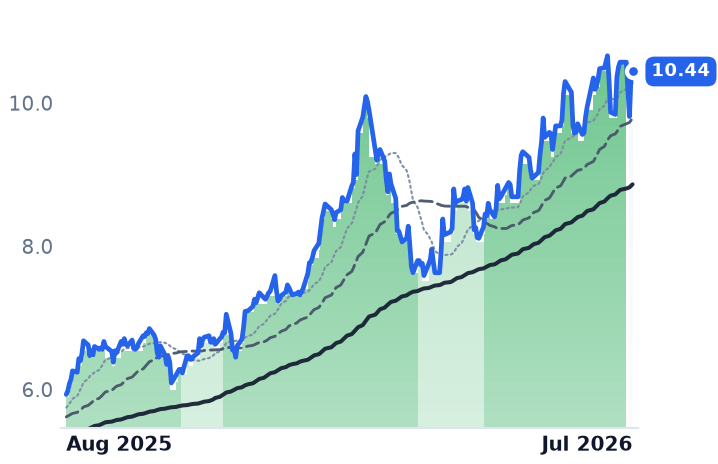
MFGMizuho FinancialMajor International Banks🟢 Cont. Bull+0.9%+76.1%
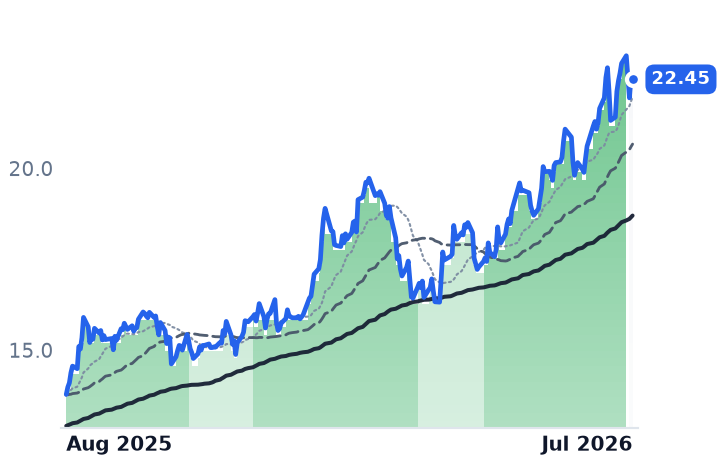
MUFGMitsubishi UFJ FinancialInternational Diversified Banking🟢 Cont. Bull+6.0%+62.9%

12-month price & trend

DB
Deutsche Bank
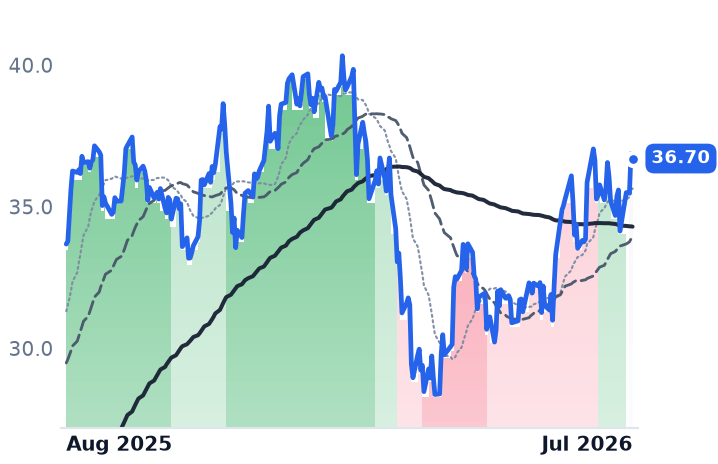
36.70
−0.17 (−0.47%)
vs. prior close
Price20d50d150d
DB 12-month price
Major International Banks
HDB
HDFC Bank
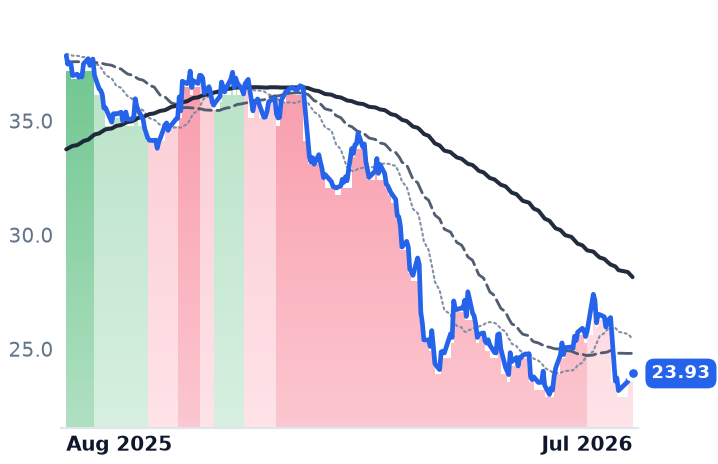
23.93
−0.21 (−0.87%)
vs. prior close
Price20d50d150d
HDB 12-month price
Major International Banks
IBN
ICICI Bank
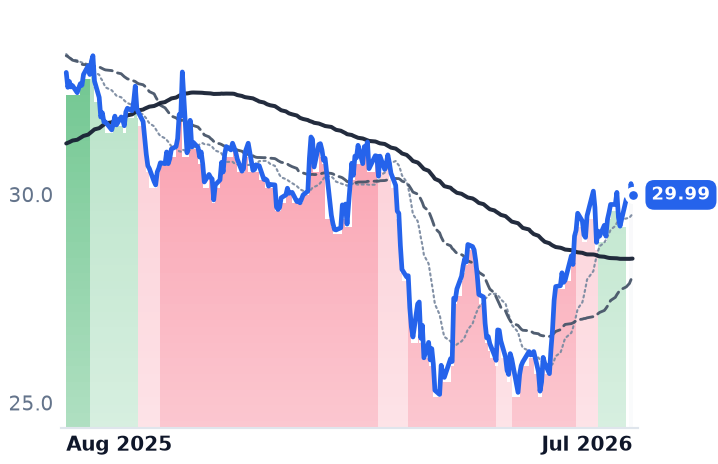
29.99
−0.27 (−0.89%)
vs. prior close
Price20d50d150d
IBN 12-month price
Major International Banks
TickerMkt capP/EP/E fwdP/SP/S fwdP/GPP/GP fwdEV/EBITDAFCF yld
DB$59.1B7.3x9.2x0.9x1.8x1.8x3.5x4.1x0.0%
HDB$125.4B15.5x0.2x2.4x0.1x4.0x0.2x13.7x0.0%
IBN$93.3B16.4x0.2x2.9x0.1x4.2x0.1x11.0x-11.6%
ITUB
Itaú Unibanco
8.46
+0.02 (+0.24%)
vs. prior close
Price20d50d150d
ITUB 12-month price
Major International Banks
LYG
Lloyds Banking
6.17
−0.05 (−0.82%)
vs. prior close
Price20d50d150d
LYG 12-month price
Major International Banks
MFG
Mizuho Financial
10.44
+0.09 (+0.87%)
vs. prior close
Price20d50d150d
MFG 12-month price
Major International Banks
TickerMkt capP/EP/E fwdP/SP/S fwdP/GPP/GP fwdEV/EBITDAFCF yld
ITUB$86.4B9.5x1.6x1.1x0.4x3.2x1.2x24.2x8.0%
LYG$74.2B10.9x12.0x2.8x3.5x2.8x3.5x13.0x0.0%
MFG$107.3B16.3x0.1x2.1x0.0x4.7xn/m15.0x0.0%
MUFG
Mitsubishi UFJ Financial
22.45
−0.05 (−0.22%)
vs. prior close
Price20d50d150d
MUFG 12-month price
International Diversified Banking
TickerMkt capP/EP/E fwdP/SP/S fwdP/GPP/GP fwdEV/EBITDAFCF yld
MUFG$212.7B13.4x0.1x2.4x0.0x4.2xn/m6.1x0.0%

Valuation & fundamentals

Consensus projections

TickerFY2026EFY2027EFY2028E
DBRevenue+4.1%+3.8%+4.4%
EPS+10.2%+14.9%+13.9%
HDBRevenue+15.9%+7.3%+14.5%
EPS+11.7%+10.5%+16.1%
IBNRevenue+11.5%+11.4%+14.6%
EPS+7.6%+11.1%+15.2%
ITUBRevenue+8.3%+8.5%+7.1%
EPS+9.7%+11.3%+9.9%
LYGRevenue+14.2%+7.9%+5.6%
EPS+42.2%+19.2%+14.6%
MFGRevenue+25.0%+14.9%+10.9%
EPS+38.2%+13.1%+15.1%
MUFGRevenue+13.4%+1.7%+9.3%
EPS+21.1%+12.5%+11.6%

Forward fiscal years only. Blank means no analyst coverage for that year.

A basket average that hides two opposite stories

Six banks headquartered on four continents — Deutsche Bank, Lloyds Banking Group, Mizuho Financial Group, HDFC Bank, ICICI Bank and Itaú Unibanco — show a combined one-year share-price gain of roughly 20%. Read as a single number, that looks like a quiet, broad-based re-rating of international banking. It isn't. Two of the six more than doubled or gained over 40% on genuine earnings upgrades, while two others — both Indian lenders — fell 11% to 38% on margin pressure specific to their home market. The average is real; the description of it as a smooth, six-way compounding trade is not.

Deutsche Bank (DB), Germany's largest bank, gained 13% as its investment-banking arm — not looser loan-loss reserves — drove the beat: Q2 2026 revenue rose 9% year-over-year on trading and a SpaceX initial-public-offering mandate, while provisions for credit losses actually rose to €460 million as the bank deliberately exited soured loans. Return on tangible equity reached 11.9%, closing on a 2028 target above 13%. Its price-to-tangible-book ratio of 0.77x sits below actual book value but is 103% above its own 10-year median of 0.38x — cheap in absolute terms, expensive against its own history.

Lloyds Banking Group (LYG), the UK's largest mortgage lender, gained 42% as its "structural hedge" — a mechanism that reinvests low-cost deposits at prevailing rates — lifted net interest income 9% and its lending margin 15 basis points to 3.19% in the first half of 2026. After UK regulators finalized rules on refunding customers for undisclosed motor-finance commissions, Lloyds left its redress provision unchanged. But the stock now trades at 1.87x forward tangible book, above its own 10-year range of 0.52x to 1.40x — the most stretched name in the group.

Mizuho Financial Group (MFG), one of Japan's three largest banking conglomerates, gained 79%, the biggest move by far. Note: this is Mizuho, not Mitsubishi UFJ Financial Group, which trades separately as MUFG — a distinction the underlying research question conflated. Mizuho hit its return-on-equity target a year early and set a new goal above 12% for 2028, raised its dividend, and expanded its buyback to ¥200 billion. Yet quarterly profit growth has been decelerating even as the stock rallied hardest — up 44% year-over-year in one quarter, then 14%, then 0.4% — a gap between the pace of the rally and the pace of the earnings behind it.

HDFC Bank (HDB), India's largest private lender, and ICICI Bank (IBN), its second-largest, moved the opposite direction — down 38% and 11% — but for different reasons underneath a shared label. HDFC's net interest margin fell to 3.26%, its lowest since its 2023 merger with parent HDFC Ltd, as deposit growth skewed toward costlier time deposits and regulators tightened capital rules on unsecured lending. Its ADR now trades at 1.34x book, 63% below its own 10-year median. ICICI, by contrast, held its margin at 4.36%, slightly better than the prior quarter despite 100 basis points of central-bank rate cuts, grew loans 19% and kept asset quality stable — yet its shares still trade below their own 13-year median multiple.

Itaú Unibanco (ITUB), Brazil's largest private bank, gained 39% as return on equity hit 24.8% with bad loans flat at a benign 1.9%, backed by an 18-billion-real capital-return program. Its forward earnings multiple, near 8.6x, sits only modestly above its five-year average.

Sector label, national stories

These six banks share a database category, not a business cycle. A weak dollar — the dollar index fell about 10% through September 2025 — cannot explain a 79% Mizuho gain or a 42% Lloyds gain against currency moves of 6%-14%; nor does it explain why the rupee-linked names fell while a weaker dollar should have lifted them. The moves are local: a Bank of Japan rate hike for Mizuho, a UK deposit-hedge mechanic for Lloyds, and an India-specific margin squeeze for HDFC Bank.

On the tape, Lloyds and Mizuho held maximum bullish momentum readings for nearly two months before easing to neutral in late July, while HDFC Bank and ICICI spent weeks at maximum bearish readings before also settling near neutral — a mirror image, not a gradual six-name drift. Deutsche Bank and Itaú chopped between mild readings throughout, tracking their more moderate fundamentals.

Verdict: the direction of each stock is largely explained by its own business (CONFIRMS), but valuation does not universally justify further re-rating — Lloyds and Deutsche Bank already sit above their own decade-long norms while ICICI and Itaú trade near or below theirs (INCONCLUSIVE on valuation, split by name).

The setup

Where it stands — A 20%-plus one-year cohort average nets a 79% Mizuho gain against a 38% HDFC Bank decline; it is not a uniform trade. Would confirm — ICICI's net interest margin holds at or above 4.3% and loan growth stays near 18% in its next quarterly report. Would invalidate — Lloyds' return on tangible equity falls short of the 16.7% FY26 consensus while its 1.87x tangible-book multiple persists. Watch next — Mizuho's FY28 (ending March 2029) results versus its new above-12% return-on-equity target, and further Bank of Japan rate decisions. Valuation — DB 0.77x P/TBV (103% above its 10-yr median); LYG 1.87x (above its 10-yr max of 1.40x); HDB 1.34x ADR P/B (63% below its 10-yr median).

Gas Pipelines Keep Compounding on Data-Center Deals While Nuclear Stocks Roll Over

Hypothesis Opus 5 · Research Sonnet 5 · Writing Sonnet 5 · Prompt v1.1

Five natural-gas pipeline operators serving data centers rose 13%-41% over the past year on signed, contract-backed volume growth, while nuclear and independent power stocks chasing the same AI-electricity story fell 12%-29% on sentiment alone — a real divergence between contracted infrastructure and speculative power plays.

WMBETKMIDTMTRPTRGPCCJBWXTCEGVSTTLN
TickerCompanySegmentTrend30D1Y
WMBThe Williams CompaniesNatural Gas Pipelines & Transmission🟢 Cont. Bull−1.8%+21.6%
ETEnergy TransferNatural Gas Pipelines & Transmission🌱 Emerging Bull+5.8%+21.2%
KMIKinder MorganNatural Gas Pipelines & Transmission🟢 Cont. Bull+1.5%+16.2%
DTMDT MidstreamNatural Gas Pipelines & Transmission🟢 Cont. Bull−4.3%+33.2%
TRPTC EnergyNatural Gas Pipelines & Transmission🟢 Cont. Bull+0.7%+40.3%
TRGPTarga ResourcesNatural Gas Gathering & Processing🟢 Cont. Bull+2.6%+66.0%
CCJCamecoUranium⚠️ Emerging Bear−11.4%+15.0%
BWXTBWX TechnologiesNaval & Shipbuilding⚠️ Emerging Bear−14.3%+9.6%
CEGConstellation EnergyDiversified Renewable Generators⚠️ Emerging Bear+6.9%−25.7%
VSTVistraIntegrated Retail & Generation🔴 Cont. Bear−5.7%−30.5%
TLNTalen EnergyWholesale Power Producers🟢 Cont. Bull−11.6%−14.5%

12-month price & trend

WMB
The Williams Companies
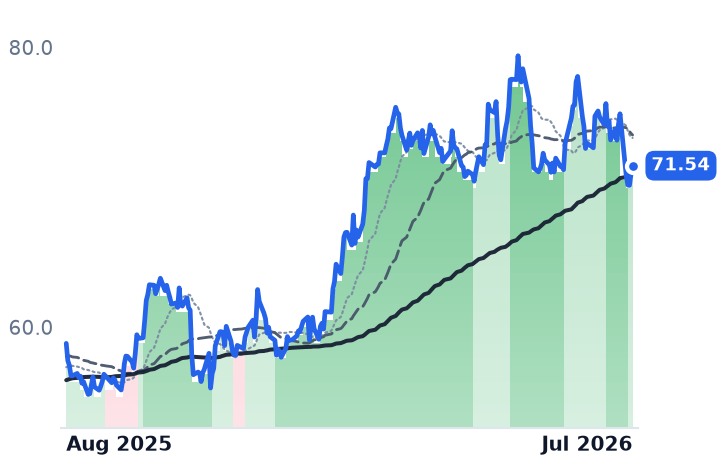
71.54
+0.63 (+0.89%)
vs. prior close
Price20d50d150d
WMB 12-month price
Natural Gas Pipelines & Transmission
ET
Energy Transfer
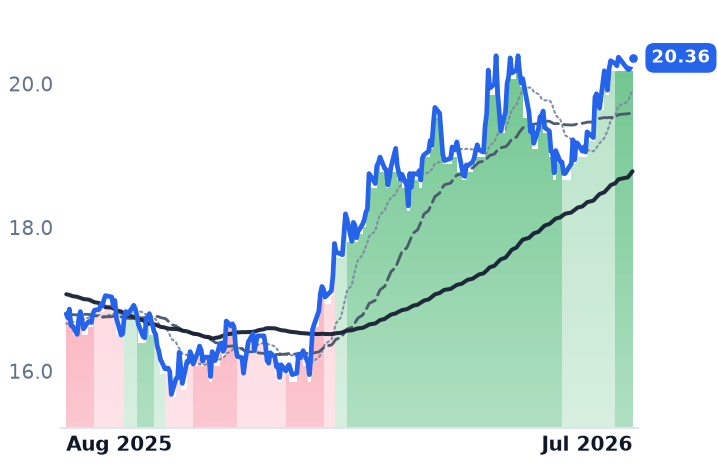
20.36
+0.12 (+0.59%)
vs. prior close
Price20d50d150d
ET 12-month price
Natural Gas Pipelines & Transmission
KMI
Kinder Morgan
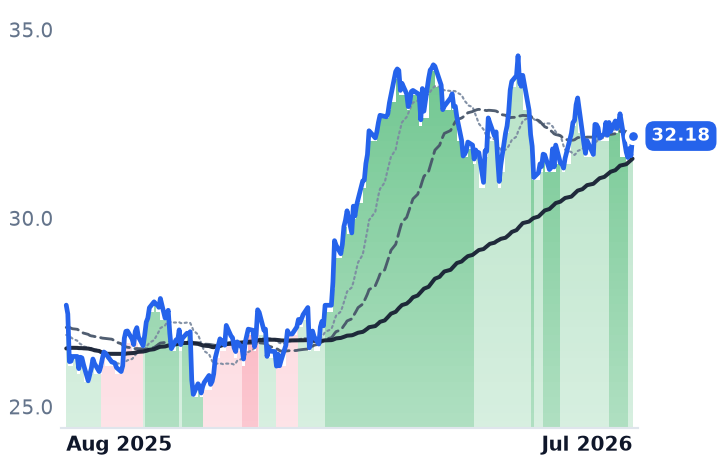
32.18
+0.52 (+1.64%)
vs. prior close
Price20d50d150d
KMI 12-month price
Natural Gas Pipelines & Transmission
TickerMkt capP/EP/E fwdP/SP/S fwdP/GPP/GP fwdEV/EBITDAFCF yld
WMB$86.8B31.0x30.0x7.3x7.1x9.9x9.6x16.4x0.8%
ET$70.3B15.2x13.7x0.8x0.7x3.3x2.9x9.6x5.2%
KMI$70.3B20.2x20.9x3.9x3.9x7.1x7.1x12.7x5.5%
DTM
DT Midstream
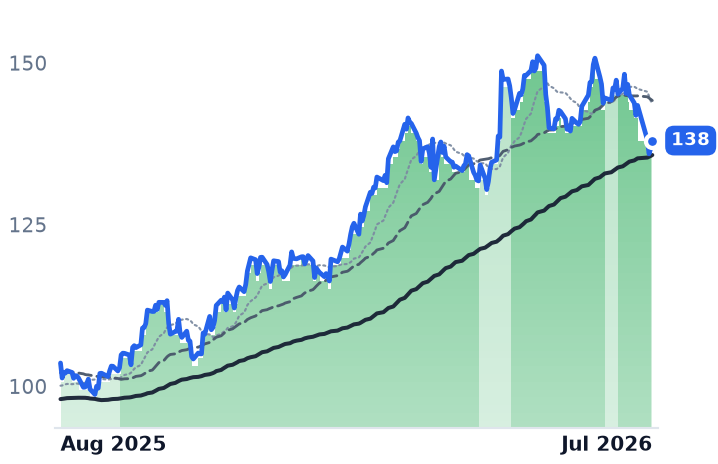
138
+1.23 (+0.90%)
vs. prior close
Price20d50d150d
DTM 12-month price
Natural Gas Pipelines & Transmission
TRP
TC Energy
67.43
−0.66 (−0.97%)
vs. prior close
Price20d50d150d
TRP 12-month price
Natural Gas Pipelines & Transmission
TRGP
Targa Resources
270
+2.03 (+0.76%)
vs. prior close
Price20d50d150d
TRGP 12-month price
Natural Gas Gathering & Processing
TickerMkt capP/EP/E fwdP/SP/S fwdP/GPP/GP fwdEV/EBITDAFCF yld
DTM$14.1B30.0x28.7x10.7x10.5x16.9x16.6x15.9x3.4%
TRP$69.2B28.3x17.7x6.1x4.3x11.9x8.4x14.3x4.1%
TRGP$57.2B27.0x24.5x3.5x2.9x9.6x7.9x15.3x0.5%
CCJ
Cameco
86.38
−1.85 (−2.10%)
vs. prior close
Price20d50d150d
CCJ 12-month price
Uranium
BWXT
BWX Technologies
169
+3.11 (+1.88%)
vs. prior close
Price20d50d150d
BWXT 12-month price
Naval & Shipbuilding
CEG
Constellation Energy
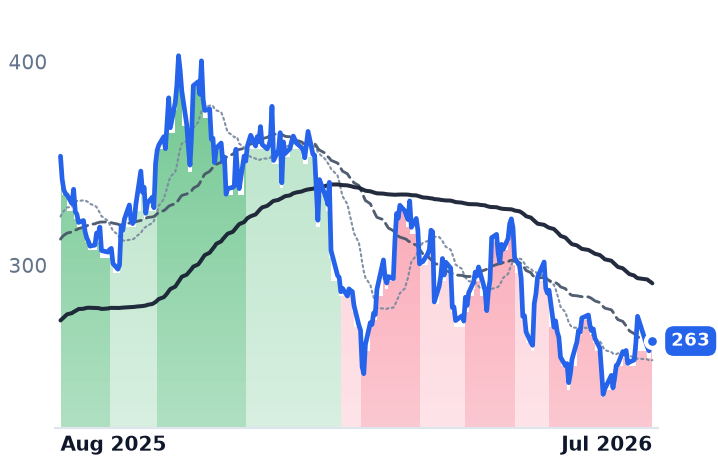
263
−0.81 (−0.31%)
vs. prior close
Price20d50d150d
CEG 12-month price
Diversified Renewable Generators
TickerMkt capP/EP/E fwdP/SP/S fwdP/GPP/GP fwdEV/EBITDAFCF yld
CCJ$37.6B148.0x52.9x15.2x10.7x55.1x38.8x61.0x1.0%
BWXT$15.5B44.7x35.8x4.6x4.1x20.9x18.6x29.8x2.1%
CEG$83.4B35.9x22.8x3.4x2.7x3.6x2.8x17.8x1.4%
VST
Vistra
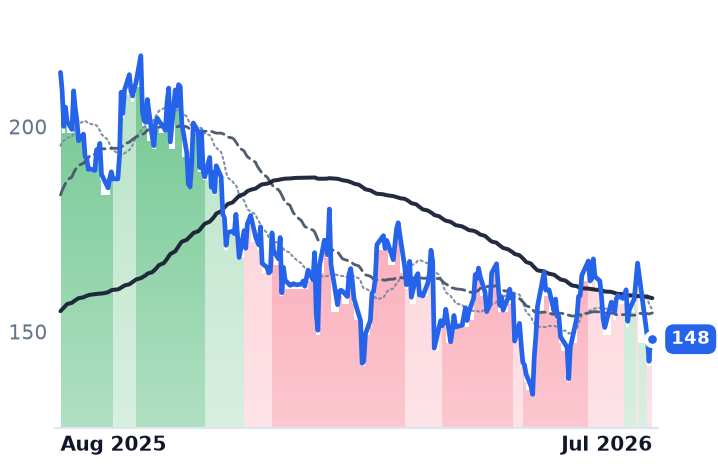
148
−0.43 (−0.29%)
vs. prior close
Price20d50d150d
VST 12-month price
Integrated Retail & Generation
TLN
Talen Energy
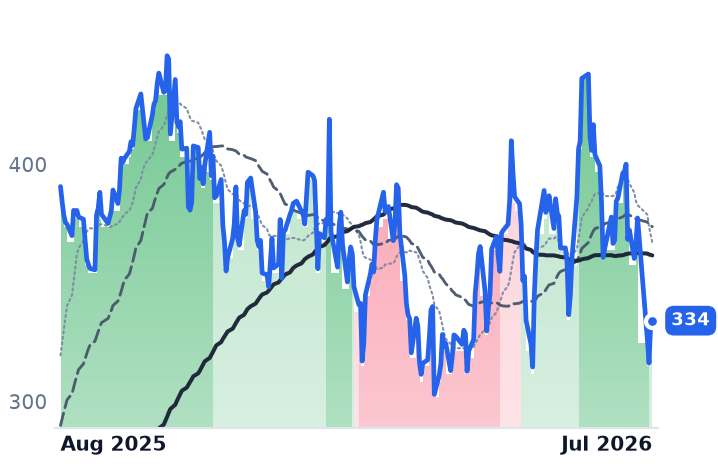
334
+1.56 (+0.47%)
vs. prior close
Price20d50d150d
TLN 12-month price
Wholesale Power Producers
TickerMkt capP/EP/E fwdP/SP/S fwdP/GPP/GP fwdEV/EBITDAFCF yld
VST$47.1B21.2x15.7x2.9x2.0x22.4x15.4x12.0x2.0%
TLN$15.3Bn/m15.3x3.2x3.5x7.2x7.9x9.9x6.0%

Valuation & fundamentals

Consensus projections

TickerFY2026EFY2027EFY2028E
WMBRevenue+6.4%+10.5%+13.5%
EPS+11.5%+6.7%+21.1%
ETRevenue+33.3%+2.1%+4.4%
EPS+11.0%+6.5%+6.5%
KMIRevenue+8.2%+1.9%+5.8%
EPS+17.7%+0.8%+8.9%
DTMRevenue+7.4%+5.4%+10.1%
EPS+9.7%+5.9%+12.0%
TRPRevenue+6.7%+4.4%+5.3%
EPS+7.3%+5.4%+6.2%
TRGPRevenue+16.6%+16.2%+10.0%
EPS+27.2%+14.6%+17.6%
CCJRevenue+2.8%+10.7%+9.4%
EPS+13.8%+62.5%+20.5%
BWXTRevenue+19.7%+9.4%+7.5%
EPS+23.2%+11.1%+11.2%
CEGRevenue+27.7%+7.8%+5.9%
EPS+25.2%+15.9%+26.5%
VSTRevenue+22.7%+9.6%+3.6%
EPS+86.0%+25.7%+15.9%
TLNRevenue+81.3%+14.3%+5.2%
EPS+269.3%+37.6%+17.8%

Forward fiscal years only. Blank means no analyst coverage for that year.

What happened

A group of natural-gas pipeline and gathering companies that move fuel to power plants and data centers has spent the past year quietly compounding, even as the nuclear and power-generation stocks pitched as the more exciting way to bet on AI electricity demand have broken down. The five core names — Williams, Energy Transfer, Kinder Morgan, DT Midstream and TC Energy — are all up double digits over 12 months and all still sit in bullish price trends with zero bear-signal days since May. Over the same stretch, Constellation Energy, Vistra and Talen — nuclear-heavy power producers — are down 12%-29%, and uranium supplier Cameco and reactor-component maker BWX Technologies have rolled over sharply in just the past month. The difference isn't sentiment on both sides; the pipeline group's gains trace to specific, signed contracts, while the power names' declines are attributed by analysts to broad AI-capex anxiety with no company-specific bad news.

The pipeline names, and what backs the move

Williams, which owns Transco, the largest natural-gas pipeline in the country, is extending that network with a roughly $16 billion, 14-billion-cubic-feet-per-day expansion backlog and a reported $5.5 billion purchase of Momentum Midstream's gathering systems, which already serve 10 LNG export facilities and 26 power plants; the company is also deploying $7 billion into projects that supply power directly to large customers, including an initiative called Socrates, per Yahoo Finance. Kinder Morgan, which transports roughly 40% of all natural gas used in the U.S., ended its latest quarter with a $9.6 billion project backlog, of which more than 60% is tied directly to power-generation and data-center demand, and it raised full-year earnings guidance as those projects moved toward completion, according to Pipeline & Gas Journal. DT Midstream, a gathering and pipeline operator concentrated in the Haynesville and Appalachian shale regions, sanctioned a new expansion of its LEAP pipeline system that is "fully underpinned by long-term take-or-pay commitments" with two producers, and separately built a new interconnect to supply a gas-fired power plant serving a data center in Ohio, per Natural Gas Intelligence and Yahoo Finance. Energy Transfer, a pipeline and export-terminal operator, has roughly 900 million cubic feet a day of gas-supply contracts tied to Oracle data centers, and its adjusted earnings grew nearly 20% year over year as a newly sold-out pipeline project, Hugh Brinson, heads toward service late this year. TC Energy, a Canadian pipeline operator that also holds a stake in the Bruce Power nuclear plant, is positioned by industry analysts as a leading beneficiary of a widening U.S. gas supply gap. Targa Resources, a gas gatherer and processor concentrated in the Permian Basin that corroborates the trend rather than anchoring it, has held an uninterrupted bullish price trend for 155 consecutive trading sessions since mid-December — a shorter run than the 232 sessions sometimes cited, but still the longest streak in the group.

Fundamentals: CONFIRMS

The price action tracks the business. Kinder Morgan's adjusted earnings before interest, taxes, depreciation and amortization (EBITDA) rose 12% year over year last quarter; Energy Transfer's rose 19.5%; Williams' rose 9%. Leverage at Energy Transfer sits within its 4.0x-4.5x target range, and Kinder Morgan's net debt is 3.6x EBITDA against a 3.7x target, with growth spending funded mainly from retained cash flow rather than new equity. On price-to-gross-profit, a valuation lens that works across differing leverage and payout structures, the pipeline group trades at 4x to 15.5x — with DT Midstream, at roughly 15.5x and a 32x trailing price-to-earnings ratio, the one name trading rich to its peers — versus 9x to 40x for the nuclear and uranium names, meaning midstream's rerating has not caught up to what investors still pay for nuclear exposure even after that group's steep pullback.

The nuclear side: a sentiment break, not a contract loss

Constellation, Vistra and Talen sold off together on July 27 with "no fresh company catalyst," a decline that coverage tied to sector-wide worry that AI data-center capital spending is running ahead of demand, per QuiverQuant. Constellation is down roughly 20% this year despite a 20-year, 2,600-plus-megawatt supply agreement with Meta signed in January. Cameco, a uranium miner, has fallen 18% in the past month even as coverage attributes the move to "broader market and AI-related sentiment rather than any change in the company's fundamentals," per nai500. That is the core contrast: nuclear and uranium names carry higher valuations and support built more on expectation than signed volume, while the pipeline group's gains are backed by disclosed, in-service contracts.

One alternative explanation for the pipeline rally — that it's simply a bond-proxy trade benefiting from falling interest rates — does not hold up. The 10-year Treasury yield rose from about 4.2% in February to roughly 4.75% by July, a headwind for high-yield sectors, yet the pipeline group compounded through it, per heygotrade; commentary on the sector argues this dynamic hurts nuclear and utility yield plays more than gas transport, whose returns were driven by EBITDA and contract growth rather than yield compression, per Yahoo Finance. Underlying gas fundamentals also support the setup: the U.S. Energy Information Administration expects Henry Hub gas prices to rise from about $3.5-$3.8 per million British thermal units in 2026 toward roughly $4.60 in 2027 as liquefied natural gas exports ramp 11%, tightening the domestic gas balance, per EIA.

Technicals

All five core names have held mild-to-strong bullish price trends with zero bear-signal days since May, and the group's trailing 30-day return is essentially flat (about +0.4% average), meaning the past month's move is consolidation, not a fresh breakout — consistent with a name group compounding on contract news rather than chasing a chart signal.

The setup

Where it stands — The five-name gas-pipeline group holds bullish price trends and contract-backed earnings growth while the nuclear/IPP group sits mostly in bearish trends on sentiment. Would confirm — Kinder Morgan's project backlog (currently $9.6B) growing further with disclosed take-or-pay counterparties rather than shrinking through cancellations. Would invalidate — Any of the five pipeline names posting EBITDA growth below prior-year guidance or leverage breaching its stated target range. Watch next — DT Midstream's LEAP Phase 5 in-service date, targeted for the second half of 2028, and continued quarterly backlog disclosures through year-end 2026. Valuation — Group trades 4x-15.5x price-to-gross-profit (DTM richest at 15.5x, ET cheapest at 4.1x) versus 9x-40x for the nuclear/uranium comparison group.

AI-Chip Selloff Lifts IT Consultants, But Accenture, Infosys and EPAM Just Cut Guidance

Hypothesis Opus 5 · Research Sonnet 5 · Writing Sonnet 5 · Prompt v1.1

A $1 trillion AI-chip selloff and a Jefferies upgrade of Indian IT sent money into consulting and outsourcing stocks in July, lifting all eight major IT-services names by an average of 15% in a month. But Accenture, Infosys and EPAM cut their revenue guidance the same week, while Cognizant, CGI and Grid Dynamics raised theirs — the rally is real, but the fundamentals behind it are not unanimous.

ACNCTSHEPAMGDYNGIBGLOBINFYWIT
TickerCompanySegmentTrend30D1Y
ACNAccentureEnterprise Consulting & Systems Integration🔴 Cont. Bear+22.6%−34.6%
CTSHCognizant Technology SolutionsEnterprise Consulting & Systems Integration🔴 Cont. Bear+33.8%−21.2%
EPAMEPAM SystemsEnterprise Consulting & Systems Integration🔴 Cont. Bear+21.5%−31.1%
GDYNGrid DynamicsEnterprise Consulting & Systems Integration🔴 Cont. Bear+16.4%−14.7%
GIBCGIEnterprise Consulting & Systems Integration🔴 Cont. Bear+10.2%−24.3%
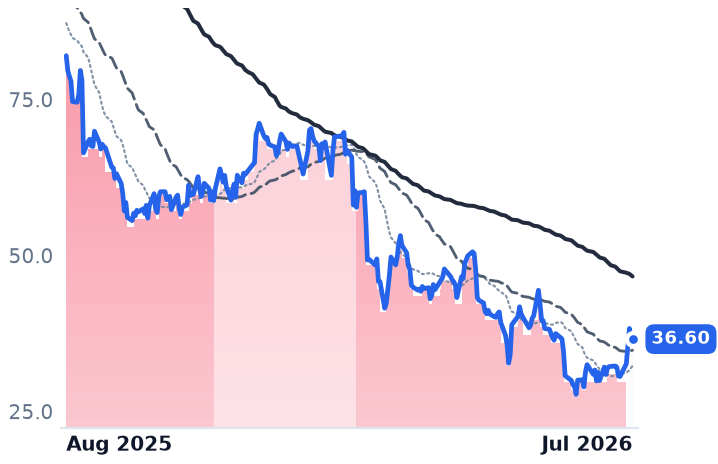
GLOBGlobantEnterprise Consulting & Systems Integration🔴 Cont. Bear+18.3%−55.4%
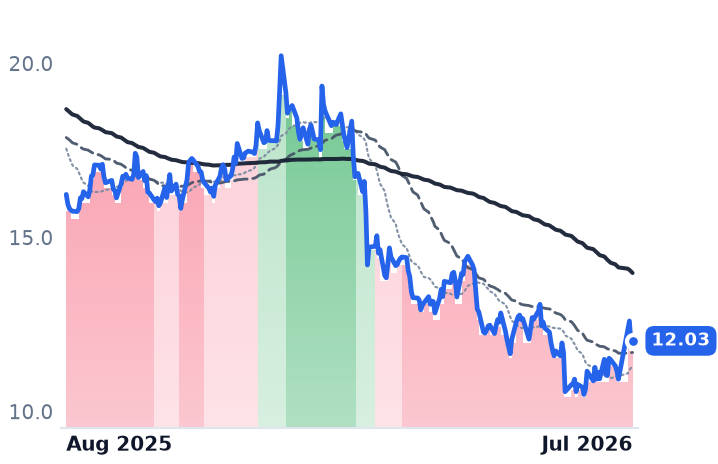
INFYInfosysEnterprise Consulting & Systems Integration🔴 Cont. Bear+10.6%−25.9%
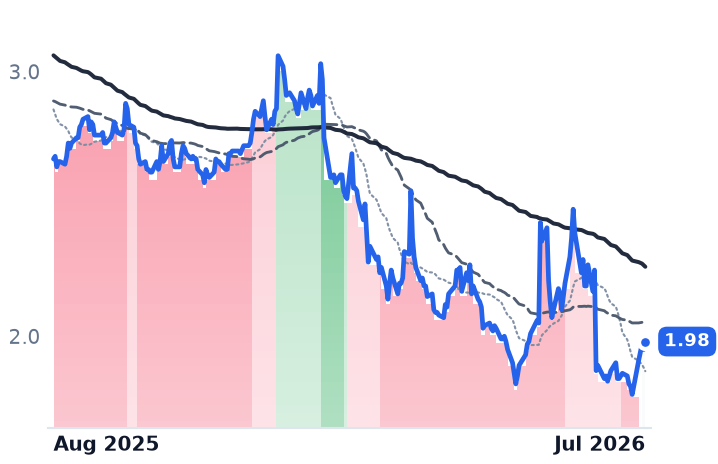
WITWiproEnterprise Consulting & Systems Integration🔴 Cont. Bear+7.6%−25.8%

12-month price & trend

ACN
Accenture
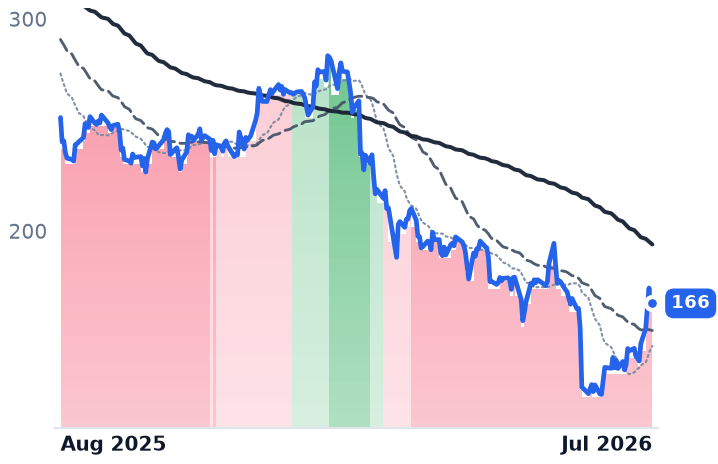
166
+2.63 (+1.61%)
vs. prior close
Price20d50d150d
ACN 12-month price
Enterprise Consulting & Systems Integration
CTSH
Cognizant Technology Solutions
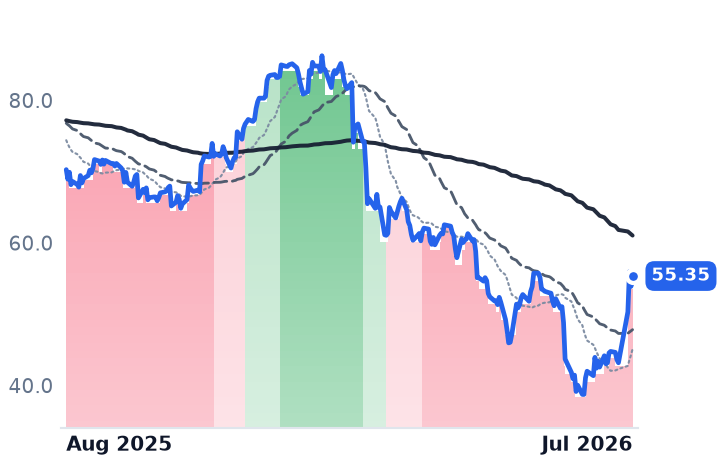
55.35
+1.45 (+2.70%)
vs. prior close
Price20d50d150d
CTSH 12-month price
Enterprise Consulting & Systems Integration
EPAM
EPAM Systems
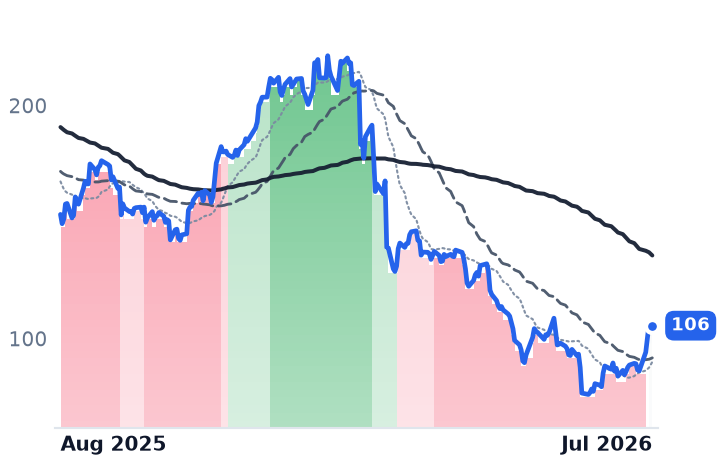
106
+1.90 (+1.83%)
vs. prior close
Price20d50d150d
EPAM 12-month price
Enterprise Consulting & Systems Integration
TickerMkt capP/EP/E fwdP/SP/S fwdP/GPP/GP fwdEV/EBITDAFCF yld
ACN$101.5B13.1x12.0x1.4x1.4x4.4x4.4x7.9x12.4%
CTSH$24.9B11.9x9.6x1.2x1.1x3.7x3.4x6.6x10.4%
EPAM$5.5B15.1x8.1x1.0x1.0x3.5x3.5x7.0x9.9%
GDYN
Grid Dynamics
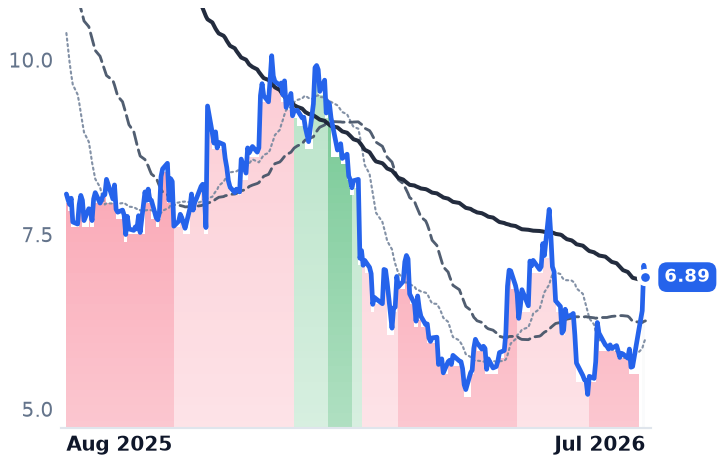
6.89
−0.17 (−2.41%)
vs. prior close
Price20d50d150d
GDYN 12-month price
Enterprise Consulting & Systems Integration
GIB
CGI
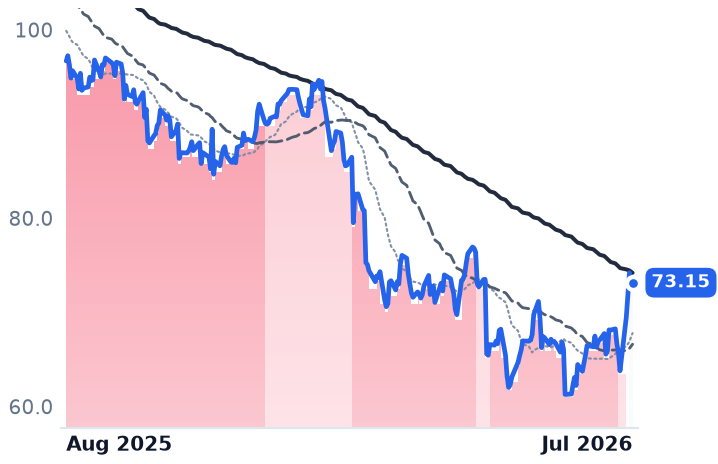
73.15
−0.09 (−0.12%)
vs. prior close
Price20d50d150d
GIB 12-month price
Enterprise Consulting & Systems Integration
GLOB
Globant
36.60
+0.21 (+0.58%)
vs. prior close
Price20d50d150d
GLOB 12-month price
Enterprise Consulting & Systems Integration
TickerMkt capP/EP/E fwdP/SP/S fwdP/GPP/GP fwdEV/EBITDAFCF yld
GDYN$559.0M250.5x15.7x1.3x1.3x3.7x3.7x11.5x2.9%
GIB$15.6B12.7x8.0x1.3x0.9x6.4x4.4x8.5x11.1%
GLOB$1.6B14.7x5.9x0.6x0.6x1.8x1.8x5.4x19.2%
INFY
Infosys
12.03
+0.08 (+0.67%)
vs. prior close
Price20d50d150d
INFY 12-month price
Enterprise Consulting & Systems Integration
WIT
Wipro
1.98
+0.03 (+1.54%)
vs. prior close
Price20d50d150d
WIT 12-month price
Enterprise Consulting & Systems Integration
TickerMkt capP/EP/E fwdP/SP/S fwdP/GPP/GP fwdEV/EBITDAFCF yld
INFY$48.8B15.1x15.1x2.5x2.4x8.2x7.9x9.7x7.6%
WIT$19.6B14.9x0.2x2.0x0.0x6.9xn/m9.9x7.6%

Valuation & fundamentals

Consensus projections

TickerFY2026EFY2027EFY2028E
ACNRevenue+6.0%+4.1%+5.3%
EPS+7.6%+5.9%+7.3%
CTSHRevenue+5.3%+4.8%+5.3%
EPS+10.6%+9.8%+10.3%
EPAMRevenue+5.2%+5.8%+6.7%
EPS+14.2%+8.8%+9.3%
GDYNRevenue+6.5%+9.2%+10.6%
EPS+11.3%+17.7%+9.6%
GIBRevenue+5.3%+2.6%+2.6%
EPS+9.7%+9.2%+8.0%
GLOBRevenue+1.0%+4.5%+5.3%
EPS+1.6%+6.1%+7.4%
INFYRevenue+1.6%+4.0%+3.7%
EPS+2.3%+4.3%+4.6%
WITRevenue+5.4%+4.3%+2.5%
EPS+4.6%+2.9%+3.7%

Forward fiscal years only. Blank means no analyst coverage for that year.

When AI money fled chips, it landed on consultants

In July 2026, a selloff that erased more than $1 trillion from semiconductor stocks — triggered by Meta's announcement that it would resell surplus AI computing capacity and a wave of custom chips threatening Nvidia's dominance — pushed investors toward technology companies with no AI-hardware exposure. They found them in the IT-consulting and outsourcing firms that had spent the prior year being written off as AI's most direct casualties: businesses that bill clients for consultant hours, a model AI software is supposed to shrink. Eight of the largest — Accenture, Cognizant, EPAM Systems, Grid Dynamics, CGI, Globant, Infosys and Wipro — all rose over the 30 days through July 31, averaging roughly 15%, a partial bounce after the group fell about 32% over the prior year. The rally landed in the same week as five of the eight companies' quarterly results, and those reports split into two very different stories.

A sector-wide rotation, not a uniform recovery

All eight names moved together, which points to a shared catalyst rather than company-specific news. On July 27, Jefferies upgraded Indian IT services stocks to neutral from underweight after a roughly 25% sector decline, explicitly framing the call as "positioning, not earnings." The next day, Indian IT stocks rallied even as global AI-hardware names sold off, with foreign investors buying shares after a five-session selling streak. The mechanics show up in the trend data: EPAM, Grid Dynamics, Globant and Wipro all jumped from a deep downtrend directly to neutral on the same single day, July 28 — consistent with a rotation trade, not a gradual reassessment. CGI eased into neutral over the prior week. Accenture, Cognizant and Infosys, the three largest and most liquid names in the group, remain in a technical downtrend through July 31 despite double-digit price gains, meaning the tape has not yet confirmed a reversal for the companies that matter most to the group's total value.

Where the business backs up the price: Cognizant, CGI, Grid Dynamics

Cognizant, which supplies IT and business-process outsourcing to healthcare and financial-services clients, raised full-year 2026 guidance to 4%-5.5% constant-currency revenue growth and earnings-per-share guidance to $5.70-$5.82, with a book-to-bill ratio of 1.3x and seven new contracts worth over $100 million each. It trades at 8.7x trailing earnings, well below the 14-15x forward multiple cited in prior research. CGI, a Canadian IT-services and consulting firm, posted a trailing-twelve-month book-to-bill of 108.1% and a backlog of $31.8 billion, 1.9 times annual revenue, with earnings up 22.5%. Grid Dynamics, the smallest company here, a digital-engineering and AI-consulting firm, said AI now generates over 30% of its revenue, up 54.6% year-over-year, and beat its own guidance. For these three, the price move and the business are pointing the same direction: CONFIRMS.

Where the price moved but the outlook didn't: Accenture, Infosys, EPAM, Wipro

Accenture, the largest global consulting and outsourcing firm, reported bookings down 2% year-over-year, narrowed its full-year revenue guidance to 3%-4%, and quietly dropped the GenAI-bookings scorecard that had anchored its AI narrative — though it still says bookings tied to AI partners like OpenAI and Anthropic are on track to double. Infosys, an Indian IT-outsourcing giant, cut its fiscal 2027 constant-currency growth guidance to 1.5%-3.0% from 1.5%-3.5% in the same week its stock rallied with the sector. EPAM Systems, a software-engineering and digital-consulting firm, cut its organic constant-currency growth guidance to 2.5%-5.0% from 4.5%-7.5%. Wipro, an Indian IT-services firm, missed profit estimates with margins down 1.2 points on wage hikes and AI investment and guided next quarter's revenue to roughly flat — consistent with its 30-day gain of just 4.8%, the smallest in the group. For these four, price and business outlook diverge: CONTRADICTS.

Valuation still historically cheap

Even after the bounce, Accenture trades at 10.3x trailing earnings and 1.08x sales against a historical mid-teens-to-20s P/E range and a Morningstar fair-value estimate near $255. Infosys trades at 13.5x trailing earnings, down from roughly 20x cited by researchers in May. Cognizant trades at 8.7x. None of these approach pre-selloff norms, meaning the de-rating from the AI-disruption fear is largely still intact — the CONFIRMS names look like a genuine, if partial, re-rating; the CONTRADICTS names look like a valuation floor bouncing on sector flows while the underlying outlook keeps deteriorating: INCONCLUSIVE on whether AI is compressing or expanding this group's economics overall.

The setup

Where it stands — Eight IT-services stocks rose ~15% in a month on an AI-chip rotation, but guidance diverged: three cut forecasts, three raised them. Would confirm — Accenture's bookings turn positive year-over-year and Infosys's FY27 constant-currency guidance is raised, not cut again, next quarter. Would invalidate — Cognizant's or CGI's book-to-bill ratio falls back below 1.0x, showing their bookings strength was a one-quarter blip. Watch next — Accenture's fiscal Q4 2026 earnings, due in late September 2026, for whether bookings recover. Valuation — Accenture trades at 10.3x trailing earnings versus a historical mid-teens-to-20s range; Cognizant at 8.7x versus 14-15x cited forward multiples.

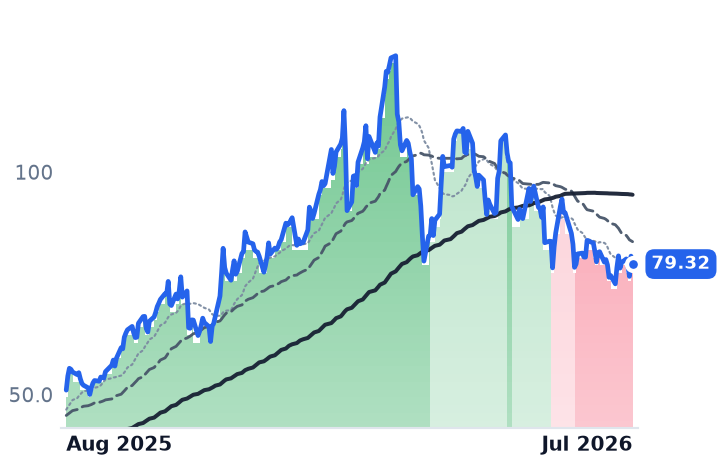
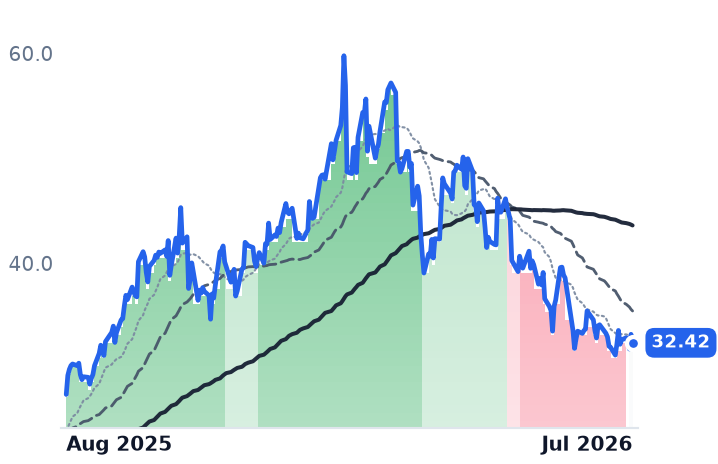
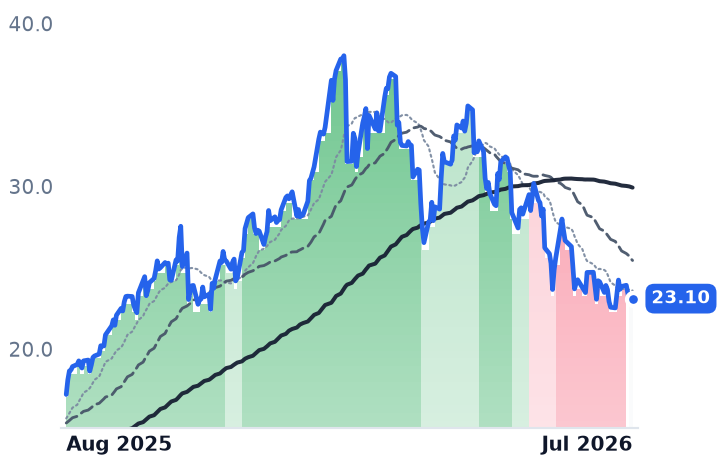
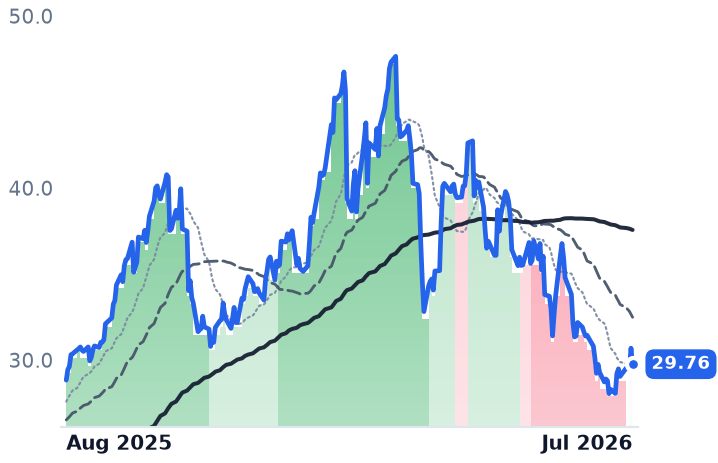
Gold Miners' Slump Narrows to Three Names as Cost Inflation Meets One-Off Setbacks

Hypothesis Opus 5 · Research Sonnet 5 · Writing Sonnet 5 · Prompt v1.1

A feared two-segment gold de-rating didn't materialize broadly: seven of ten major gold producers and royalty firms already rebounded to neutral trading by late July, leaving only Agnico Eagle, AngloGold Ashanti and Barrick still down — each for its own reason, not because gold fell.

AEMAUBGFIKGCNEMFNVORRGLDWPMGLD
TickerCompanySegmentTrend30D1Y
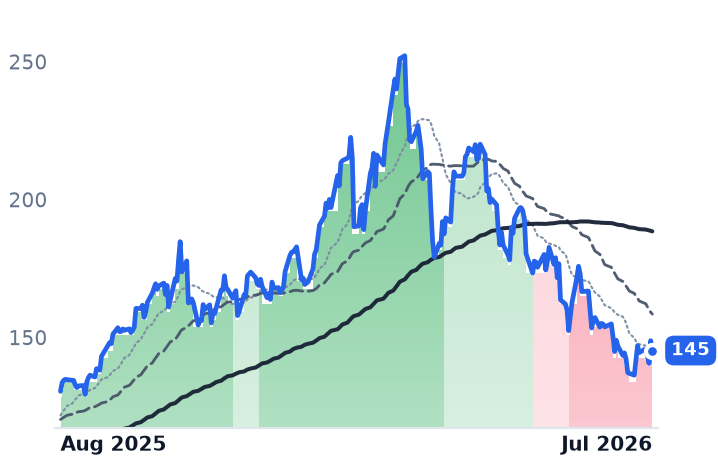
AEMAgnico Eagle MinesMajor Producers⚠️ Emerging Bear−6.2%+11.3%
AUAngloGold AshantiMajor Producers⚠️ Emerging Bear−5.6%+55.5%
BBarrick MiningMajor Producers⚠️ Emerging Bear−3.6%+68.7%
GFIGold FieldsMajor Producers⚠️ Emerging Bear−6.3%+17.9%
KGCKinross GoldMajor Producers⚠️ Emerging Bear−6.6%+34.2%
NEMNewmontMajor Producers⚠️ Emerging Bear−4.6%+44.4%
FNVFranco-NevadaRoyalty & Streaming⚠️ Emerging Bear+0.1%+27.9%
OROR RoyaltiesRoyalty & Streaming⚠️ Emerging Bear−3.4%+3.2%
RGLDRoyal GoldRoyalty & Streaming⚠️ Emerging Bear−1.8%+27.6%
WPMWheaton Precious MetalsRoyalty & Streaming⚠️ Emerging Bear−5.4%+13.9%
GLDSPDR Gold SharesAsset Management⚠️ Emerging Bear−2.8%+19.5%

12-month price & trend

AEM
Agnico Eagle Mines
145
−3.59 (−2.41%)
vs. prior close
Price20d50d150d
AEM 12-month price
Major Producers
AU
AngloGold Ashanti
79.32
−1.79 (−2.21%)
vs. prior close
Price20d50d150d
AU 12-month price
Major Producers
B
Barrick Mining
36.73
−0.56 (−1.50%)
vs. prior close
Price20d50d150d
B 12-month price
Major Producers
TickerMkt capP/EP/E fwdP/SP/S fwdP/GPP/GP fwdEV/EBITDAFCF yld
AEM$90.3B16.9x13.0x6.7x5.3x10.9x8.6x9.0x5.0%
AU$46.6B13.4x8.5x4.2x3.3x8.1x6.3x8.2x8.6%
B$68.0B11.2x10.8x3.6x3.0x6.7x5.6x5.1x7.8%
GFI
Gold Fields
32.42
−0.81 (−2.44%)
vs. prior close
Price20d50d150d
GFI 12-month price
Major Producers
KGC
Kinross Gold
23.10
+0.04 (+0.18%)
vs. prior close
Price20d50d150d
KGC 12-month price
Major Producers
NEM
Newmont
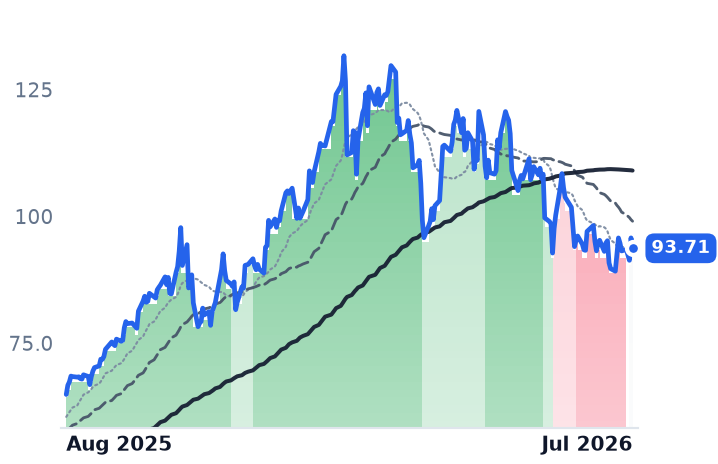
93.71
−2.05 (−2.14%)
vs. prior close
Price20d50d150d
NEM 12-month price
Major Producers
TickerMkt capP/EP/E fwdP/SP/S fwdP/GPP/GP fwdEV/EBITDAFCF yld
GFI$36.0B9.8x6.9x4.1x2.8x6.9x4.7x7.1x8.5%
KGC$34.0B11.9x9.2x4.3x3.3x8.1x6.3x6.5x8.9%
NEM$116.4B14.0x10.4x4.8x4.0x8.7x7.3x6.8x10.5%
FNV
Franco-Nevada
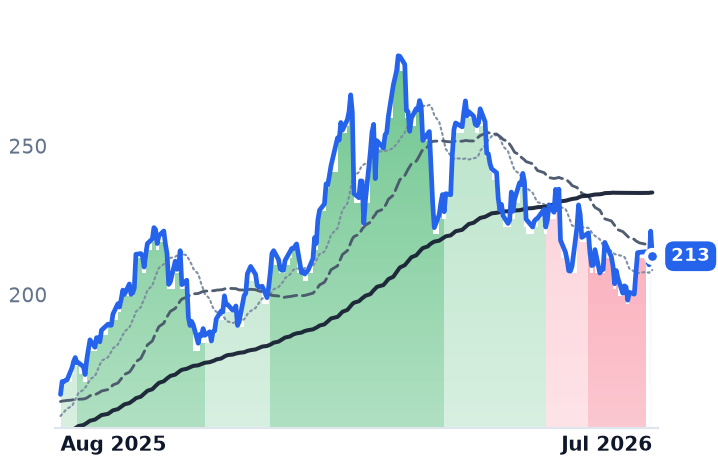
213
−8.44 (−3.81%)
vs. prior close
Price20d50d150d
FNV 12-month price
Royalty & Streaming
OR
OR Royalties
29.76
−0.93 (−3.03%)
vs. prior close
Price20d50d150d
OR 12-month price
Royalty & Streaming
RGLD
Royal Gold
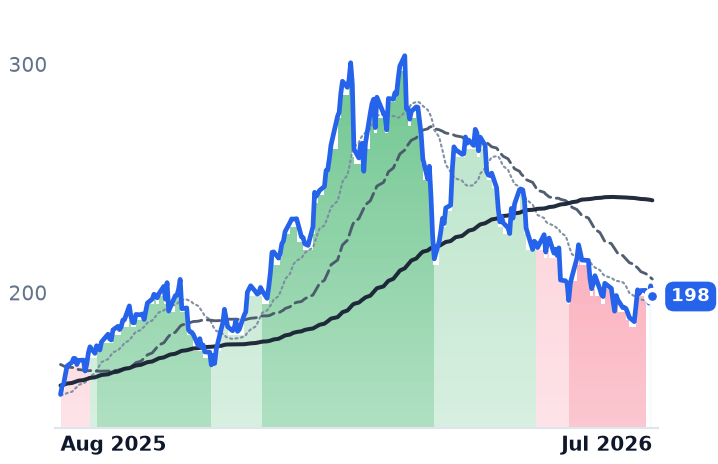
198
−4.69 (−2.31%)
vs. prior close
Price20d50d150d
RGLD 12-month price
Royalty & Streaming
TickerMkt capP/EP/E fwdP/SP/S fwdP/GPP/GP fwdEV/EBITDAFCF yld
FNV$43.5B31.7x25.0x20.7x15.8x27.0x20.6x22.0x4.1%
OR$6.8B26.9x17.2x21.0x10.9x24.2x12.5x20.8x2.1%
RGLD$15.9B30.5x19.5x12.1x7.8x17.7x11.4x16.1x-1.5%
WPM
Wheaton Precious Metals
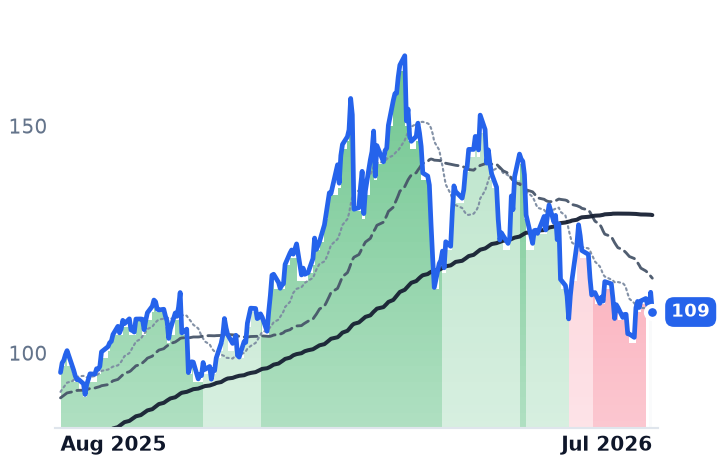
109
−4.35 (−3.84%)
vs. prior close
Price20d50d150d
WPM 12-month price
Royalty & Streaming
GLD
SPDR Gold Shares
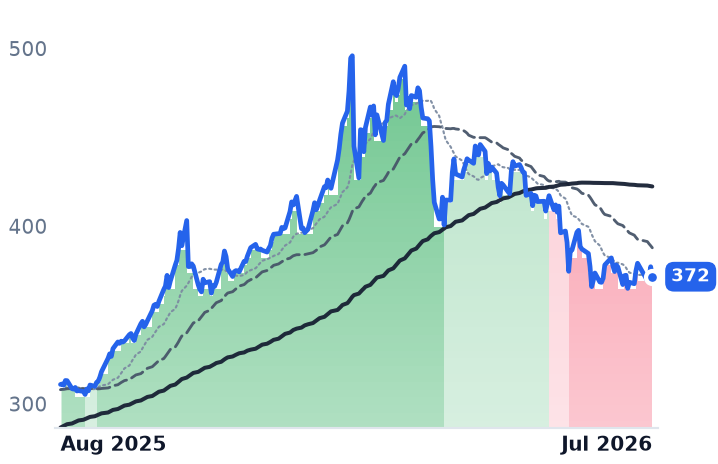
372
−5.62 (−1.49%)
vs. prior close
Price20d50d150d
GLD 12-month price
Asset Management
TickerMkt capP/EP/E fwdP/SP/S fwdP/GPP/GP fwdEV/EBITDAFCF yld
WPM$59.2B32.9x23.6x21.6x14.4x28.0x18.7x23.9x1.7%
GLD$155.3B

Valuation & fundamentals

Consensus projections

TickerFY2026EFY2027EFY2028E
AEMRevenue+44.6%+4.4%−10.3%
EPS+68.9%+9.1%−13.1%
AURevenue+39.9%+3.7%+2.7%
EPS+87.1%+7.4%−3.0%
BRevenue+40.2%+14.8%−1.2%
EPS+61.8%+14.6%+8.2%
GFIRevenue+49.6%+2.7%−2.4%
EPS+75.6%+5.0%−11.6%
KGCRevenue+42.5%+1.2%−6.2%
EPS+77.9%+10.9%−6.4%
NEMRevenue+30.4%+5.9%−1.2%
EPS+59.2%+14.0%+6.5%
FNVRevenue+56.9%+15.3%−7.5%
EPS+66.3%+14.0%−4.2%
ORRevenue+64.6%+10.2%+3.3%
EPS+74.6%+11.4%+7.2%
RGLDRevenue+93.1%+12.4%−5.1%
EPS+45.5%+15.6%−0.9%
WPMRevenue+84.7%+9.6%−3.1%
EPS+89.3%+6.7%−2.2%

Forward fiscal years only. Blank means no analyst coverage for that year.

What actually happened

A month ago it looked like the entire gold-mining complex was turning over together — both the big producers that dig ore out of the ground and the royalty firms that finance mines in exchange for a cut of output showed the same technical downtrend. That reading doesn't survive a closer look. By July 28, seven of the ten largest gold-related stocks had already snapped back to neutral trading, and the metal itself barely moved over the same 30 days. What's left is a narrower, more useful story: three producers are still down, and each has its own explanation.

The ten companies

The group splits into miners and financiers. Agnico Eagle Mines (AEM), a Canadian gold miner with operations from Quebec to Nunavut; AngloGold Ashanti (AU), a Johannesburg-based producer with mines across Africa, the Americas and Australia; and Barrick Mining (B), a global gold and copper miner headquartered in Toronto, remain in a sustained downtrend. Gold Fields (GFI), a South African-based global gold producer; Kinross Gold (KGC), a Canadian miner with operations in the Americas and West Africa; and Newmont (NEM), the world's largest gold producer by market value, have all recovered to neutral. So have all four royalty and streaming firms — Franco-Nevada (FNV), which funds mine construction for a share of future output rather than operating mines itself; Osisko Gold Royalties (OR), a smaller Canadian royalty company; Royal Gold (RGLD), a US-based royalty and streaming firm; and Wheaton Precious Metals (WPM), which buys discounted future gold and silver production from operators.

Three producers, three separate problems

Agnico Eagle's slide traces to a specific incident: a July 1 rock-mass movement forced the company to suspend part of its Barnat pit at the Canadian Malartic complex, and it cut 2026-2028 production guidance by up to 150,000 ounces a year while raising costs at that mine to roughly $1,260 an ounce; the stock fell as much as 5.2% on the news. AngloGold Ashanti missed second-quarter estimates — earnings of $1.96 a share versus $2.04 expected, revenue of $3.1 billion versus $3.3 billion — and shares fell as much as 10.6% intraday, with Scotiabank, Citigroup and JPMorgan all trimming price targets despite record cash generation. Barrick had no single incident but absorbed a string of downgrades after raising 2026 all-in sustaining cost (AISC) guidance to $1,760-1,950 an ounce from $1,637, prompting Citi and JPMorgan price-target cuts.

Cost inflation itself is not confined to these three. Newmont guided 2026 AISC to $1,680 an ounce, up from $1,358, and Agnico Eagle guided costs higher on labor, electricity and royalty inflation even before its pit suspension. So the operating-leverage pressure the hypothesis flagged is real and sector-wide — it just hasn't been enough on its own to keep a stock's trend broken. It took an added, company-specific catalyst to do that.

Gold itself didn't move

The metal explains none of this month's divergence. A gold-tracking ETF proxy closed at $370.60 on July 1 and $371.54 on July 31 — essentially flat. The real correction happened earlier, from a May 1 peak near $423 down to $370.60 by July 1, a 12.4% drop that UBS attributes to markets "rediscovering the concept of opportunity cost" as real yields and the dollar firmed; consensus Q3/Q4 price forecasts were trimmed accordingly. Demand data don't support a bearish read either: central banks bought 289 tonnes in the second quarter, up 62% year over year, more than offsetting modest 45-tonne ETF outflows.

Valuation: cheap producers, structurally rich streamers

On forward earnings, the three lagging producers aren't obviously overpriced: Barrick trades near 10.0x forward earnings and Newmont near 10.6x, both close to a roughly 9.5x gold-mining industry average, while Agnico Eagle carries a 21% premium at about 11.3x — arguably still cheap given its 16% one-year gain. Royalty firms trade richer by design: the group structurally commands 1.5-2.0x net asset value versus miners' 0.7-0.9x, reflecting fixed-margin economics rather than fresh re-rating, though Franco-Nevada's roughly 45x P/E rests on assumptions — sustained gold strength and Cobre Panamá clarity — that a renewed gold leg down could still test. Fine-grained company profitability data for nine of these ten names came from public filings and sell-side notes rather than a single database pull that exceeded its output limit; the figures are corroborated across multiple sources.

The tape

Seven of ten names flipped from a sharp downtrend back to neutral trading by July 28 and held there through month-end; AEM, AU and B alone remained pinned in the downtrend through July 31, consistent with the idiosyncratic, not sector-wide, story above.

The setup

Where it stands — Only three of ten gold stocks remain in a sustained downtrend, each tied to a company-specific setback rather than a falling gold price. Would confirm — A fourth or fifth name (e.g., Newmont, Gold Fields) re-enters a sustained downtrend without its own guidance cut or earnings miss. Would invalidate — Agnico Eagle, AngloGold or Barrick recover to neutral trading within the next month without a new operational or earnings catalyst. Watch next — Barrick's and Newmont's next quarterly results, due mid-to-late October 2026, for confirmation of AISC guidance and margin trends. Valuation — Barrick ~10.0x and Newmont ~10.6x forward earnings, near the ~9.5x gold-mining industry average; Franco-Nevada ~45x, near its own structural premium range.

AI Financiers Split: Buyout Firms' Stocks Sink as Fees Grow; Banks and Toll-Road Infrastructure Rally

Hypothesis Opus 5 · Research Sonnet 5 · Writing Sonnet 5 · Prompt v1.1

The 17-name group financing the AI data-center boom looks flat for the year, but that average hides a real split: six private-equity and credit managers fell 20-30% even as their fee earnings grew double digits, while Goldman Sachs, Morgan Stanley, Brookfield Infrastructure and HASI rallied 34-51% on record financing pipelines and contracted cash flow growth.

BXKKRAPOARESCGBAMBNBIPGSMSHASI
TickerCompanySegmentTrend30D1Y
BXBlackstoneAlternative & Private Capital🔴 Cont. Bear+3.5%−23.5%
KKRKKRAlternative & Private Capital🔴 Cont. Bear+5.7%−29.8%
APOApollo Global ManagementAlternative & Private Capital🔴 Cont. Bear+2.8%−10.5%
ARESAres ManagementAlternative & Private Capital🔴 Cont. Bear+5.1%−30.3%
CGThe CarlyleAlternative & Private Capital⚠️ Emerging Bear+4.5%−22.4%
BAMBrookfield Asset ManagementReal Estate & Infrastructure🔴 Cont. Bear+3.0%−19.0%
BNBrookfieldReal Estate & Infrastructure⚠️ Emerging Bear−3.3%−3.8%
BIPBrookfield Infrastructure PartnersInfrastructure & Transport Conglomerates🟢 Cont. Bull+11.9%+35.6%
GSThe Goldman SachsBulge Bracket Investment Banks🟢 Cont. Bull−3.5%+42.5%
MSMorgan StanleyBulge Bracket Investment Banks🟢 Cont. Bull−5.3%+51.4%
HASIHA Sustainable Infrastructure CapitalFinancial - Diversified🟢 Cont. Bull−1.1%+53.3%

12-month price & trend

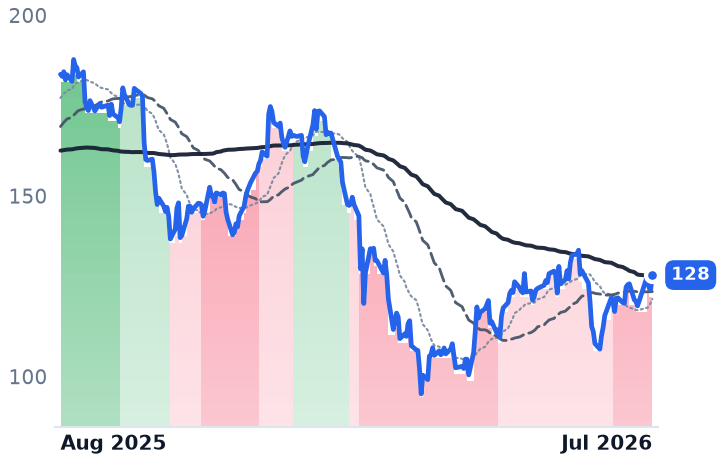
BX
Blackstone
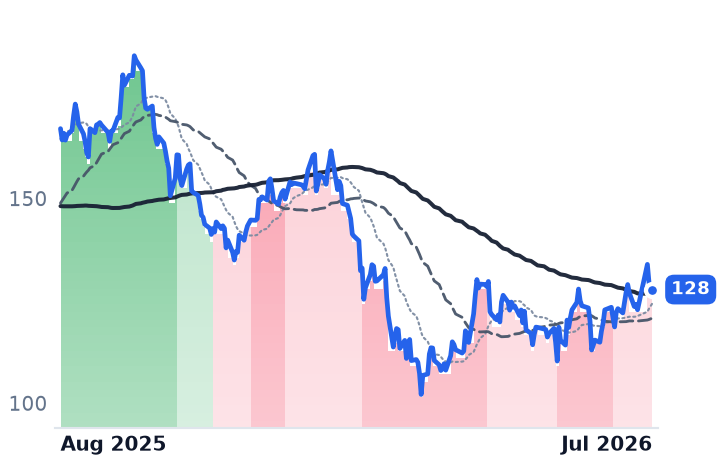
128
−0.32 (−0.25%)
vs. prior close
Price20d50d150d
BX 12-month price
Alternative & Private Capital
KKR
KKR
101
+0.45 (+0.45%)
vs. prior close
Price20d50d150d
KKR 12-month price
Alternative & Private Capital
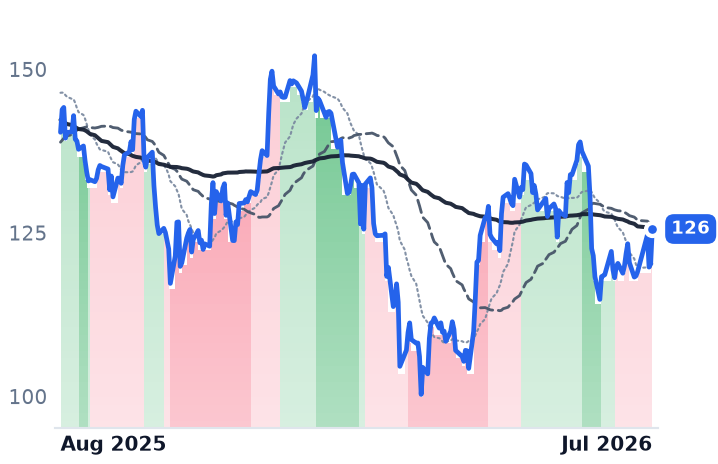
APO
Apollo Global Management
126
+5.34 (+4.44%)
vs. prior close
Price20d50d150d
APO 12-month price
Alternative & Private Capital
TickerMkt capP/EP/E fwdP/SP/S fwdP/GPP/GP fwdEV/EBITDAFCF yld
BX$154.3B28.4x21.5x9.6x10.5x10.8x11.8x19.7x1.6%
KKR$91.1B30.2x16.3x4.3x8.6x9.2x18.5x14.5x7.6%
APO$72.4B37.0x14.2x2.4x3.1x2.7x3.5x6.4x8.3%
ARES
Ares Management
128
+3.97 (+3.20%)
vs. prior close
Price20d50d150d
ARES 12-month price
Alternative & Private Capital
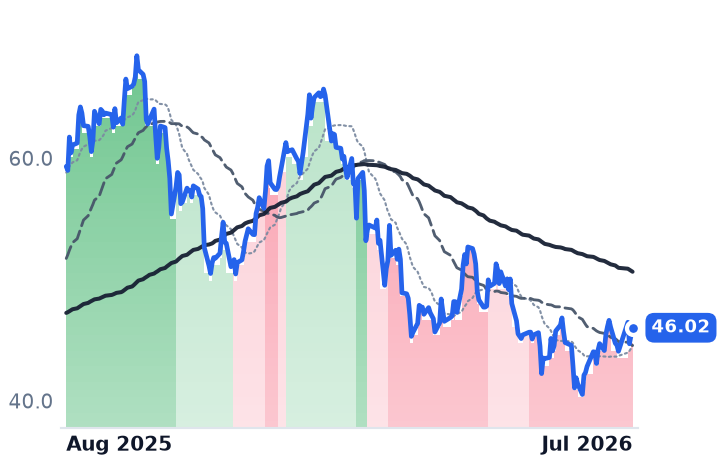
CG
The Carlyle
46.02
+0.66 (+1.46%)
vs. prior close
Price20d50d150d
CG 12-month price
Alternative & Private Capital
BAM
Brookfield Asset Management
48.40
+0.44 (+0.92%)
vs. prior close
Price20d50d150d
BAM 12-month price
Real Estate & Infrastructure
TickerMkt capP/EP/E fwdP/SP/S fwdP/GPP/GP fwdEV/EBITDAFCF yld
ARES$42.1B56.7x21.7x6.7x7.5x10.7x12.0x22.7x3.8%
CG$16.6B30.2x12.6x4.2x4.6x5.9x6.5x28.1x-5.5%
BAM$77.3B31.0x26.4x16.1x12.6x20.1x15.7x25.9x3.0%
BN
Brookfield
42.53
+0.50 (+1.19%)
vs. prior close
Price20d50d150d
BN 12-month price
Real Estate & Infrastructure
BIP
Brookfield Infrastructure Partners
41.76
−0.63 (−1.49%)
vs. prior close
Price20d50d150d
BIP 12-month price
Infrastructure & Transport Conglomerates
GS
The Goldman Sachs
1,018
−6.48 (−0.63%)
vs. prior close
Price20d50d150d
GS 12-month price
Bulge Bracket Investment Banks
TickerMkt capP/EP/E fwdP/SP/S fwdP/GPP/GP fwdEV/EBITDAFCF yld
BN$101.9B85.4x16.2x1.3x13.4x3.7x38.0x2.8x-2.7%
BIP$19.2B59.7x38.5x0.8x1.5x3.0x5.7x6.9x-3.0%
GS$300.4B15.5x14.6x2.5x4.2x4.4x7.3x29.0x-15.7%
MS
Morgan Stanley
210
+0.36 (+0.17%)
vs. prior close
Price20d50d150d
MS 12-month price
Bulge Bracket Investment Banks
HASI
HA Sustainable Infrastructure Capital
37.87
−0.09 (−0.24%)
vs. prior close
Price20d50d150d
HASI 12-month price
Financial - Diversified
TickerMkt capP/EP/E fwdP/SP/S fwdP/GPP/GP fwdEV/EBITDAFCF yld
MS$332.0B16.9x16.4x2.6x4.1x4.4x6.9x20.2x-0.3%
HASI$4.8B82.3x12.7x6.8x10.4x24.6x37.6x40.8x4.8%

Valuation & fundamentals

Consensus projections

TickerFY2026EFY2027EFY2028E
BXRevenue+15.0%+24.4%+4.9%
EPS+10.7%+25.2%+10.8%
KKRRevenue+33.9%+17.8%+32.9%
EPS+26.0%+18.0%+15.7%
APORevenue+27.5%+15.7%+13.6%
EPS+11.4%+20.6%+17.2%
ARESRevenue+23.0%+19.9%+9.6%
EPS+17.8%+23.8%+17.4%
CGRevenue−4.3%+41.3%+7.2%
EPS−8.7%+39.7%+15.1%
BAMRevenue+12.7%+16.1%+12.5%
EPS+12.7%+17.9%+17.4%
BNRevenue−7.5%+22.7%+22.2%
EPS+15.5%+23.5%+22.4%
BIPRevenue+61.2%−25.6%+8.1%
EPS+2.1%+38.8%−2.9%
GSRevenue+20.6%+2.7%+1.8%
EPS+42.8%+4.7%+5.3%
MSRevenue+16.4%+5.5%+5.3%
EPS+30.1%+6.1%+7.8%
HASIRevenue+18.8%+11.2%+14.0%
EPS+10.5%+10.9%+8.9%

Forward fiscal years only. Blank means no analyst coverage for that year.

A flat average, a real split

The group of firms that supply the money behind the AI data-center build — private-equity giants, Wall Street banks, and specialty infrastructure lenders — looks like it went nowhere over the past year, up roughly 2%. That average is misleading. Six of the largest private-capital managers fell 20% to 30% even as their underlying fee businesses kept growing at double-digit rates, while banks and contracted-infrastructure owners in the same group rallied 34% to 51%. The split shows two different parts of the AI financing chain being priced very differently by the market, and in at least one case the pricing looks disconnected from the business results underneath it.

The managers: fees up, stocks down

Blackstone (BX), the world's largest alternative-asset manager and a major direct owner of data-center real estate through its QTS platform, fell 25% over the year even as its fee-related earnings rose 22% and assets under management hit $1.35 trillion, up 11%. Ares Management (ARES), a private-credit and direct-lending manager, fell 30% while posting record quarterly fundraising of $36.4 billion and 20% fee-earnings growth. KKR fell 29%, Carlyle (CG) 22%, Brookfield Asset Management (BAM, the fee-earning manager spun out of its parent) 19%, and Apollo (APO), whose Athene insurance arm funds much of its private-credit book, fell a smaller 9% as Athene helped it grow earnings through a broader dealmaking slowdown. Forward multiples tell the same story: Ares's price-to-earnings ratio compressed from 64.8x to 50.3x and KKR's from 42.4x to 30.7x between May and June even as both firms' fee earnings grew — a genuine gap between business momentum and share price, not a fundamentals-driven de-rating.

The banks and toll roads: pipelines and cash flow, both up

Goldman Sachs (GS) and Morgan Stanley (MS), which underwrite and arrange the debt behind data-center construction, rallied 44% and 51% respectively and never broke their uptrends. Morgan Stanley has overtaken Goldman in AI-infrastructure debt volume and projects an additional $800 billion of private-credit data-center financing over the next two years. Both trade at 18-19x trailing earnings, cheaper than any of the alt managers. HA Sustainable Infrastructure Capital (HASI), which lends against renewable-energy and efficiency projects, rallied 47% on a widening spread between its ~6.8% cost of new debt and ~10.8% yield on new assets, helped by lower-cost green bond issuance in February.

The Brookfield split, inside one family

Brookfield Infrastructure (BIP), which owns contracted, toll-road-like infrastructure assets including data centers, rallied 34% and was upgraded back to a strong uptrend in the final week of July after funds from operations rose 10% and its data segment's FFO grew 46%, capped by a $1.2 billion IPO of its US colocation unit, Csquare. Its parent, Brookfield Corporation (BN), the holding company that owns stakes in Brookfield's asset manager and a growing insurance arm, was roughly flat for the year but broke repeatedly from an uptrend into a downtrend across three-, six- and twelve-month windows, most recently in late July. That break coincided with a broad macro selloff, concerns over holding-company leverage, and a roughly 50% haircut to real-estate carrying values, even as the firm reported insurance-driven earnings up 24%. BN's GAAP accounting is distorted by insurance and real-estate marks, making the business-versus-tape verdict for BN INCONCLUSIVE; for BIP, contracted cash flow growth and the price move agree — CONFIRMS.

Where the real stress is

The genuine credit-cycle warning isn't in the manager stocks or in data-center securitization, which is expanding, not stalling — asset-backed and commercial mortgage issuance for data centers has grown to roughly $61 billion year-to-date in 2026 from $27 billion in all of 2025, with spreads holding near 150-200 basis points. It shows up one layer down, in the business development companies that hold the actual loans: non-accruals and PIK (payment-in-kind, non-cash) income are rising across the sector, and Ares's flagship private-credit fund saw 14% of investors request redemption against a 5% cap. That's a real, if partial, repricing signal in the credit book — distinct from, and smaller than, the equity de-rating in the manager stocks themselves.

The setup

Where it stands — Alt-manager stocks (BX, KKR, ARES, CG, BAM) trade well below their own five-month multiples despite fee-earnings growth of 20%+; banks and BIP hold uptrends on growing pipelines. Would confirm — Fee-related earnings growth decelerating below double digits at BX, KKR or ARES over the next two quarterly reports. Would invalidate — Alt-manager forward P/E multiples re-expanding toward their prior 2025 levels while fee-earnings growth holds steady. Watch next — Q3 2026 earnings (October) for BX, KKR, ARES fee-related earnings and Ares Capital's non-accrual and redemption figures. Valuation — ARES trades at 50.3x trailing earnings, down from 64.8x in May; GS and MS trade at 18-19x, both below the alt managers' current multiple.

Barron's Biotech Takeout Basket Splits Wide: Alnylam Sinks 28% on Guidance Cut, Ascendis Turns a Profit

Hypothesis Opus 5 · Research Sonnet 5 · Writing Sonnet 5 · Prompt v1.1

A watchlist of eight mid-size biotechs flagged as possible acquisition targets shows a 12-month average gain near 60% — but that number hides a 236-point spread between winners and losers, and last month's group-wide pullback was really one stock, Alnylam, cutting sales guidance on its flagship drug.

ASNDMLTXDYNPCVXCYTKCGONDNLIALNY
TickerCompanySegmentTrend30D1Y
ASNDAscendis Pharma A/SRare Genetic & Metabolic Diseases🟢 Cont. Bull−9.0%+32.5%
MLTXMoonLake ImmunotherapeuticsImmunology & Autoimmune🌱 Emerging Bull−2.3%−65.4%
DYNDyne TherapeuticsGene Therapy & Cell Therapy🟢 Cont. Bull+10.2%+145.7%
PCVXVaxcyteInfectious Diseases & Vaccines⚠️ Emerging Bear−5.1%+60.4%
CYTKCytokinetics, IncorporatedCNS & Neurological🟢 Cont. Bull−9.9%+110.9%
CGONCG OncologyOther🟢 Cont. Bull+2.8%+172.9%
DNLIDenali TherapeuticsCNS & Neurological🟢 Cont. Bull−10.6%+59.4%
ALNYAlnylam PharmaceuticalsRNA-Based Therapeutics⚠️ Emerging Bear−34.3%−51.0%

12-month price & trend

ASND
Ascendis Pharma A/S
244
−7.16 (−2.85%)
vs. prior close
Price20d50d150d
ASND 12-month price
Rare Genetic & Metabolic Diseases
MLTX
MoonLake Immunotherapeutics
18.44
−0.55 (−2.90%)
vs. prior close
Price20d50d150d
MLTX 12-month price
Immunology & Autoimmune
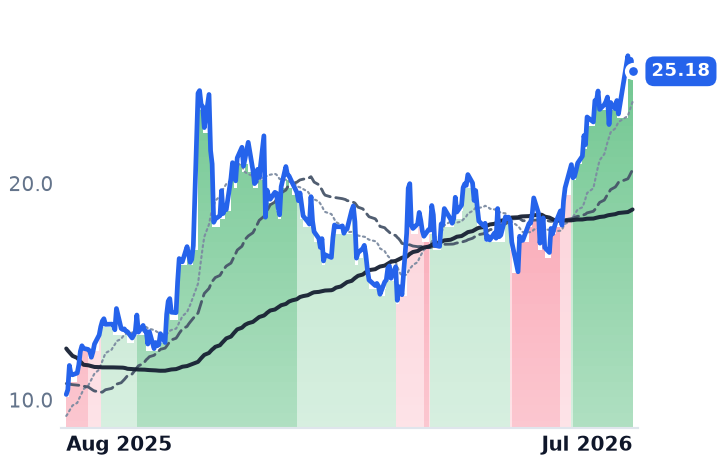
DYN
Dyne Therapeutics
25.18
−0.55 (−2.14%)
vs. prior close
Price20d50d150d
DYN 12-month price
Gene Therapy & Cell Therapy
TickerMkt capP/EP/E fwdP/SP/S fwdP/GPP/GP fwdEV/EBITDAFCF yld
ASND$15.1B25.8x17.4x15.1x11.3x17.1x12.8x0.3%
MLTX$1.6Bn/mn/mn/mn/m-14.5%
DYN$4.7Bn/mn/mn/mn/m-10.6%
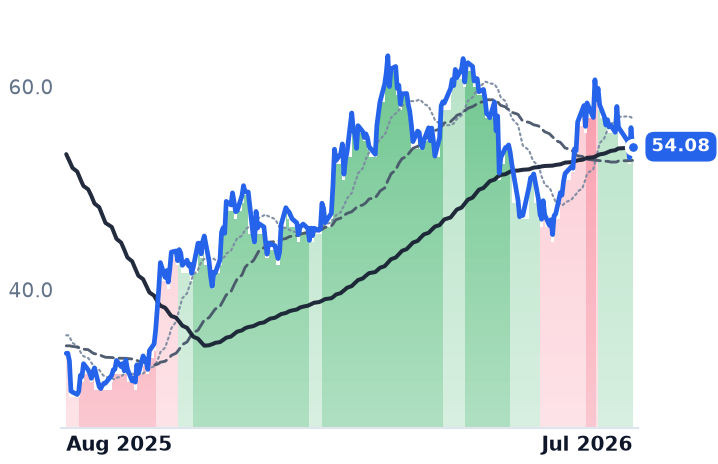
PCVX
Vaxcyte
54.08
−1.88 (−3.36%)
vs. prior close
Price20d50d150d
PCVX 12-month price
Infectious Diseases & Vaccines
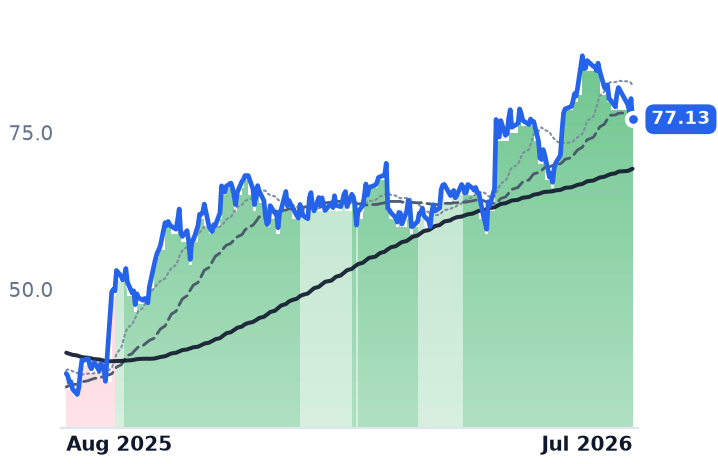
CYTK
Cytokinetics, Incorporated
77.13
−3.29 (−4.09%)
vs. prior close
Price20d50d150d
CYTK 12-month price
CNS & Neurological
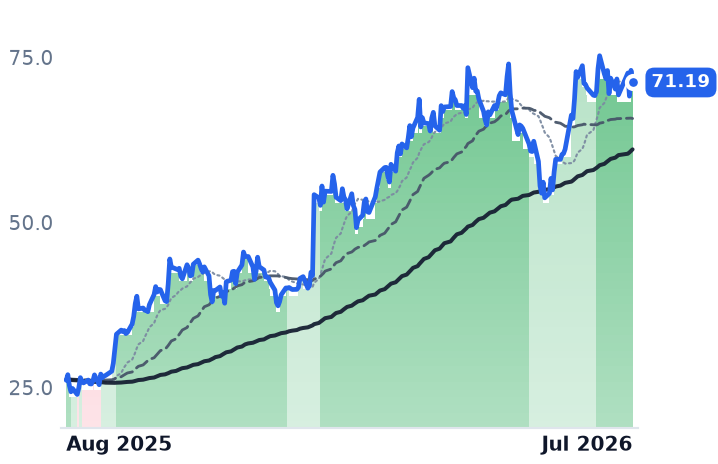
CGON
CG Oncology
71.19
−1.84 (−2.52%)
vs. prior close
Price20d50d150d
CGON 12-month price
Other
TickerMkt capP/EP/E fwdP/SP/S fwdP/GPP/GP fwdEV/EBITDAFCF yld
PCVX$7.8Bn/mn/m312.4xn/mn/m-9.9%
CYTK$9.6Bn/m90.7x84.5x100.4x93.5xn/m-5.7%
CGON$6.3Bn/m568.3xn/m-2.6%
DNLI
Denali Therapeutics
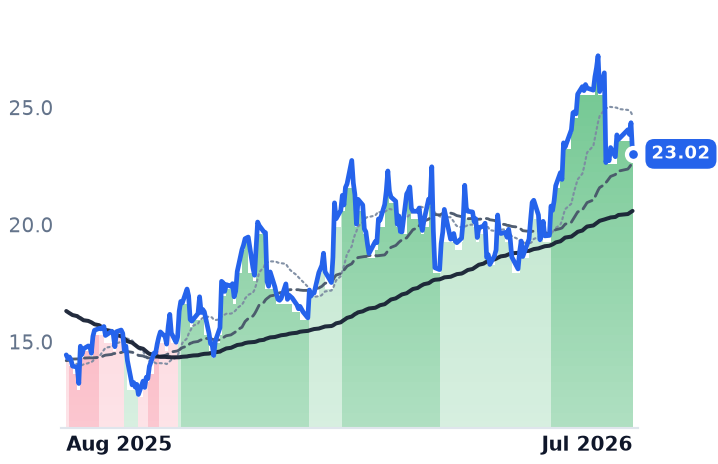
23.02
−1.33 (−5.46%)
vs. prior close
Price20d50d150d
DNLI 12-month price
CNS & Neurological
ALNY
Alnylam Pharmaceuticals
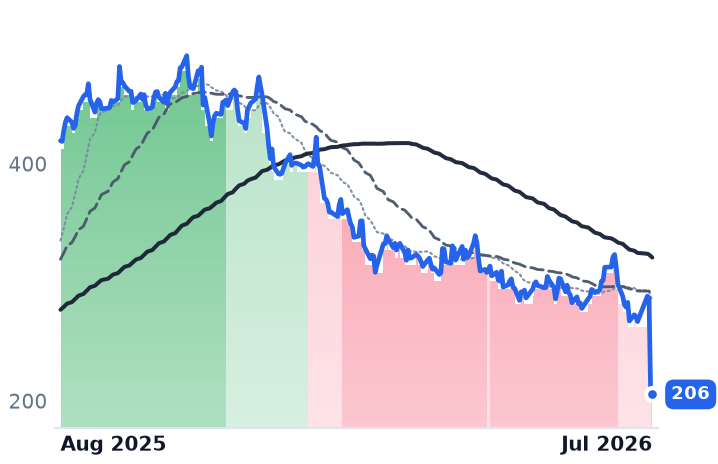
206
+0.04 (+0.02%)
vs. prior close
Price20d50d150d
ALNY 12-month price
RNA-Based Therapeutics
TickerMkt capP/EP/E fwdP/SP/S fwdP/GPP/GP fwdEV/EBITDAFCF yld
DNLI$3.7Bn/mn/m104.4xn/mn/m-11.5%
ALNY$27.5B33.7x30.4x5.7x5.0x7.2x6.3x23.5x2.0%

Valuation & fundamentals

Consensus projections

TickerFY2026EFY2027EFY2028E
ASNDRevenue+89.6%+44.8%+27.0%
EPS−519.4%−26.1%+47.9%
MLTXRevenue+499.2%
EPS+6.4%−5.3%−19.5%
DYNRevenue+43.8%+5023.7%+465.7%
EPS−1.3%−5.6%−23.8%
PCVXRevenue+248.6%+103.3%
EPS+54.2%−20.2%−5.0%
CYTKRevenue+47.7%+246.3%+124.3%
EPS−2.6%−26.1%−56.7%
CGONRevenue+292.5%+669.5%+432.7%
EPS+26.5%+2.4%−97.0%
DNLIRevenue+1299.4%+204.0%+150.9%
EPS−18.1%+0.8%−24.6%
ALNYRevenue+46.9%+28.0%+21.0%
EPS+174.9%+47.6%+28.7%

Forward fiscal years only. Blank means no analyst coverage for that year.

A basket of eight mid-size biotech stocks that Barron's and fund manager David Giroux flagged in June as likely large-pharma acquisition targets has gained an average of 58% over the past year. That average is doing a lot of work to hide what actually happened: one stock, CG Oncology, tripled; another, MoonLake, lost two-thirds of its value; and the group's apparent one-month "pullback" of 7% was overwhelmingly the work of a single five-session, 28% crash in Alnylam Pharmaceuticals, which sells Amvuttra, a gene-silencing injection for a heart-damaging protein disorder called ATTR amyloidosis. This is not a quietly compounding sector story. It's a barbell of one real commercial setback and several speculative re-ratings, sitting on top of a genuine pickup in industry-wide dealmaking.

What actually moved, and why. Alnylam's Amvuttra crossed $1 billion in quarterly sales for the first time in the same report that triggered the stock's collapse: the company cut its full-year sales guidance by $200 million at both ends of the range, to $4.2–$4.5 billion, after second-quarter revenue came in about 4% below Wall Street's estimate as early-launch demand normalized (Endpoints News). The stock had already been sliding on a separate readout — a disappointing study of a related drug, eplontersen, that raised questions about how RNA-silencing drugs like Amvuttra perform in patients switching from other treatments (Endpoints News). The business is still growing; the multiple compressing around it — trailing price-to-sales fell to 9.3x, cheaper than before the crash — makes Alnylam the one name in this group where the tape and the fundamentals now disagree, a genuine dislocation rather than a confirmation of bad news.

Ascendis Pharma, which sells the growth-hormone therapy Skytrofa and the hormone-replacement drug Yorvipath, is the opposite case: price and business are moving together. It posted its first-ever quarterly operating profit in the first quarter of 2026 — €25 million, a 10% margin — on revenue up 145% year over year, and management is targeting €5 billion in annual product sales by 2030 (Ascendis investor release). Cytokinetics, whose heart drug aficamten launched in January to compete with Bristol Myers Squibb's Camzyos, had reached 680 patients and 275 prescribers by mid-year (Investing.com) — real commercial traction, though the stock's ~109x trailing sales multiple prices in years of the drug's estimated $1.5–2 billion peak-sales potential.

The rest of the group is harder to defend on fundamentals alone. Vaxcyte, developing a pneumococcal vaccine called VAX-31, has no revenue and won't have pivotal trial data until the fourth quarter (StockTitan); its $8.4 billion valuation is a bet on that single readout. CG Oncology, whose bladder-cancer therapy cretostimogene is still awaiting FDA filing, trades near 1,238 times trailing sales. Dyne Therapeutics just raised $405 million in an upsized stock sale to fund its RNA-based muscular dystrophy programs through mid-2028 (Globe and Mail), and Denali Therapeutics has roughly 12 months of cash left and a $400 million backup share-sale facility ahead of Parkinson's and dementia data due later this year (Seeking Alpha). MoonLake, whose skin-disease antibody sonelokimab failed one of two pivotal trials last September, is rebuilding around a narrower FDA filing path but still posted a widening $70 million quarterly loss with rising share dilution.

The acquisition case is real — for the sector, not yet for these names. Global biopharma dealmaking hit $106 billion across 201 deals through mid-2026, on pace for the strongest year since 2019, with premiums averaging 60–120% as large drugmakers race to replace more than $200 billion of revenue facing patent expiration by 2030 (CNBC; CNBC). But none of these eight companies has actually been acquired in the past four quarters — the takeout premium in the pre-revenue names' valuations is a forward bet, not a confirmed pattern.

The setup

Where it stands — Alnylam's Amvuttra franchise keeps growing while its stock trades below its pre-crash multiple; six of eight peers carry valuations that assume commercial success not yet reported. Would confirm — A completed acquisition of any of the eight names at a 60%+ premium, or Amvuttra quarterly revenue reaccelerating past $1.05 billion next quarter. Would invalidate — Amvuttra sales guidance is cut again, or Vaxcyte's Q4 2026 VAX-31 pivotal data misses its efficacy target. Watch next — Vaxcyte's OPUS-1 pivotal readout, guided for the fourth quarter of 2026. Valuation — Alnylam trades at 9.3x trailing sales versus its own pre-crash multiple; Cytokinetics and CG Oncology trade at 109x and 1,238x trailing sales, both near their own multi-year highs.

Car Dealer Stocks Jumped Together in July — It Was Earnings Week, Not a Trend Change

Hypothesis Opus 5 · Research Sonnet 5 · Writing Sonnet 5 · Prompt v1.1

The six largest franchised auto-dealer chains reported quarterly results within four trading days in late July; the resulting bunched earnings reactions, not a gradual industry re-rating, explain most of the group's one-month gain — and one member's move is really a takeover bid.

ABGANGPILADPAGSAH
TickerCompanySegmentTrend30D1Y
ABGAsbury AutomotiveTraditional Dealership Groups🔴 Cont. Bear+11.4%+3.5%
ANAutoNationTraditional Dealership Groups⚠️ Emerging Bear+11.4%+12.2%
GPIGroup 1 AutomotiveTraditional Dealership Groups🔴 Cont. Bear−3.4%−29.3%
LADLithia MotorsTraditional Dealership Groups🔴 Cont. Bear+24.7%+36.5%
PAGPenske AutomotiveTraditional Dealership Groups🌱 Emerging Bull+18.5%+32.3%
SAHSonic AutomotiveTraditional Dealership Groups🌱 Emerging Bull+6.6%+32.5%

12-month price & trend

ABG
Asbury Automotive
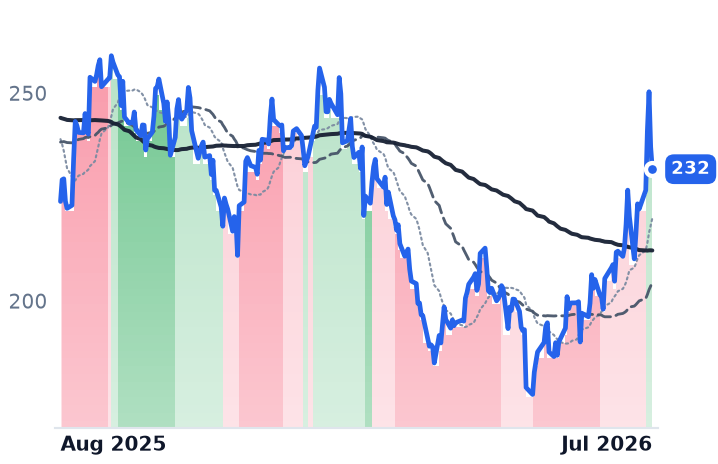
232
−5.34 (−2.25%)
vs. prior close
Price20d50d150d
ABG 12-month price
Traditional Dealership Groups
AN
AutoNation
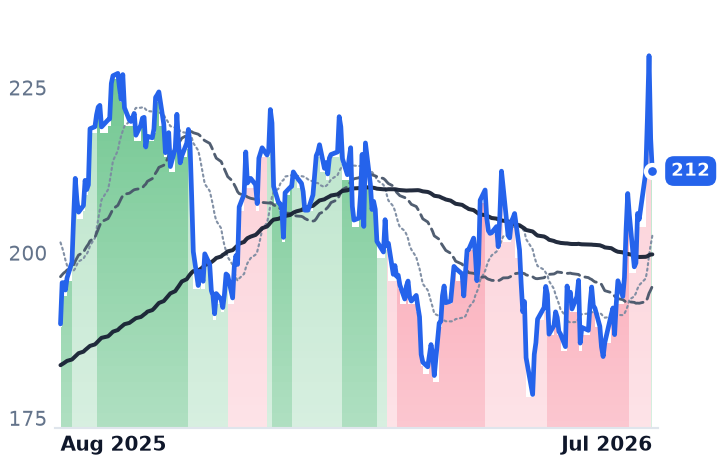
212
−4.86 (−2.24%)
vs. prior close
Price20d50d150d
AN 12-month price
Traditional Dealership Groups
GPI
Group 1 Automotive
287
−9.94 (−3.35%)
vs. prior close
Price20d50d150d
GPI 12-month price
Traditional Dealership Groups
TickerMkt capP/EP/E fwdP/SP/S fwdP/GPP/GP fwdEV/EBITDAFCF yld
ABG$3.3B8.3x7.0x0.2x0.2x1.2x1.2x8.9x18.0%
AN$6.2B9.4x8.6x0.2x0.2x1.1x1.1x10.8x-1.7%
GPI$3.7B11.5x7.4x0.2x0.2x1.3x1.3x8.6x7.5%
LAD
Lithia Motors
385
−14.73 (−3.68%)
vs. prior close
Price20d50d150d
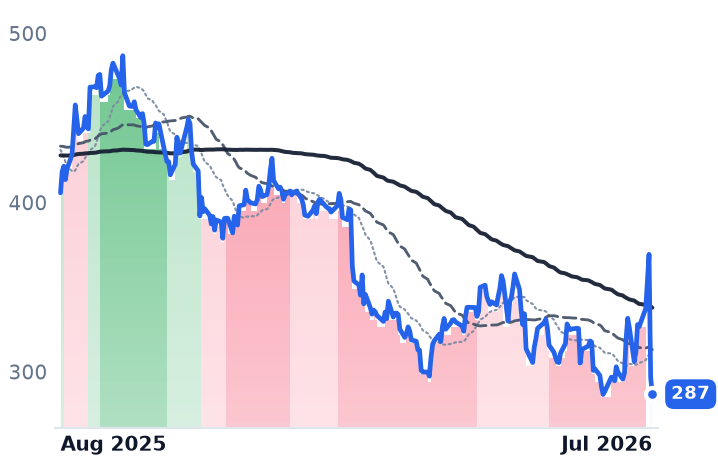
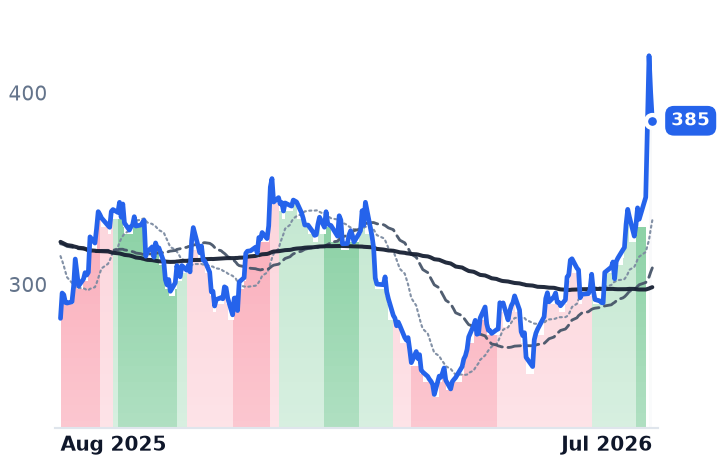
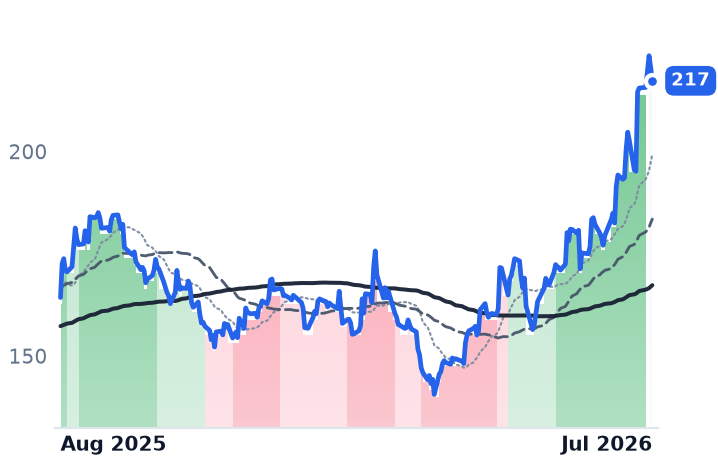
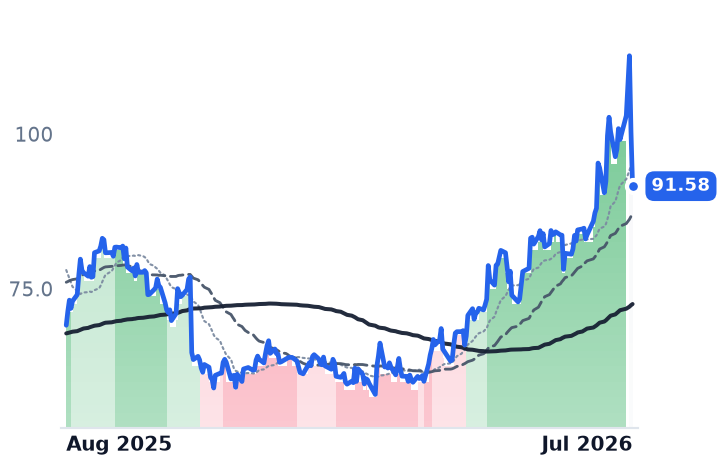
LAD 12-month price
Traditional Dealership Groups
PAG
Penske Automotive
217
−3.30 (−1.50%)
vs. prior close
Price20d50d150d
PAG 12-month price
Traditional Dealership Groups
SAH
Sonic Automotive
91.58
−8.76 (−8.73%)
vs. prior close
Price20d50d150d
SAH 12-month price
Traditional Dealership Groups
TickerMkt capP/EP/E fwdP/SP/S fwdP/GPP/GP fwdEV/EBITDAFCF yld
LAD$6.0B8.6x7.6x0.2x0.2x1.3x1.3x7.2x-4.0%
PAG$10.7B11.5x12.0x0.3x0.3x1.8x1.8x12.4x4.4%
SAH$2.5B22.8x10.9x0.2x0.2x1.3x1.3x13.4x10.5%

Valuation & fundamentals

Consensus projections

TickerFY2026EFY2027EFY2028E
ABGRevenue−0.6%+4.5%+7.4%
EPS−8.2%+14.8%+8.7%
ANRevenue−0.3%+3.2%+2.8%
EPS+7.4%+12.8%+8.0%
GPIRevenue+0.7%+3.3%+4.9%
EPS+2.1%+12.5%+10.2%
LADRevenue+2.0%+4.1%+7.2%
EPS−2.7%+17.9%+10.8%
PAGRevenue+5.1%+3.2%+2.2%
EPS+0.2%+6.9%+5.0%
SAHRevenue+2.5%+4.3%+4.9%
EPS+3.0%+9.4%+4.5%

Forward fiscal years only. Blank means no analyst coverage for that year.

The six largest publicly traded chains of franchised new-car dealerships all reported second-quarter results within four trading days in late July, and the market's reaction to that earnings cluster — not a slow-building industry re-rating — accounts for nearly all of the group's recent share-price gains. A database screen had flagged this as a rare "gradual" multi-month upgrade across six stocks; the trading record shows something narrower: a compressed earnings-week reaction with genuinely mixed underlying results, plus one name that is moving mostly because of a buyout offer.

What each business actually did. Lithia Motors, which trades as Lithia & Driveway (LAD) and is the largest dealership group by revenue with its own vehicle-financing arm, posted a clean beat: record $9.8 billion in quarterly revenue, adjusted EPS of $10.03 versus $8.81 expected, stable new-vehicle margins and financing income up 80%, and it kept buying back stock — details here. Penske Automotive Group (PAG), whose franchised dealerships sit alongside Premier Truck Group's commercial-truck stores and sizable international operations, also beat on both revenue and EPS, with truck orders up 170% — results here — but its stock is now driven chiefly by an unsolicited $210-a-share, roughly $3.8 billion take-private proposal from its founding family's holding company and Mitsui, a 19–25% premium to recent trading levels disclosed July 24 — offer details. AutoNation (AN), the largest dealer by store count, beat EPS estimates for a sixth straight quarter on record after-sales (service and parts) profit, even as new-vehicle gross profit and electric-vehicle sales fell — call highlights. Asbury Automotive Group (ABG) beat adjusted EPS but net income fell 25% year over year — report. Sonic Automotive (SAH), which pairs franchised stores with its EchoPark used-car chain, beat estimates but adjusted profit still fell 17–23% and its stock actually dropped after the print on the lack of forward guidance — coverage. Group 1 Automotive (GPI), a US and UK dealership operator that is also acquiring a 10-store Atlanta group, was the outright weak print: revenue down 5.6%, gross profit down 8%, EPS down about 20% — results.

Sector versus company. This is a case of one name leading, one diverging, and one distorted by a corporate-control event rather than a uniform re-rating. Lithia supplied most of the group's raw 30-day gain (roughly +30%) on its clean beat. Group 1 diverged outright — its stock is net negative over the same 30 days despite an initial earnings pop that fully reversed, consistent with its weaker numbers. Penske's gain is now inseparable from deal speculation rather than operating momentum. AutoNation, Asbury and Sonic moved by smaller, earnings-week-sized amounts that broadly track the mixed nature of their prints.

Fundamentals: CONTRADICTS the "gradual re-rating" framing, INCONCLUSIVE on valuation. The used-vehicle-supply story tariffs feed into is real but not resolved: the Manheim wholesale used-vehicle index actually eased 0.6% in early July, describing a normalizing market rather than a fresh supply squeeze — index data. Section 232 tariffs are now visibly adding thousands of dollars to imported-vehicle stickers — tariff guide — while the expiration of the federal EV tax credit hit new-EV demand hard, corroborated by AutoNation's 30% drop in battery-electric unit sales — EV credit summary. On leverage, Lithia's net debt rose to 3.17 times EBITDA from 2.53 times a year earlier even as earnings beat — leverage detail, a capital-structure flag worth watching given rising floor-plan interest costs industry-wide. A systematic ten-year valuation history could not be pulled for five of the six names this cycle; the one comparable data point obtained — Lithia near 7.3 times trailing earnings and 13.2 times EV/EBITDA — is directionally consistent with an industry trading near 8.2 times EV/EBITDA against the S&P 500's roughly 15.6 times, but it is too thin a sample to call the group's re-rating "already spent" or not — multiples source, directional only.

The tape, briefly. Trend-band data for Group 1, Lithia, Penske and Sonic all show a one-day jump from an extreme reading straight to neutral on the day each reported, not a multi-month drift — the opposite of the "gradual" pattern the original screen flagged. Asbury's shift was the least abrupt, beginning a few sessions ahead of its print. That pattern confirms this is an earnings-week reaction cluster, and — for Penske — a deal-pricing event, not a validated multi-month industry re-rating.

The setup

Where it stands — Five of six dealer stocks rose in a four-day earnings window with genuinely mixed results underneath, and Penske trades partly on a pending buyout offer. Would confirm — New- and used-vehicle gross profit per unit stabilizing and parts-and-service same-store gross growing at a high-single-digit rate across Q3 2026 prints. Would invalidate — Group 1's per-unit volumes and gross profit continuing to decline in Q3, or floor-plan interest expense growing faster than gross profit group-wide. Watch next — Penske's special committee response to the $210/share take-private proposal, and Q3 2026 earnings expected in late October 2026. Valuation — Group EV/EBITDA near 8.2x versus the S&P 500's ~15.6x; Lithia alone near 7.3x trailing P/E, both below the group's own multi-year norms on limited data.

Solar Trio Diverges: Sunrun Slides on Tax-Credit Loss, XPLR and Clearway Hold Guidance

Hypothesis Opus 5 · Research Sonnet 5 · Writing Sonnet 5 · Prompt v1.1

Three renewable-power stocks bought together on a bet that solar and storage would capture rising power prices fell an average 10.5% in a month, but the average hides a split: XPLR Infrastructure is actually up and guiding higher, Clearway Energy's miss was weather not cash flow, and only Sunrun is genuinely worse off after losing a federal tax credit.

XIFRCWENRUNENPHBEP
TickerCompanySegmentTrend30D1Y
XIFRXPLR InfrastructureRenewable & Infrastructure Assets🟢 Cont. Bull−4.3%+29.3%
CWENClearway EnergyWind & Solar Developers⚠️ Emerging Bear−4.1%+1.0%
RUNSunrunResidential Solar Installers⚠️ Emerging Bear−24.4%+1.1%
ENPHEnphase EnergyInverters & Power Electronics🌱 Emerging Bull−15.7%+18.5%
BEPBrookfield Renewable PartnersDiversified Renewable Generators🟢 Cont. Bull−2.8%+26.6%

12-month price & trend

XIFR
XPLR Infrastructure
11.90
+0.04 (+0.34%)
vs. prior close
Price20d50d150d
XIFR 12-month price
Renewable & Infrastructure Assets
CWEN
Clearway Energy
31.73
+0.00 (+0.00%)
vs. prior close
Price20d50d150d
CWEN 12-month price
Wind & Solar Developers
RUN
Sunrun
9.81
+0.29 (+3.05%)
vs. prior close
Price20d50d150d
RUN 12-month price
Residential Solar Installers
TickerMkt capP/EP/E fwdP/SP/S fwdP/GPP/GP fwdEV/EBITDAFCF yld
XIFR$1.1B17.8x3.5x0.9x0.8x5.2x4.6x9.0x-56.5%
CWEN$6.5B793.3x4.4x3.9x8.6x7.6x14.3x9.0%
RUN$2.3B4.0x8.1x0.7x0.8x2.3x2.6x22.0x-32.1%
ENPH
Enphase Energy
37.54
+0.16 (+0.43%)
vs. prior close
Price20d50d150d
ENPH 12-month price
Inverters & Power Electronics
BEP
Brookfield Renewable Partners
32.86
+0.20 (+0.61%)
vs. prior close
Price20d50d150d
BEP 12-month price
Diversified Renewable Generators
TickerMkt capP/EP/E fwdP/SP/S fwdP/GPP/GP fwdEV/EBITDAFCF yld
ENPH$5.0B36.8x18.5x3.7x4.2x7.9x8.9x28.4x3.1%
BEP$10.5B54.3x1.7x1.5x7.0x6.1x9.6x-48.1%

Valuation & fundamentals

Consensus projections

TickerFY2026EFY2027EFY2028E
XIFRRevenue−0.5%+6.4%+2.4%
EPS−2313.0%−17.3%−43.1%
CWENRevenue+17.0%+11.6%+12.6%
EPS−164.1%−148.8%+63.8%
RUNRevenue+26.6%+7.7%+13.7%
EPS−11.7%−61.6%+54.2%
ENPHRevenue−19.3%+5.7%+11.2%
EPS−27.9%+10.2%+17.8%
BEPRevenue+8.3%+11.0%+0.9%
EPS+22.8%−18.4%−12.6%

Forward fiscal years only. Blank means no analyst coverage for that year.

A trio of renewable-power stocks bought on the same thesis — that solar and storage projects would profit as electricity prices rise with data-center demand — fell an average of about 10.5% over the past month. That average, however, describes no single company. One of the three is up double digits and raising its spending plans; another missed on weather, not cash flow; and only the third is dealing with a real, policy-driven hit to its business.

XPLR Infrastructure, a yieldco spun out of NextEra Energy that owns long-term power contracts on wind, solar and Texas gas-pipeline assets, is up 15% over 90 days and nearly 29% over the past year. Its second-quarter adjusted earnings before interest, taxes, depreciation and amortization (EBITDA) came in at $523 million, the company fully repaid $500 million of convertible notes that had been an overhang, and it reaffirmed full-year EBITDA guidance of $1.75-1.95 billion. XPLR trades at 9x trailing earnings and under 1x sales — cheap, not de-rated.

Clearway Energy, which owns and operates a 13.6-gigawatt fleet of contracted wind, solar and gas plants across the country, is down 21% over 90 days, and its trend has genuinely flipped from a sustained uptrend to a sustained downtrend. But the cause is weather, not a broken business model: an El Niño pattern held wind output to 96% of plan and solar to 95% in the first half, pressuring near-term cash available for distribution. Management still reaffirmed full-year 2026 cash-available-for-distribution guidance of $470-510 million and actually raised its 2026-2029 capital-spending plan 20%, to $3 billion. One analyst note argues the stock is now roughly 24% undervalued ahead of its August 5 earnings report, which will confirm or break that guidance.

Sunrun, the largest U.S. residential solar and battery installer, which finances most systems through subscriptions rather than outright sales, is where the pain is real. The federal residential solar tax credit, known as Section 25D, expired entirely on January 1 with no phase-down, and Sunrun's first-quarter subscriber additions fell 25% year over year with installed capacity down 19% and cash generation negative $59 million. The company still guides to $250-450 million of full-year cash generation, and Jefferies argues Sunrun's subscription model could relatively benefit as owner-financed rivals lose the credit entirely — but the near-term numbers back the stock's 48% six-month decline.

Two adjacent names confirm the split rather than resolve it. Enphase Energy, which makes the microinverters and home batteries used in rooftop solar systems, saw revenue fall 19.6% year over year — a real deterioration matching its stock's decline. Brookfield Renewable, a global owner of hydro, wind, solar and battery assets, posted record quarterly funds from operations, up 11% per unit, and is barely down at all — its stock is following its own business, not the group.

The backdrop cuts both ways. The Energy Information Administration expects summer wholesale power prices to fall 8% this year on cheap gas, meaning the near-term "marginal price" catalyst these stocks were bought for hasn't shown up yet. But PJM capacity auction prices, a forward-looking signal of grid tightness from data-center demand, rose 833% year over year — the multi-year thesis remains intact even as 2026 spot prices disappoint.

On valuation: XPLR at 9x trailing earnings and Clearway at roughly 5x sales both sit well below levels that would price in a business break, and both have reaffirmed the guidance a reader can check against the tape. Sunrun's 0.75x sales multiple already reflects distress, leaving less room for further multiple compression even if subscriber growth stays weak.

The setup

Where it stands — XPLR is rising on reaffirmed guidance, Clearway fell on weather with cash-flow guidance intact, and only Sunrun shows a real policy-driven deceleration. Would confirm — Clearway's August 5 print holds $470-510 million CAFD guidance; Sunrun's subscriber adds keep falling below 2025 levels next two quarters. Would invalidate — Clearway cuts CAFD guidance below $470 million, or Sunrun's quarterly cash generation turns positive and subscriber adds stabilize. Watch next — Clearway Energy reports second-quarter results after market close on August 5, 2026. Valuation — XPLR trades at 9x trailing earnings versus its own multi-year range near lows; Clearway at ~5x sales versus a analyst-flagged 24% undervaluation into earnings.