

Car Dealer Stocks Jumped Together in July — It Was Earnings Week, Not a Trend Change
Hypothesis Opus 5 · Research Sonnet 5 · Writing Sonnet 5 · Prompt v1.1
The six largest franchised auto-dealer chains reported quarterly results within four trading days in late July; the resulting bunched earnings reactions, not a gradual industry re-rating, explain most of the group's one-month gain — and one member's move is really a takeover bid.
| Ticker | Company | Segment | Trend | 30D | 1Y |
|---|---|---|---|---|---|
ABG | Asbury Automotive | Traditional Dealership Groups | 🔴 Cont. Bear | +11.4% | +3.5% |
AN | AutoNation | Traditional Dealership Groups | ⚠️ Emerging Bear | +11.4% | +12.2% |
GPI | Group 1 Automotive | Traditional Dealership Groups | 🔴 Cont. Bear | −3.4% | −29.3% |
LAD | Lithia Motors | Traditional Dealership Groups | 🔴 Cont. Bear | +24.7% | +36.5% |
PAG | Penske Automotive | Traditional Dealership Groups | 🌱 Emerging Bull | +18.5% | +32.3% |
SAH | Sonic Automotive | Traditional Dealership Groups | 🌱 Emerging Bull | +6.6% | +32.5% |
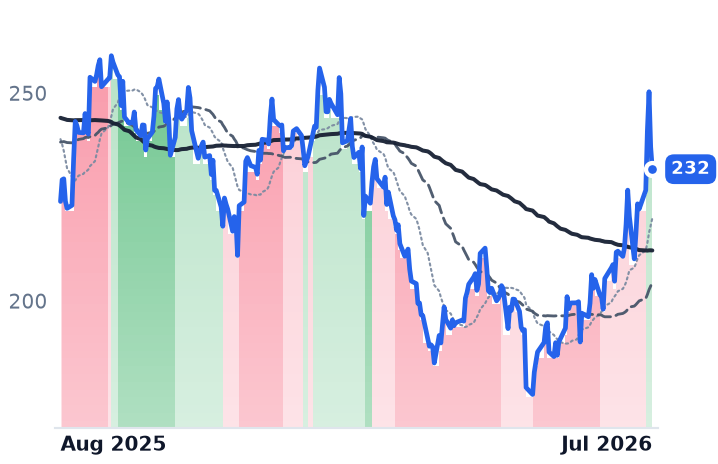
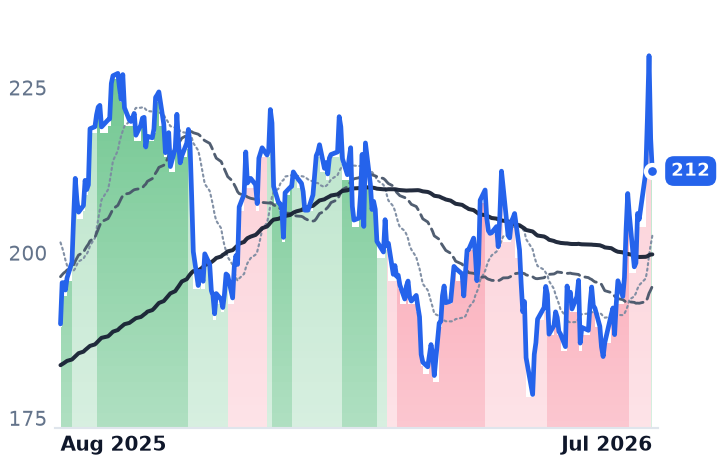
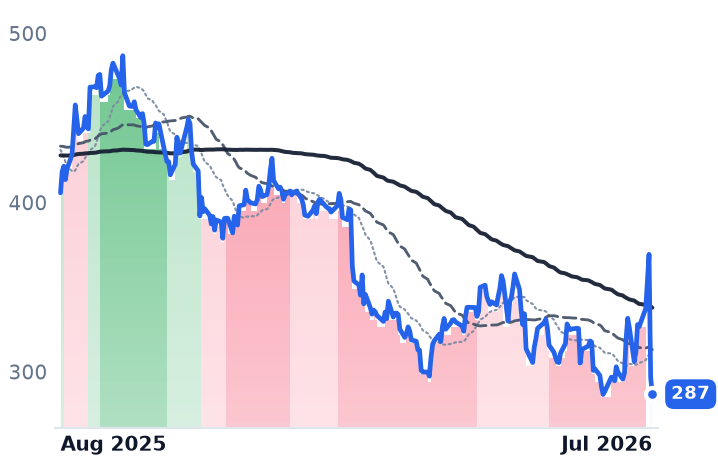
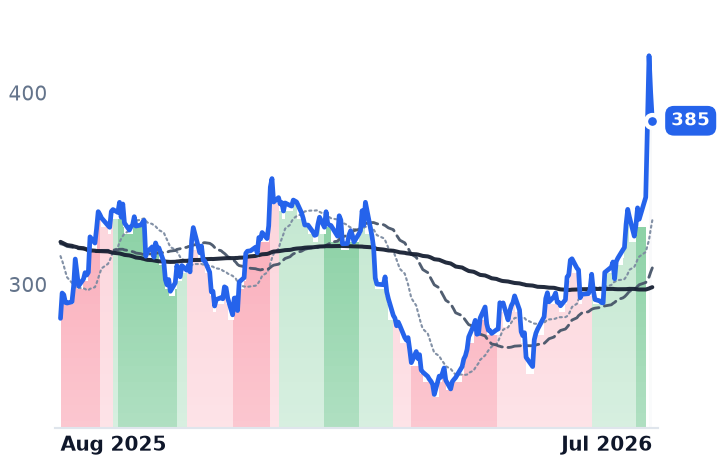
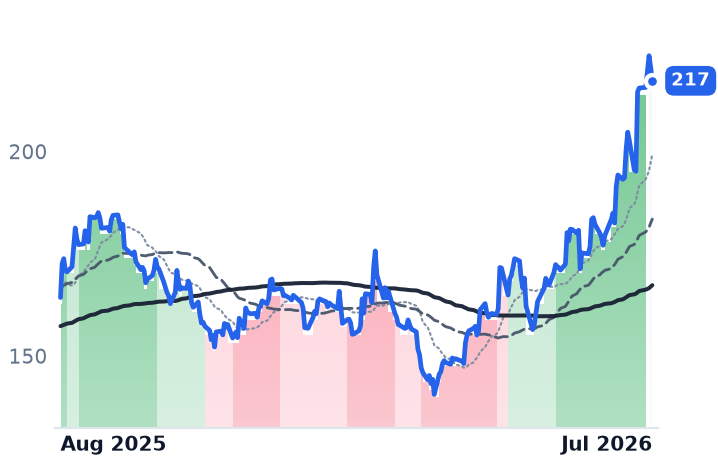
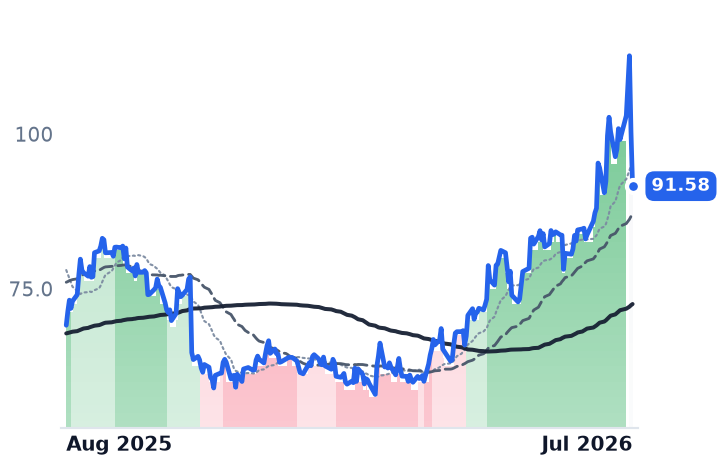
12-month price & trend
| Ticker | Mkt cap | P/E | P/E fwd | P/S | P/S fwd | P/GP | P/GP fwd | EV/EBITDA | FCF yld |
|---|---|---|---|---|---|---|---|---|---|
ABG | $3.3B | 8.3x | 7.0x | 0.2x | 0.2x | 1.2x | 1.2x | 8.9x | 18.0% |
AN | $6.2B | 9.4x | 8.6x | 0.2x | 0.2x | 1.1x | 1.1x | 10.8x | -1.7% |
GPI | $3.7B | 11.5x | 7.4x | 0.2x | 0.2x | 1.3x | 1.3x | 8.6x | 7.5% |
| Ticker | Mkt cap | P/E | P/E fwd | P/S | P/S fwd | P/GP | P/GP fwd | EV/EBITDA | FCF yld |
|---|---|---|---|---|---|---|---|---|---|
LAD | $6.0B | 8.6x | 7.6x | 0.2x | 0.2x | 1.3x | 1.3x | 7.2x | -4.0% |
PAG | $10.7B | 11.5x | 12.0x | 0.3x | 0.3x | 1.8x | 1.8x | 12.4x | 4.4% |
SAH | $2.5B | 22.8x | 10.9x | 0.2x | 0.2x | 1.3x | 1.3x | 13.4x | 10.5% |
Valuation & fundamentals
Consensus projections
| Ticker | FY2026E | FY2027E | FY2028E | |
|---|---|---|---|---|
ABG | Revenue | −0.6% | +4.5% | +7.4% |
| EPS | −8.2% | +14.8% | +8.7% | |
AN | Revenue | −0.3% | +3.2% | +2.8% |
| EPS | +7.4% | +12.8% | +8.0% | |
GPI | Revenue | +0.7% | +3.3% | +4.9% |
| EPS | +2.1% | +12.5% | +10.2% | |
LAD | Revenue | +2.0% | +4.1% | +7.2% |
| EPS | −2.7% | +17.9% | +10.8% | |
PAG | Revenue | +5.1% | +3.2% | +2.2% |
| EPS | +0.2% | +6.9% | +5.0% | |
SAH | Revenue | +2.5% | +4.3% | +4.9% |
| EPS | +3.0% | +9.4% | +4.5% |
Forward fiscal years only. Blank means no analyst coverage for that year.
The six largest publicly traded chains of franchised new-car dealerships all reported second-quarter results within four trading days in late July, and the market's reaction to that earnings cluster — not a slow-building industry re-rating — accounts for nearly all of the group's recent share-price gains. A database screen had flagged this as a rare "gradual" multi-month upgrade across six stocks; the trading record shows something narrower: a compressed earnings-week reaction with genuinely mixed underlying results, plus one name that is moving mostly because of a buyout offer.
What each business actually did. Lithia Motors, which trades as Lithia & Driveway (LAD) and is the largest dealership group by revenue with its own vehicle-financing arm, posted a clean beat: record $9.8 billion in quarterly revenue, adjusted EPS of $10.03 versus $8.81 expected, stable new-vehicle margins and financing income up 80%, and it kept buying back stock — details here. Penske Automotive Group (PAG), whose franchised dealerships sit alongside Premier Truck Group's commercial-truck stores and sizable international operations, also beat on both revenue and EPS, with truck orders up 170% — results here — but its stock is now driven chiefly by an unsolicited $210-a-share, roughly $3.8 billion take-private proposal from its founding family's holding company and Mitsui, a 19–25% premium to recent trading levels disclosed July 24 — offer details. AutoNation (AN), the largest dealer by store count, beat EPS estimates for a sixth straight quarter on record after-sales (service and parts) profit, even as new-vehicle gross profit and electric-vehicle sales fell — call highlights. Asbury Automotive Group (ABG) beat adjusted EPS but net income fell 25% year over year — report. Sonic Automotive (SAH), which pairs franchised stores with its EchoPark used-car chain, beat estimates but adjusted profit still fell 17–23% and its stock actually dropped after the print on the lack of forward guidance — coverage. Group 1 Automotive (GPI), a US and UK dealership operator that is also acquiring a 10-store Atlanta group, was the outright weak print: revenue down 5.6%, gross profit down 8%, EPS down about 20% — results.
Sector versus company. This is a case of one name leading, one diverging, and one distorted by a corporate-control event rather than a uniform re-rating. Lithia supplied most of the group's raw 30-day gain (roughly +30%) on its clean beat. Group 1 diverged outright — its stock is net negative over the same 30 days despite an initial earnings pop that fully reversed, consistent with its weaker numbers. Penske's gain is now inseparable from deal speculation rather than operating momentum. AutoNation, Asbury and Sonic moved by smaller, earnings-week-sized amounts that broadly track the mixed nature of their prints.
Fundamentals: CONTRADICTS the "gradual re-rating" framing, INCONCLUSIVE on valuation. The used-vehicle-supply story tariffs feed into is real but not resolved: the Manheim wholesale used-vehicle index actually eased 0.6% in early July, describing a normalizing market rather than a fresh supply squeeze — index data. Section 232 tariffs are now visibly adding thousands of dollars to imported-vehicle stickers — tariff guide — while the expiration of the federal EV tax credit hit new-EV demand hard, corroborated by AutoNation's 30% drop in battery-electric unit sales — EV credit summary. On leverage, Lithia's net debt rose to 3.17 times EBITDA from 2.53 times a year earlier even as earnings beat — leverage detail, a capital-structure flag worth watching given rising floor-plan interest costs industry-wide. A systematic ten-year valuation history could not be pulled for five of the six names this cycle; the one comparable data point obtained — Lithia near 7.3 times trailing earnings and 13.2 times EV/EBITDA — is directionally consistent with an industry trading near 8.2 times EV/EBITDA against the S&P 500's roughly 15.6 times, but it is too thin a sample to call the group's re-rating "already spent" or not — multiples source, directional only.
The tape, briefly. Trend-band data for Group 1, Lithia, Penske and Sonic all show a one-day jump from an extreme reading straight to neutral on the day each reported, not a multi-month drift — the opposite of the "gradual" pattern the original screen flagged. Asbury's shift was the least abrupt, beginning a few sessions ahead of its print. That pattern confirms this is an earnings-week reaction cluster, and — for Penske — a deal-pricing event, not a validated multi-month industry re-rating.
The setup
Where it stands — Five of six dealer stocks rose in a four-day earnings window with genuinely mixed results underneath, and Penske trades partly on a pending buyout offer. Would confirm — New- and used-vehicle gross profit per unit stabilizing and parts-and-service same-store gross growing at a high-single-digit rate across Q3 2026 prints. Would invalidate — Group 1's per-unit volumes and gross profit continuing to decline in Q3, or floor-plan interest expense growing faster than gross profit group-wide. Watch next — Penske's special committee response to the $210/share take-private proposal, and Q3 2026 earnings expected in late October 2026. Valuation — Group EV/EBITDA near 8.2x versus the S&P 500's ~15.6x; Lithia alone near 7.3x trailing P/E, both below the group's own multi-year norms on limited data.