SanDisk's Cost of Goods Fell as Revenue Quadrupled. Its Shares Have Stalled Anyway
Hypothesis Opus 5 · Research Opus 5 · Writing Opus 5 · Prompt v1.5
The memory shortage has been blamed for thinner margins at server builders, storage vendors, broadband-gear makers and phone suppliers. Follow the money to the other end and the arithmetic does not close. SanDisk, which makes NAND flash memory, lifted June-quarter gross profit by $7.08bn year over year on $7.06bn of extra revenue — its cost of goods actually fell, so essentially every incremental dollar was price, not volume.
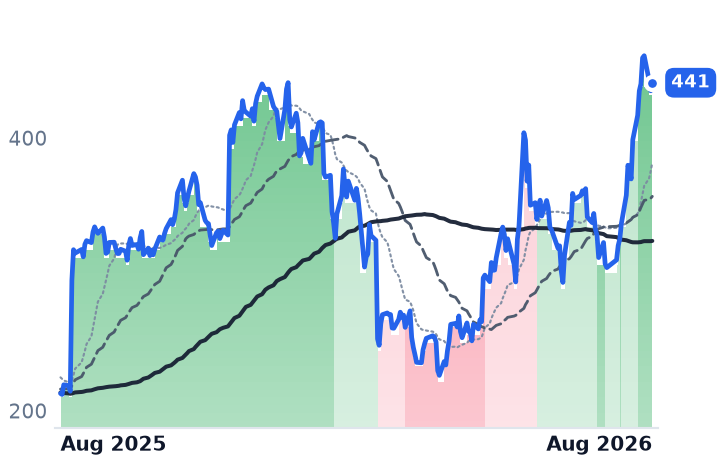
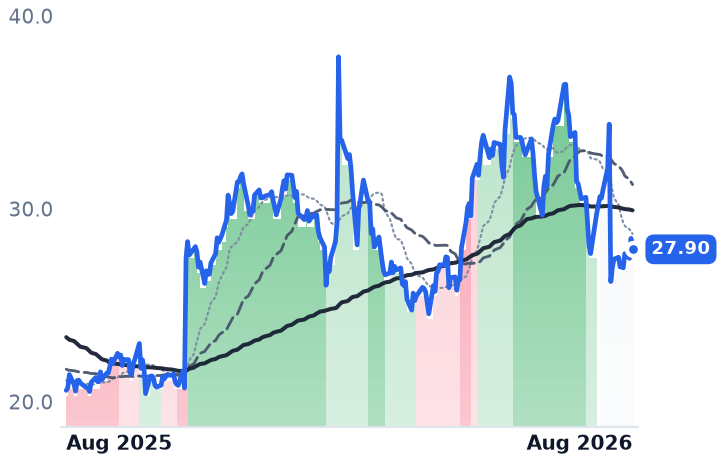
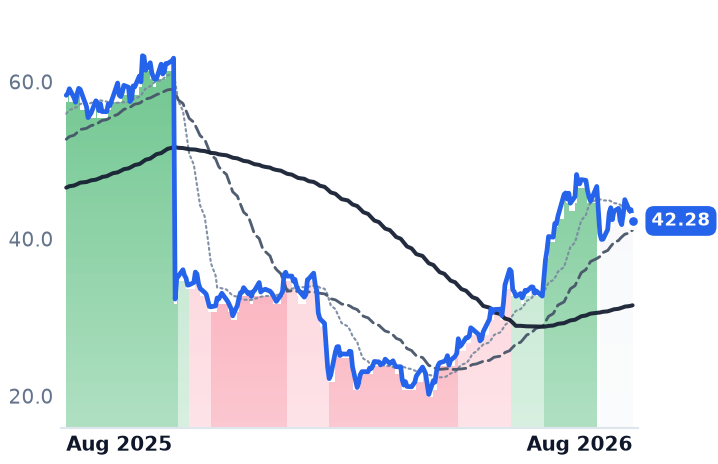
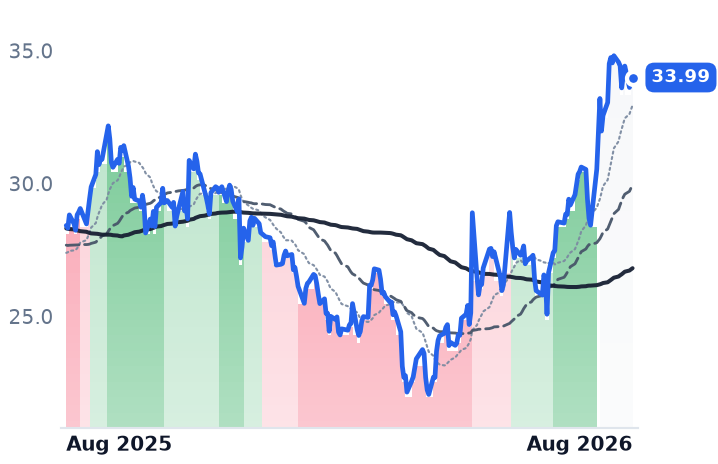
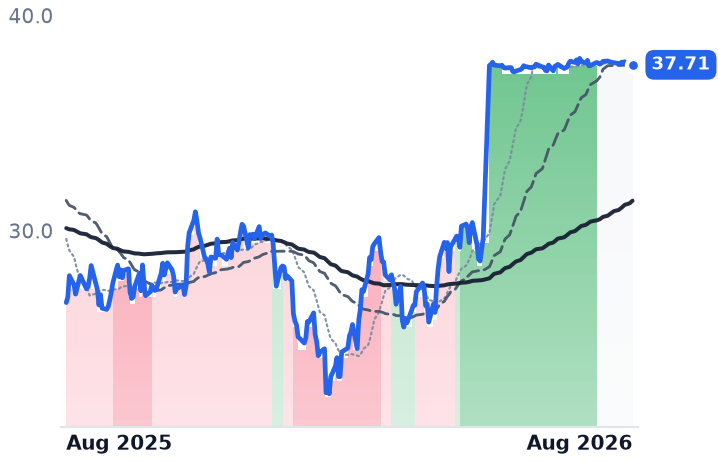
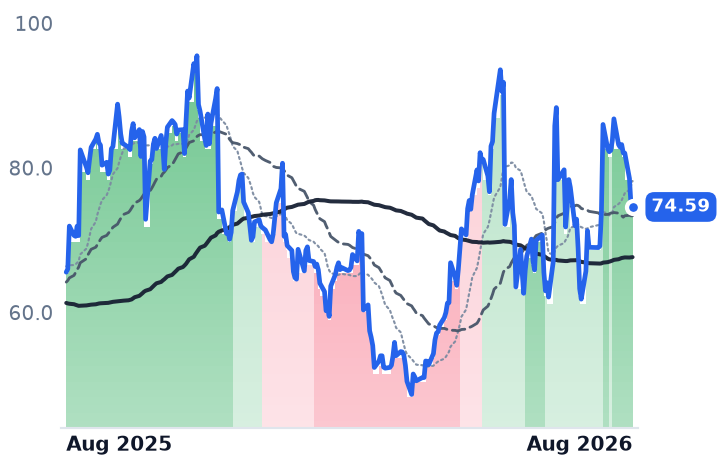
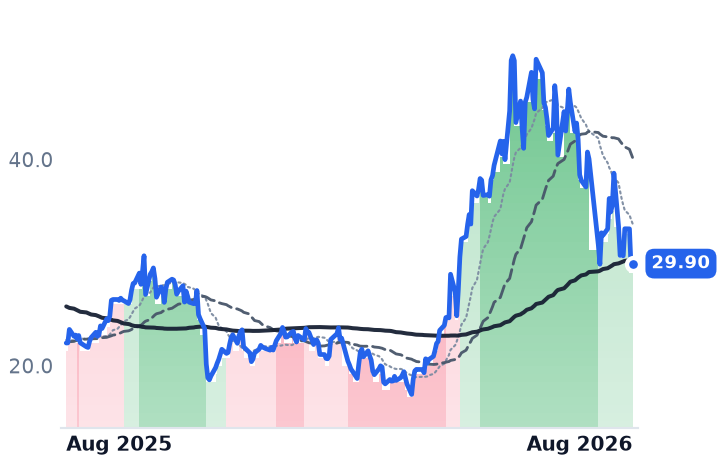
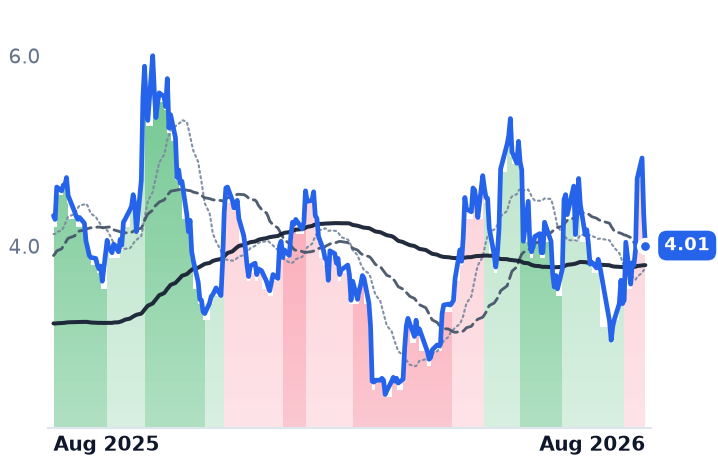
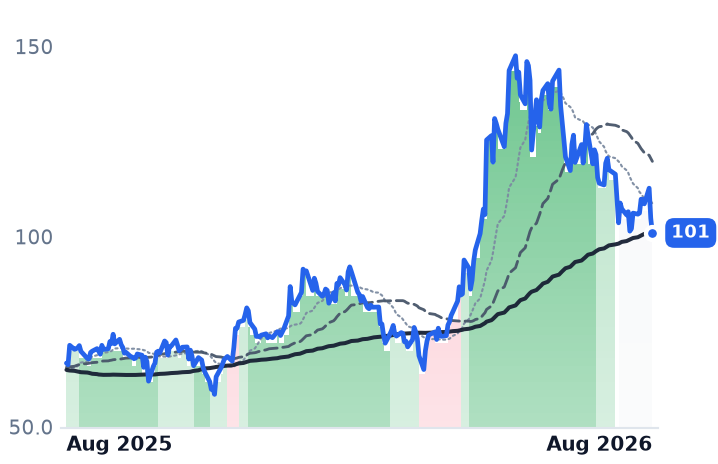
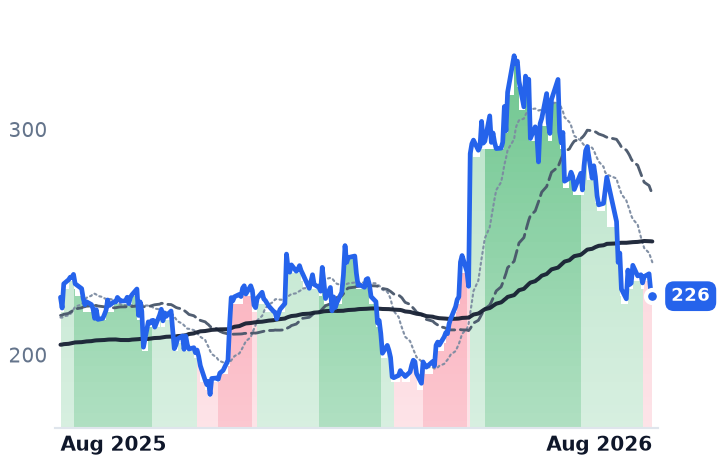
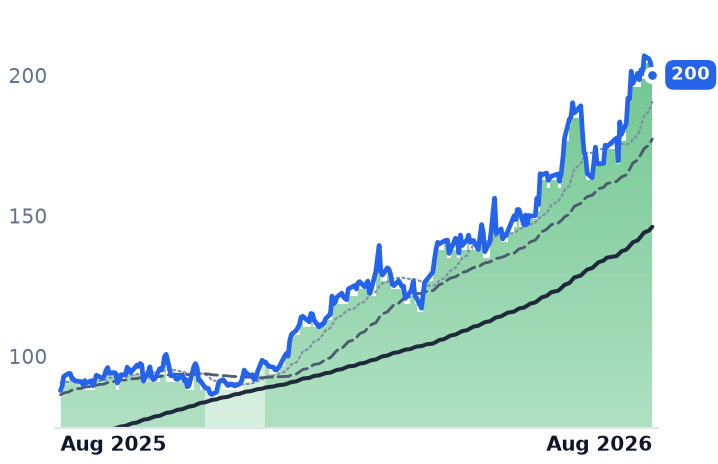
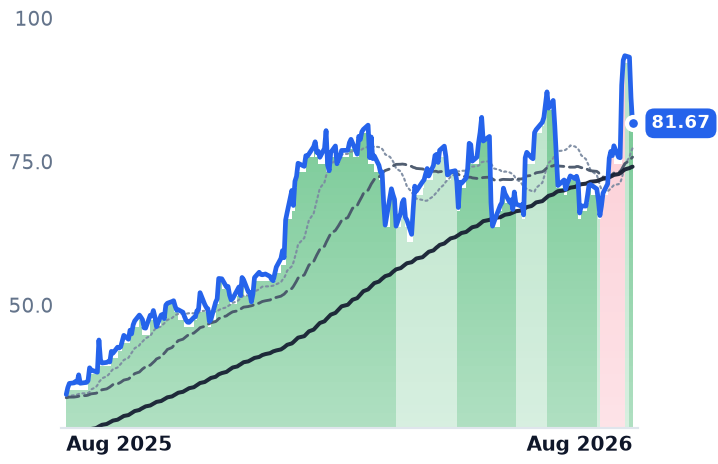
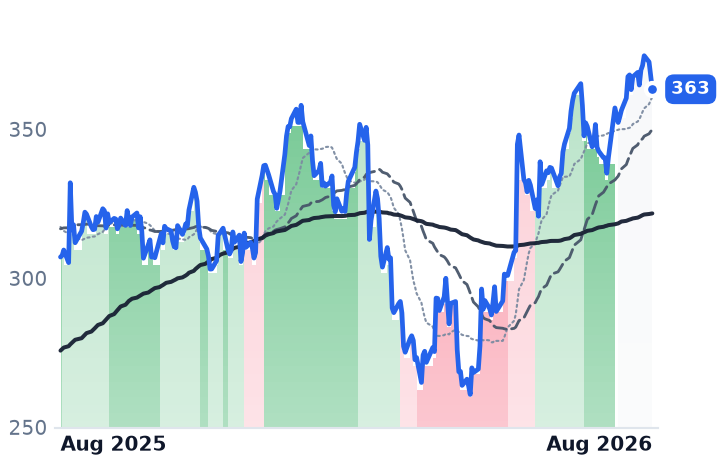
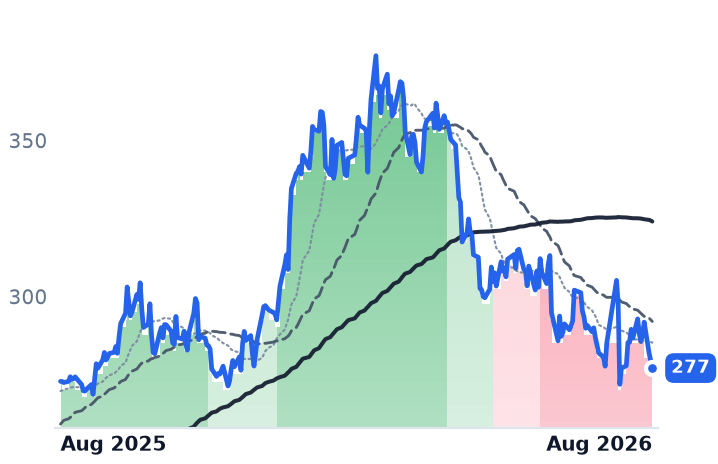
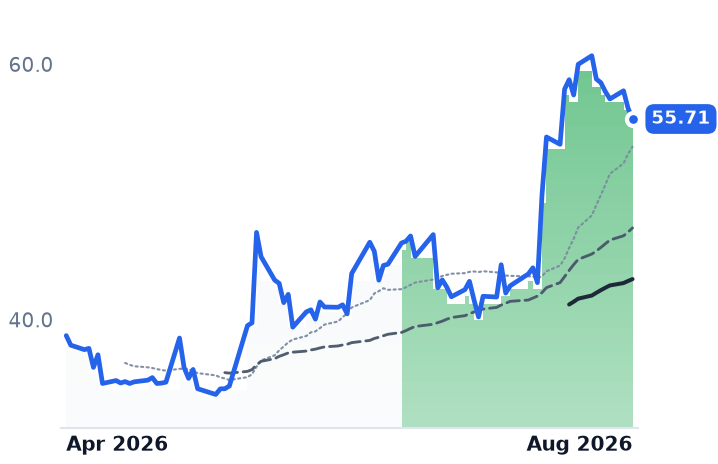
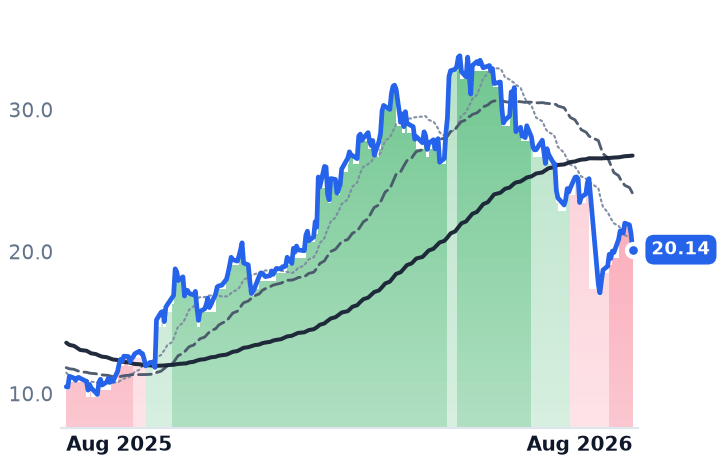
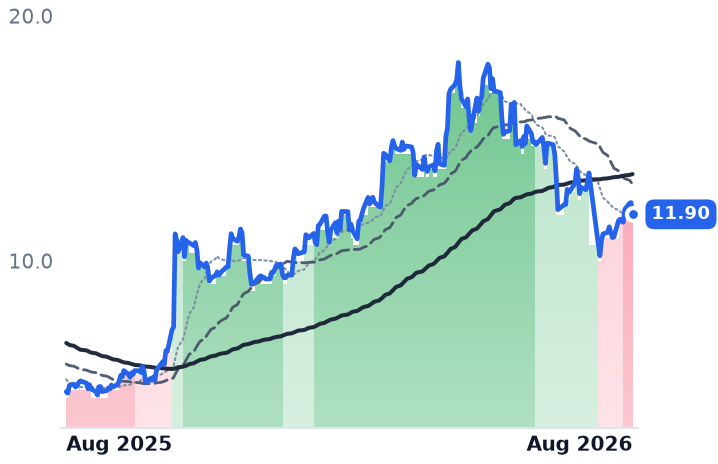
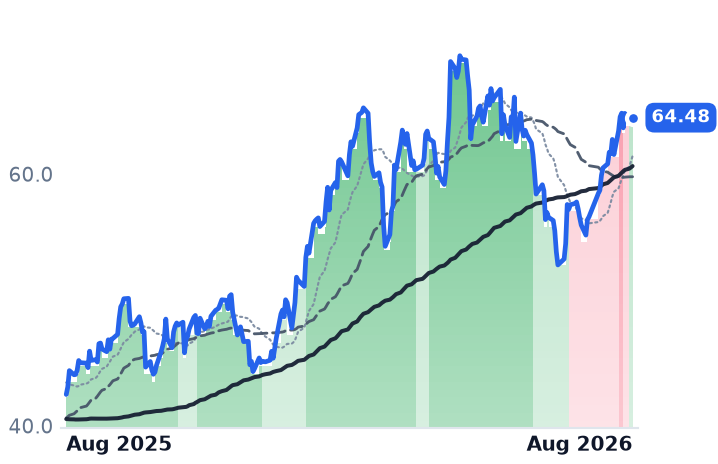
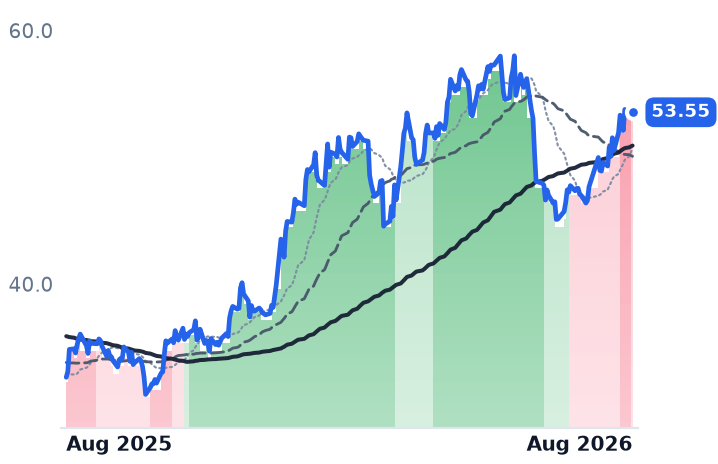
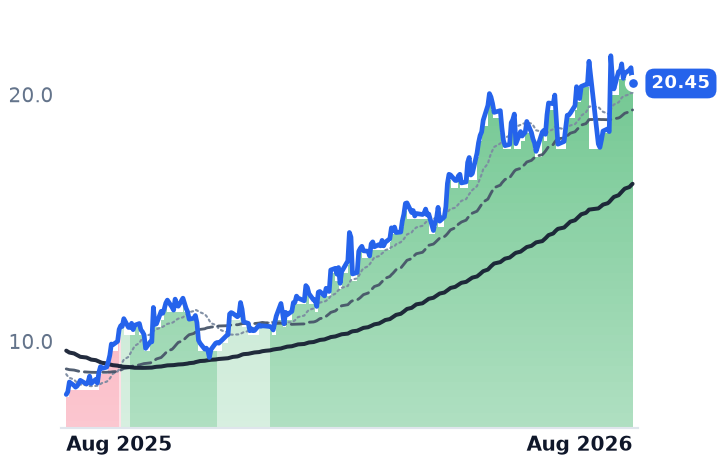
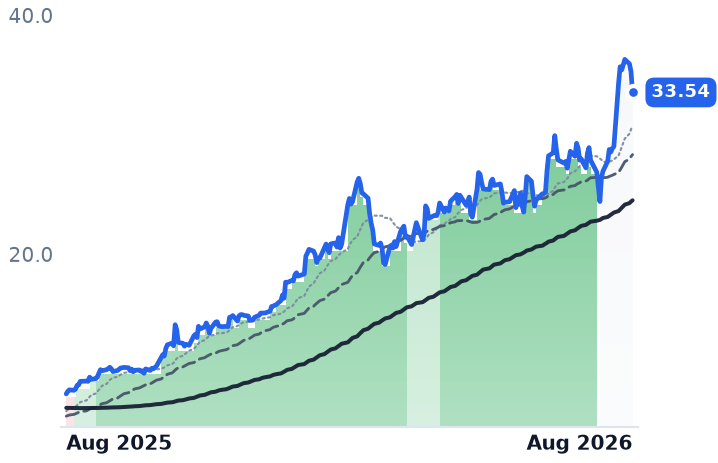
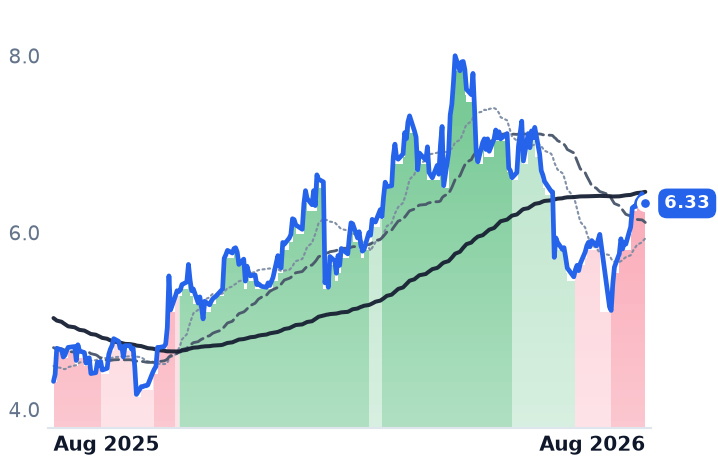
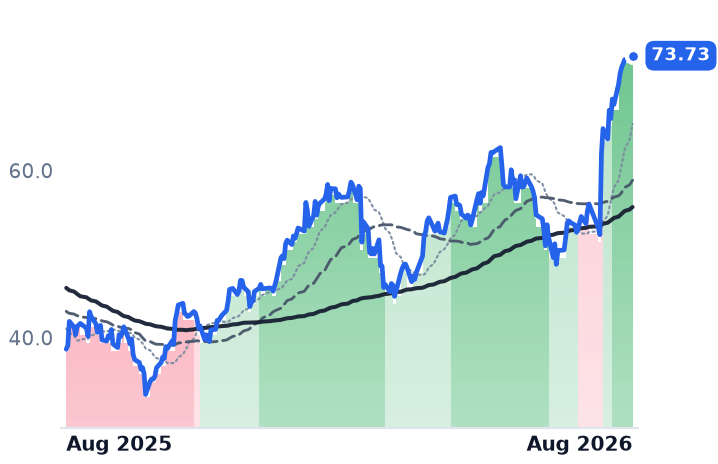
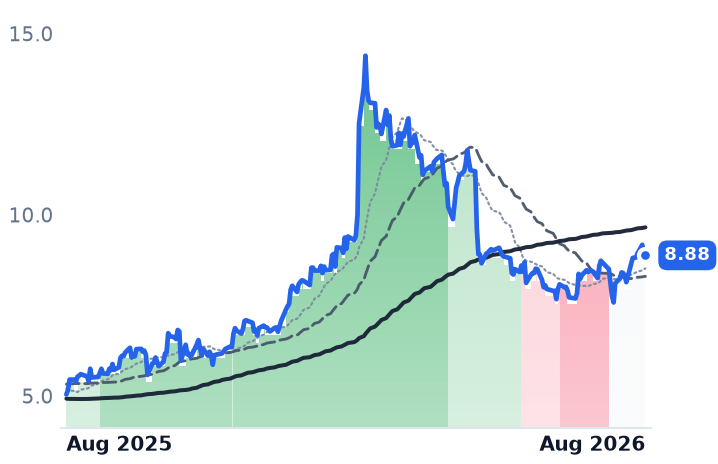
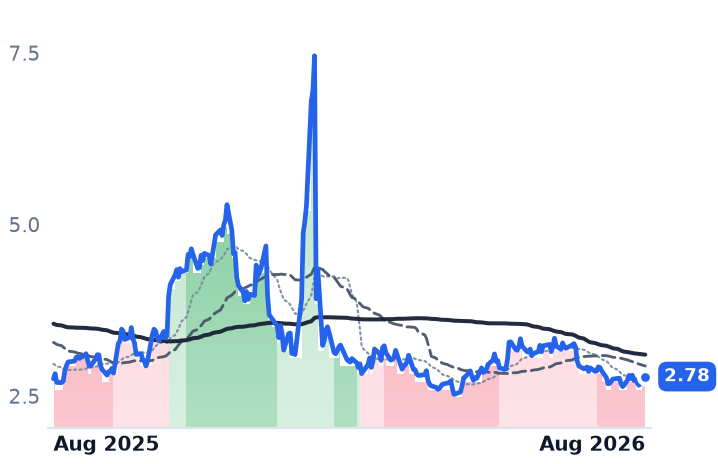
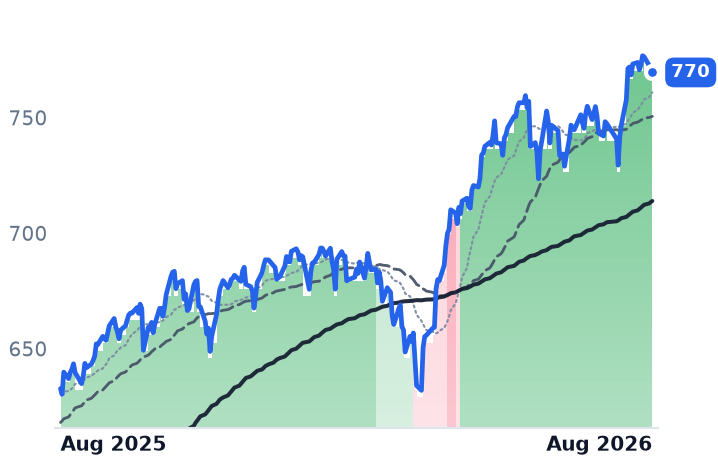
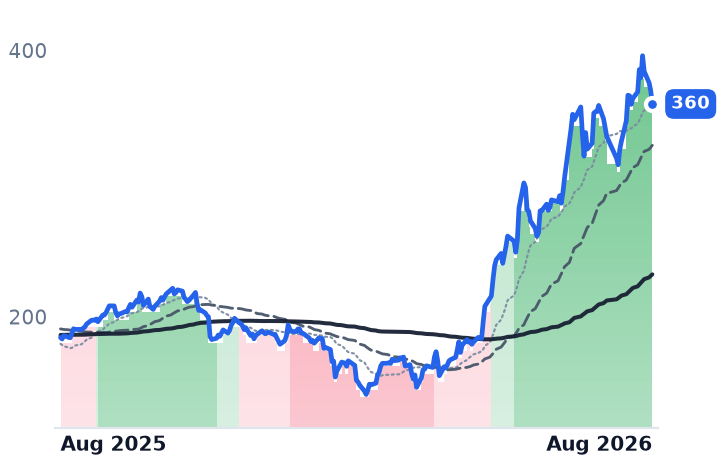
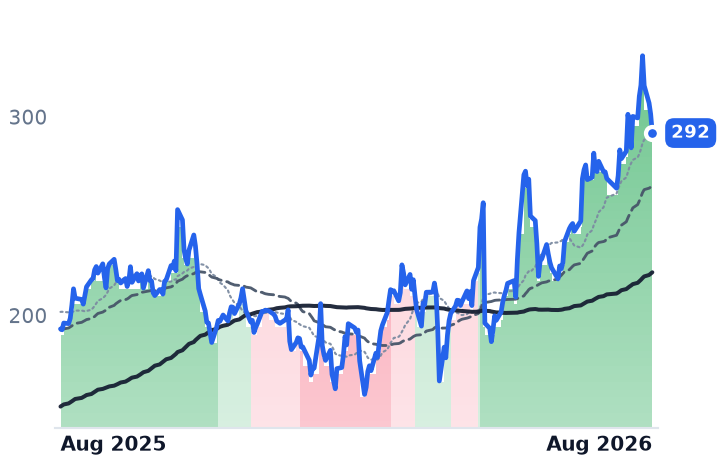
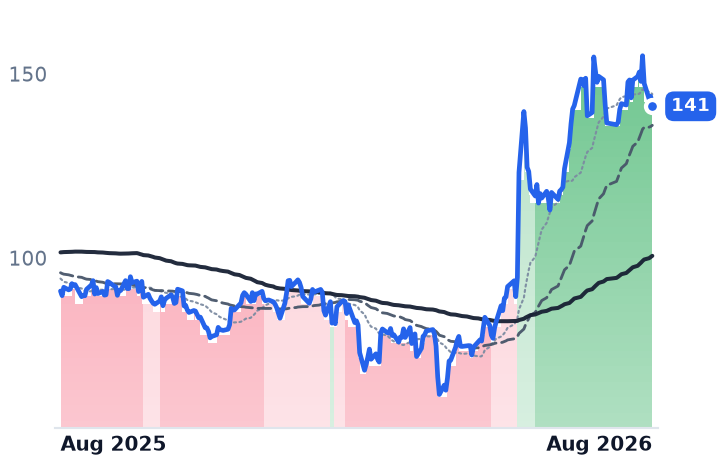
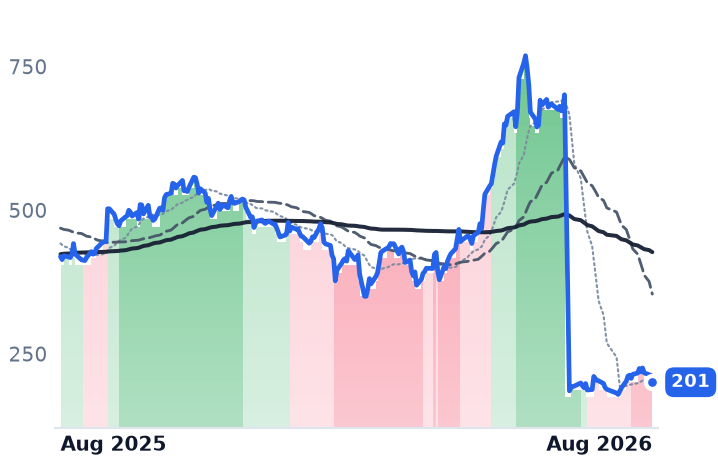
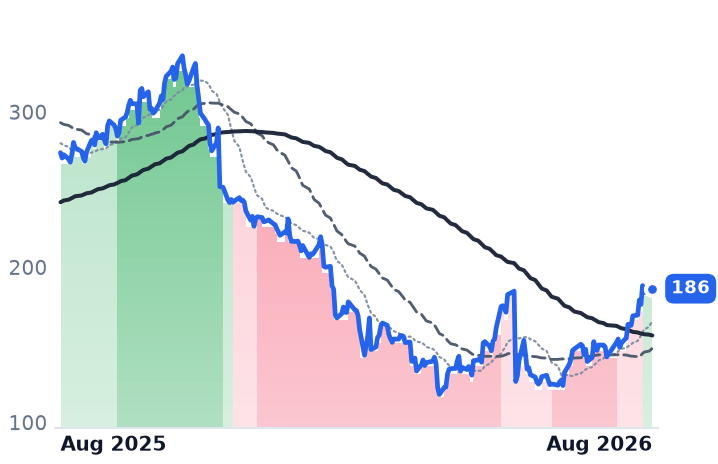
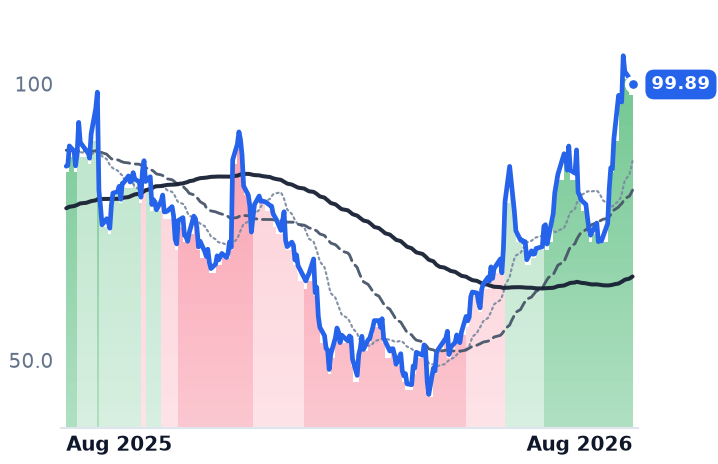
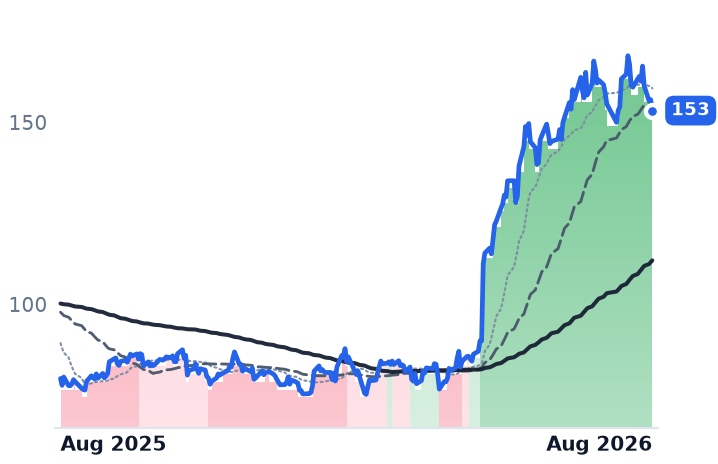
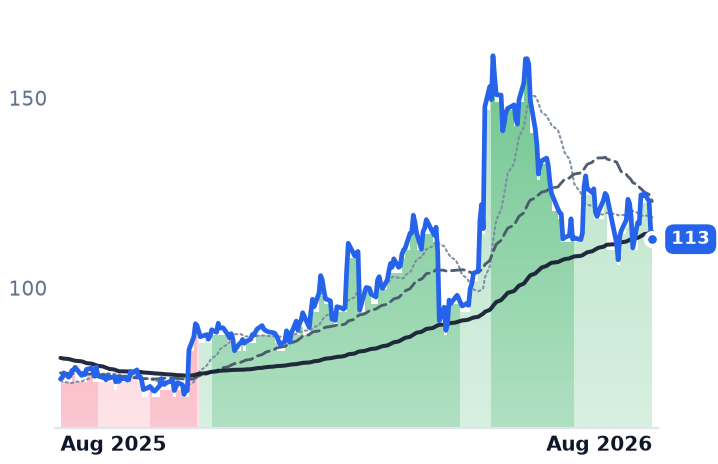
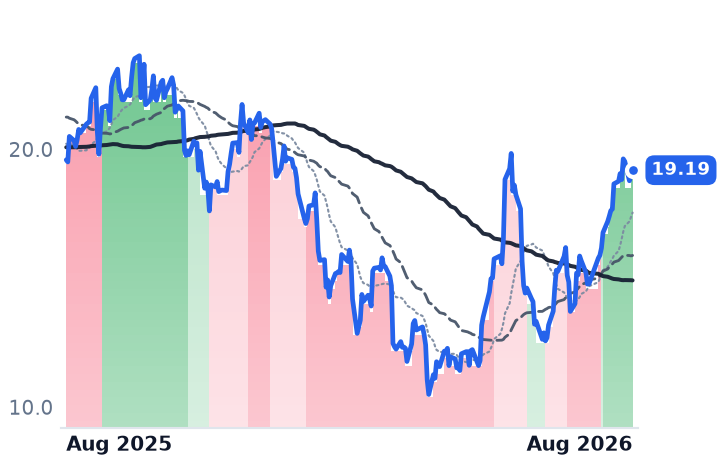
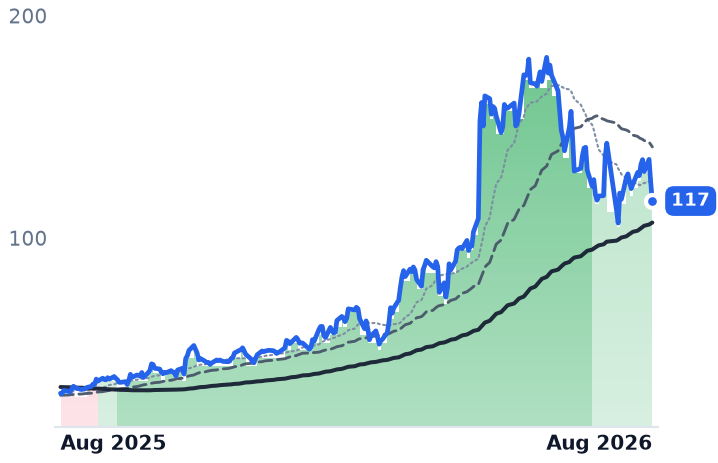
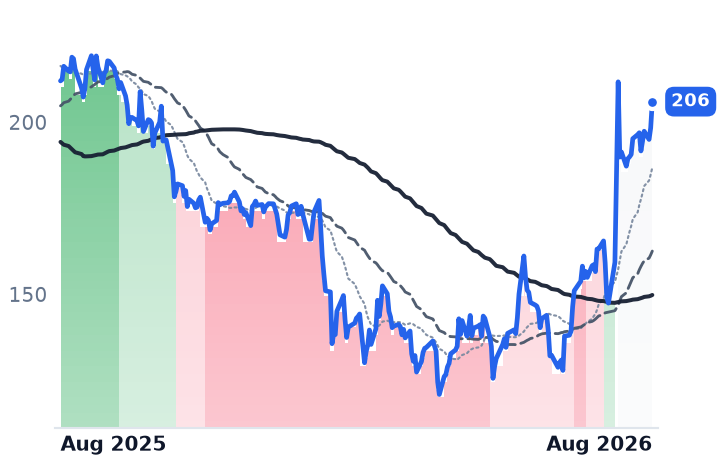
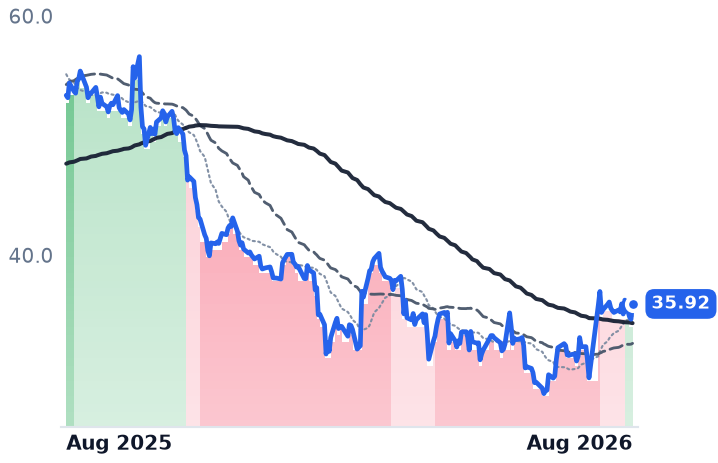
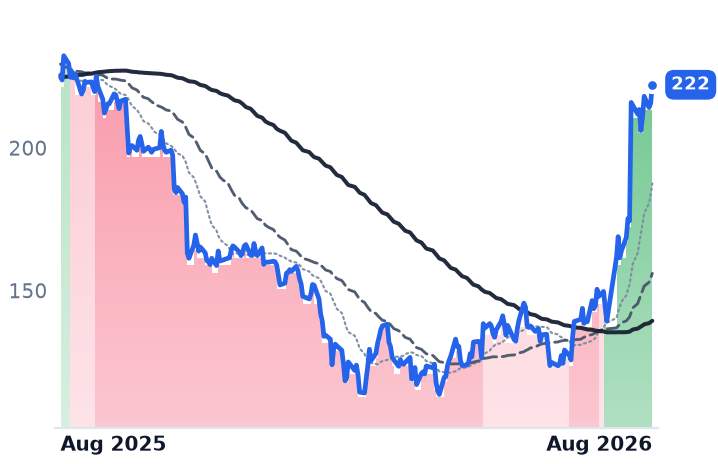
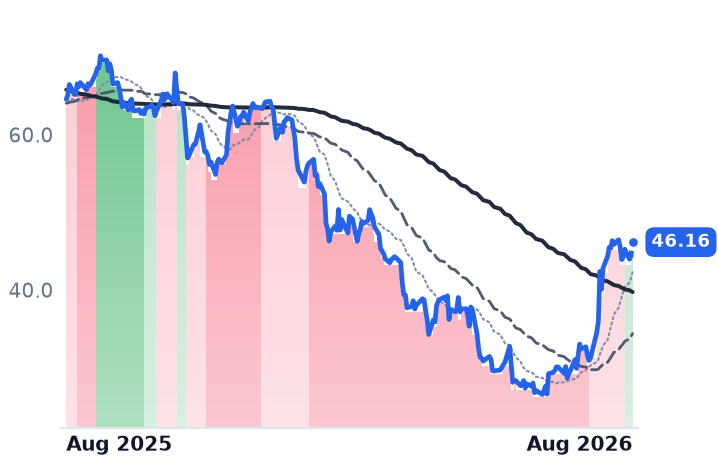
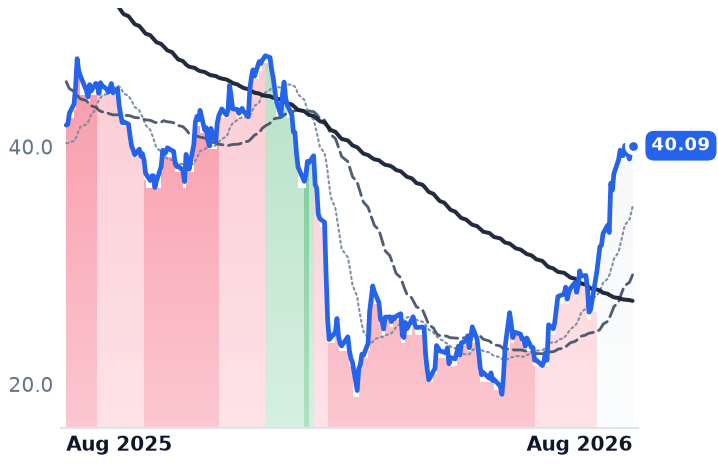
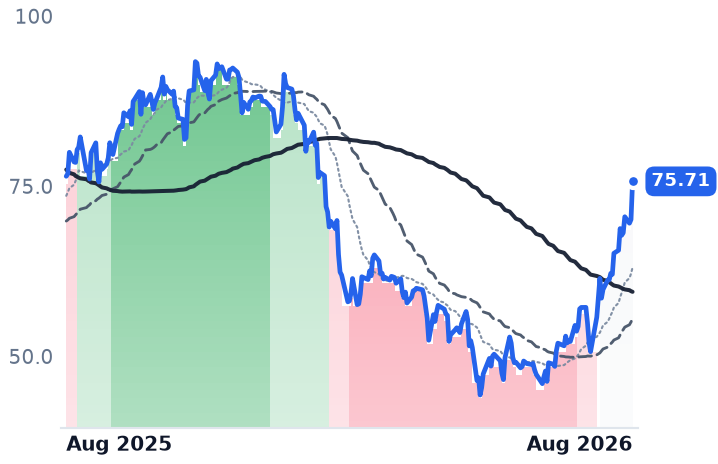
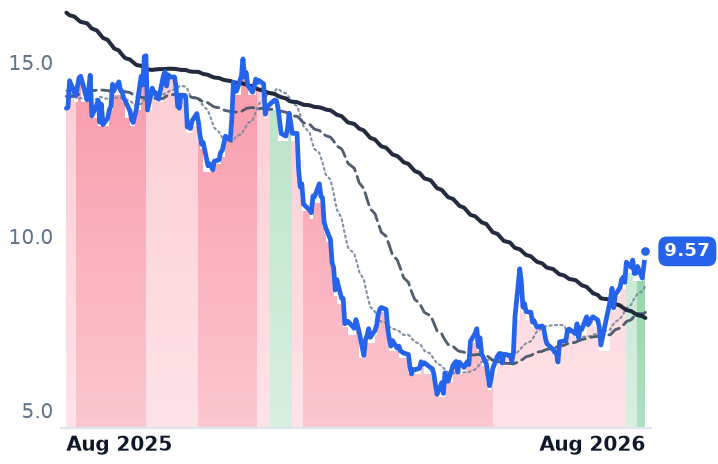
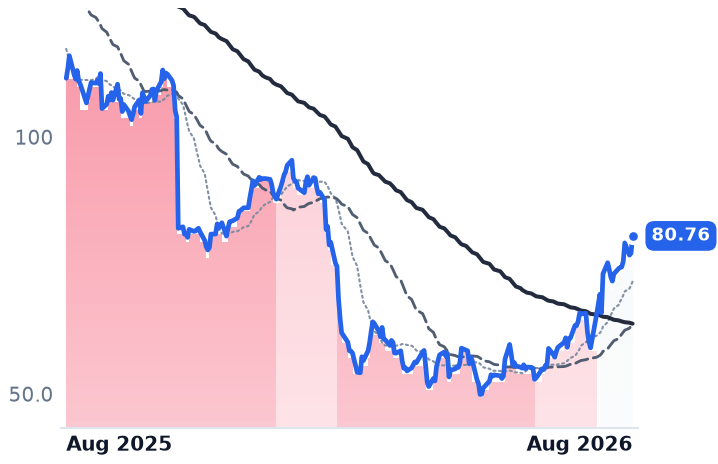
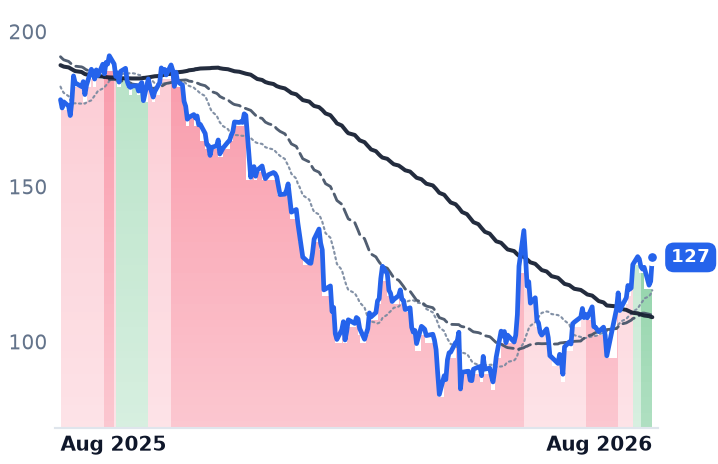
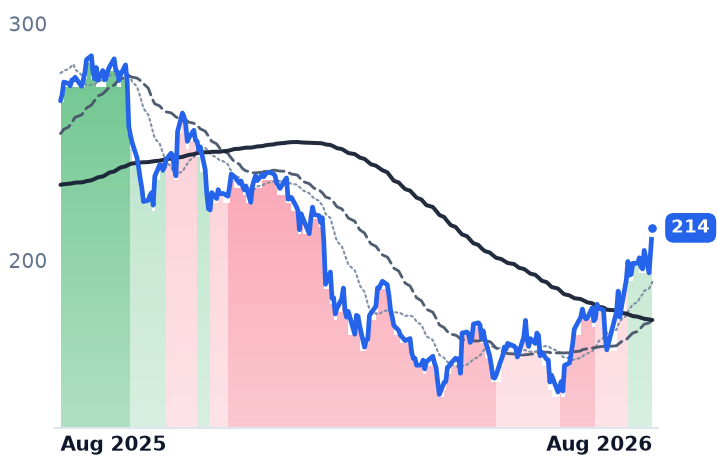
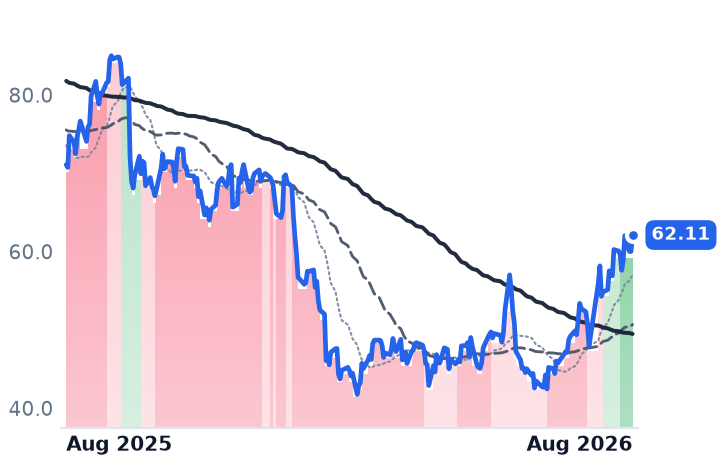
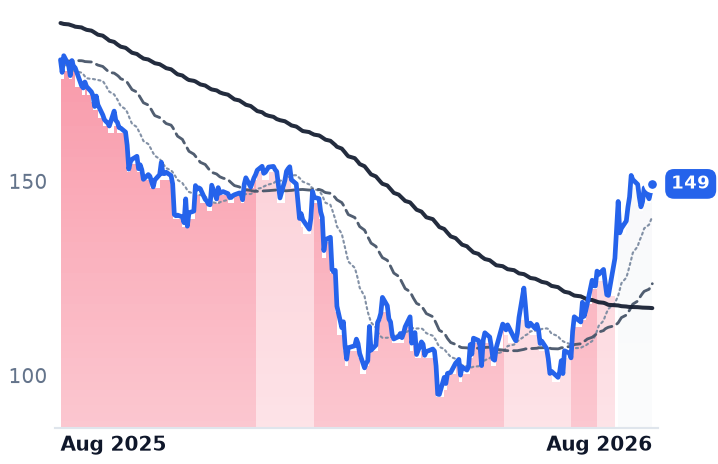
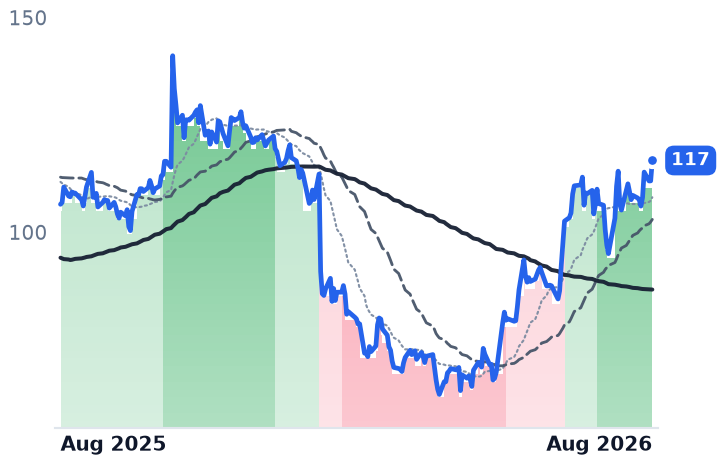
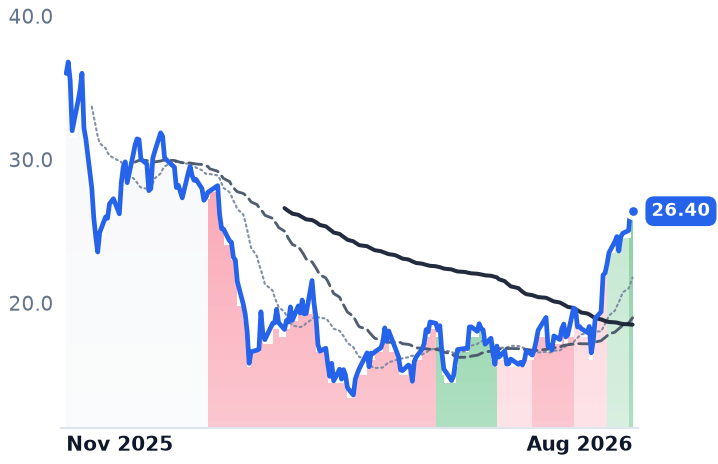
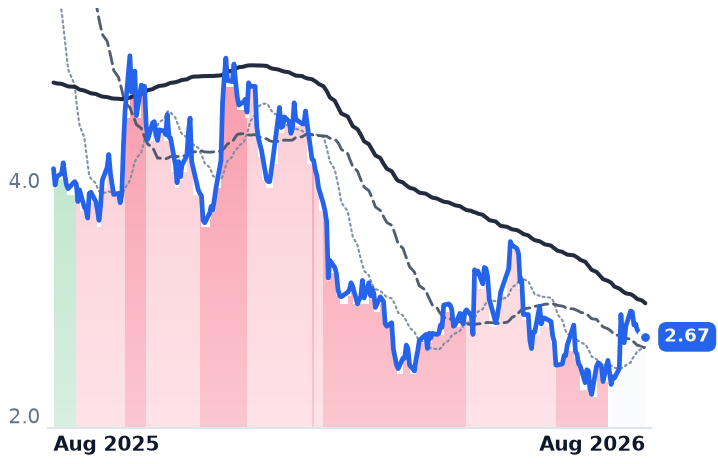
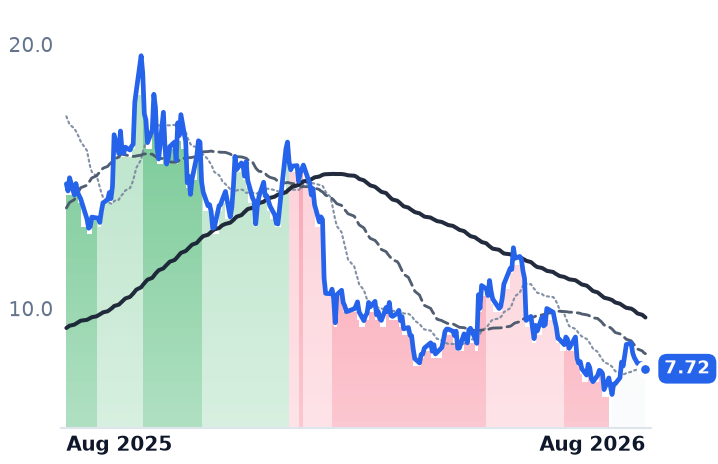
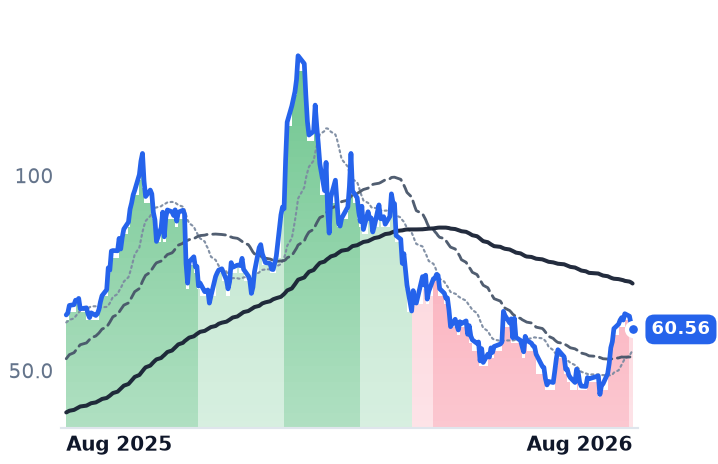
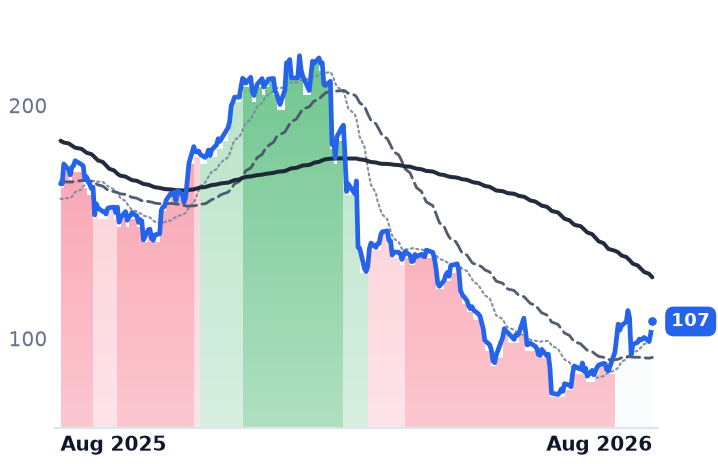
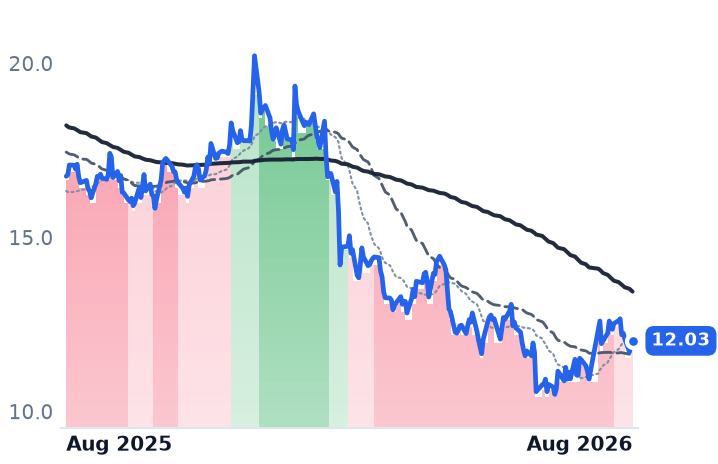
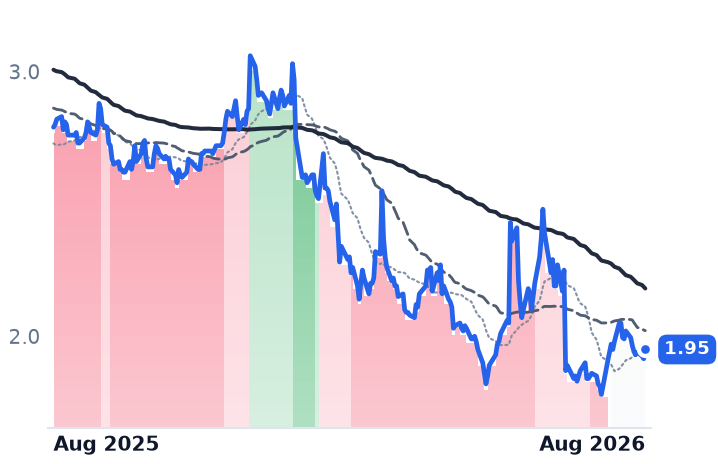
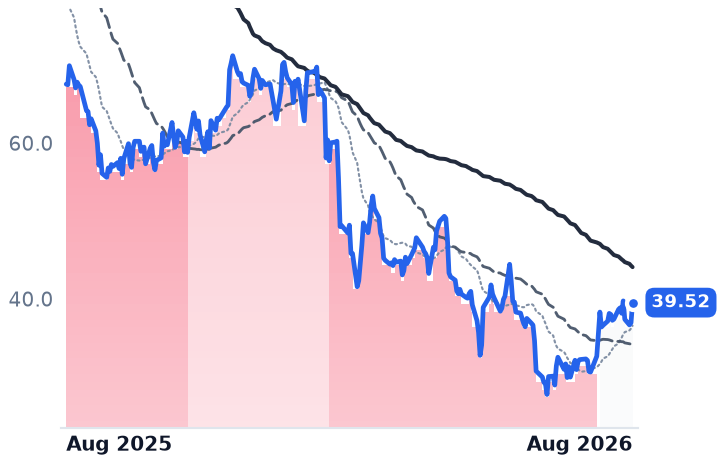
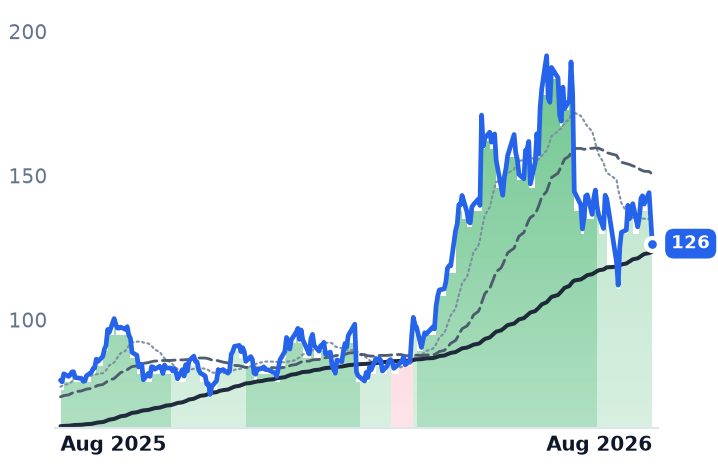
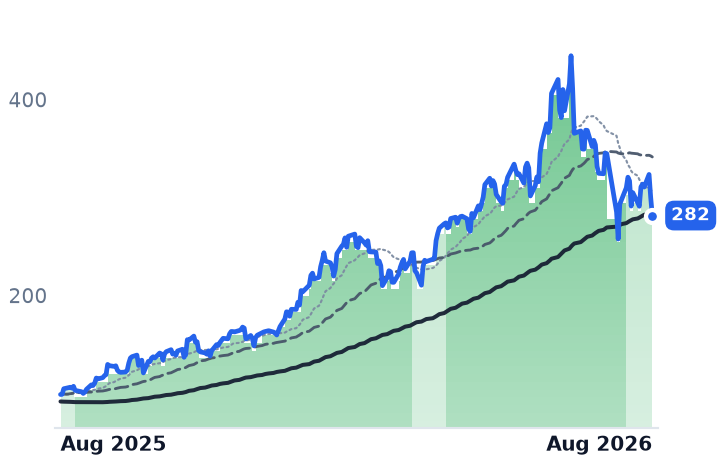
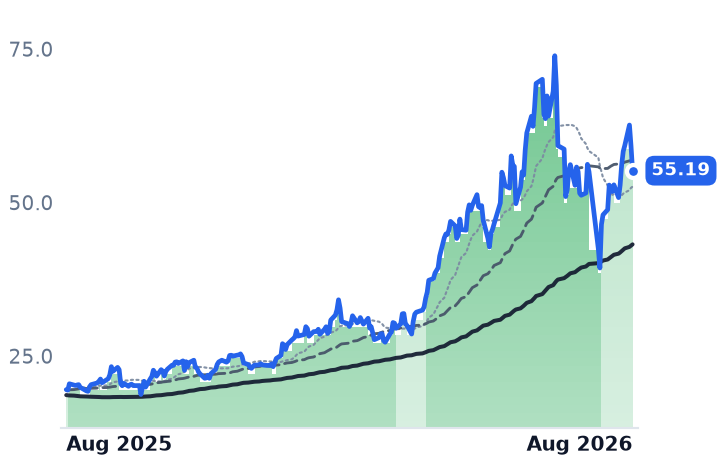
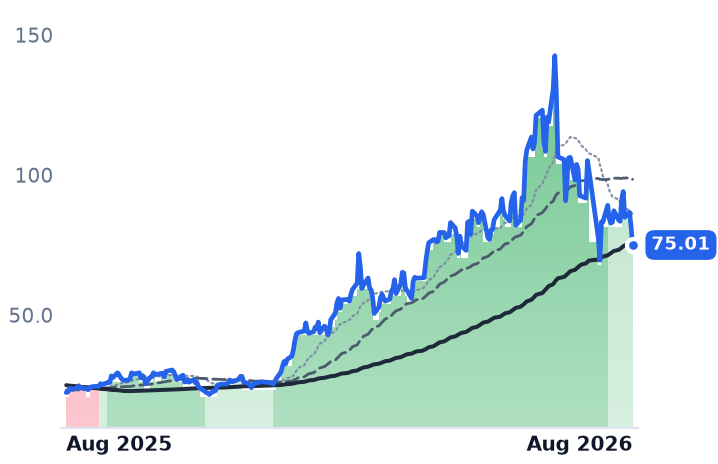
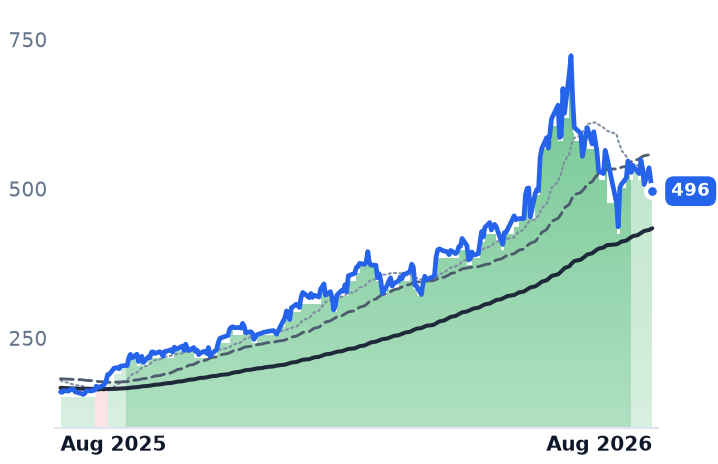
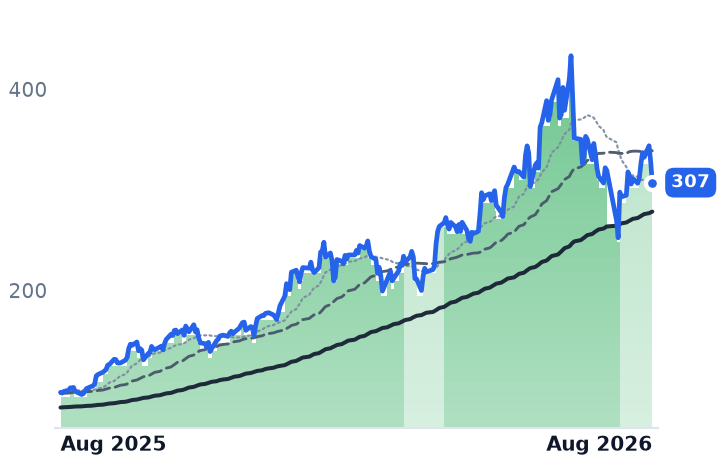
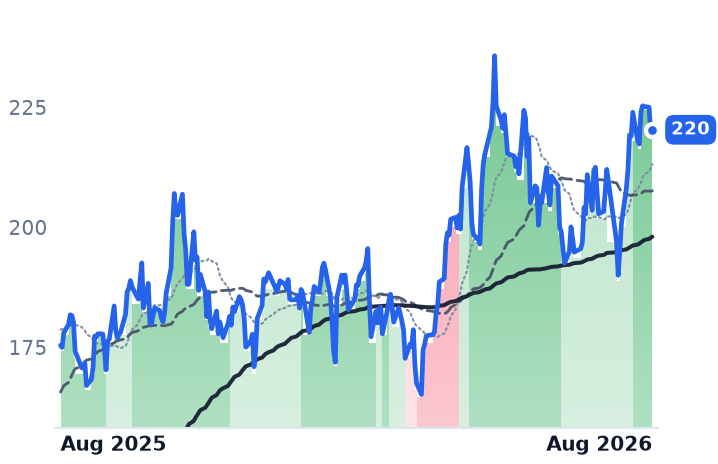
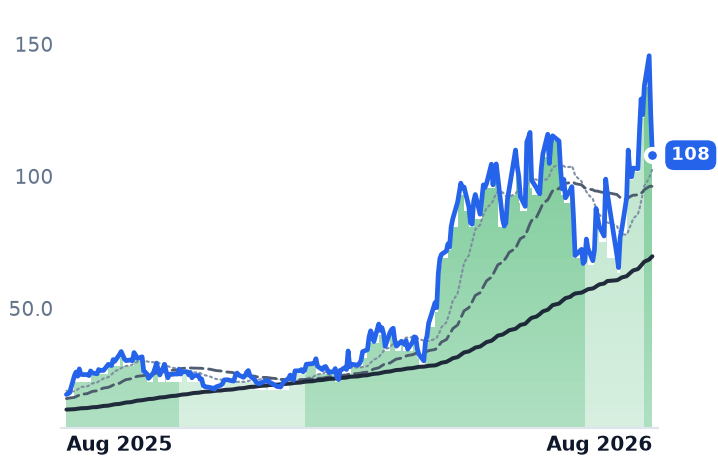
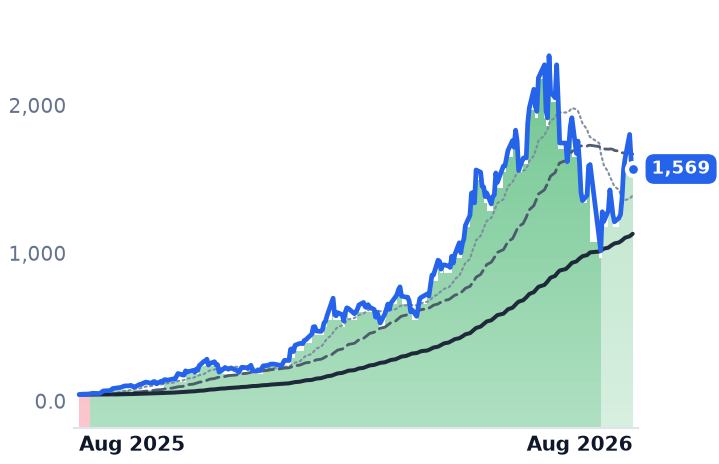
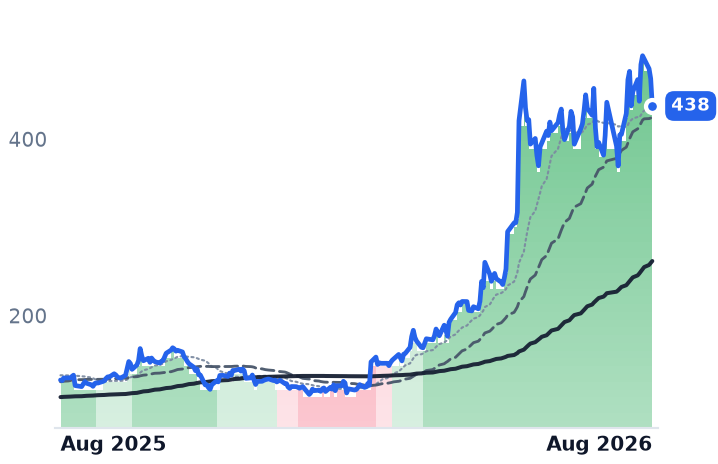
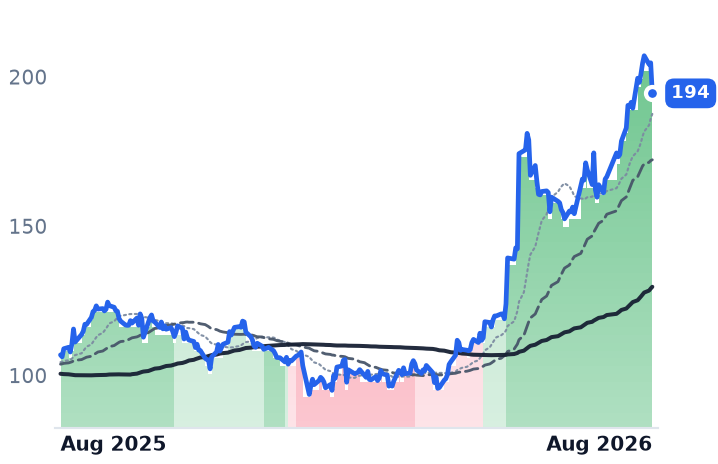
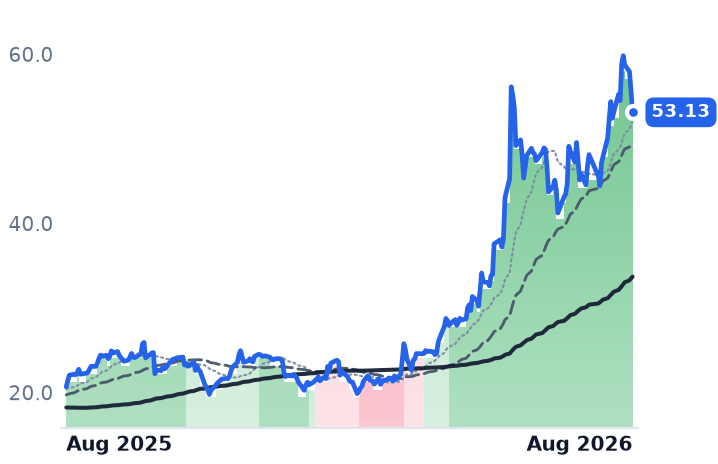
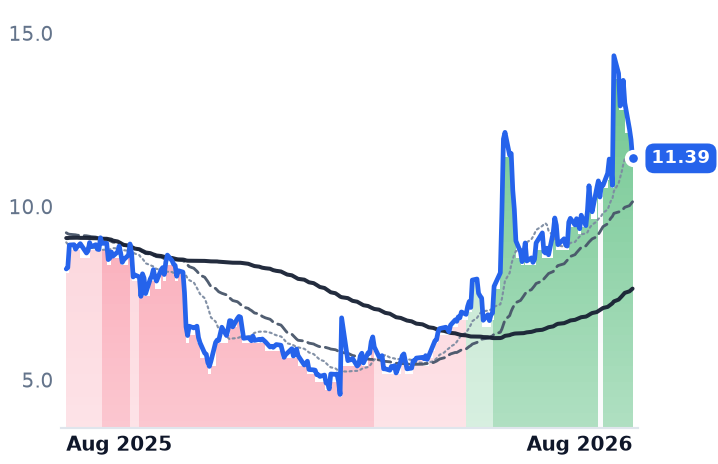
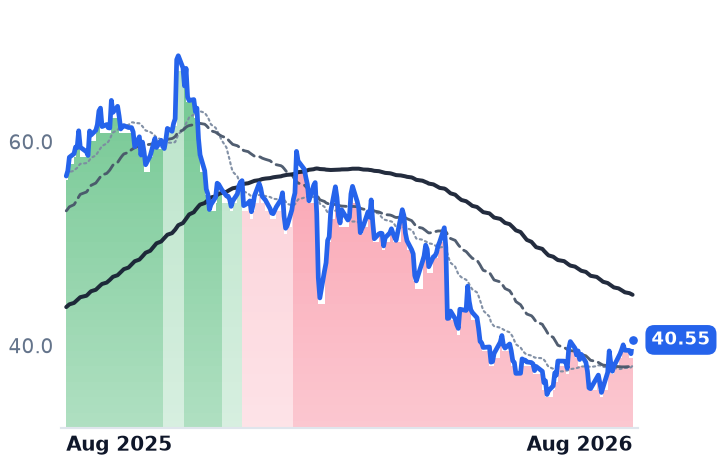
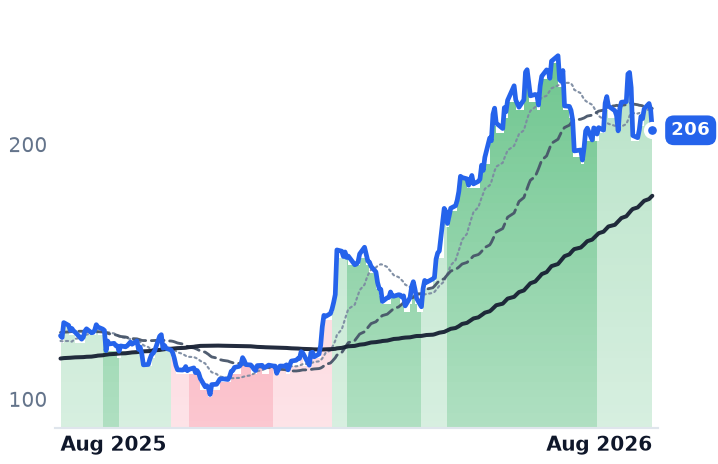
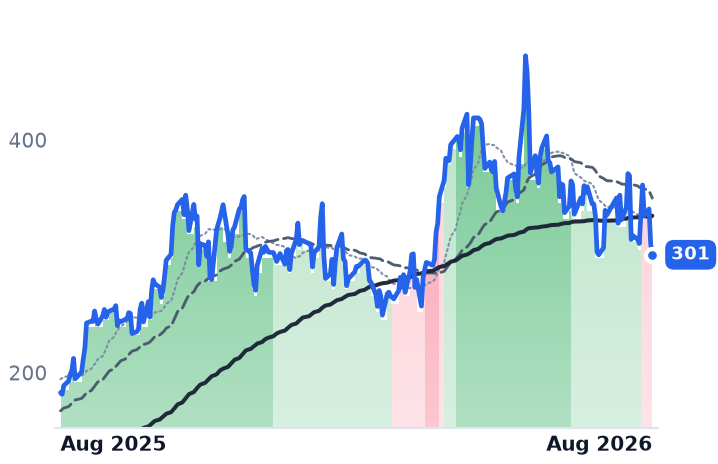
That one quarter is roughly five times the gross profit Dell surrendered in its April quarter at last year's margin, and about 35 times NetApp's entire guided full-year hit. The windfall is being collected from the whole NAND-buying world, not from these two buyers. And the market has already turned it around: over three months Dell has gained 86% and NetApp 61%, while SanDisk managed 13% and broke a 227-session uptrend on 29 July. Investors are paying up for the payers.
| Ticker | Company | Segment | Trend · 13mo | 30D | 1Y |
|---|---|---|---|---|---|
| The subject · what this brief is about | |||||
SNDK | Sandisk | Specialty Manufacturing & Components | 🟢 Cont. Bull | −1.3% | +3433.5% |
DELL | Dell Technologies | Enterprise Storage & Software | 🟢 Cont. Bull | +8.3% | +244.3% |
NTAP | NetApp | Enterprise Storage & Software | 🟢 Cont. Bull | +17.3% | +82.0% |
| Compared against · context, not the story | |||||
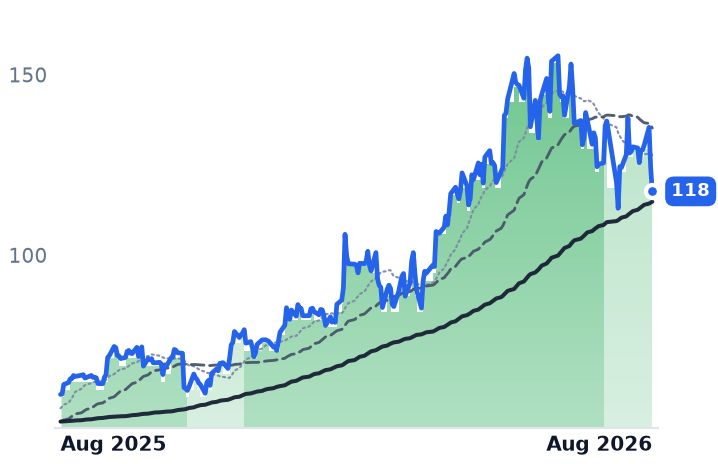
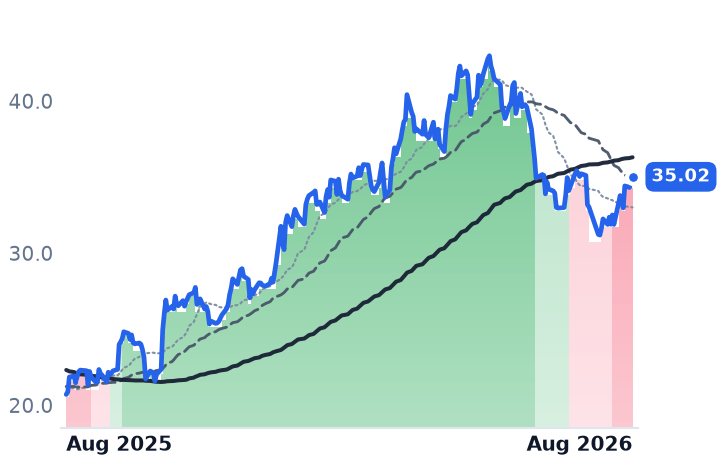
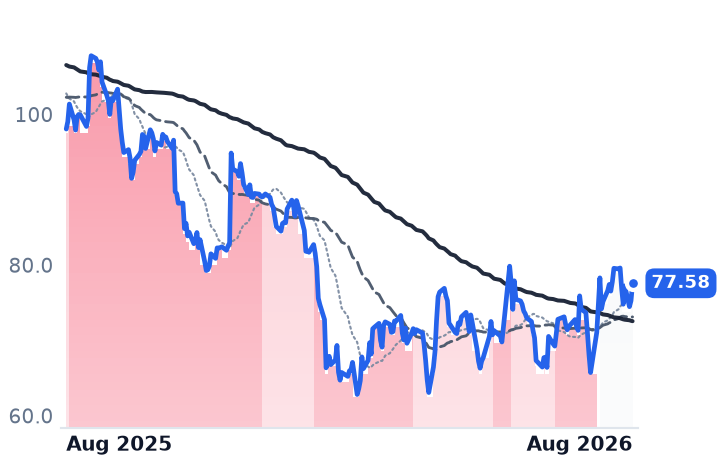
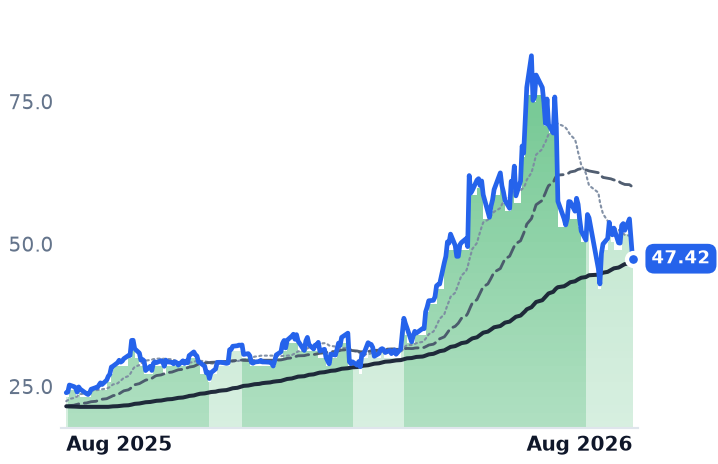
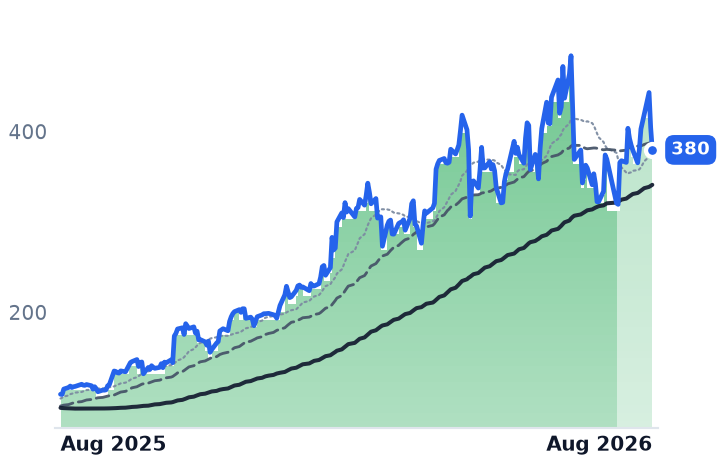
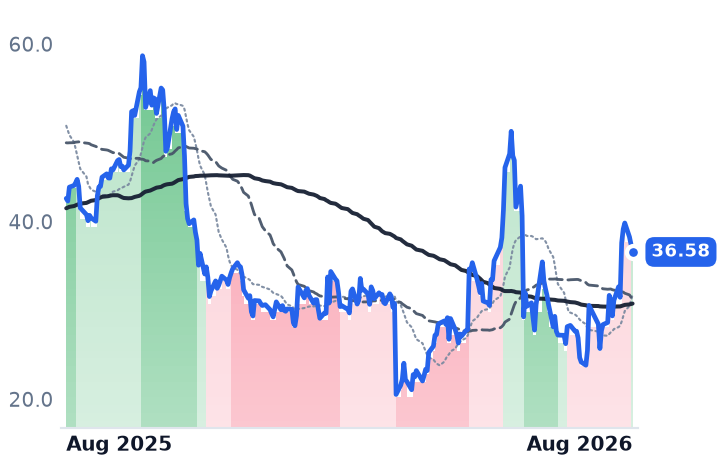
MU | Micron Technology | Memory (DRAM/NAND) | 🟢 Cont. Bull | −3.5% | +700.7% |
WDC | Western Digital | Data Storage Devices | 🟢 Cont. Bull | −15.7% | +512.4% |
STX | Seagate Technology | Data Storage Devices | 🟢 Cont. Bull | −6.6% | +429.6% |
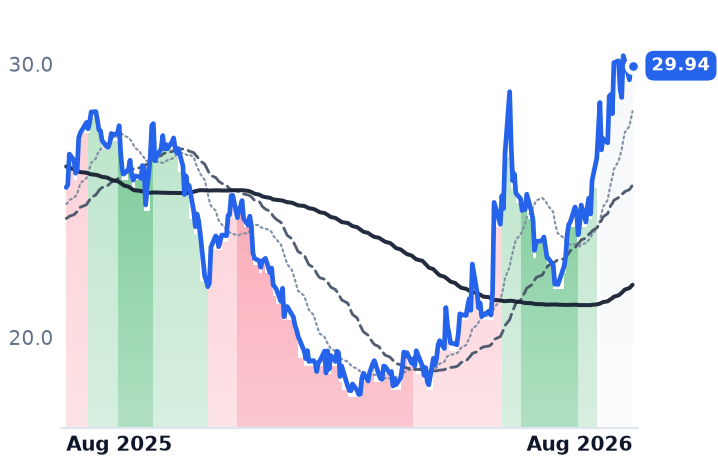
HPE | Hewlett Packard Enterprise | Enterprise Storage & Software | 🟢 Cont. Bull | +13.7% | +157.0% |
SMCI | Super Micro Computer | Server & Infrastructure Systems | 🌱 Emerging Bull | +43.5% | −14.2% |
HPQ | HP | Consumer & Commercial PCs | 🌱 Emerging Bull | +20.7% | +17.5% |
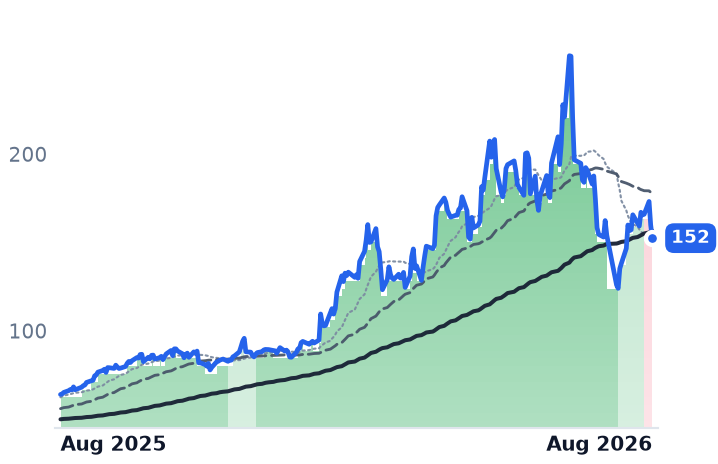
GLW | Corning | Display & Optical Materials | 🟢 Cont. Bull | −6.1% | +138.2% |
CRSR | Corsair Gaming | Gaming & Creator Peripherals | 🌱 Emerging Bull | +15.3% | +38.9% |
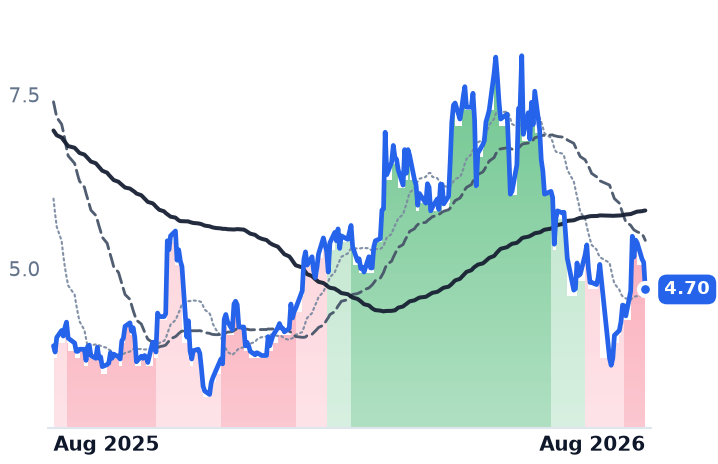
CALX | Calix | Cloud Infrastructure & Platform | 🔴 Cont. Bear | +8.2% | −28.4% |
ARW | Arrow Electronics | Enterprise IT Solutions | 🟢 Cont. Bull | −4.9% | +64.5% |
CLS | Celestica | Electronic Manufacturing Services | 🟢 Cont. Bull | −11.3% | +64.8% |
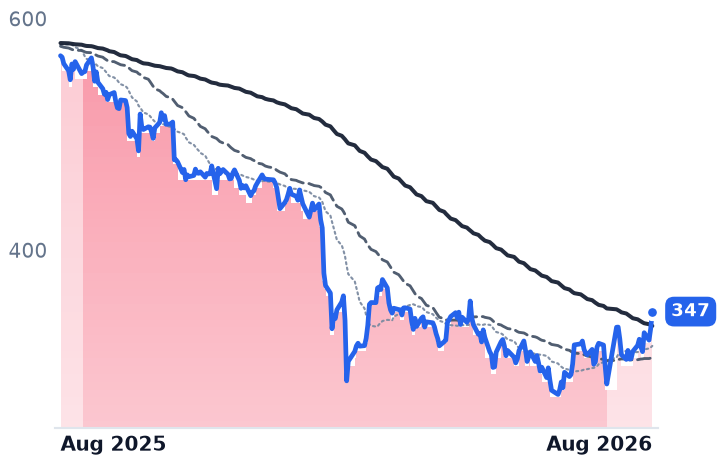
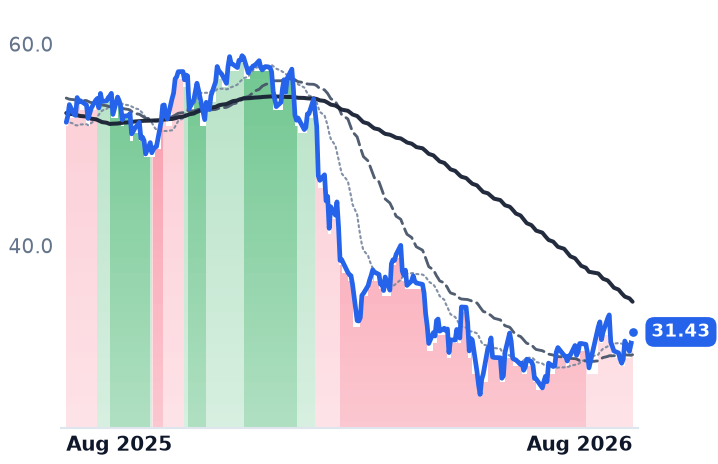
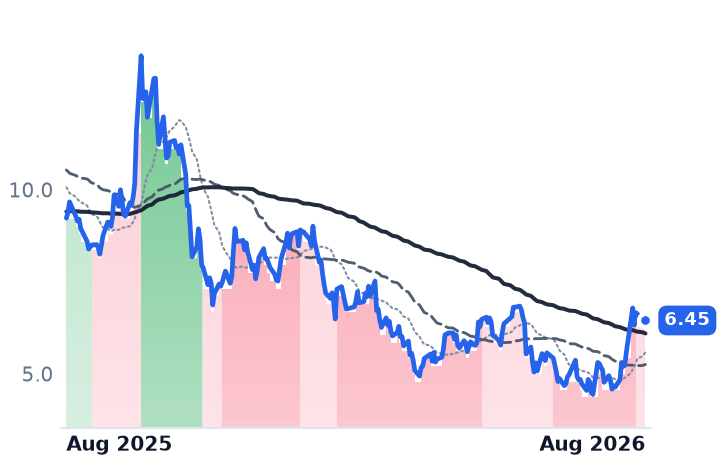
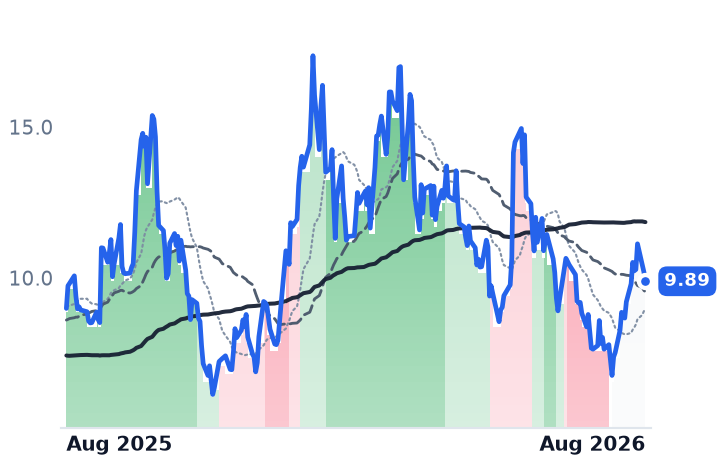
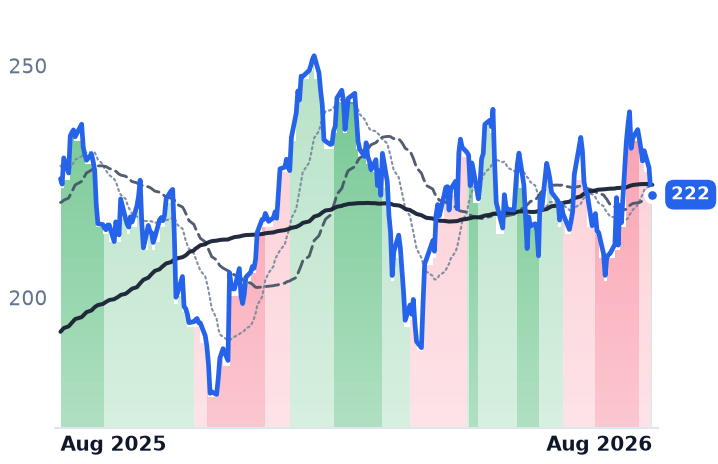
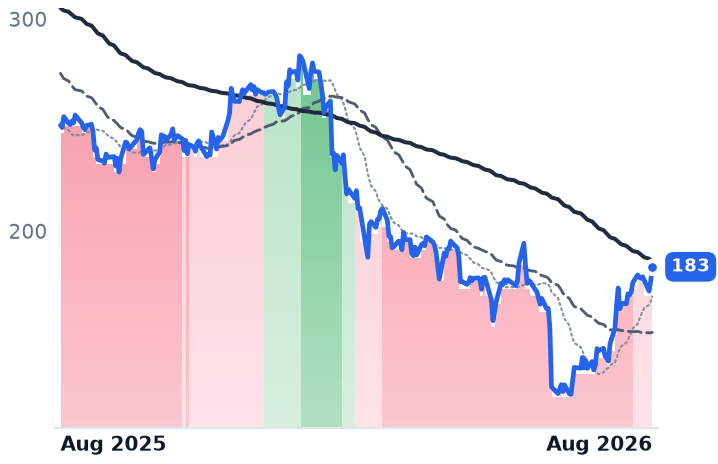
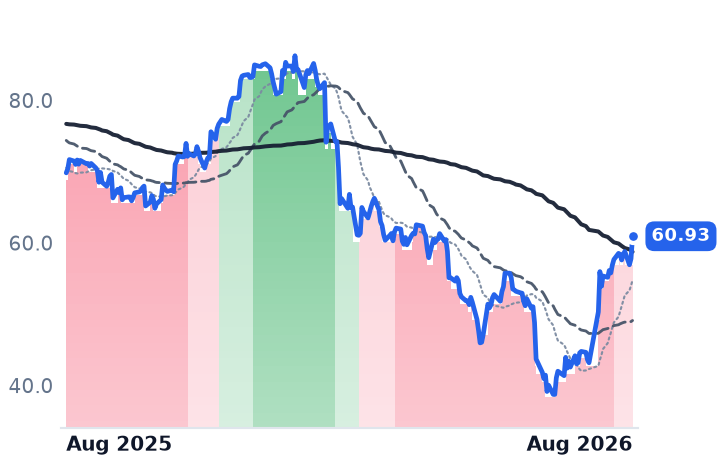
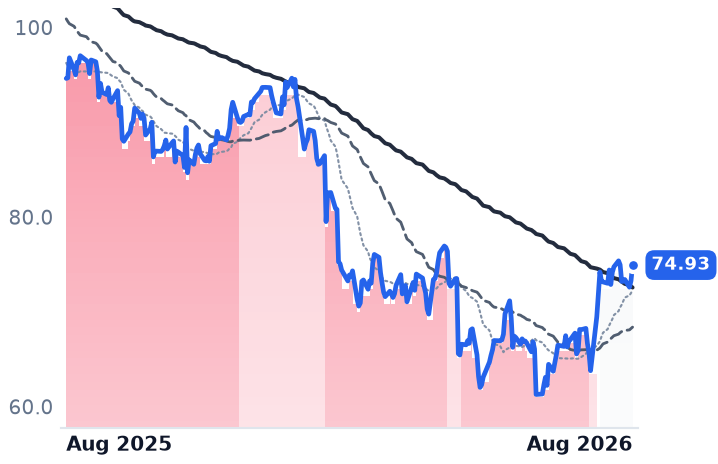
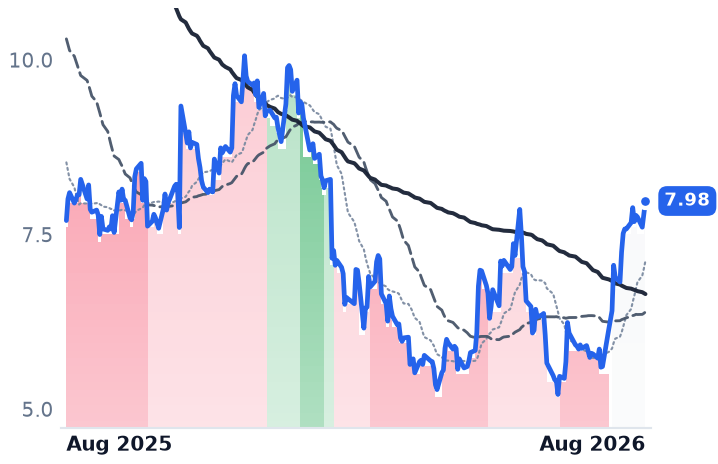
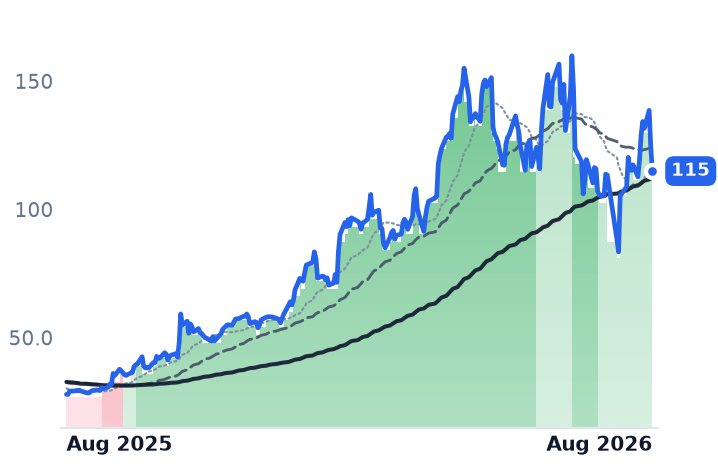
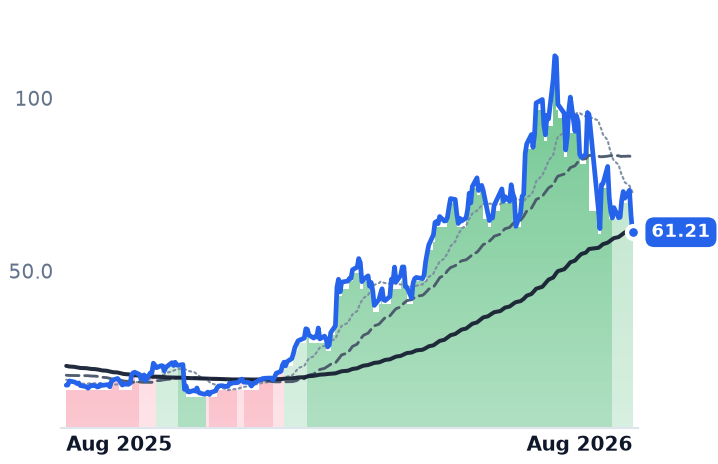
12-month price & trend
| Ticker | Mkt cap | P/E | P/E fwd | P/S | P/S fwd | P/GP | P/GP fwd | EV/EBITDA | FCF yld |
|---|---|---|---|---|---|---|---|---|---|
SNDK | $232.3B | 20.2x | 7.5x | 11.5x | 4.8x | 16.1x | 6.7x | 17.4x | 4.9% |
DELL | $290.6B | 34.2x | 23.3x | 2.2x | 1.7x | 11.4x | 8.8x | 21.0x | 3.2% |
NTAP | $38.2B | 30.2x | 21.6x | 5.5x | 5.1x | 7.8x | 7.2x | 19.8x | 4.9% |
| Ticker | Mkt cap | P/E | P/E fwd | P/S | P/S fwd | P/GP | P/GP fwd | EV/EBITDA | FCF yld |
|---|---|---|---|---|---|---|---|---|---|
MU | $1.0T | 19.9x | 12.2x | 11.2x | 7.8x | 15.4x | 10.7x | 14.5x | 2.6% |
WDC | $166.1B | 25.6x | 48.3x | 14.1x | 12.9x | 31.1x | 28.4x | 31.1x | 1.7% |
STX | $178.4B | 73.9x | 53.5x | 16.2x | 14.8x | 39.0x | 35.7x | 53.6x | 1.5% |
| Ticker | Mkt cap | P/E | P/E fwd | P/S | P/S fwd | P/GP | P/GP fwd | EV/EBITDA | FCF yld |
|---|---|---|---|---|---|---|---|---|---|
HPE | $70.3B | 48.7x | 15.5x | 1.8x | 1.6x | 5.5x | 4.7x | 21.5x | 5.7% |
SMCI | $25.8B | 10.9x | 12.3x | 0.7x | 0.5x | 6.1x | 4.5x | 8.2x | -27.1% |
HPQ | $26.9B | 10.7x | 9.7x | 0.5x | 0.5x | 2.3x | 2.3x | 8.4x | 14.0% |
| Ticker | Mkt cap | P/E | P/E fwd | P/S | P/S fwd | P/GP | P/GP fwd | EV/EBITDA | FCF yld |
|---|---|---|---|---|---|---|---|---|---|
GLW | $131.4B | 69.0x | 46.7x | 7.7x | 6.8x | 21.3x | 18.8x | 35.4x | 1.8% |
CRSR | $1.2B | 36.2x | 15.8x | 0.8x | 0.9x | 2.6x | 2.7x | 12.5x | 7.4% |
CALX | $2.6B | 51.3x | 23.6x | 2.3x | 2.1x | 4.1x | 3.8x | 28.2x | 3.3% |
| Ticker | Mkt cap | P/E | P/E fwd | P/S | P/S fwd | P/GP | P/GP fwd | EV/EBITDA | FCF yld |
|---|---|---|---|---|---|---|---|---|---|
ARW | $10.9B | 13.6x | 10.5x | 0.3x | 0.3x | 2.7x | 2.5x | 10.1x | 8.2% |
CLS | $34.7B | 31.0x | 26.5x | 2.2x | 1.7x | 19.1x | 14.5x | 23.2x | 1.5% |
Consensus projections
| Ticker | FY2026E | FY2027E | FY2028E | |
|---|---|---|---|---|
SNDK | Revenue | +174.4% | +143.0% | +18.2% |
| EPS | +2369.0% | +214.5% | +22.1% | |
DELL | Revenue | +16.2% | +54.7% | +15.1% |
| EPS | +27.3% | +88.5% | +22.3% | |
NTAP | Revenue | +4.3% | +9.9% | +5.7% |
| EPS | +10.4% | +12.8% | +11.1% | |
MU | Revenue | +248.0% | +92.8% | +11.4% |
| EPS | +804.9% | +111.2% | +7.9% | |
WDC | Revenue | +36.9% | +37.2% | +26.5% |
| EPS | +106.2% | +72.8% | +48.0% | |
STX | Revenue | +32.7% | +35.9% | +24.9% |
| EPS | +86.9% | +77.9% | +48.0% | |
HPE | Revenue | +30.3% | +11.5% | +5.6% |
| EPS | +80.5% | +18.1% | +9.6% | |
SMCI | Revenue | +77.7% | +34.0% | +19.7% |
| EPS | +33.5% | +15.5% | +13.7% | |
HPQ | Revenue | +4.5% | +0.2% | +0.3% |
| EPS | −2.8% | +0.0% | +9.6% | |
GLW | Revenue | +17.5% | +18.7% | +21.0% |
| EPS | +29.6% | +31.7% | +36.5% | |
CRSR | Revenue | −2.0% | +6.3% | +8.4% |
| EPS | +58.2% | +6.8% | +8.0% | |
CALX | Revenue | +19.4% | +15.6% | +14.4% |
| EPS | +27.8% | +33.8% | +45.1% | |
ARW | Revenue | +29.9% | +5.1% | +6.7% |
| EPS | +96.7% | +9.4% | +10.8% | |
CLS | Revenue | +67.0% | +69.3% | +32.3% |
| EPS | +90.2% | +74.7% | +34.3% |
Forward fiscal years only. Blank means no analyst coverage for that year.
SanDisk spent two years losing money making NAND flash memory, the chips that store data in phones, laptops and data-center drives. In the June quarter it earned gross profit of $7.58bn on revenue of $8.97bn, a gross margin of 84.6% against 26.2% a year earlier.
The composition is unusually pure. Revenue rose $7.06bn; gross profit rose $7.08bn. Cost of goods sold did not rise with the business — it fell, from $1.403bn to $1.383bn. Volume contributed nothing to the gain. It was all price. SanDisk's own results release attributes the quarter primarily to higher pricing, with data-center revenue doubling sequentially to $2.98bn and next-quarter revenue guided to $10.3–10.8bn.
Who actually paid
Dell Technologies, the largest seller of AI servers by volume at roughly a fifth of the market, grew April-quarter revenue 87.5% to $43.8bn. Gross margin came in at 17.75% against 21.12% a year earlier. Held at the prior year's rate, gross profit would have been about $1.48bn higher. NetApp, which sells flash storage arrays and the ONTAP software that runs them, guided fiscal 2027 gross margin to 68.5–69.5% from 71.3%, naming memory and component costs in its prepared remarks. On consensus revenue near $7.5bn, that is $135–210m for a full year.
SanDisk's single-quarter gain is about 4.8 times Dell's whole shortfall and about 35 times NetApp's annual one. The money is coming from handset makers, PC builders and hyperscalers buying drives direct — not chiefly from these two.
The alibi mostly holds
At Dell, the memory line is doing less work than the headline margin suggests. Infrastructure Solutions Group revenue rose 181% to $29bn and segment operating margin expanded 80 basis points to 10.5%, while management said that excluding AI-server mix the gross margin rate was up year over year, per Futurum's review of the quarter. Total operating income rose 197%. Dell booked $24.4bn of AI orders and ended with a record $51.3bn backlog. Memory at Dell reads as a gate on how much it can ship, not a destroyer of what it sells.
At NetApp the cost has been named but has not arrived. Reported April-quarter gross margin was 70.07%, up from 68.88%, with operating margin at 27.26%. The finance chief told analysts product margin should trough in the July quarter and improve as price increases flow through — recovery by pricing, not a permanent transfer.
Why the collector stopped rising
SanDisk's durable asset is the Yokkaichi and Kitakami joint venture with Kioxia, extended in January to December 2034, the largest NAND manufacturing footprint in the world. But it does not set the price: Samsung led the market with 29% share in the first quarter. SanDisk collects an industry cycle rather than authoring one — and it is pure NAND, with no DRAM or high-bandwidth memory.
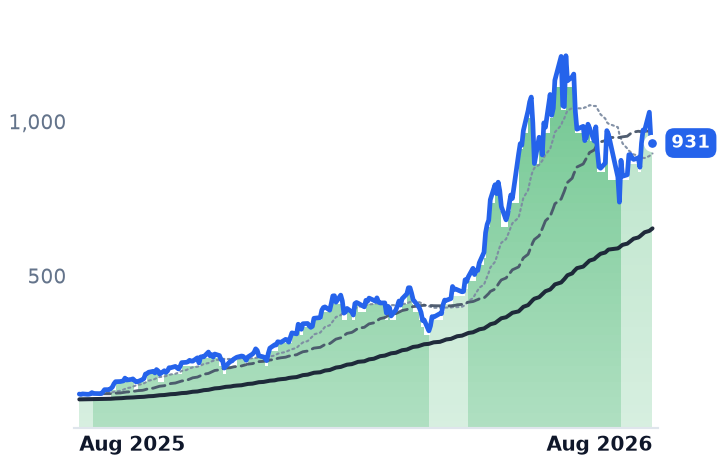
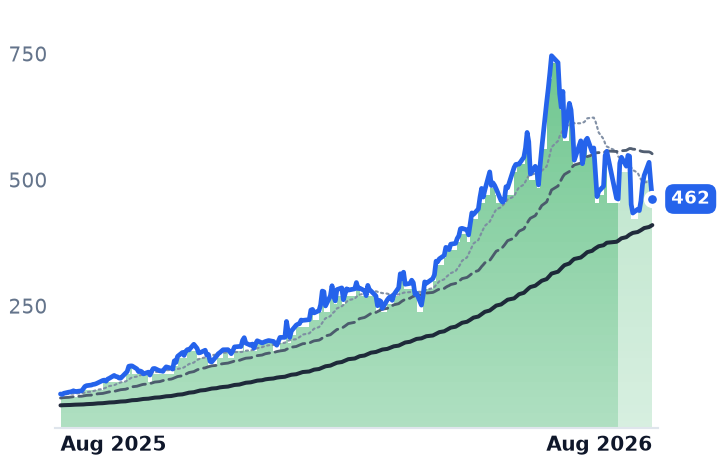
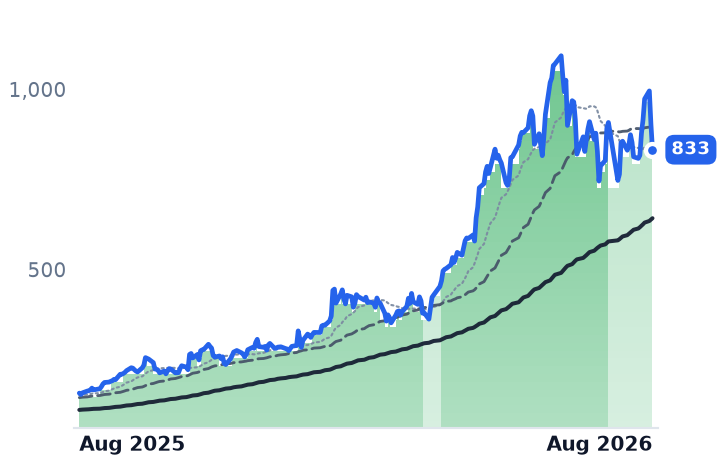
That matters, because the two are separating. TrendForce sees NAND contract prices up 10–15% in the third quarter but moderating as consumer demand weakens, and forecasts NAND supply tilting toward balance and surplus in the second half of 2027 while DRAM stays short into 2028. Micron, which has both, is up 34% over three months against SanDisk's 13%.
The shares registered it early. SanDisk's uptrend broke on 29 July after 227 unbroken sessions, one day before that forecast published; it then fell 5.4% and 6.8% in the two sessions after record August results, rallied 14.1% on 13 August, and gave back 9.8% on 18 August. Dell and NetApp have held rising trends since 31 March and 21 May. All four names, including Seagate, fell together on 19 August as the 30-year Treasury yield topped 5.33%, a 19-year high.
What each price now assumes
Dell trades at 11.37x trailing gross profit, against 6.99x in mid-May — the multiple roughly doubled while the margin fell — and 23.3x forward earnings on consensus of $18.80 versus $8.68 delivered. NetApp's price-to-gross-profit went from 4.55x in early May to 7.79x, with a forward multiple of 21.6x on 12.5% growth. SanDisk is the cheapest on forward numbers, at 7.47x against 20.17x trailing — but only because consensus carries fiscal 2027 earnings of $210 a share against $73.76 delivered, which requires peak NAND pricing to survive the supply flip.
The setup
Where it stands — The memory windfall is overwhelmingly price on a flat cost base, and it dwarfs what Dell and NetApp have given up. Would confirm — Dell's 1 September quarter showing ISG operating margin again flat-to-higher despite further memory inflation. Would invalidate — NAND contract prices falling quarter over quarter, or SanDisk gross margin retreating below 70%. Watch next — Dell fiscal second-quarter results on Tuesday, 1 September, with second-half gross-margin guidance. Valuation — SanDisk 20.17x trailing earnings, 7.47x forward; Dell 34.18x and 23.28x; NetApp 30.25x and 21.60x.