

FuelCell Energy Booked a $3.6bn Order Book Its Factory Runs Too Slowly to Fill
Hypothesis Opus 5 · Research Opus 5 · Writing Opus 5 · Prompt v1.7
FuelCell Energy has sold more stationary power than its plants can presently build. Its committed and awarded backlog stood at $3.6bn on 31 July against an annualized production rate of about 37.1 megawatts, and the quarter that disclosed the gap carried a -74.2% gross margin.
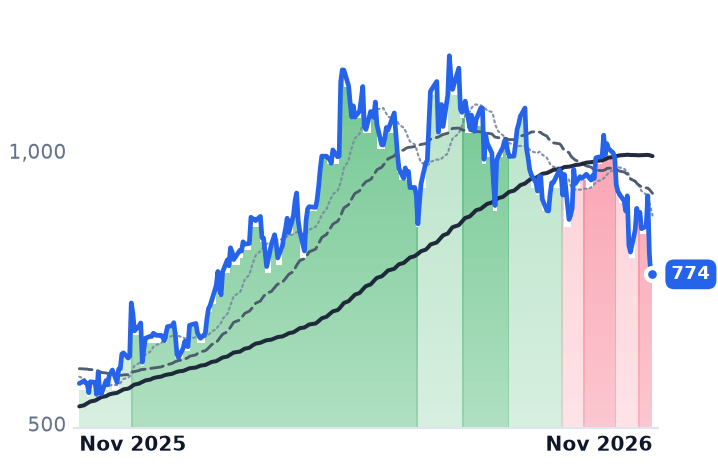
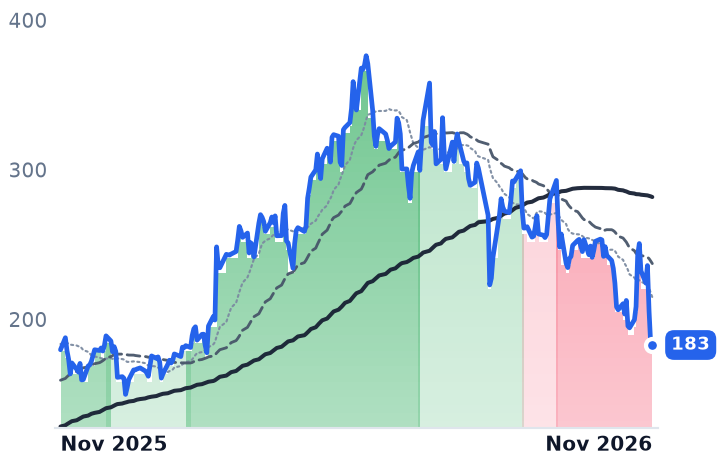
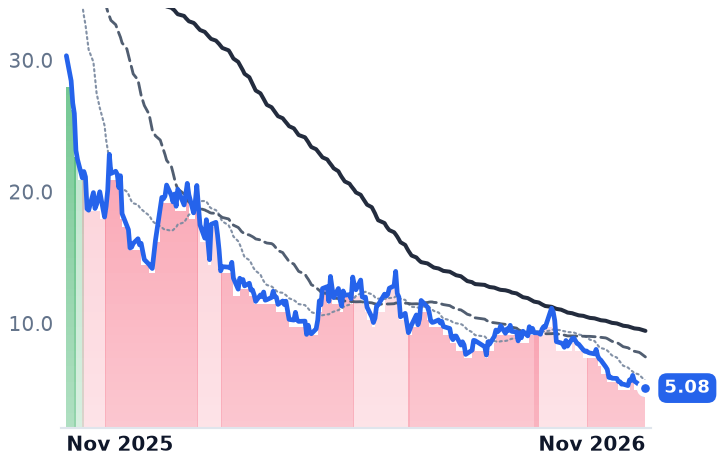
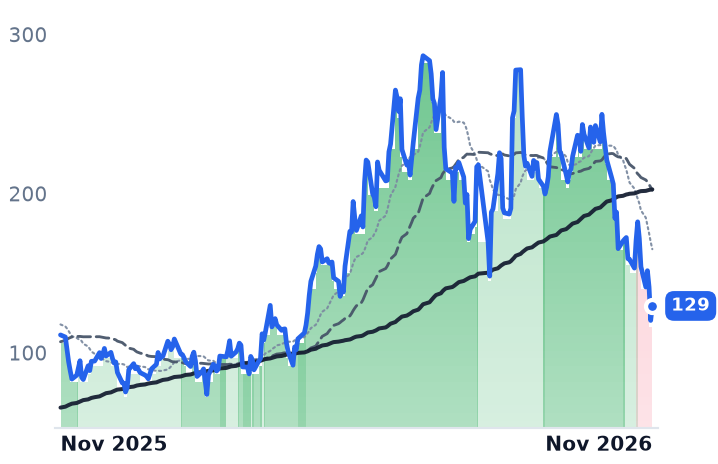
The shares have fallen by nearly half in a month and are no cheaper on sales than in May, at 5.16x trailing against 4.26x then, because revenue shrank faster than market value. Bloom Energy, filed under the same industry code, fell almost as far after raising guidance a third time on 138% revenue growth and announcing a 900-megawatt data-center order. Only one of the two markdowns is explained by the business; the other followed a Texas election.
| Ticker | Company | Segment | Trend · 13mo | 30D | 1Y |
|---|---|---|---|---|---|
| The subject · what this brief is about | |||||
FCEL | FuelCell Energy | Fuel Cell & Hydrogen | ⚠️ Emerging Bear | −43.9% | +32.4% |
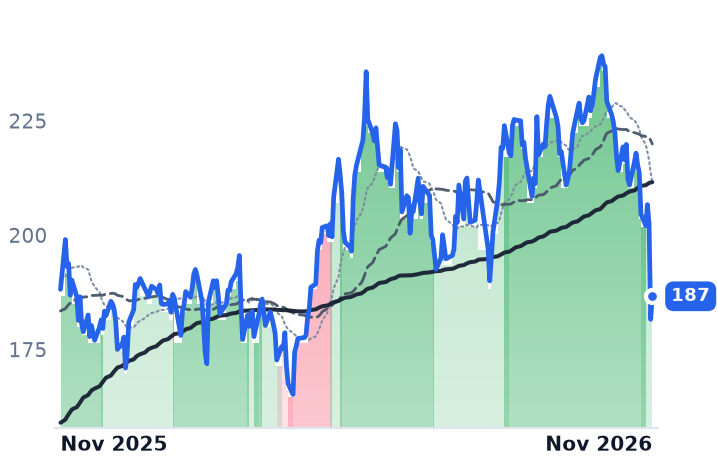
BE | Bloom Energy | Fuel Cell & Hydrogen | 🟢 Cont. Bull | −38.4% | +28.1% |
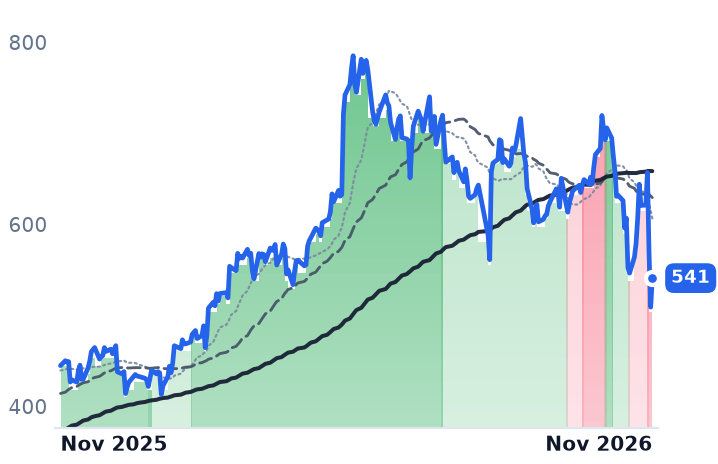
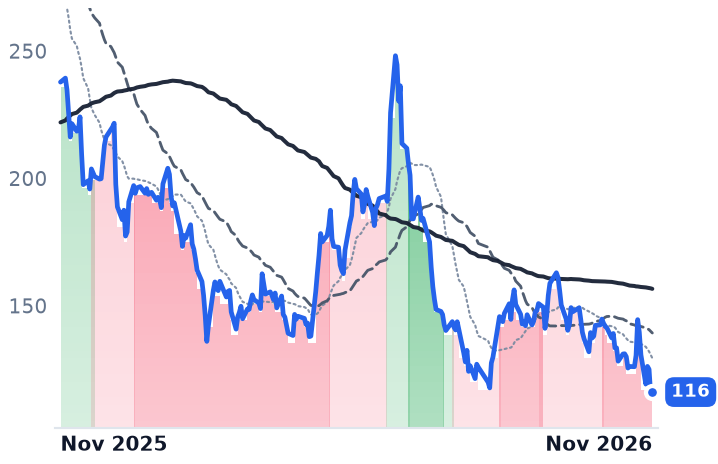
PLUG | Plug Power | Fuel Cell & Hydrogen | 🔴 Cont. Bear | −18.1% | −45.3% |
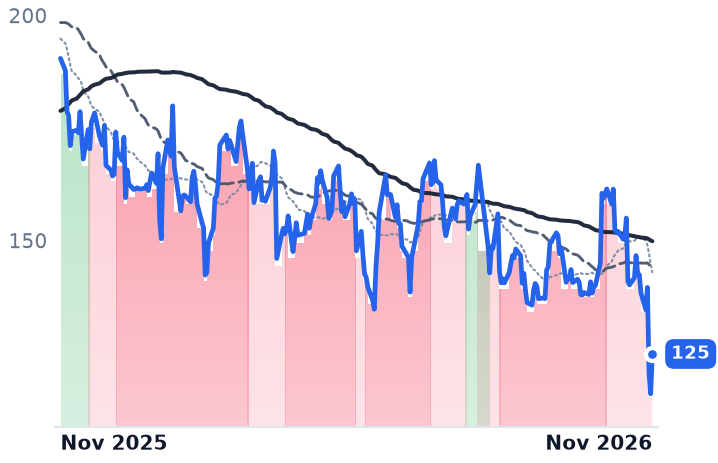
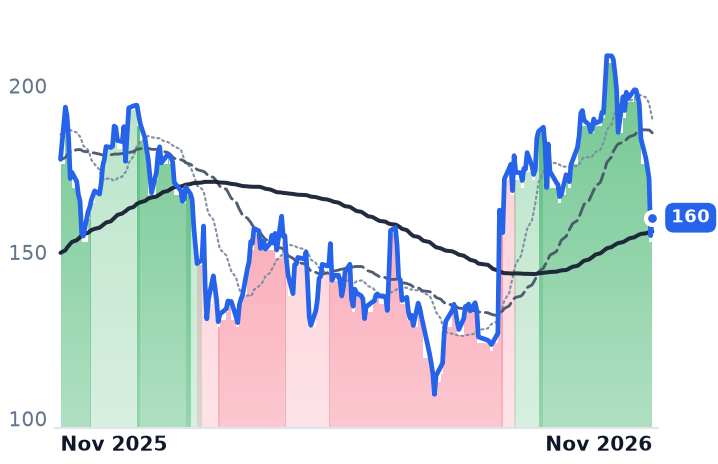
BLDP | Ballard Power Systems | Fuel Cell & Hydrogen | 🔴 Cont. Bear | −22.3% | −56.1% |
| Compared against · context, not the story | |||||
GEV | GE Vernova | Power Generation & Propulsion | ⚠️ Emerging Bear | −23.6% | +34.8% |
VRT | Vertiv | Advanced Power Systems | ⚠️ Emerging Bear | −26.4% | +1.8% |
PWR | Quanta Services | Power Grid & Distribution | 🟢 Cont. Bull | −21.9% | +21.6% |
VST | Vistra | Retail-Focused Operators | 🔴 Cont. Bear | −22.2% | −34.5% |
CEG | Constellation Energy | Wholesale Generators | 🔴 Cont. Bear | −16.7% | −30.1% |
NRG | NRG Energy | Retail-Focused Operators | 🔴 Cont. Bear | −18.4% | −48.7% |
ETN | Eaton | Power Distribution Systems | 🟢 Cont. Bull | −20.5% | −8.3% |
OKLO | Oklo | Advanced Nuclear | 🔴 Cont. Bear | −33.6% | −79.1% |
SMR | NuScale Power | Advanced Power Systems | 🔴 Cont. Bear | −30.4% | −83.3% |
NVDA | NVIDIA | Processors & Accelerators | 🟢 Cont. Bull | −21.2% | −0.8% |
ORCL | Oracle | Data Platforms & Databases | 🔴 Cont. Bear | −18.2% | −51.2% |
PLTR | Palantir Technologies | Data Platforms & Databases | 🌱 Emerging Bull | −20.1% | −9.9% |
NBIS | Nebius | Software Development & Design | 🟢 Cont. Bull | −43.6% | +16.4% |
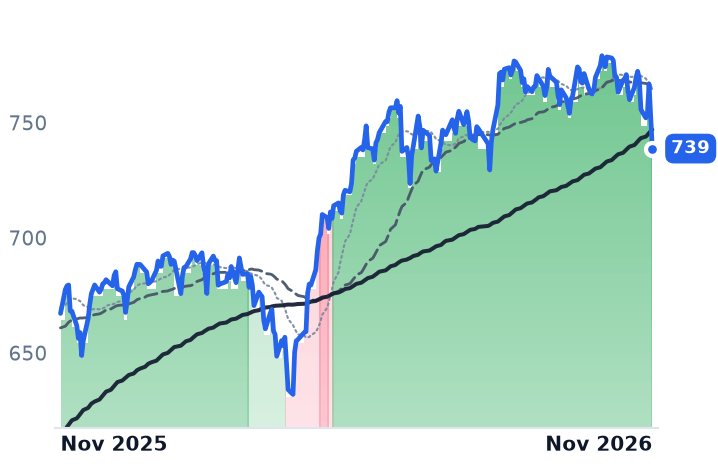
SPY | State Street SPDR S&P 500 ETF Trust | Asset Management | 🟢 Cont. Bull | −5.0% | +10.2% |
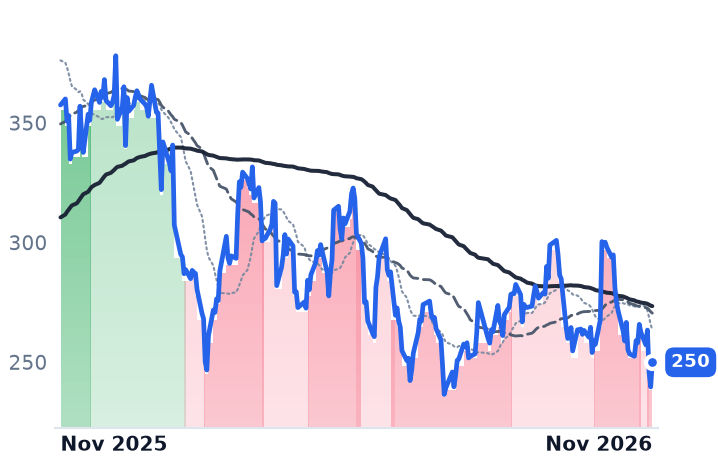
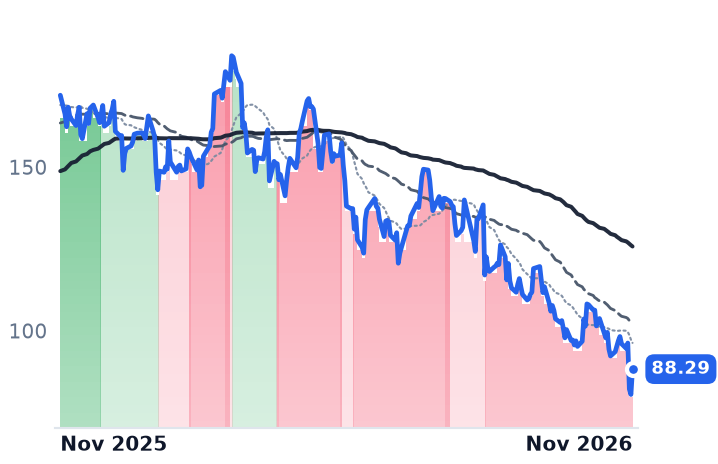
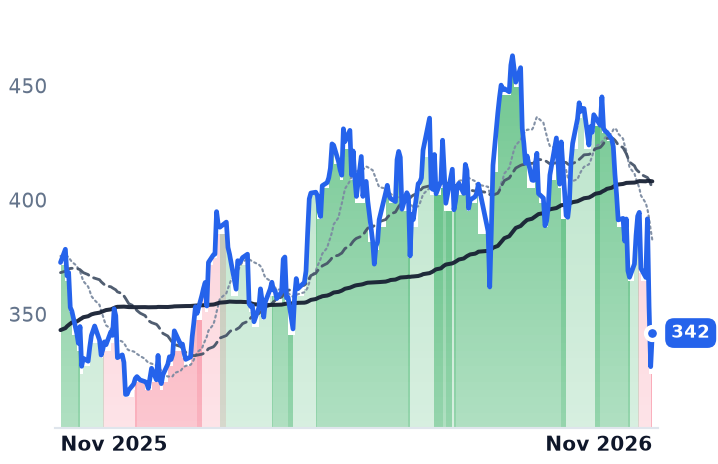
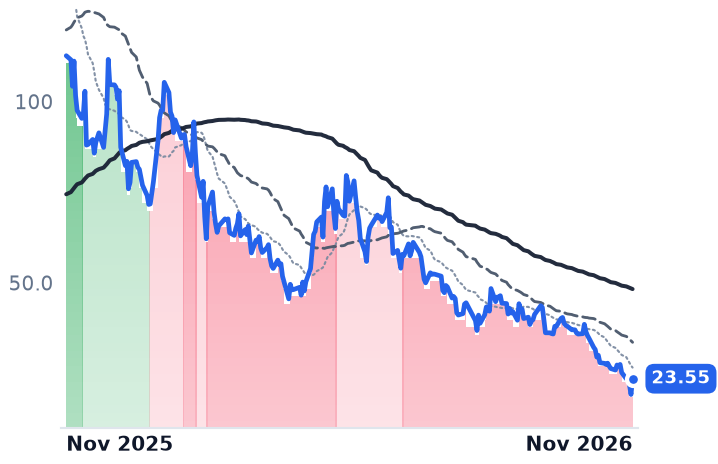
12-month price & trend
| Ticker | Mkt cap | P/E | P/E fwd | P/S | P/S fwd | P/GP | P/GP fwd | EV/EBITDA | FCF yld |
|---|---|---|---|---|---|---|---|---|---|
FCEL | $795.9M | n/m | — | 5.2x | 3.2x | — | — | n/m | -13.4% |
BE | $51.2B | 97.1x | 54.3x | 13.4x | 11.5x | 41.4x | 35.6x | 83.5x | 0.9% |
PLUG | $2.0B | n/m | — | 2.7x | 2.5x | — | — | n/m | -26.5% |
| Ticker | Mkt cap | P/E | P/E fwd | P/S | P/S fwd | P/GP | P/GP fwd | EV/EBITDA | FCF yld |
|---|---|---|---|---|---|---|---|---|---|
BLDP | $462.8M | n/m | — | 4.4x | 4.1x | 26.7x | 25.1x | 0.3x | -8.0% |
GEV | $206.8B | 20.3x | 24.7x | 4.7x | 4.4x | 21.6x | 20.3x | 18.6x | 8.3% |
VRT | $97.1B | 55.8x | 37.5x | 8.5x | 6.9x | 22.2x | 18.2x | 38.2x | 3.0% |
| Ticker | Mkt cap | P/E | P/E fwd | P/S | P/S fwd | P/GP | P/GP fwd | EV/EBITDA | FCF yld |
|---|---|---|---|---|---|---|---|---|---|
PWR | $82.2B | 61.8x | 32.6x | 2.5x | 2.1x | 17.4x | 14.4x | 28.5x | 2.9% |
VST | $54.4B | 27.0x | 18.7x | 3.4x | 2.4x | 26.3x | 18.7x | 11.3x | 2.5% |
CEG | $107.0B | 29.0x | 24.7x | 3.5x | 3.2x | 20.0x | 18.4x | 15.8x | 0.3% |
| Ticker | Mkt cap | P/E | P/E fwd | P/S | P/S fwd | P/GP | P/GP fwd | EV/EBITDA | FCF yld |
|---|---|---|---|---|---|---|---|---|---|
NRG | $21.2B | — | 11.3x | — | 0.6x | — | — | 10.5x | 1.6% |
ETN | $132.7B | 34.1x | 24.9x | 4.1x | 3.9x | 11.8x | 11.3x | 23.8x | 3.3% |
OKLO | $4.4B | n/m | — | — | — | — | — | n/m | -10.4% |
| Ticker | Mkt cap | P/E | P/E fwd | P/S | P/S fwd | P/GP | P/GP fwd | EV/EBITDA | FCF yld |
|---|---|---|---|---|---|---|---|---|---|
SMR | $1.5B | n/m | — | 549.6x | 88.6x | — | — | n/m | -40.4% |
NVDA | $5.5T | 34.3x | 25.0x | 21.5x | 13.9x | 29.0x | 18.7x | 28.3x | 2.2% |
ORCL | $436.4B | 22.3x | 17.7x | 6.1x | 4.8x | 9.5x | 7.5x | 14.7x | -6.6% |
| Ticker | Mkt cap | P/E | P/E fwd | P/S | P/S fwd | P/GP | P/GP fwd | EV/EBITDA | FCF yld |
|---|---|---|---|---|---|---|---|---|---|
PLTR | $394.9B | 136.5x | 108.2x | 64.2x | 48.6x | 75.7x | 57.3x | 126.8x | 0.9% |
NBIS | $41.3B | 661.5x | — | 30.5x | 12.3x | 41.0x | 16.6x | 43.1x | -14.3% |
SPY | $773.0B | — | — | — | — | — | — | — | — |
Consensus projections
| Ticker | FY2026E | FY2027E | FY2028E | |
|---|---|---|---|---|
FCEL | Revenue | −1.6% | +69.2% | +67.7% |
| EPS | −64.9% | −58.5% | −45.7% | |
BE | Revenue | +133.5% | +61.7% | +46.1% |
| EPS | +478.2% | +67.5% | +61.2% | |
PLUG | Revenue | +17.0% | +18.9% | +18.8% |
| EPS | −48.1% | −62.8% | −43.1% | |
BLDP | Revenue | +14.5% | +39.3% | +16.2% |
| EPS | −48.2% | −42.8% | −42.4% | |
GEV | Revenue | +25.7% | +14.1% | +15.7% |
| EPS | +334.6% | −18.6% | +38.8% | |
VRT | Revenue | +37.1% | +30.2% | +21.3% |
| EPS | +62.9% | +36.7% | +26.4% | |
PWR | Revenue | +41.1% | +16.3% | +14.1% |
| EPS | +57.7% | +17.9% | +18.3% | |
VST | Revenue | +16.7% | +9.7% | +5.4% |
| EPS | +80.8% | +18.5% | +18.5% | |
CEG | Revenue | +37.2% | +2.5% | +5.3% |
| EPS | +28.9% | +10.4% | +26.4% | |
NRG | Revenue | +17.7% | +0.8% | +3.7% |
| EPS | +14.0% | +24.5% | +15.8% | |
ETN | Revenue | +22.4% | +11.6% | +10.4% |
| EPS | +13.9% | +18.9% | +16.8% | |
OKLO | Revenue | — | +231.0% | +435.4% |
| EPS | +62.4% | +8.3% | +11.3% | |
SMR | Revenue | −59.6% | +507.1% | +271.3% |
| EPS | −77.1% | +14.4% | −16.3% | |
NVDA | Revenue | +65.1% | +84.2% | +43.2% |
| EPS | +59.0% | +91.7% | +42.0% | |
ORCL | Revenue | +17.8% | +34.5% | +45.1% |
| EPS | +25.3% | +8.7% | +35.4% | |
PLTR | Revenue | +86.1% | +49.3% | +48.2% |
| EPS | +122.1% | +42.4% | +50.3% | |
NBIS | Revenue | +508.0% | +260.2% | +88.0% |
| EPS | +65.5% | +69.1% | −94.1% |
Forward fiscal years only. Blank means no analyst coverage for that year.
FuelCell Energy has sold more stationary power than it can presently build. The company, which makes, installs and services fuel-cell power plants for utilities, hospitals, wastewater plants and lately data centers, reported $1.3bn of committed backlog and $2.4bn of awarded capacity as of 31 July. Against that $3.6bn book sits a factory that ran at an annualized rate of about 37.1 megawatts during the quarter, with a stated ambition of up to 500 megawatts annualized at its Torrington works.
The order book had been read as proof that the data-center pivot was working: a first 75 MW capacity reservation with a major data center, a 30 MW deposit under an agreement with Fit Energy for up to 380 MW, and an 11% jump on 6 October when Fit Energy unveiled a Pennsylvania campus plan. What the filing showed was a conversion problem. The company booked $17.0m of charges on inventory and firm purchase commitments under Phase 0 of the Fit Energy capital equipment agreement, and a class action filed 11 September alleges it misled investors between 24 June and 1 September about whether its manufacturing capacity could meet the production rate the deal required, disclosing the shortfall only in its 2 September quarterly report. The lead-plaintiff deadline is 10 November.
Five fiscal years of shipping plants below cost
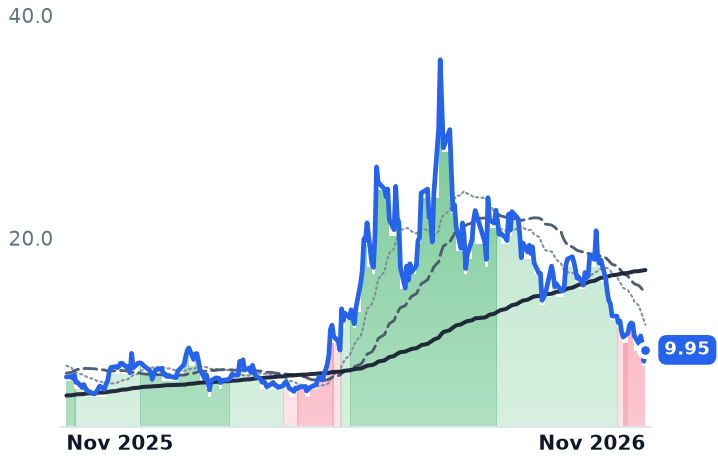
Revenue for the quarter ended 31 July was $33.0m, down 29.4% year on year. The gross loss of $24.5m works out to a -74.2% gross margin, against -11.0% a year earlier, and the operating margin was -141.4%. The negative unit economics are structural: gross margin has been negative in each of the last five fiscal years, from -22.5% in 2021 to -16.7% in 2025. Funding that gap has cost shareholders their share of the company, with diluted shares up 188% year on year to 70.4m. An upsized offering of 10,714,286 shares in July raised about $225m gross at $21.00; the 6 November close of $9.955 is 53% below that price.
The shares fell 45.5% between 7 October and 6 November and are still up 29.0% over twelve months. The fall has not made them cheaper on sales. Trailing price-to-sales is 5.16x, above the 4.26x of early May, because revenue contracted faster than market value. The forward 3.18x rests on consensus revenue of $250.1m for fiscal 2027, a 69.2% step up, with earnings per share still at -$1.18. Book value is the one undemanding anchor, at 0.72x.
Conversion, as practiced down the same industry code
Bloom Energy engineers solid-oxide systems that make on-site electricity from natural gas, biogas or hydrogen without combustion. Its September-quarter revenue was $1,235.8m, up 138.1%, at a 33.8% gross margin, with product revenue of $1,073.6m carrying a 38.4% product margin. Operating income reached $225.4m against $7.8m a year earlier, and on 22 October the company raised full-year guidance for the third time this year, to $4.4-4.6bn.
"Operating income in this quarter alone exceeded operating income for all of last year. That is the operating leverage embedded in our model now showing up in the results," chief financial officer Simon Edwards told investors on 22 October.
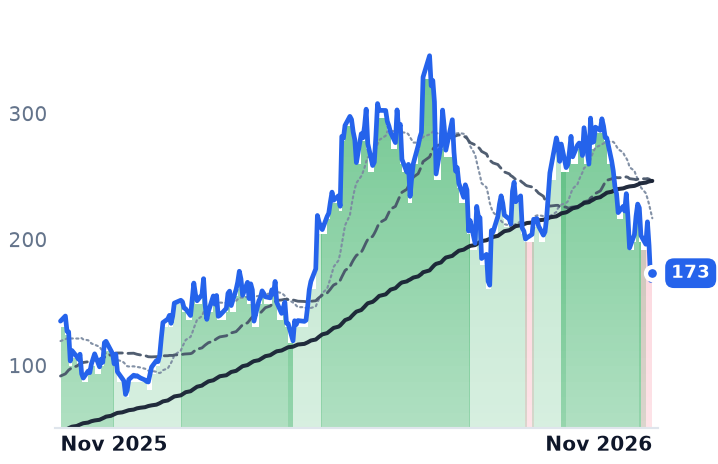
Bloom shares fell 14.1% on 5 November, the morning it announced a 900 MW deployment agreement with NTT Global Data Centers for initial shipments in 2027, and 40.3% across the month. Trailing price-to-sales is 13.37x, down from 31.81x in early May while revenue tripled. Its own file carries two cautions. Oracle has invoked force majeure on Project Jupiter, which carries Bloom's largest single deployment at up to 2.45 GW, roughly a tenth of its identified 25 GW pipeline; and the $2.2bn of zero-coupon notes priced last October convert at about $194.97, above the 6 November close of $173.24.
Two markdowns, two causes
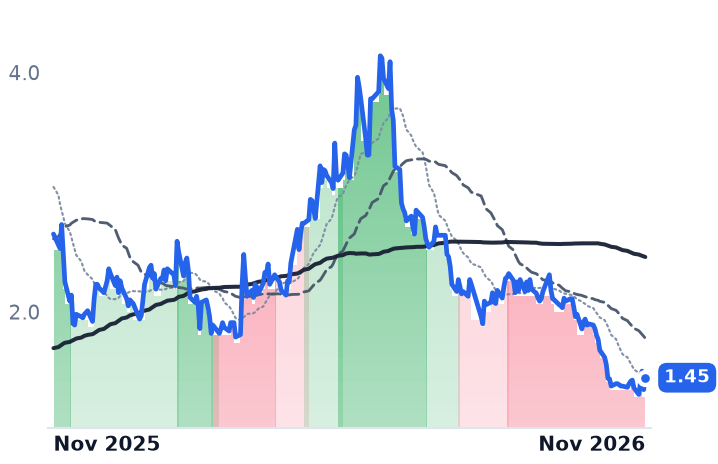
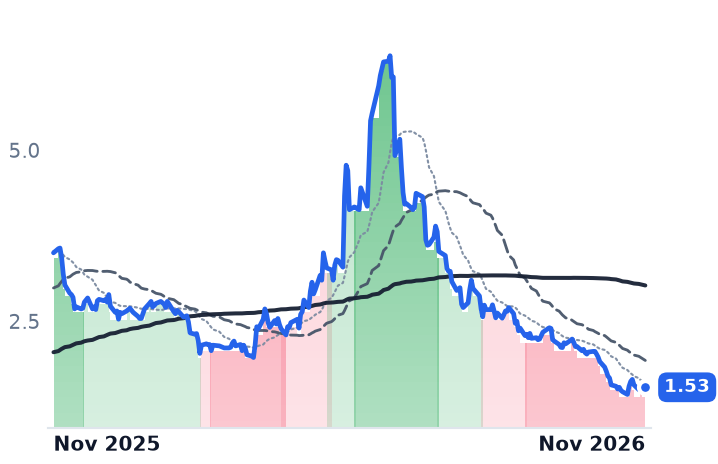
One company's results account for its de-rating and the other's account for none of it. What moved Bloom is siting risk for the campuses whose interconnect queues create behind-the-meter demand, after a Democrat won the Texas governorship on 3 November promising a pause on new data centers in a state holding 27% of planned data-center gigawatts on Wells Fargo's count. The two group members without that exposure barely registered it: Plug Power, whose gross margin reached roughly break-even at -0.9% in the June quarter, fell 19.7%, and Ballard Power, which sells stacks for buses, trucks and rail and holds the group's only positive gross margin at 19.8%, fell 24.0%. The month repriced data-center power, not fuel cells.
That leaves FuelCell Energy holding the one problem an election can neither cause nor cure. Torrington would have to run roughly thirteen times faster than it did last quarter before the backlog begins to pay.