

Jet Fuel Doubled and American Airlines Guided to a 2026 Loss With Unit Revenue Up 14.5%
Hypothesis Opus 5 · Research Opus 5 · Writing Opus 5 · Prompt v1.7
The de-rating across the big US carriers has been read as the coach cabin cracking: too many domestic seats, collapsing economy fares, premium and credit-card revenue carrying the P&L. The quarters reported between 9 and 22 October say the opposite happened. Main-cabin unit revenue rose 17% at Delta and coach unit revenue outgrew premium unit revenue by nearly four points at United, while the industry pulled about 3% of domestic seats from the late-December schedule.
What broke is the cost line. American paid $3.85 a gallon for fuel against $2.37 a year earlier, posted a 0.7% operating margin and abandoned the guidance that had allowed for a profit. The dispersion among the carriers tracks fuel recapture and leverage: Southwest expanded margin, United grew operating income, American carries $36bn of debt behind a market value of $8.3bn.
| Ticker | Company | Segment | Trend · 13mo | 30D | 1Y |
|---|---|---|---|---|---|
| The subject · what this brief is about | |||||
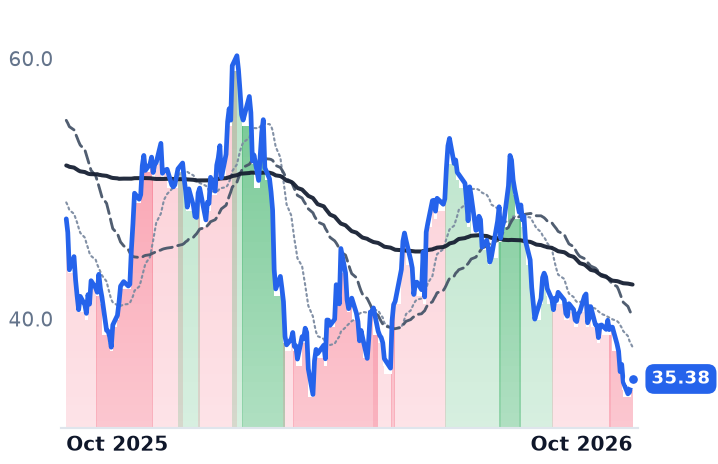
AAL | American Airlines | Major US Carriers | ⚠️ Emerging Bear | −7.4% | +4.2% |
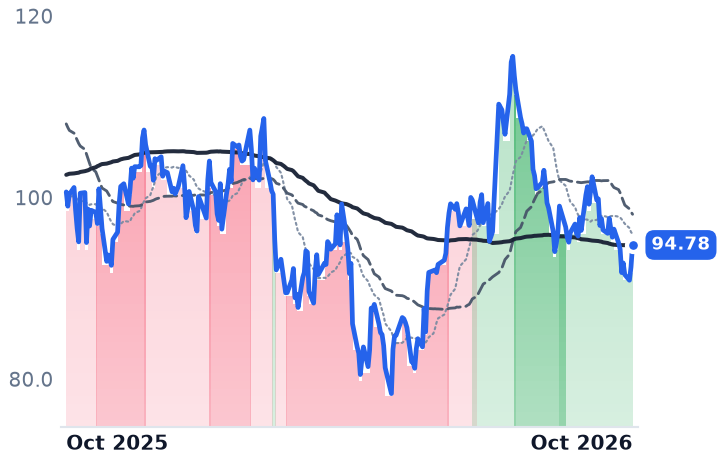
DAL | Delta Air Lines | Major US Carriers | 🟢 Cont. Bull | −5.6% | +32.8% |
UAL | United Airlines | Major US Carriers | 🟢 Cont. Bull | −11.5% | +6.0% |
LUV | Southwest Airlines | Major US Carriers | ⚠️ Emerging Bear | −0.1% | +25.6% |
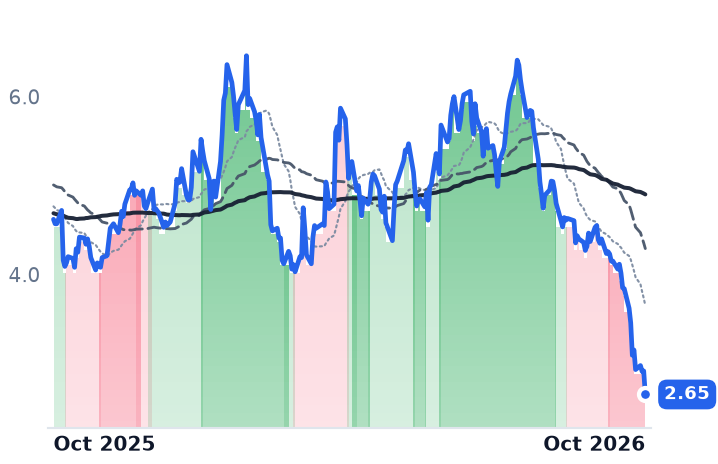
ALK | Alaska Air | Major US Carriers | 🔴 Cont. Bear | −15.6% | −25.8% |
JBLU | JetBlue Airways | Major US Carriers | ⚠️ Emerging Bear | −41.8% | −42.6% |
| Compared against · context, not the story | |||||
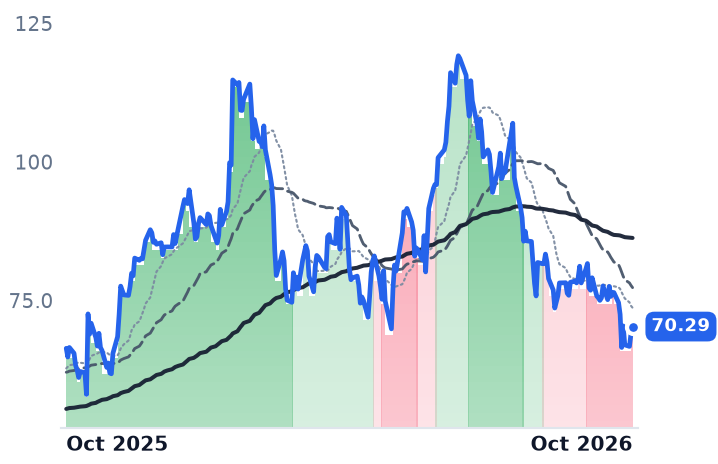
SKYW | SkyWest | Regional Carriers | 🟢 Cont. Bull | −6.3% | −5.8% |
ALGT | Allegiant Travel | Low-Cost Carriers | ⚠️ Emerging Bear | −13.9% | +5.9% |
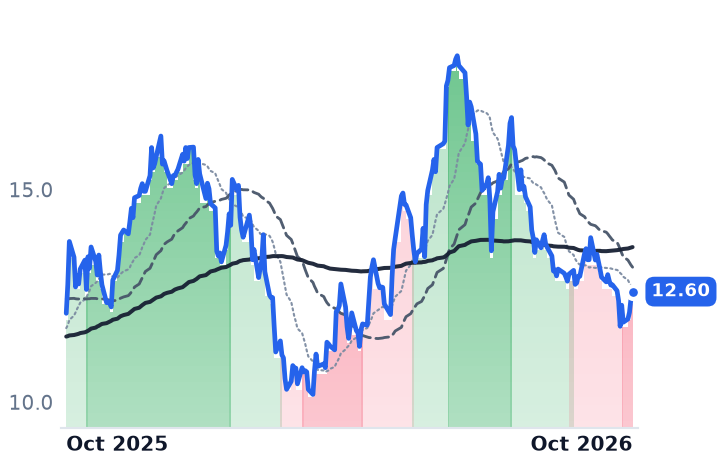
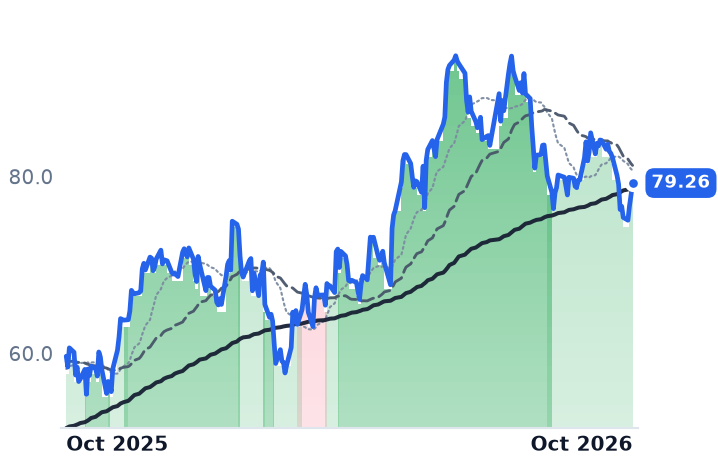
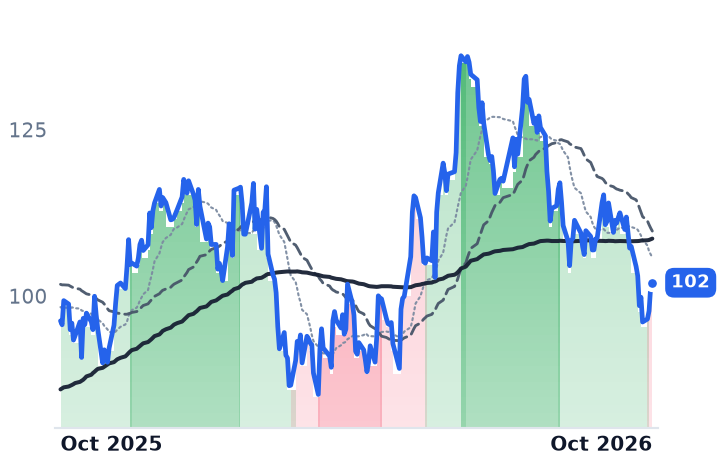
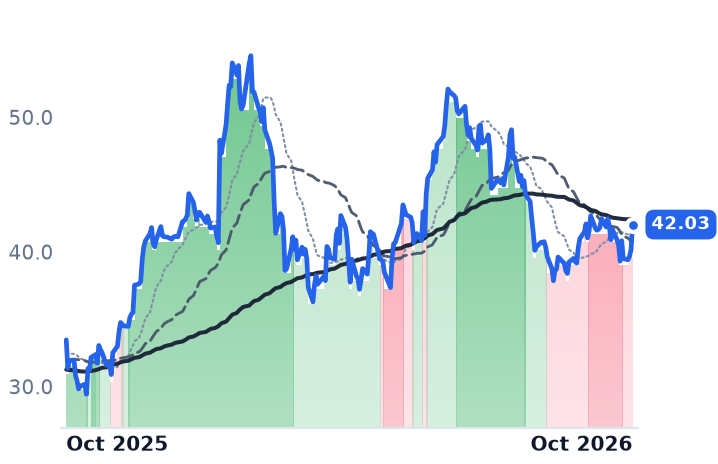
12-month price & trend
| Ticker | Mkt cap | P/E | P/E fwd | P/S | P/S fwd | P/GP | P/GP fwd | EV/EBITDA | FCF yld |
|---|---|---|---|---|---|---|---|---|---|
AAL | $8.3B | n/m | — | 0.1x | 0.1x | 0.6x | 0.6x | 13.6x | 31.6% |
DAL | $52.1B | 15.7x | 14.6x | 0.7x | 0.8x | 2.4x | 2.6x | 9.1x | 10.9% |
UAL | $33.1B | 9.3x | 13.5x | 0.5x | 0.5x | 0.8x | 0.7x | 7.1x | 3.4% |
| Ticker | Mkt cap | P/E | P/E fwd | P/S | P/S fwd | P/GP | P/GP fwd | EV/EBITDA | FCF yld |
|---|---|---|---|---|---|---|---|---|---|
LUV | $20.6B | 19.9x | 14.9x | 0.7x | 0.6x | 1.2x | 1.1x | 7.8x | -3.5% |
ALK | $3.9B | n/m | — | 0.3x | 0.2x | 0.4x | 0.3x | 17.9x | -16.5% |
JBLU | $999.9M | n/m | — | 0.1x | 0.1x | 0.2x | 0.2x | 31.6x | -112.9% |
| Ticker | Mkt cap | P/E | P/E fwd | P/S | P/S fwd | P/GP | P/GP fwd | EV/EBITDA | FCF yld |
|---|---|---|---|---|---|---|---|---|---|
SKYW | $3.6B | 9.0x | 8.7x | 0.9x | 0.8x | 1.2x | 1.2x | 5.9x | 8.8% |
ALGT | $1.8B | 47.1x | 11.9x | 0.6x | 0.5x | 1.4x | 1.1x | 10.2x | 6.5% |
Consensus projections
| Ticker | FY2026E | FY2027E | FY2028E | |
|---|---|---|---|---|
AAL | Revenue | +16.1% | +6.1% | +4.2% |
| EPS | −285.6% | −209.2% | +175.3% | |
DAL | Revenue | +14.8% | +6.6% | +4.2% |
| EPS | −6.5% | +36.5% | +32.2% | |
UAL | Revenue | +16.3% | +7.2% | +4.3% |
| EPS | −28.4% | +62.5% | +42.6% | |
LUV | Revenue | +17.9% | +5.6% | +3.3% |
| EPS | +197.2% | +47.1% | +29.8% | |
ALK | Revenue | +10.8% | +9.7% | +4.8% |
| EPS | −298.5% | −176.1% | +135.3% | |
JBLU | Revenue | +15.8% | +8.4% | +5.9% |
| EPS | +71.7% | −59.1% | −125.4% | |
SKYW | Revenue | +8.5% | +5.8% | +4.2% |
| EPS | +3.5% | +14.6% | +11.1% | |
ALGT | Revenue | +43.5% | +22.1% | +5.2% |
| EPS | +91.2% | +74.7% | +42.9% |
Forward fiscal years only. Blank means no analyst coverage for that year.
American Airlines told investors on 22 October that it now expects to lose between $1.00 and $1.60 a share for the full year, abandoning a range that had allowed for a profit, in the same hour it reported the fastest quarterly revenue growth its chief executive says he has seen. Revenue rose 19.3% to $16.3bn. Operating income fell to $115m, a margin of 0.7%, and the quarter produced a $269m net loss.
The fall across this shelf since mid-September has been read as the main cabin finally giving way: domestic seats outrunning demand, coach fares capped, premium cabins and co-brand credit-card payments left holding the earnings up. The four quarters reported between 9 and 22 October test that belief and break it. Coach is the strong half, fares are the best on record, and the seats are being taken out rather than added.
The coach cabin outperformed the front of the plane
Southwest posted unit revenue up 21.6% year on year, a company record and above its own 17.5%-19.5% guide, achieved while lapping the introduction of bag fees. United's total unit revenue rose 15.9%, and inside it non-premium revenue rose 18.4% on a 0.5% capacity increase, for coach unit revenue up 17.8% against premium unit revenue of 14.1%. Basic Economy revenue rose 16% and loyalty 17%. Delta's system unit revenue rose 15.4%, with main-cabin unit revenue up 17%, a third consecutive quarter of improvement. American's rose 14.5%, domestic 13.6%, after a deliberate choice: "American traditionally has been a leader in load factor," chief commercial officer Nathaniel Pieper said on 22 October, and the company "really identified yield improvement as a top priority."
Nor is anyone flooding the domestic market. About 3% of domestic seats were pulled from the 25 November to 31 December schedule after American, United and Southwest announced cuts around the 16 September Morgan Stanley conference. American said then that demand remained strong at higher fares and the problem was the economics of low-margin flying. Delta guides fourth-quarter revenue up roughly 20% with main-cabin seats down year on year.
Every carrier that reported posted double-digit unit revenue growth. Every one of them also paid close to twice as much for a gallon of fuel.
One input took the whole gain
The Strait of Hormuz has been closed to commercial shipping since 28 February, and because refined-product flows were disrupted along with crude, jet fuel crack spreads now run $85 to $95 a barrel against roughly $15-20 before. Spot jet fuel averaged $3.72 a gallon in August, 84% above a year earlier. Fourth-quarter assumptions sit close to double last year's: American roughly $4.70 a gallon, United $4.80, Southwest $4.55, Alaska $4.65 to $4.85 against an original $2.50 plan.
"Higher fuel added $1.9 billion to our costs in the third quarter. Nearly 70% more than we paid during the same period last year," American chief executive Robert Isom said on 22 October. Delta's Ed Bastian, on 9 October: "we expect to deliver pretax profits of roughly $4.5 billion fairly close to last year's profitability. Even with our fuel bill expected to increase by 60%, or $6 billion."
Recapture and the balance sheet set the dispersion
Delta kept revenue growth accelerating all year, to 21.1% in the September quarter, and still watched operating income fall 13.7%; it has a refinery worth about $0.40 a gallon of offset, diversified revenue at 61% of the total and American Express remuneration above $9bn tracking to $10bn, and trades at 15.7x trailing earnings against 14.6x forward. United recovered 72% of a fuel increase of $1.8bn and was the only one of the three to grow operating profit, up 3.7%; its forward earnings multiple of 13.5x sits above its 9.3x trailing precisely because consensus 2026 earnings are 28% lower, and 2027 consensus puts it on 8.3x. Southwest expanded operating margin 4.8 points to 5.4% despite a fuel headwind of $820m, on 19.9x trailing earnings against 14.9x forward, though part of its reported passenger-line gain came from a credit-card reclassification.
American has no forward earnings multiple to quote, against a consensus 2026 loss of $1.03 a share, negative book value and $36bn of debt behind an equity value of $8.3bn. On enterprise value to earnings before interest, tax, depreciation and amortization it is the dearest of the three at 13.6x, against United's 7.1x.
Alaska is the counter-example to the mix argument. Premium revenue is 36% of its mix, up three points, premium traffic rose 24.5% and loyalty cash 21% to $721m. It still lost $147m in the quarter and guides to a full-year adjusted loss of $5.00 to $5.50, and the shares sit 41% below their 52-week high.
The prices argue the same way
Over 30 days United fell 11.5% and American 7.4%; Delta, at 15.4% below its high, is the least damaged. The shelf's headline decline is mostly JetBlue, down 41.8% in a month to $2.65. The five-session slide from 12 to 19 October hit all four majors within three points of each other and reversed into the prints: every one of them rose on 22 October.
So the revenue line explains none of the de-rating and the earnings line explains most of it. Fares are not the variable in doubt; the variable is how much of a doubled fuel bill each carrier can pass through before its balance sheet decides the outcome. "To get there in 2027, we probably also need at least 1 of the 3 following things to happen: Lower fuel, lower industry capacity, or a continued willingness for the industry to trade load factor for yield," United's Scott Kirby said on 21 October. Two of those three are inside the industry's control, and both are already in motion: American says 2027 capacity will decelerate considerably, and Kirby says he will cut loss-making flights with no hesitation.
The third is not. Four ships transited the Strait of Hormuz on 18 October, against roughly 85 a day before the closure, and no one has put a date on its reopening. Every carrier's path back to profit is written against a forward curve that assumes one.