

Manhattan Office Concessions Moved From Free Rent Into Record Tenant Build-Out Spending
Hypothesis Opus 5 · Research Opus 5 · Writing Opus 5 · Prompt v1.7
Manhattan landlords are handing back fewer months of free rent, and the figure brokers quote to measure what a lease is actually worth has risen faster than asking rents. The saving did not stay with the landlord: tenant-improvement allowances reached $120.80 a square foot in September, a record, as construction costs rose, so the concession migrated into capital spending that net effective rent does not subtract.
SL Green's third quarter, reported 21 October, shows the asset-level turn — same-store Manhattan office occupancy of 95.0% including signed-but-uncommenced leases against 92.9% at the end of 2025, and replacement leases 13.6% above prior rents. On cash earnings the three names split: SL Green trades at 7.2x its raised 2026 funds-from-operations guidance and 8.6x stripping a one-off asset sale, Vornado near 12.4x an annualized quarterly run-rate, against 9.3x for office REITs.
| Ticker | Company | Segment | Trend · 13mo | 30D | 1Y |
|---|---|---|---|---|---|
| The subject · what this brief is about | |||||
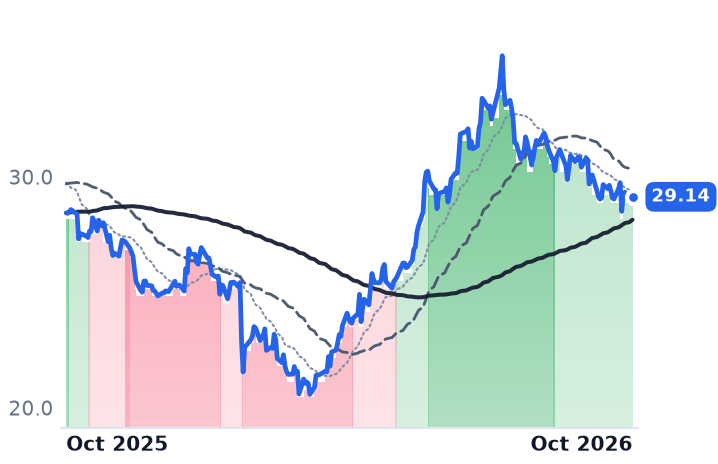
SLG | SL Green Realty | Major Urban Markets | 🟢 Cont. Bull | −9.8% | −7.3% |
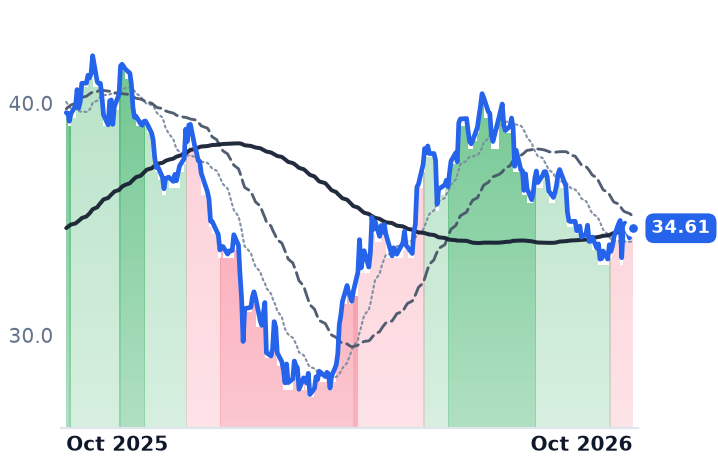
VNO | Vornado Realty Trust | Major Urban Markets | 🌱 Emerging Bull | −5.9% | −13.5% |
BXP | BXP | Major Urban Markets | 🌱 Emerging Bull | −7.7% | −16.2% |
| Compared against · context, not the story | |||||
CUZ | Cousins Properties Incorporated | Sun Belt Growth | 🟢 Cont. Bull | −2.4% | +7.6% |
HIW | Highwoods Properties | Sun Belt Growth | 🟢 Cont. Bull | −5.4% | +2.4% |
KRC | Kilroy Realty | Life Sciences & Innovation | 🌱 Emerging Bull | +0.7% | −12.6% |
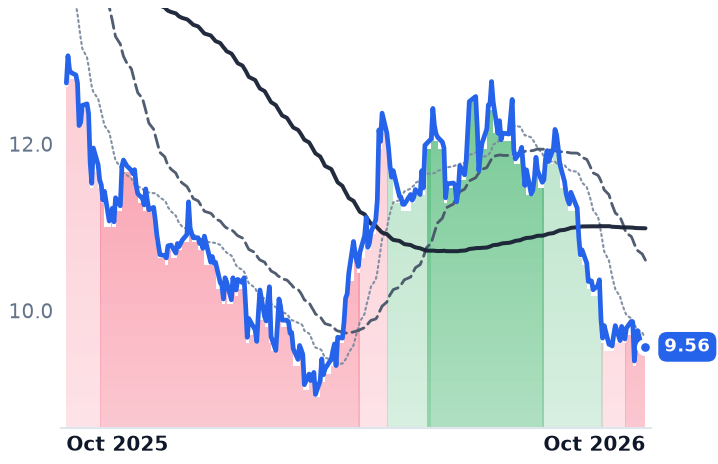
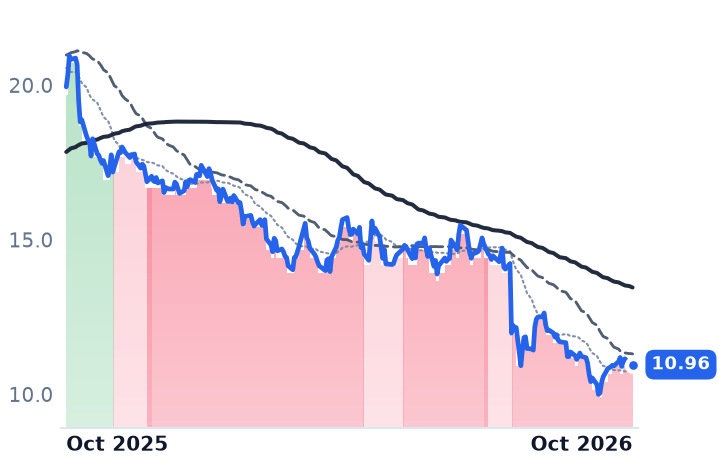
DEI | Douglas Emmett | Coastal Premium | 🔴 Cont. Bear | −7.1% | −24.9% |
JBGS | JBG SMITH Properties | Mixed-Use Office & Retail | 🔴 Cont. Bear | −2.0% | −45.1% |
HPP | Hudson Pacific Properties | Life Sciences & Innovation | 🌱 Emerging Bull | −20.5% | −47.1% |
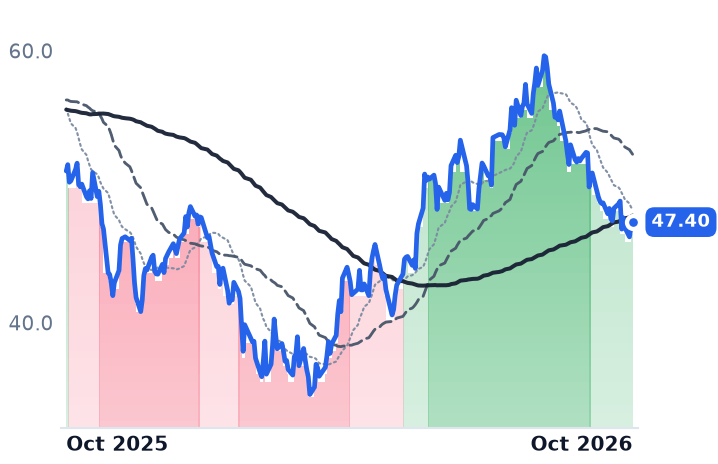
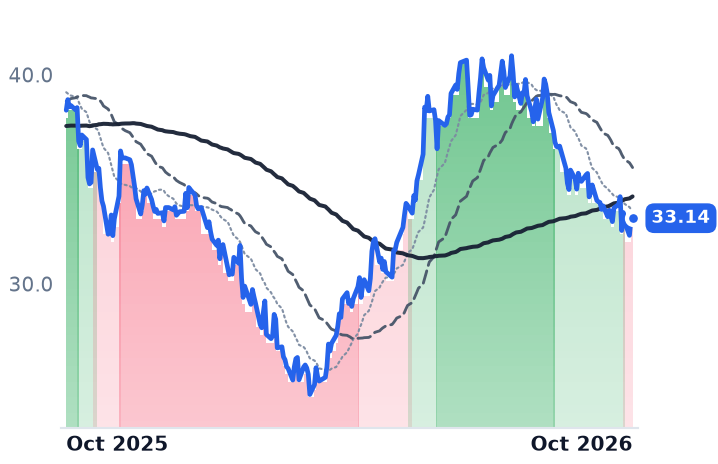
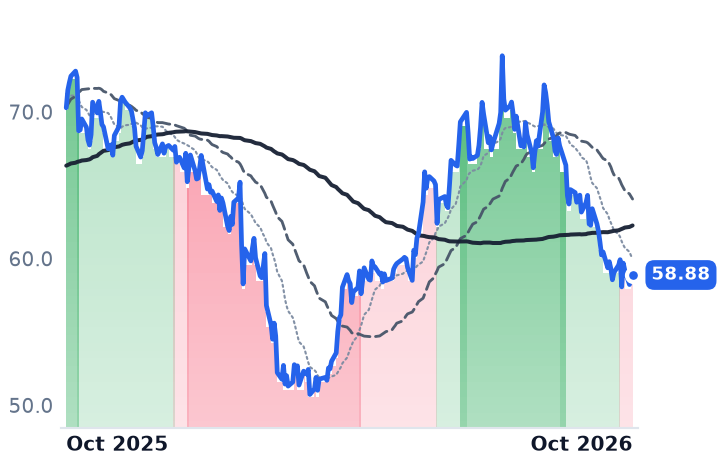
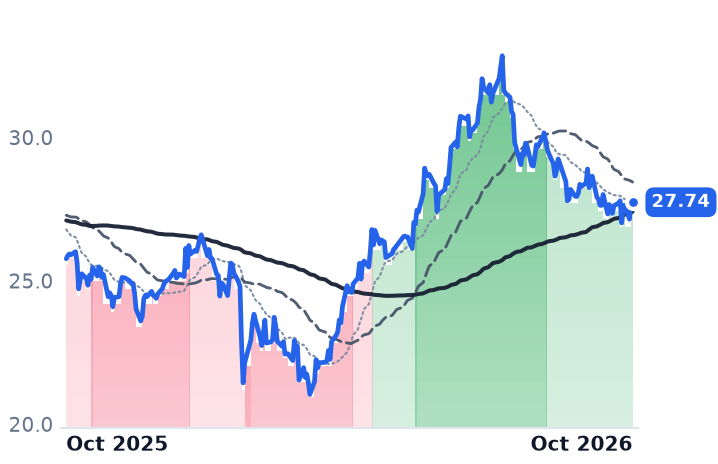
12-month price & trend
| Ticker | Mkt cap | P/E | P/E fwd | P/S | P/S fwd | P/GP | P/GP fwd | EV/EBITDA | FCF yld |
|---|---|---|---|---|---|---|---|---|---|
SLG | $3.3B | n/m | — | 3.2x | 4.9x | 6.2x | 9.5x | 16.6x | -1.1% |
VNO | $6.1B | — | — | 3.4x | 3.3x | 7.9x | 7.7x | 15.6x | 4.4% |
BXP | $9.4B | 31.5x | 28.0x | 2.7x | 2.7x | 5.7x | 5.7x | 13.5x | 3.9% |
| Ticker | Mkt cap | P/E | P/E fwd | P/S | P/S fwd | P/GP | P/GP fwd | EV/EBITDA | FCF yld |
|---|---|---|---|---|---|---|---|---|---|
CUZ | $4.4B | 653.5x | 123.1x | 4.3x | 4.2x | 7.4x | 7.2x | 14.4x | -2.0% |
HIW | $3.1B | 18.8x | 20.2x | 3.8x | 3.6x | 5.6x | 5.4x | 11.6x | 11.9% |
KRC | $3.9B | 23.1x | 136.0x | 3.5x | 3.6x | 7.3x | 7.4x | 11.0x | -6.2% |
| Ticker | Mkt cap | P/E | P/E fwd | P/S | P/S fwd | P/GP | P/GP fwd | EV/EBITDA | FCF yld |
|---|---|---|---|---|---|---|---|---|---|
DEI | $1.6B | n/m | — | 1.5x | 1.5x | 2.4x | 2.4x | 11.6x | 12.3% |
JBGS | $641.4M | n/m | — | 1.3x | 1.3x | 6.2x | 6.6x | 23.0x | 3.9% |
HPP | $594.2M | n/m | — | 0.7x | 0.8x | 2.5x | 2.8x | n/m | 18.9% |
Consensus projections
| Ticker | FY2026E | FY2027E | FY2028E | |
|---|---|---|---|---|
SLG | Revenue | +15.4% | −0.2% | −16.5% |
| EPS | +119.8% | −12.4% | −25.4% | |
VNO | Revenue | +2.1% | +10.5% | +6.7% |
| EPS | −108.7% | −21.1% | +56.9% | |
BXP | Revenue | +2.5% | +2.8% | +2.0% |
| EPS | +189.8% | −7.2% | +16.6% | |
CUZ | Revenue | +7.9% | +3.0% | +2.0% |
| EPS | −32.5% | +126.1% | +18.3% | |
HIW | Revenue | +6.2% | +3.3% | −3.6% |
| EPS | +24.7% | −48.9% | +4.4% | |
KRC | Revenue | −2.8% | +2.1% | +3.2% |
| EPS | −90.2% | +82.2% | +80.9% | |
DEI | Revenue | +1.7% | +3.4% | −3.6% |
| EPS | −266.9% | −0.7% | −90.5% | |
JBGS | Revenue | +3.0% | +1.8% | −3.7% |
| EPS | −6.3% | −100.0% | — | |
HPP | Revenue | +1.1% | +4.8% | −3.0% |
| EPS | −59.9% | −7.3% | +4.0% |
Forward fiscal years only. Blank means no analyst coverage for that year.
Manhattan landlords spent 2026 clawing back months of free rent, and on the brokers' arithmetic the cash value of a new lease rose faster than its asking price: average net effective rent on new direct leases reached $99 a square foot on a 12-month moving average in September, up 28% year on year, against base rents up 23% to $120. The saving did not stay with the landlord. Tenant-improvement allowances rose 7.9% over the same year to a record $120.80 a square foot, up 59.2% since 2019, because construction costs and tenant fit-out standards rose.
That swap is the whole test of whether the Manhattan recovery is arriving in cash. Net effective rent deducts forgone rent from face rent; it does not deduct the check a landlord writes to a tenant's contractor. The summer advance in SL Green, Vornado and BXP was read as proof that the economics of a Manhattan lease had turned. They have turned, and the measure most often quoted to prove it captures only the half that improved.
The concession changed shape rather than shrinking
Free rent is down on every broker's count, from a different base each time. Avison Young has it falling 8.6% in 2026 to just over 10 months per lease; Colliers' weighted abatement for new deals and expansions ran 12.4 months year to date against 13.8 months for full-year 2025, the lowest since 2019; a third dataset puts third-quarter signings at 8.2 months with allowances of $85.20 a foot. The samples differ, so the levels do not reconcile; the direction does. Meanwhile the average work-value package crested above $90 a square foot in the first half, the highest ever recorded, and accelerating.
Space that is not coming back
The landlord's leverage is physical. Avison Young measures availability down 290 basis points over the year to 13.4%, the lowest since 2020, with new leases and expansions at 78.2% of third-quarter activity; Colliers, counting inventory differently, reads 12.4% and a tenth straight quarter of tightening, the longest run since 2007. Leasing of 32.86m square feet in the nine months was the strongest start to a year since 2000. And roughly 8.8m square feet has been permanently removed by residential conversion since early 2021, with another 9.5m square feet of conversion starts planned for 2026.
SL Green reached its occupancy target a quarter early
"A growing scarcity of premier space in desirable Midtown districts has turned the tables in our favor," chairman and chief executive Marc Holliday told investors on the second-quarter call. The 21 October print backs him: Manhattan's self-described premier office landlord posted same-store occupancy of 95.0% including signed-but-uncommenced leases, against 92.9% at the end of 2025, same-store cash net operating income up 5.0%, and funds from operations of $1.59 a share. Its 28 replacement leases were signed at $110.88 a foot, 13.6% above prior fully escalated rents, a step down from 15.7% year to date.
The guidance raise, to $6.50-$6.70 from $5.60-$5.90, is mostly not operating: it carries $1.10 a share from selling a 20% stake in the food and beverage business and absorbs $0.25 a share of higher interest cost. At $47.40 that is 7.2x the midpoint, or 8.6x without the one-off, against 9.3x forward funds from operations for the office REIT sector, and 1.03x book, with trailing free cash flow at minus 1.1% because development spending outruns operating cash.
Vornado's cash spread is thinner than its headline one
"We had another strong quarter with comparable FFO of $0.67, beating analyst consensus by $0.10 or 17.5%," chairman and chief executive Steven Roth said on Vornado's 4 August call, up from $0.56, on rent commencements at Penn 1 and Penn 2. New York occupancy was 92.2%, from an 84.4% trough in early 2025. But the 659,000 square feet it signed in the first half at $105 a foot carried a 9.5% mark-to-market on an accounting basis and 7.1% in cash, and revenue grew 4.7%. Annualizing $0.67, a crude derivation since the company publishes no full-year guidance, puts it near 12.4x, the dearest of the three on cash earnings, at 1.06x book. On 21 October it closed the 350 Park Avenue venture with Ken Griffin and Rudin, a 1.05m square foot Citadel anchor lease and a $3.3bn construction loan, leaving roughly 850,000 square feet of upper floors to let.
BXP, the largest listed owner of premier Class A office space in the US, is a contrast case here: New York is a minority of six markets, occupancy was 88.4% with 91.3% leased, revenue grew 3.1%, and guidance rose $0.05 to $6.99-$7.05. It trades at 8.4x that midpoint and 1.81x book, the richest of the three on book value. Its mechanism is the cost of debt: $700m of 6.050% notes due 2036 redeemed $1.0bn of 2.750% paper, more than three points more for the same money.
Higher yields reach these landlords through their coupons
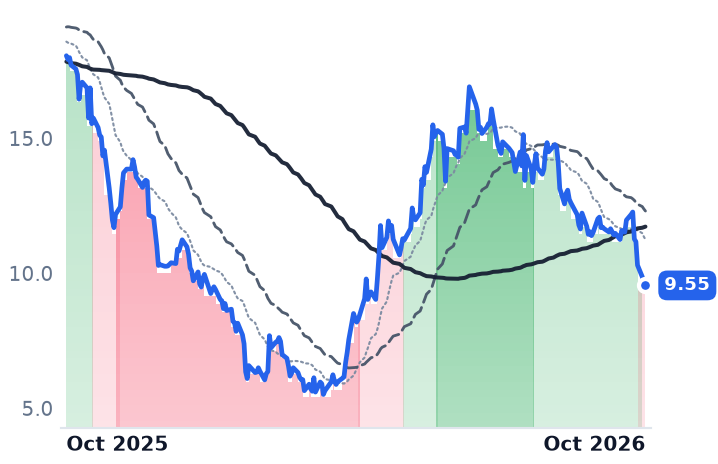
All three peaked around 21 July and have given back part of a spring advance: SL Green down 9.8% over 30 days, BXP 7.7%, Vornado 5.9%, each still higher than in April. The operating meters do not explain that; occupancy, cash net operating income and comparable earnings all improved. Rates do explain some of it, and not only through the discount rate. The 10-year Treasury yield stood at 5.13% on 21 October after touching a level last seen in 2002, and it arrives as cash cost: SL Green's $0.25 a share, BXP's extra points, and SL Green and Mori Trust's $2.0bn refinancing of 245 Park at a 6.52% fixed coupon.
The remainder is a measurement gap. Rent is genuinely being won back in Midtown, and a record share of what the landlord gives up now sits in construction allowances that the quoted rent figure never touches, and that BXP's own management expects to push its leasing capital spending toward $500m while cash same-store income lags reported income.
Two-thirds of the quarter is still unreported: BXP on 27 October, Vornado on 2 November. The figure to find in them is not the rent per foot but what it cost to build the tenant who pays it.