

Burford and Oxford Lane Cut the Estimates They Book as Income, and Cash Receipts Rose
Hypothesis Opus 5 · Research Opus 5 · Writing Opus 5 · Prompt v1.7
Two listed funds whose largest reported line is an estimate have both had that estimate revised down by their own directors this year, and at both the money actually arriving went up. Oxford Lane Capital buys the first-loss equity of collateralised loan obligations and accrues income off a modelled yield; Burford Capital finances lawsuits and books unrealised write-ups as revenue.
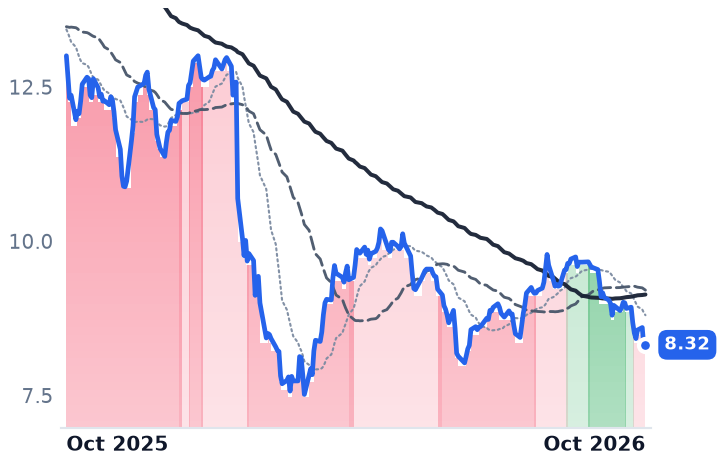
Oxford Lane's net asset value per share fell from $15.51 to $10.56 in the quarter to March, then steadied near $10.74 by June, while cash distributions received on its CLO equity ran at a 16.3% yield against an 11.1% accrual. Burford wrote $2.4bn off its Argentine judgment and still collected $157m of cash in the second quarter, its best since early 2025.
Over twelve months the destroyed book value explains the share prices. Over the last month it does not.
| Ticker | Company | Segment | Trend · 13mo | 30D | 1Y |
|---|---|---|---|---|---|
| The subject · what this brief is about | |||||
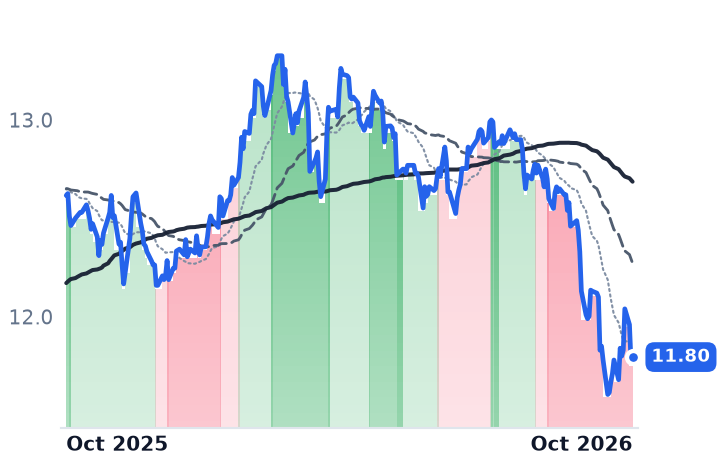
OXLC | Oxford Lane Capital | Specialty & Alternative Funds | 🔴 Cont. Bear | −12.8% | −36.0% |
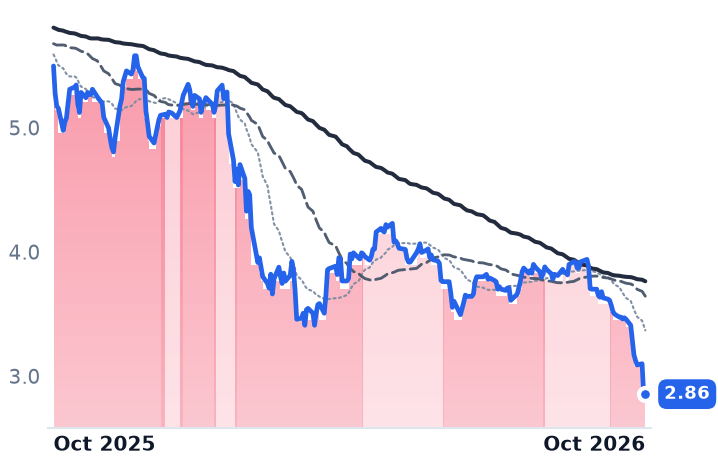
BUR | Burford Capital | Specialty & Alternative Funds | 🔴 Cont. Bear | −24.4% | −70.6% |
BUI | BlackRock Utilities, Infrastructure & Power Opportunities Trust | Specialty & Alternative Funds | ⚠️ Emerging Bear | −1.8% | +4.5% |
| Compared against · context, not the story | |||||
GUT | The Gabelli Utility Trust | Specialty & Alternative Funds | 🟢 Cont. Bull | −8.6% | +1.5% |
PDT | John Hancock Premium Dividend Fund | Specialty & Alternative Funds | ⚠️ Emerging Bear | −1.8% | −6.5% |
ECC | Eagle Point Credit | Closed-End Fixed Income Funds | 🔴 Cont. Bear | −22.8% | −48.1% |
12-month price & trend
| Ticker | Mkt cap | P/E | P/E fwd | P/S | P/S fwd | P/GP | P/GP fwd | EV/EBITDA | FCF yld |
|---|---|---|---|---|---|---|---|---|---|
OXLC | $802.3M | n/m | 2.1x | 2.0x | 2.0x | 3.0x | 3.0x | n/m | 86.8% |
BUR | $722.5M | n/m | — | n/m | 1.2x | — | — | 1.6x | -14.5% |
BUI | $680.3M | 4.5x | — | 4.8x | — | 5.0x | — | 4.9x | 1.3% |
| Ticker | Mkt cap | P/E | P/E fwd | P/S | P/S fwd | P/GP | P/GP fwd | EV/EBITDA | FCF yld |
|---|---|---|---|---|---|---|---|---|---|
GUT | $554.6M | 11.5x | — | 32.4x | — | 36.5x | — | 27.1x | 4.7% |
PDT | $625.6M | 9.1x | — | 7.0x | — | 8.9x | — | 14.6x | 3.9% |
ECC | $532.8M | n/m | 4.4x | 3.3x | 2.8x | 3.7x | 3.1x | n/m | 13.3% |
Consensus projections
| Ticker | FY2026E | FY2027E | FY2028E | |
|---|---|---|---|---|
OXLC | Revenue | +14.1% | −7.0% | +22.5% |
| EPS | +281.8% | −2.3% | +15.4% | |
BUR | Revenue | +0.6% | −16.2% | −5.9% |
| EPS | −781.1% | −107.4% | −43.6% | |
ECC | Revenue | −5.6% | +8.3% | — |
| EPS | −2.1% | −6.0% | — |
Forward fiscal years only. Blank means no analyst coverage for that year.
Oxford Lane Capital, a closed-end fund that buys the equity tranche of collateralised loan obligations — the first-loss slice beneath every rated note in a securitisation of leveraged corporate loans — reports investment income that nobody writes it a cheque for. The number is accreted off a modelled effective yield, which is an assumption about future defaults, recoveries and reinvestment. Burford Capital, which advances capital against the value of litigation and arbitration claims, has the same accounting in a different asset: its revenue line is dominated by write-ups on claims it still owns.
Both share prices have been falling for a year, and the natural reading is a market refusing a mark that management would not change. Both marks were changed by management. In the same quarters, the cash moved the other way.
Oxford Lane's accrual sits below its cheque
In the year to 31 March 2026 Oxford Lane booked total investment income of $391.8m and reported a net loss of $585.1m, or -$5.99 a diluted share; the difference is marks. Net asset value per share fell from $15.51 at the end of December to $10.56 at 31 March and recovered to $10.74 at 30 June. The company's unaudited estimate for 31 August was $10.34 to $10.64, figures it says did not go through its usual quarter-end closing procedures and were not approved by the board.
The cash disagrees with the accrual, in the fund's favor. For the June quarter Oxford Lane reported net investment income under generally accepted accounting principles of $0.51 a share against core net investment income of $0.95, and that $0.44 difference is the timing gap between effective-yield accrual and distributions actually received. The weighted-average cash distribution yield on CLO equity was 16.3% at 30 June against a modelled effective yield of 11.1%, so the surplus cash amortises cost basis instead of passing through income. Declared distributions of $0.20 a month, halved from $0.40 on 30 January 2026, come to $0.60 a quarter: above the accounting income, roughly two-thirds of the cash measure.
The collateral improved as the shares fell. The twelve-month trailing default rate for the loan index was 0.97% at 30 June against 1.44% three months earlier. Chief executive Jonathan Cohen called the CLO refinancing and reset market "a very natural offset to spread compression in the U.S. syndicated corporate loan market" on the 28 July 2026 call.
At $8.32 the shares sit about a fifth below the $10.49 midpoint of the August estimate. Eagle Point Credit, the nearest listed competitor for the same CLO-equity dollar, trades at a 27.6% discount against a three-year average premium of 2.11%, so the repricing is the class's, not one manager's. Oxford Lane's board responded on 14 May 2026 by authorising up to $150.0m of buybacks through May 2027 — the reverse of the machine that sold shares above book.
Burford's mark went to court and lost
On 27 March 2026 the Second Circuit reversed the $16.1bn judgment against Argentina, holding the investors' claims "not cognizable under Argentina's civil codes or under the public law governing expropriation". Burford took a $2.4bn capital-provision loss, cutting those assets to about $160m. Tangible book value per share fell from $10.57 at 31 December to $3.12 at 30 June, with debt at 3.5x tangible book against 0.9x.
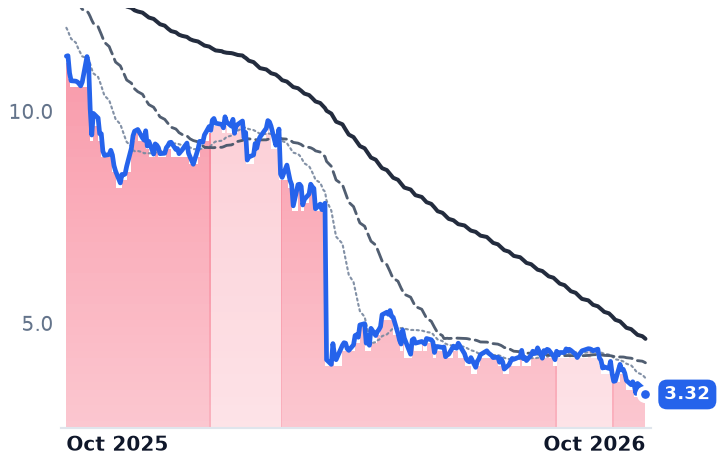
Collections ran the opposite way. Second-quarter cash receipts of $157m were the firm's highest since the first quarter of 2025, with realisations up to $94m from $62m. "While the YPF loss was disappointing and caused a very large non-cash charge to our quarterly earnings, there is no cash impact from that loss," chief executive Christopher Bogart said with the 6 August results. The remaining book carries roughly $4.1bn of fair value against $1.9bn of deployed cost, about a 22% markup, alongside $733m of cash and marketable securities. At $3.32 the shares are near 1.06x tangible book.
The utilities fund on the same shelf is a different fact
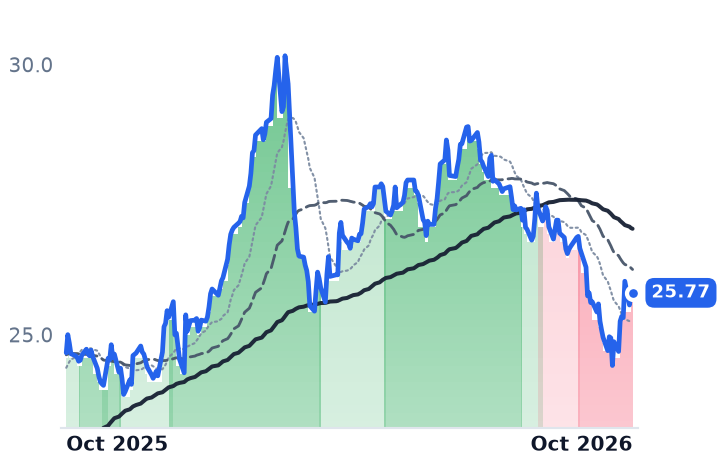
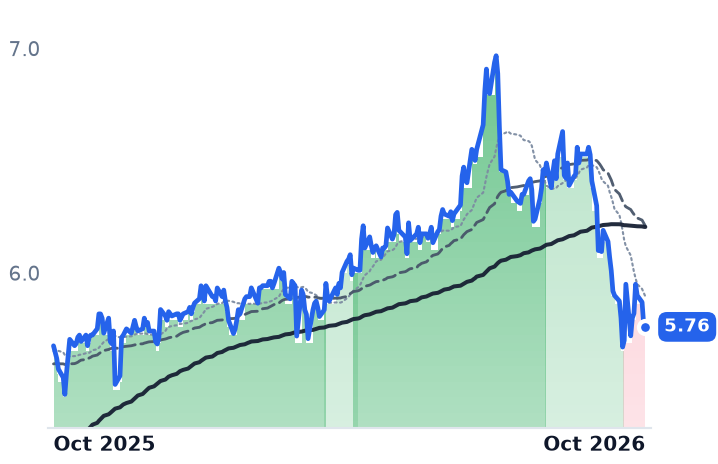
BlackRock Utilities, Infrastructure & Power Opportunities Trust, a closed-end fund holding listed utility and power equities, fell under 2% over thirty days, and almost none of that is the discount: BlackRock disclosed an average daily discount of 1.39% for the nine months to 30 September. Its portfolio returned 19.99% at net asset value in the six months to 30 June. What moved it was the discount rate: utilities fell about 6% on the month as the ten-year Treasury paid above 5.2%.
Twelve months explain these falls; thirty days do not
Across a year the arithmetic holds. Oxford Lane's shares are down 49.4% against net assets cut by a third in one quarter; Burford's are down 70.6% against tangible book cut by 70%. Across the last month it breaks: Oxford Lane fell 12.8% while its net asset value held and defaults under it improved, and Burford fell 24.4% in the stretch after its strongest collections in five quarters.
The two have different reasons for that last leg. At Oxford Lane the likelier reading is the closed-end fund class itself, where the average discount reached 8.4% at the end of the third quarter and taxable-bond funds widened from 6.6% to 9.98% amid tax-loss selling. At Burford it is one courtroom: the certiorari petition filed on 30 September 2026 is the only company-specific news in the window.
That is the awkward part of valuing either one. The anchor a buyer would use at Oxford Lane is itself a Level 3 estimate the market is marking down by a fifth, and the anchor at Burford is a portfolio whose single largest asset is now a residual claim waiting on nine justices to decide whether to look at it at all.