

Newmont's Cost Per Ounce Rose 58% in a Quarter on Capital Timing and By-Product Credits
Hypothesis Opus 5 · Research Opus 5 · Writing Opus 5 · Prompt v1.7
Newmont's income statement cannot say whether mining an ounce of gold got more or less profitable, and this year the two lines moved at very different speeds. Revenue fell 16.3% between the March and June quarters; the gap between what Newmont received for an ounce and what it reported spending to produce one fell 27.9%, because that reported cost swung from $1,029 to $1,621 on sustaining-capital timing, by-product credits and downtime after an earthquake at Cadia.
The same measure splits the group by geography. Agnico Eagle produced its ounce for $1,459 in Canada and Finland; AngloGold Ashanti spent $2,039 in Ghana, Tanzania and Australia and attributed nearly all of its increase to currencies, fuel and royalties rather than to mining. Last month's slide across the majors, by contrast, tracked the metal almost one-for-one.
| Ticker | Company | Segment | Trend · 13mo | 30D | 1Y |
|---|---|---|---|---|---|
| The subject · what this brief is about | |||||
NEM | Newmont | Major Producers | 🟢 Cont. Bull | −4.2% | +32.5% |
AEM | Agnico Eagle Mines | Major Producers | 🟢 Cont. Bull | −4.3% | +10.3% |
AU | AngloGold Ashanti | Major Producers | 🟢 Cont. Bull | −6.3% | +29.7% |
| Compared against · context, not the story | |||||
B | Barrick Mining | Major Producers | 🟢 Cont. Bull | −3.2% | +24.4% |
KGC | Kinross Gold | Major Producers | ⚠️ Emerging Bear | −15.8% | −6.8% |
12-month price & trend
| Ticker | Mkt cap | P/E | P/E fwd | P/S | P/S fwd | P/GP | P/GP fwd | EV/EBITDA | FCF yld |
|---|---|---|---|---|---|---|---|---|---|
NEM | $124.2B | 14.8x | 12.6x | 4.9x | 4.7x | 8.5x | 8.1x | 7.4x | 7.8% |
AEM | $95.7B | 16.2x | 16.1x | 6.6x | 6.3x | 10.6x | 10.1x | 8.9x | 4.7% |
AU | $47.6B | 12.5x | 10.6x | 4.0x | 3.7x | 7.5x | 7.0x | 5.8x | 8.9% |
| Ticker | Mkt cap | P/E | P/E fwd | P/S | P/S fwd | P/GP | P/GP fwd | EV/EBITDA | FCF yld |
|---|---|---|---|---|---|---|---|---|---|
B | $68.8B | 10.6x | 11.8x | 3.3x | 3.3x | 5.9x | 5.8x | 5.2x | 8.1% |
KGC | $34.0B | 11.9x | 9.2x | 4.3x | 3.3x | 8.1x | 6.3x | 6.5x | 8.9% |
Consensus projections
| Ticker | FY2026E | FY2027E | FY2028E | |
|---|---|---|---|---|
NEM | Revenue | +20.8% | +7.6% | +3.7% |
| EPS | +42.3% | +11.7% | +13.0% | |
AEM | Revenue | +28.3% | +3.6% | −1.8% |
| EPS | +42.8% | +3.6% | +0.8% | |
AU | Revenue | +27.6% | +5.5% | +5.3% |
| EPS | +53.2% | +3.3% | +13.3% | |
B | Revenue | +28.6% | +13.2% | +5.1% |
| EPS | +50.3% | +13.0% | +15.0% | |
KGC | Revenue | +42.5% | +1.2% | −6.2% |
| EPS | +77.9% | +10.9% | −6.4% |
Forward fiscal years only. Blank means no analyst coverage for that year.
Newmont told investors in July that producing an ounce of gold had cost it $1,621 in the June quarter, against $1,029 three months before. Nothing in the mine plan of a company that digs gold in ten countries changed by 58% in ninety days. The step came from the timing of sustaining capital, from by-product credits that had flattered the earlier figure, and from the incremental costs of running Cadia in New South Wales through the downtime that followed a magnitude 4.5 earthquake there on 14 April.
All-in sustaining cost is the figure the gold industry publishes as its margin meter, and revenue is where investors look for the metal price passing through. For a producer this size, neither line does the job it is asked to do. Newmont's realised price was $4,900 an ounce in the first quarter and $4,414 in the second; set against the two cost figures, the spread per ounce narrowed 27.9% while reported revenue fell 16.3%. The income statement understated the squeeze by roughly twelve percentage points, and the cost line did marginally more of the damage than the weaker gold price.
What the cost per ounce leaves on the floor
The measure is defined to exclude the next mine. Agnico Eagle, which mines in Canada, Mexico and Finland, reported total cash costs of $1,054 an ounce and all-in sustaining cost of $1,459 in the June quarter: the $405 difference is sustaining capital and related charges. Growth capital sits outside both. Newmont plans $1.4bn of development capital this year and spent $524m of it in the first half, which against guidance of 5.26m to 5.3m attributable ounces works out at roughly $265 an ounce of spending the cost line never shows.
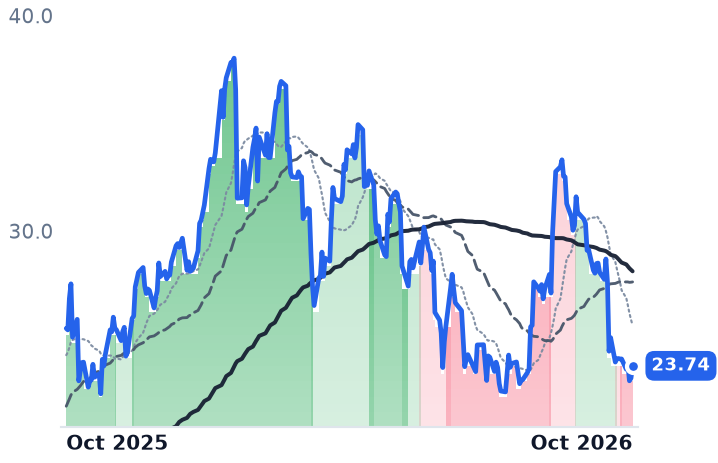
Which is why the cost step and the cash machine can run in opposite directions. Newmont still generated record free cash flow of $2.2bn in the June quarter, after $3.1bn and a raised $6bn repurchase authorisation in the March quarter. The shares trade at 12.6x forward earnings against 14.8x trailing, with a 7.8% trailing free-cash-flow yield.
The $580 an ounce that geography costs
AngloGold Ashanti, which mines in Africa, Australia and the Americas and reports in dollars, spent $2,039 an ounce in the same quarter, up 22.4% year on year, with sustaining capital of $332m against $273m. Of the increase in its cash costs, the company attributed $216 an ounce to macroeconomic factors and $29 to operational ones. "Royalties, fuel, broad inflation, FX basically accounted for all of the increase," chief executive Alberto Calderon said on the results call; chief financial officer Gillian Doran told the same 31 July call that "the upward pressure on costs for the industry were particularly acute this quarter." A fatality at Obuasi on 24 April cost two weeks of operation, and the mine has been running without its ore-pass system after a catastrophic failure.
Agnico's ounce came out of record throughput: the Detour Lake mill ran at 80,275 tonnes a day and produced 207,279 ounces, up 23.2% year on year. The company has hedged about 60% of its remaining 2026 Canadian-dollar exposure in a 1.38 to 1.42 collar. That cost base is what the market is paying for, at 16.1x forward earnings against 16.2x trailing and the group's thinnest free-cash-flow yield at 4.7%, while the soft-currency structure in Ghana and Tanzania is priced at 10.6x forward against 12.5x trailing and an 8.9% yield.
Why last month's slide was mostly the metal
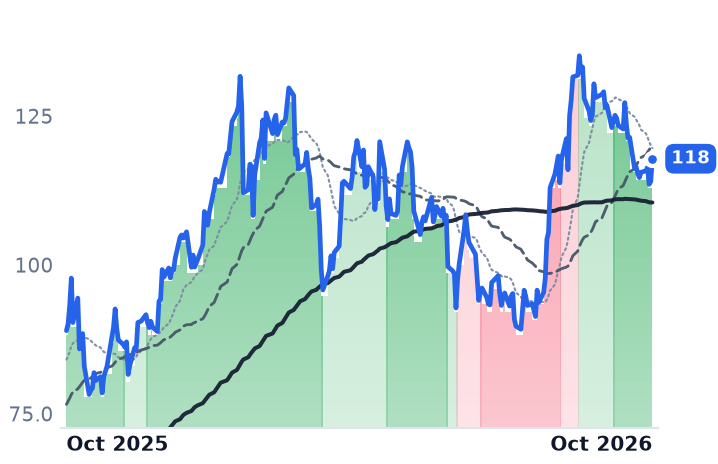
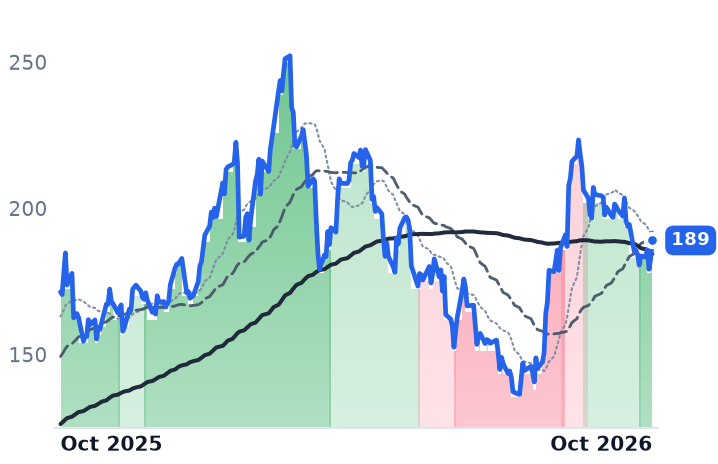
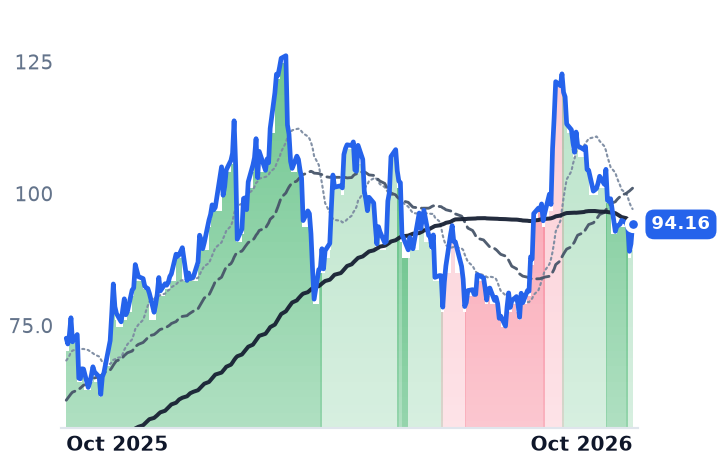
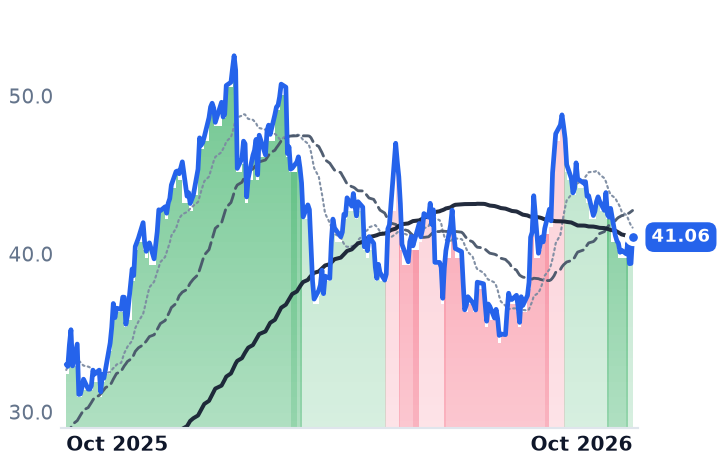
The majors fell together over the thirty days to 9 October, Agnico 7.3%, Barrick 7.9%, Newmont 8.7%, after the Federal Reserve raised rates on 16 September, the ten-year Treasury yield reached 5.3% and gold dropped more than 6% in the month. That is close to one-for-one with the metal, less than the leverage gold equities usually deliver, and it is not a cost story. Barrick's jurisdiction overhang is behind it: Mali was settled for $430m in November 2025, and its shares trade at 11.8x forward against 10.6x trailing, the only one of the four whose forward figure sits above trailing.
What moves a gold equity hard is an ounce that does not arrive. Kinross fell 21.8% over the month after cutting production guidance on 24 September to two to three per cent below its earlier low end, citing storms at La Coipa and lower grades and recoveries at Round Mountain.
So the drawdown belongs to the rate shock, and the three-month gains of 24.3% at Newmont and 26.8% at Agnico belong to a metal that, industry-wide, outran its cost base: average producer sustaining costs hit a record $1,785 an ounce in the March quarter, the 28th consecutive annual increase, and the margin over them hit a record anyway. The business underneath is slowing. Revenue growth halved sequentially at all three, gross margins compressed between four and nine percentage points, and sustaining cost per ounce rose 13.9% year on year at Agnico. Newmont's management said on 23 July that sustaining capital would be approximately 58% weighted to the second half, citing programmes at Boddington and Cadia, ventilation at Tanami and summer construction in British Columbia. The cost line for the September quarter is already largely written.
Spot gold was about $4,184 an ounce on 12 October, a quarter below January's record. The price resets every morning; the cost of the next ounce was fixed by a capital schedule set in the spring.