

Green Brick's Gross Margin Held Near 30% Through the Rate Cycle Because It Owns the Dirt
Hypothesis Opus 5 · Research Opus 5 · Writing Opus 5 · Prompt v1.7
Mid-size homebuilders are being sold as one trade priced off the mortgage buydown, but the margin lines say they are three different businesses depending on who owns the lot. Green Brick, which develops most of its own land in Dallas and Atlanta, reported a 29.8% homebuilding gross margin in the June quarter with net new orders up 19%, and its shares still fell with the group.
Dream Finders, which controls lots through options and third-party land bankers, earned 14.2%, down from 16.5%, with average selling price down 8.9% to $438,171 even as unit orders set a second-quarter record. One margin is a land spread earned years ago; the other is a concession bought this quarter at a 7.40% mortgage rate.
The de-rating is deserved at Dream Finders, where forward earnings estimates have halved. At Green Brick, on 9.4x trailing earnings, the business got better while the shares did not.
| Ticker | Company | Segment | Trend · 13mo | 30D | 1Y |
|---|---|---|---|---|---|
| The subject · what this brief is about | |||||
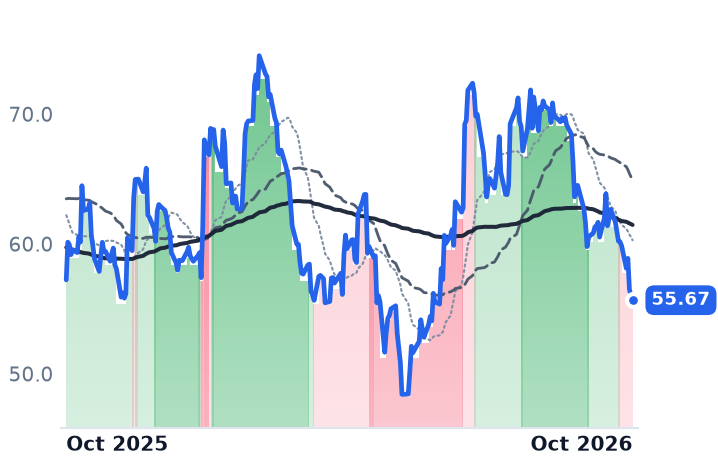
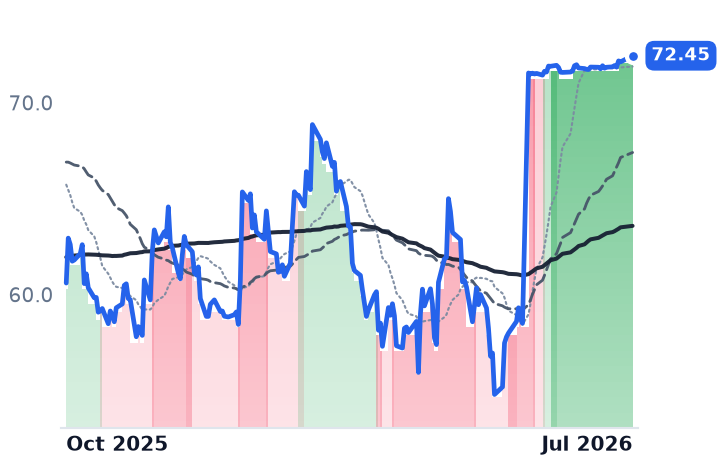
GRBK | Green Brick Partners | Regional & Mid-Size Homebuilders | 🟢 Cont. Bull | −8.1% | +0.0% |
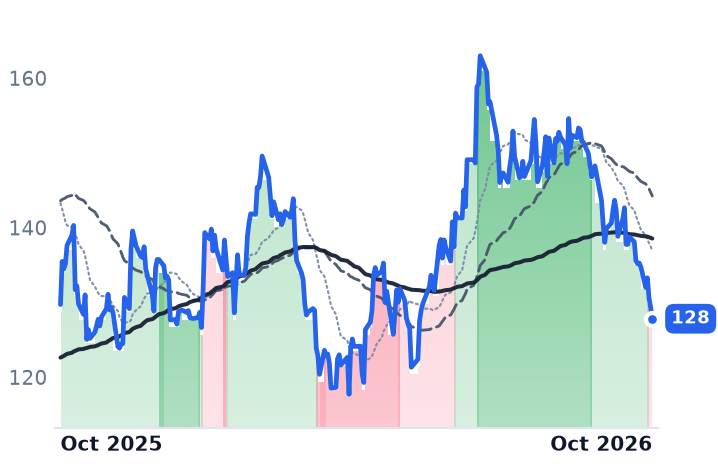
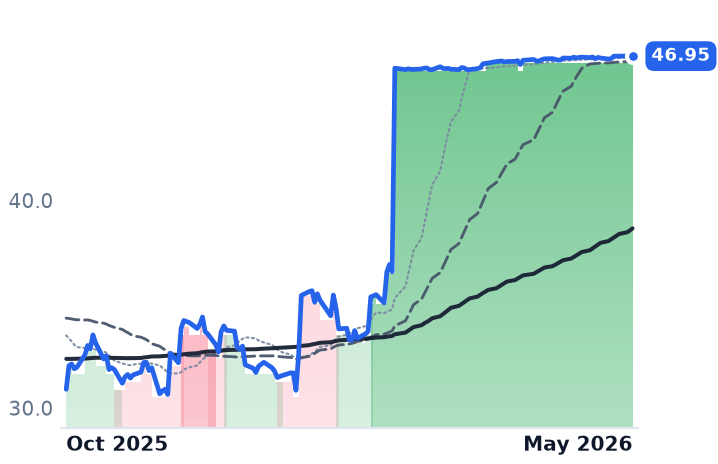
DFH | Dream Finders Homes | Regional & Mid-Size Homebuilders | 🔴 Cont. Bear | −23.6% | −59.8% |
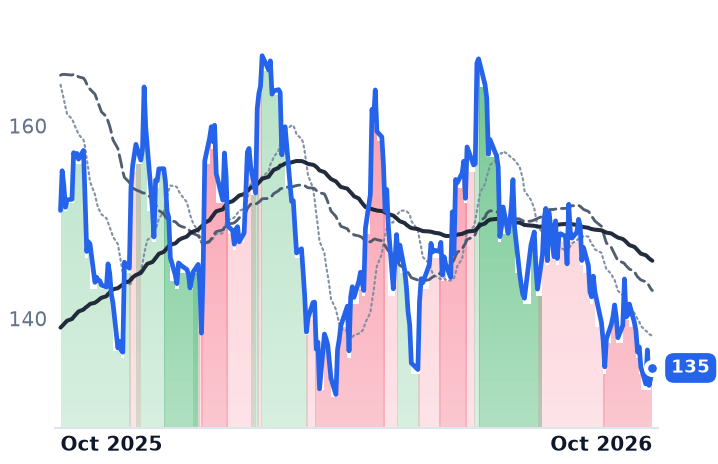
MTH | Meritage Homes | Regional & Mid-Size Homebuilders | 🔴 Cont. Bear | −8.4% | −10.7% |
| Compared against · context, not the story | |||||
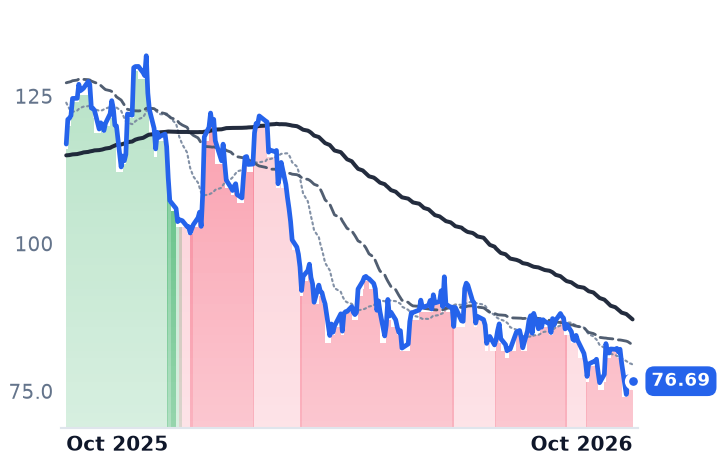
KBH | KB Home | Regional & Mid-Size Homebuilders | 🔴 Cont. Bear | −12.3% | −24.7% |
CCS | Century Communities | Regional & Mid-Size Homebuilders | 🟢 Cont. Bull | −8.0% | −2.7% |
MHO | M/I Homes | Regional & Mid-Size Homebuilders | 🟢 Cont. Bull | −8.6% | −1.5% |
DHI | D.R. Horton | Large National Homebuilders | 🔴 Cont. Bear | −2.2% | −10.8% |
LEN | Lennar | Large National Homebuilders | 🔴 Cont. Bear | −3.7% | −34.4% |
TMHC | Taylor Morrison Home | Regional & Mid-Size Homebuilders | 🟢 Cont. Bull | — | +19.6% |
TPH | Tri Pointe Homes | Regional & Mid-Size Homebuilders | 🟢 Cont. Bull | — | +51.9% |
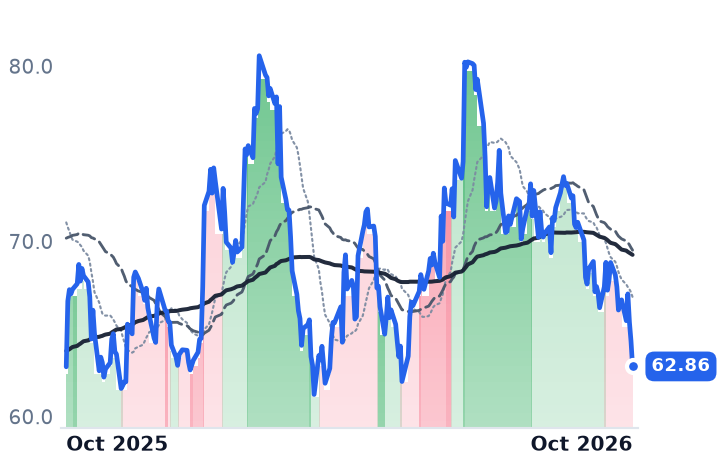
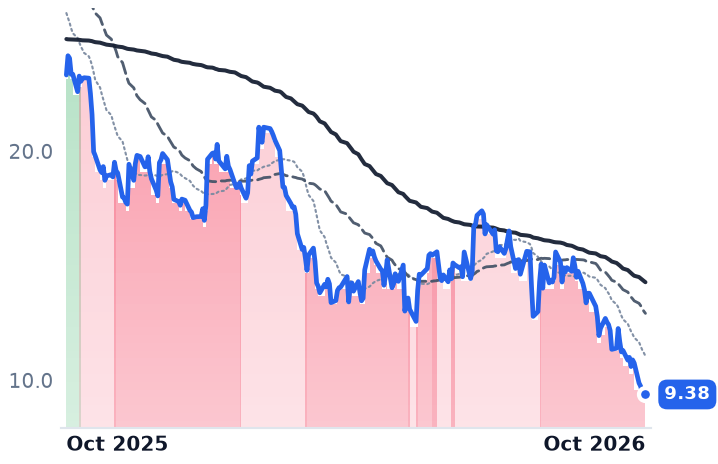
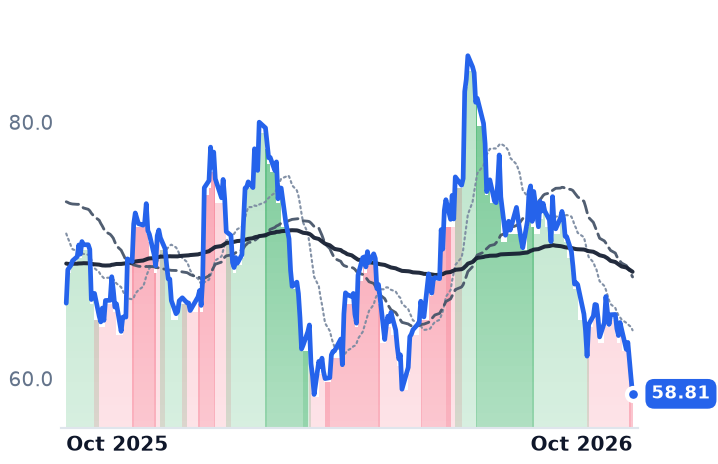
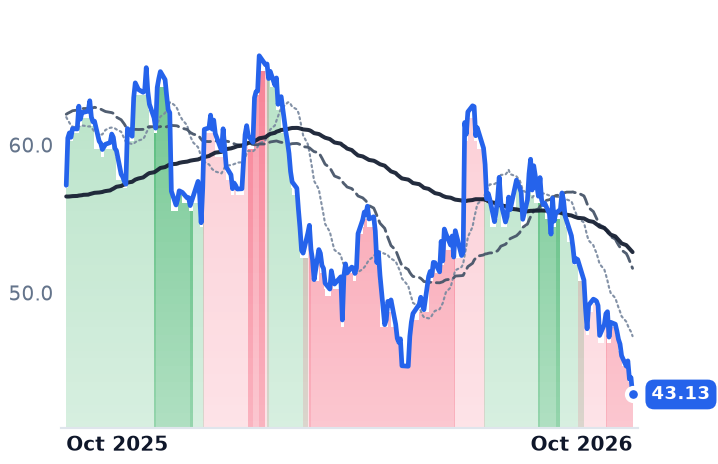
12-month price & trend
| Ticker | Mkt cap | P/E | P/E fwd | P/S | P/S fwd | P/GP | P/GP fwd | EV/EBITDA | FCF yld |
|---|---|---|---|---|---|---|---|---|---|
GRBK | $2.7B | 9.4x | 10.3x | 1.4x | 1.4x | 4.4x | 4.6x | 7.1x | 4.0% |
DFH | $864.7M | 5.9x | 8.8x | 0.2x | 0.2x | 1.5x | 1.5x | 8.8x | -18.7% |
MTH | $3.9B | 12.3x | 12.1x | 0.7x | 0.7x | 3.8x | 3.9x | 9.8x | 10.6% |
| Ticker | Mkt cap | P/E | P/E fwd | P/S | P/S fwd | P/GP | P/GP fwd | EV/EBITDA | FCF yld |
|---|---|---|---|---|---|---|---|---|---|
KBH | $2.6B | 11.9x | 13.4x | 0.5x | 0.5x | 3.7x | 3.8x | 14.6x | 1.2% |
CCS | $1.4B | 10.7x | 12.9x | 0.3x | 0.4x | 2.0x | 2.2x | 14.2x | 6.8% |
MHO | $3.4B | 11.1x | 11.2x | 0.8x | 0.8x | 3.7x | 3.8x | 7.2x | 5.9% |
| Ticker | Mkt cap | P/E | P/E fwd | P/S | P/S fwd | P/GP | P/GP fwd | EV/EBITDA | FCF yld |
|---|---|---|---|---|---|---|---|---|---|
DHI | $38.4B | 12.3x | 12.8x | 1.2x | 1.1x | 5.0x | 5.0x | 10.4x | 9.1% |
LEN | $20.8B | 11.3x | 13.4x | 0.6x | 0.6x | 3.7x | 3.8x | 9.4x | 0.1% |
TMHC | $6.7B | 10.6x | 13.7x | 0.9x | 1.0x | 3.9x | 4.5x | 8.7x | 10.6% |
| Ticker | Mkt cap | P/E | P/E fwd | P/S | P/S fwd | P/GP | P/GP fwd | EV/EBITDA | FCF yld |
|---|---|---|---|---|---|---|---|---|---|
TPH | $4.0B | 21.7x | 24.5x | 1.2x | 1.3x | 6.0x | 6.5x | 16.0x | 2.8% |
Consensus projections
| Ticker | FY2026E | FY2027E | FY2028E | |
|---|---|---|---|---|
GRBK | Revenue | −5.8% | +0.7% | +6.6% |
| EPS | −12.4% | −1.6% | −1.8% | |
DFH | Revenue | +0.9% | +3.0% | +3.7% |
| EPS | −50.6% | −26.3% | +21.0% | |
MTH | Revenue | −9.7% | +6.9% | +7.6% |
| EPS | −27.6% | +16.4% | +28.8% | |
KBH | Revenue | −18.7% | +2.3% | +6.2% |
| EPS | −49.7% | +14.0% | +24.5% | |
CCS | Revenue | −6.2% | +8.3% | — |
| EPS | −30.8% | +30.8% | — | |
MHO | Revenue | −4.5% | +4.1% | −2.1% |
| EPS | −25.7% | +15.4% | +9.6% | |
DHI | Revenue | −1.8% | +5.8% | +6.1% |
| EPS | −10.5% | +12.3% | +16.8% | |
LEN | Revenue | −2.9% | +3.4% | +8.6% |
| EPS | −25.8% | +21.8% | +22.3% | |
TMHC | Revenue | −16.2% | +7.7% | — |
| EPS | −32.1% | +23.5% | — | |
TPH | Revenue | −11.9% | +7.7% | +96.9% |
| EPS | −31.5% | +21.3% | +249.2% |
Forward fiscal years only. Blank means no analyst coverage for that year.
Green Brick Partners, which entitles and develops most of the lots it builds on in Dallas-Fort Worth, metropolitan Atlanta and Florida's Treasure Coast, told investors its homebuilding gross margin reached 29.8% in the June quarter, the highest among public homebuilding peers by its own reckoning and more than eleven percentage points above the 18.4% peer average. Net new orders rose 19% to 1,079 homes, and the shares fell 10.3% in the month to 9 October anyway.
The shelf of regional builders has been traded as one position all year, priced off the cost of buying a buyer's monthly payment down from a 30-year fixed rate Freddie Mac put at 7.40% on 8 October. The gross margin lines refuse to cooperate with that reading. What separates these companies is not how hard they discount but when they bought the ground.
The spread was earned years before the rate moved
Green Brick owned 76% of roughly 52,000 lot positions at the end of June and uses no land bankers at all. Its annual gross margin has run 29.75% in 2021, 30.84% in 2023, 33.52% in 2024 and 31.16% in 2025 — a band that barely notices the rate cycle, because the profit was set at wholesale land prices years earlier. The company employs 620 people against Meritage's 1,860.
"One of the primary differentiators from many of our peers is that we do not engage in high interest cost land banking relationships that can distort a builder's economic leverage and risk and that can give a land banker indirect control over a builder's lot purchase timing," co-founder and chief executive James Brickman said on the second-quarter call. Chief financial officer Jeff Cox attributed the roughly 90 basis points of sequential improvement to the entry-level Trophy Signature Homes brand taking a larger share of sales.
What a rented lot costs at closing
Dream Finders Homes, which builds for first-time and move-up buyers from Jacksonville to Denver and originates mortgages for sale to PrimeLending, is the structure Brickman described. Its homebuilding gross margin fell to 14.2% from 16.5%, which the company attributed primarily to higher land and financing costs, while average sales price per home closed dropped 8.9% to $438,171.
Demand was not the problem: net new orders rose 15% to a second-quarter record 2,232. The company's own filing says operating margins "depend heavily on the need for continued mortgage buydowns via forward commitments", and its controlled lot pipeline shrank to 54,091 from 63,121 at the end of 2025 as options went unexercised.
Meritage Homes, the spec builder of the group, sits between the two: home closing gross margin of 18.3% against 21.1%, orders down 9% as a 19% slower absorption pace outran a 14% larger community count, cancellations at 13% from 10%, and full-year volume guided about 5% below 2025 with a warning that revenue could fall further "if market conditions require higher incentives."
One group, two verdicts
The selling was indiscriminate but the businesses were not. Dream Finders closed at $9.38 on 9 October, down 29.1% in a month and the lowest in the price record available; consensus has its 2026 earnings halving to $1.07 a share and falling again in 2027, its forward price-to-earnings of 8.8x sits above a trailing 5.9x, and it is closing an all-cash purchase of Beazer Homes at about $2.2bn. That de-rating is the results, not a mispricing. D.R. Horton fell 3.4% over the same month and Lennar 5.8%.
Green Brick is the one the numbers do not explain. At $62.86 it trades on 9.4x trailing earnings and 1.37x book, against 0.54x book at Dream Finders, and sits 21% above its own two-and-a-half-year low while its margin lead widened. Nothing company-specific landed in the window.
Both companies report third-quarter results after the close on 28 October, the land developer and the spec builder on the same day. One of them will have to say what it paid to sell a house; the other will say what it was paid for the land.