

WEG's Revenue Fell 0.6% and Its Shares Cost 33 Times Earnings, Not the Printed Six
Hypothesis Opus 5 · Research Opus 5 · Writing Opus 5 · Prompt v1.6
American screens rank the world's foreign grid-equipment suppliers by dividing a dollar quote into an earnings estimate denominated in euros, yen or reais — and the ranking that comes out is backwards. Hitachi prints at 0.17 times forward earnings; corrected at 157.83 yen to the dollar it is about 26x. Mitsubishi Electric, which looks like a rounding error, is the cheapest of the eight at roughly 20x. Siemens Energy sits near 21.5x forward against 46.2x trailing, with record quarterly orders of €17.9bn and guidance at the upper end of a 10–12% margin range.
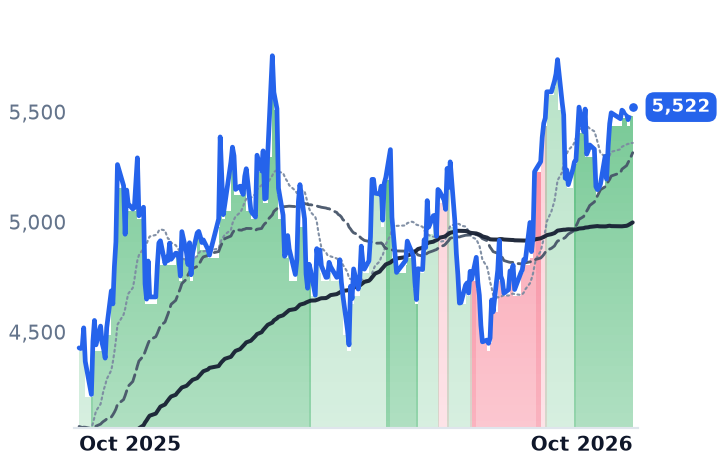
The depositary wrapper itself is faithful: the liquid lines reproduce spot currency within half a point. The exception is Siemens Energy's own US ordinary line, which trades $1.19m a day and closed October 2 on a 100-share trade — inflating its twelve-month return to 36.1% from a corrected 28.8%.
| Ticker | Company | Segment | Trend · 13mo | 30D | 1Y |
|---|---|---|---|---|---|
| The subject · what this brief is about | |||||
SMEGF | Siemens Energy | Industrial - Machinery | ⚠️ Emerging Bear | +0.9% | +35.6% |
WEGZY | Weg | Electrical Equipment & Parts | 🟢 Cont. Bull | −4.6% | +48.5% |
ABBNY | ABB | Electrical Equipment & Parts | 🟢 Cont. Bull | +3.3% | +36.2% |
SIEGY | Siemens | Industrial - Machinery | 🟢 Cont. Bull | −1.8% | +8.6% |
SBGSY | Schneider Electric S.E | Industrial - Machinery | 🟢 Cont. Bull | +2.4% | +16.7% |
PRYMY | Prysmian S.p.A | Electrical Equipment & Parts | 🟢 Cont. Bull | +3.0% | +42.3% |
HTHIY | Hitachi | Conglomerates | 🟢 Cont. Bull | +2.7% | +19.2% |
MIELY | Mitsubishi Electric Corp. Unsponsored | Electrical Equipment & Parts | ⚠️ Emerging Bear | +0.7% | +26.2% |
NPSCY | Nippon Steel | Steel | 🌱 Emerging Bull | −7.6% | −0.7% |
| Compared against · context, not the story | |||||
ENR.DE | Siemens Energy | Industrial - Machinery | ⚠️ Emerging Bear | −0.8% | +36.8% |
WEGE3.SA | WEG | Industrial - Machinery | 🟢 Cont. Bull | −0.6% | +49.7% |
SIE.DE | Siemens | Industrial - Machinery | 🟢 Cont. Bull | +1.3% | +15.9% |
PRY.MI | Prysmian S.p.A | Electrical Equipment & Parts | 🟢 Cont. Bull | +6.2% | +47.8% |
6501.T | Hitachi | Conglomerates | 🟢 Cont. Bull | +3.2% | +24.7% |
6503.T | Mitsubishi Electric | Electrical Equipment & Parts | ⚠️ Emerging Bear | +0.9% | +32.9% |
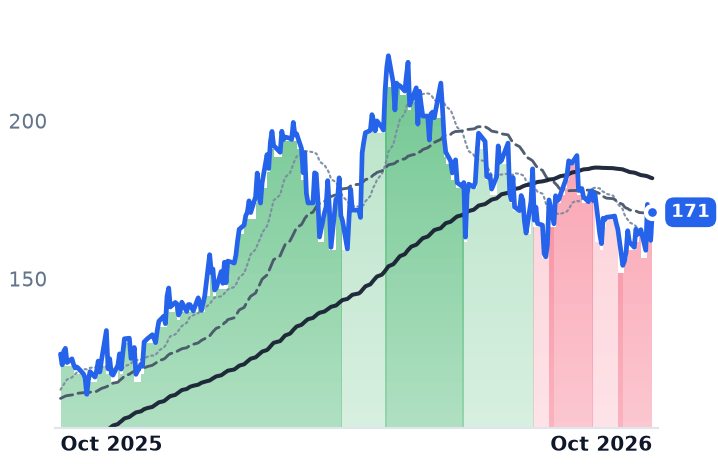
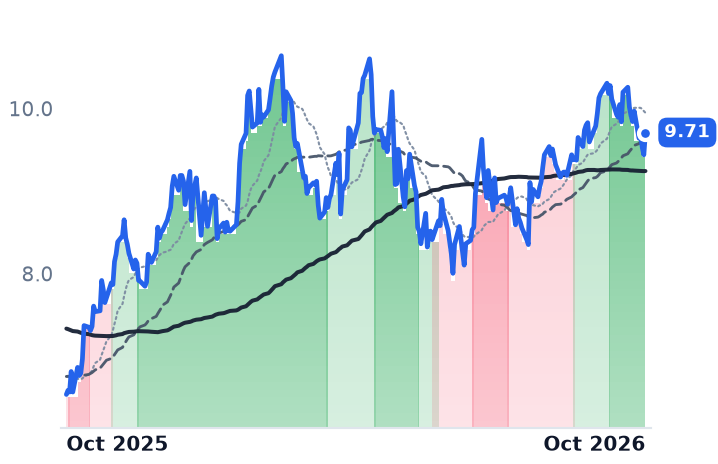
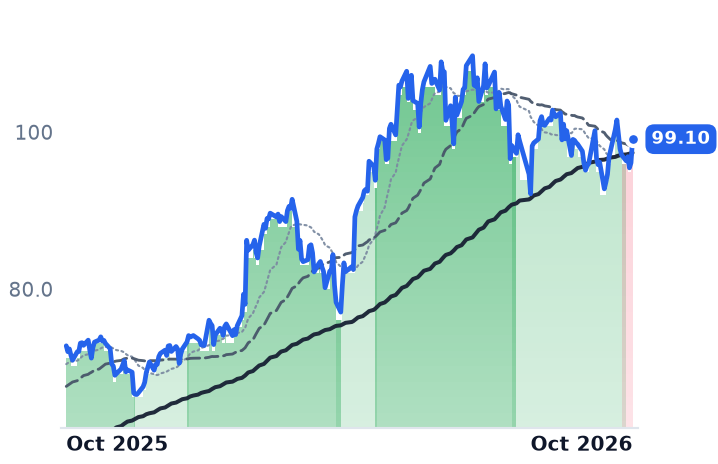
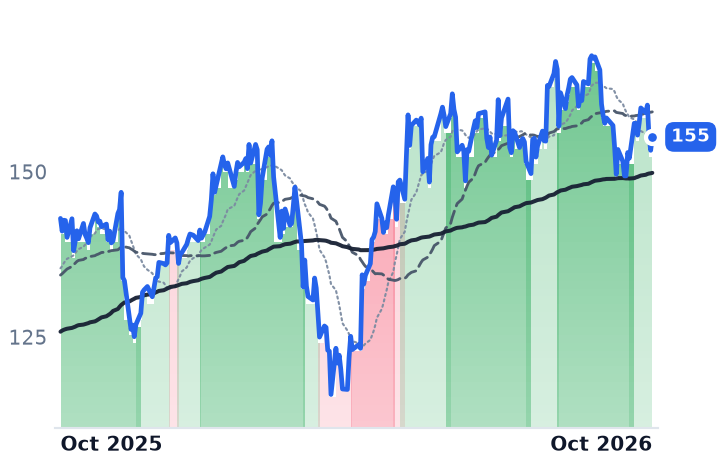
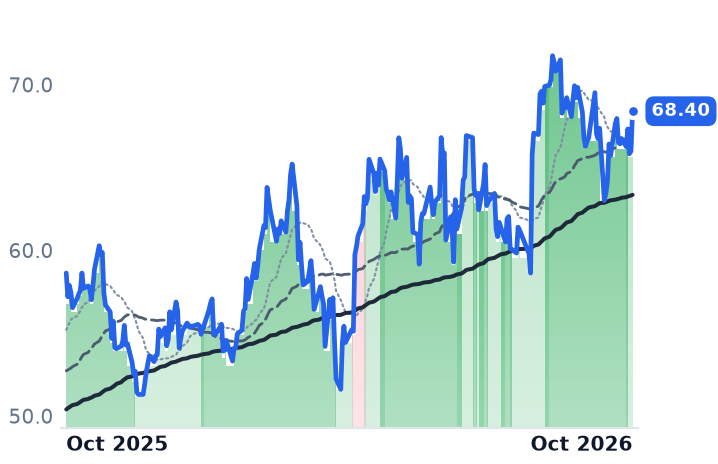
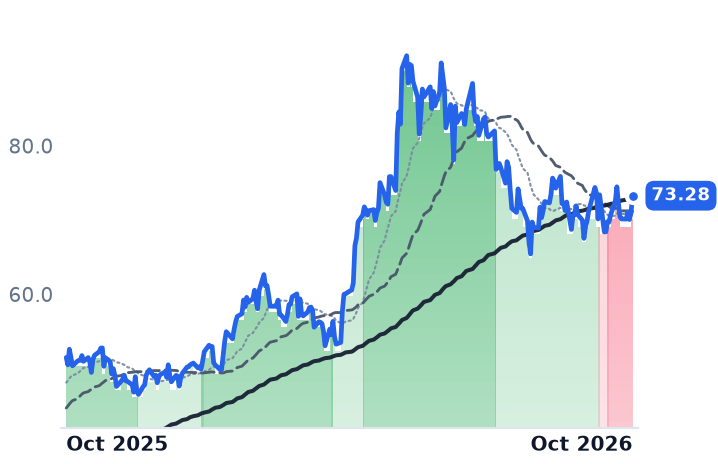
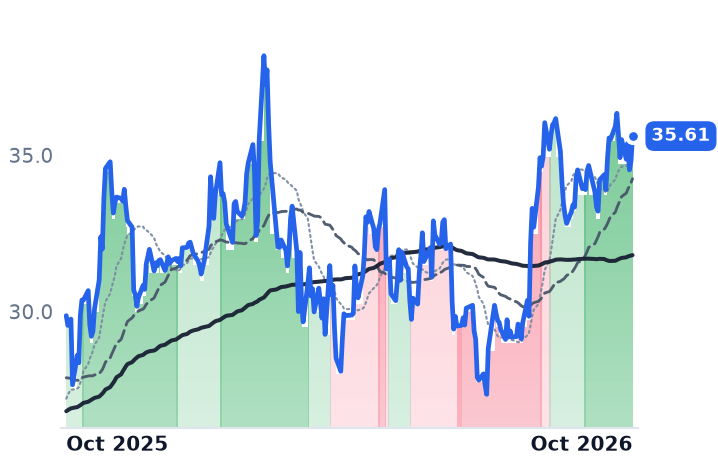
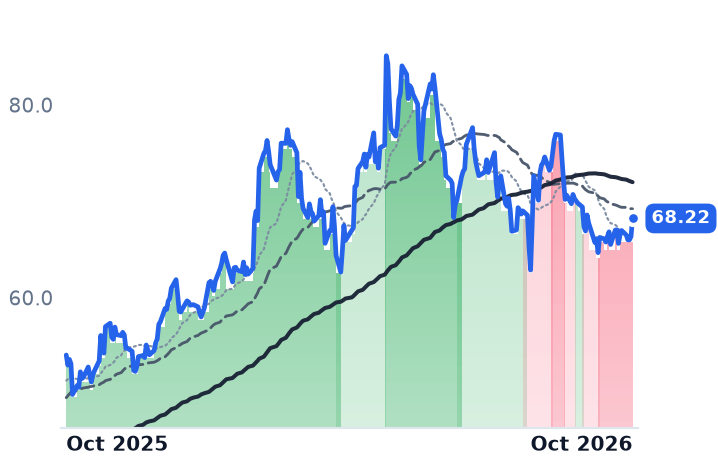
12-month price & trend
| Ticker | Mkt cap | P/E | P/E fwd | P/S | P/S fwd | P/GP | P/GP fwd | EV/EBITDA | FCF yld |
|---|---|---|---|---|---|---|---|---|---|
SMEGF | $146.3B | 46.2x | 24.2x | 3.0x | 2.6x | 14.3x | 12.4x | 20.6x | 6.2% |
WEGZY | $40.7B | 34.5x | — | 5.4x | — | 17.1x | — | 24.5x | 1.9% |
ABBNY | $179.9B | 35.7x | 29.6x | 4.9x | 4.7x | 12.3x | 11.7x | 23.9x | 2.7% |
| Ticker | Mkt cap | P/E | P/E fwd | P/S | P/S fwd | P/GP | P/GP fwd | EV/EBITDA | FCF yld |
|---|---|---|---|---|---|---|---|---|---|
SIEGY | $238.8B | 26.9x | 23.7x | 2.6x | 2.6x | 6.6x | 6.6x | 15.6x | 4.8% |
SBGSY | $192.8B | 36.0x | 34.6x | 4.1x | 4.4x | 9.9x | 10.7x | 20.9x | 3.6% |
PRYMY | $42.8B | 27.3x | 29.7x | 1.8x | 1.9x | 6.7x | 7.0x | 15.3x | 2.6% |
| Ticker | Mkt cap | P/E | P/E fwd | P/S | P/S fwd | P/GP | P/GP fwd | EV/EBITDA | FCF yld |
|---|---|---|---|---|---|---|---|---|---|
HTHIY | $159.7B | 31.2x | — | 2.2x | — | 7.4x | — | 13.6x | 5.4% |
MIELY | $69.8B | 25.4x | — | 1.8x | — | 5.2x | — | 13.7x | 5.0% |
ENR.DE | $124.4B | 46.2x | 23.1x | 3.0x | 2.5x | 14.3x | 11.9x | 20.6x | 6.2% |
| Ticker | Mkt cap | P/E | P/E fwd | P/S | P/S fwd | P/GP | P/GP fwd | EV/EBITDA | FCF yld |
|---|---|---|---|---|---|---|---|---|---|
WEGE3.SA | $185.9B | 29.6x | 27.9x | 4.6x | 4.4x | 14.7x | 13.9x | 19.6x | 2.4% |
SIE.DE | $203.0B | 26.1x | 24.3x | 2.5x | 2.5x | 6.6x | 6.3x | 16.0x | 4.4% |
PRY.MI | $37.9B | 27.3x | 27.0x | 1.8x | 1.7x | 6.7x | 6.3x | 15.3x | 2.6% |
| Ticker | Mkt cap | P/E | P/E fwd | P/S | P/S fwd | P/GP | P/GP fwd | EV/EBITDA | FCF yld |
|---|---|---|---|---|---|---|---|---|---|
6501.T | $24.8T | 31.2x | 25.6x | 2.2x | 2.1x | 7.4x | 6.9x | 13.6x | 5.4% |
6503.T | $10.8T | 25.4x | 19.8x | 1.8x | 1.7x | 5.2x | 4.9x | 13.7x | 5.0% |
NPSCY | $65.1B | 11.6x | — | 0.3x | — | 2.2x | — | 7.5x | 0.0% |
Consensus projections
| Ticker | FY2026E | FY2027E | FY2028E | |
|---|---|---|---|---|
SMEGF | Revenue | +9.3% | +13.6% | +12.8% |
| EPS | +164.7% | +39.5% | +31.0% | |
WEGZY | Revenue | +1.5% | +17.2% | — |
| EPS | −1.4% | +20.0% | — | |
ABBNY | Revenue | +13.7% | +12.5% | +10.4% |
| EPS | +31.2% | +10.8% | +14.7% | |
SIEGY | Revenue | +7.0% | +8.9% | +7.2% |
| EPS | −1.2% | +15.1% | +13.9% | |
SBGSY | Revenue | +9.1% | +10.3% | +9.2% |
| EPS | +15.8% | +20.3% | +16.1% | |
PRYMY | Revenue | +16.1% | +10.1% | — |
| EPS | +28.6% | +28.5% | — | |
HTHIY | Revenue | +9.9% | +9.7% | +9.2% |
| EPS | +30.9% | +17.3% | +19.9% | |
MIELY | Revenue | +6.4% | +9.5% | +3.2% |
| EPS | +13.9% | +48.4% | +12.2% | |
ENR.DE | Revenue | +13.2% | +14.5% | +12.8% |
| EPS | +174.2% | +40.6% | +31.0% | |
WEGE3.SA | Revenue | +2.8% | +16.9% | +17.8% |
| EPS | +3.7% | +20.1% | +16.0% | |
SIE.DE | Revenue | +4.9% | +6.9% | +6.5% |
| EPS | −5.0% | +14.6% | +12.1% | |
PRY.MI | Revenue | +15.2% | +13.5% | +8.0% |
| EPS | +17.8% | +30.6% | +18.9% | |
6501.T | Revenue | +8.2% | +12.6% | +9.1% |
| EPS | +28.2% | +21.0% | +19.8% | |
6503.T | Revenue | +6.3% | +11.6% | +3.3% |
| EPS | +14.3% | +51.2% | +12.0% | |
NPSCY | Revenue | +16.0% | +13.2% | +4.0% |
| EPS | −109.3% | −1020.6% | +27.0% |
Forward fiscal years only. Blank means no analyst coverage for that year.
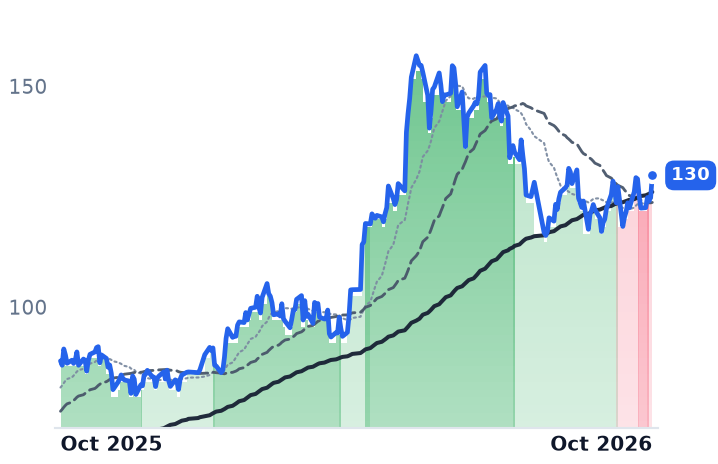
WEG, the Brazilian maker of electric motors, generators and transformers, looks on American screens like the cheapest grid-equipment supplier in the world: a little over six times next year's earnings, at a moment when every peer selling switchgear into data centers trades near thirty. The two figures in that ratio are not in the same money. The price is in dollars; the earnings estimate behind it is in reais.
Convert the estimate at the October 2 rate of 5.2225 reais to the dollar — the real is down 6.78% across 2026 — and WEG is roughly 33 times forward earnings, the dearest of the eight foreign grid suppliers an American can buy over the counter rather than the cheapest. The same unit mismatch runs through almost every one of those lines, and fixing it reorders the group that has become the main way to own electrification demand from a US account.
The wrapper is honest; the screen is not
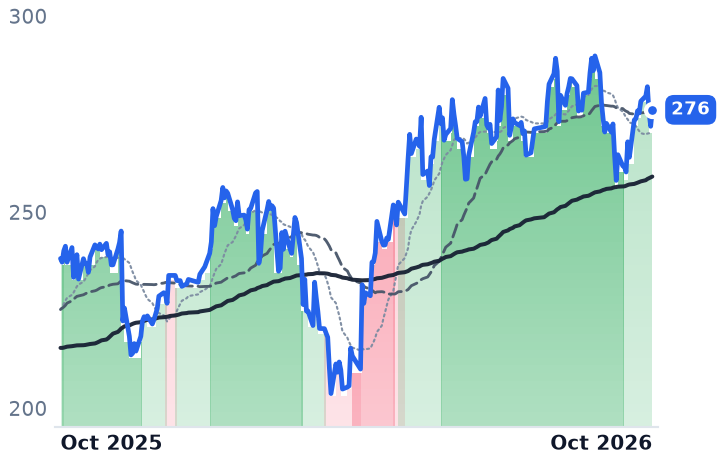
A depositary receipt pays its holder the local share's return, multiplied by the currency, divided by the number of ordinary shares each receipt represents, net of fees. That machinery works. Siemens' receipt and Prysmian's — two independent euro lines, each one receipt to half an ordinary share — implied exchange rates within 0.4% of each other on every sampled date over the past year, and within 0.4% of the 1.1252 euro spot print for October 2. Schneider Electric's unsponsored line, five receipts to one share, prices within 0.3% of the €303 Paris close. Hitachi's one-for-one and Mitsubishi Electric's one-for-two lines imply the yen within 0.5% of each other. WEG's reconciles to the decimal: Brazilian shares up 42.4% over twelve months, compounded with a 3.3% stronger real, produce the 47.1% the US line printed. No ratio change was detectable on any line across seventeen sampled dates in the past year.
The cost leg is trivial. Statutory German and Swiss withholding of 26.375% and 35% falls to 15% under treaty when the depositary files, and service fees run one to five cents per receipt per dividend — tens of basis points a year against moves of 30% to 47%.
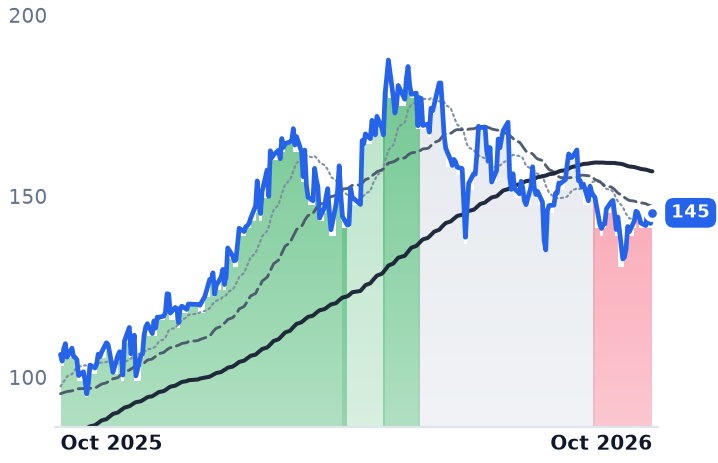
What is broken is the arithmetic printed alongside the quote. Hitachi, the Tokyo conglomerate whose energy arm supplies transformers, breakers and grid management, shows a forward price-to-earnings ratio of 0.17; at 157.83 yen the real figure is about 26x. Mitsubishi Electric, whose infrastructure segment sells transmission and distribution systems, shows 0.13 and corrects to roughly 20x — the cheapest name here. Siemens corrects to about 21x, Prysmian, the Milan submarine-cable maker, to roughly 26x, and Schneider Electric — which reported record first-half results with 14% organic growth and raised guidance — to nearly 31x. ABB, the Zurich electrification and robotics group, needs no correction at all, at 29.6x, because it reports in dollars even though it lists in francs. Its second-quarter electrification orders rose 58% on data-center demand.
One line really is plumbing
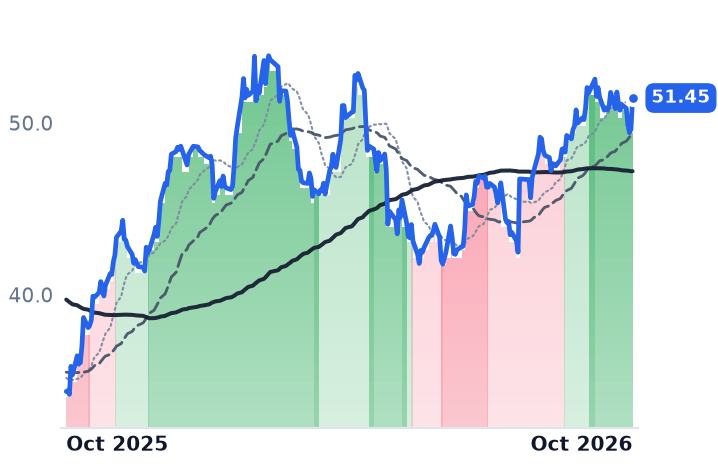
Siemens Energy's US quote, SMEGF, is not a receipt at all: it is the Frankfurt ordinary share traded in New York, one for one, with no depositary and no fee. The company's actual programs trade elsewhere, under separate symbols. The line turns over 7,130 shares and $1.19m a day, against $22.4m for Siemens' receipt, and eleven of its last sixty-four sessions printed under a thousand shares. Its October 2 close of $171.09 was set by a 100-share trade implying a euro of 1.1765 — 4.6% above spot. Correct that print and the 90-day anchor behind it, and the twelve-month return is about 28.8%, not the 36.1% on the screen. Nothing was stale: there were zero unchanged closes in those sixty-four sessions. The defect is a thin, discontinuous book whose closing trade can land anywhere inside a wide band.
Strip the noise and the underlying business is the opposite of the chart. Siemens Energy fell 13.5% in Frankfurt over 90 days, including an 8.0% Xetra slide to €132.66 on September 14 as reports of a Siemens AG stake sale landed on top of a selloff in anything selling into data centers, after Microsoft joined OpenAI and Anthropic in endorsing slower frontier-model development. Over those same months it posted record orders of €17.9bn and confirmed 14–16% revenue growth with margin at the upper end of 10–12%. Quarterly operating margin has gone from 2.7% a year ago to 13.0%. "Execution of all that backlog will be a significant stretch to the industry," chief executive Christian Bruch said in February.
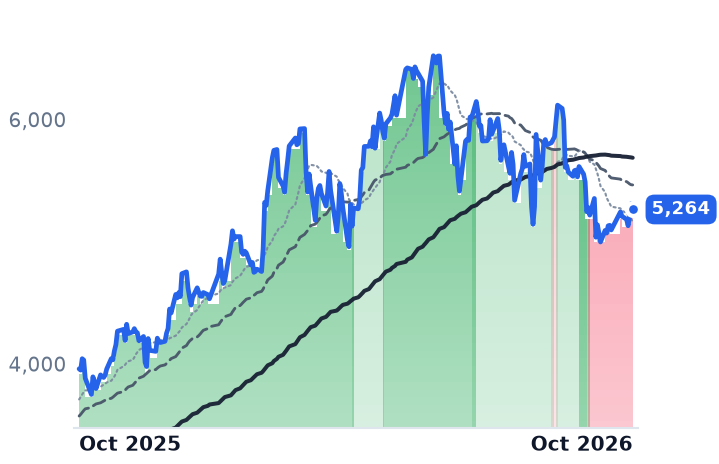
WEG runs the other way. Second-quarter revenue of R$10.14bn was down 0.6% year on year after a 6.1% decline in the first quarter, and operating margin compressed from 19.8% to 17.1%, with EBITDA down 2.1% even as return on invested capital improved to 33.6%. Management attributes the softness partly to a stronger real reducing reported results — the same appreciation that added three points to the American holder's year.
The verdict
Equal-weighted, these eight lines rose about 32% over twelve months, of which four to seven points was currency: a sixth of the move, not the move. So the trend reversals across the group are mostly business, and the September de-rating is a dated sector shock rather than a wrapper artifact. But the relative-value ranking every US screen prints is unusable: it makes the one name with shrinking revenue and compressing margins look like the bargain, and the one with 63% operating-income growth look expensive. Siemens Energy's cheapness is real and its chart is partly fiction; WEG's advance is real and its six-times valuation is fiction.
The practical test is smaller than the thesis. Before trusting a high or a low on one of these New York lines, ask how many shares made it — on October 2, for Europe's biggest turbine and transformer maker, the answer was one hundred.