

Las Vegas Sands Revenue Fell 0.7% While Hilton Grand Vacations' Tours Rose 6%
Hypothesis Opus 5 · Research Opus 5 · Writing Opus 5 · Prompt v1.6
Four corners of the travel trade were sold off together this month — casinos, timeshares, corporate booking software, aircraft parts — and only one of them can point to a customer who stopped spending. Macau's gross gaming revenue fell for a third consecutive month in August, and Las Vegas Sands' operating income dropped 22.8% in the June quarter.
Everywhere else the operating meters went the other way. Hilton Grand Vacations put 239,000 people through sales tours, a fourth straight quarter of growth, with delinquencies described as stable or improving. Navan's platform bookings grew 45% to more than $3bn and it raised annual guidance for the second time. AAR's aftermarket revenue rose 19% in its fiscal year. The likelier reading is the price of money — a 5.17% ten-year Treasury note, the highest since 2007 — repricing long-duration cyclicals, alongside jet fuel at roughly double pre-war levels.
| Ticker | Company | Segment | Trend · 13mo | 30D | 1Y |
|---|---|---|---|---|---|
HGV | Hilton Grand Vacations | Vacation Ownership & Timeshares | ⚠️ Emerging Bear | −20.3% | −17.8% |
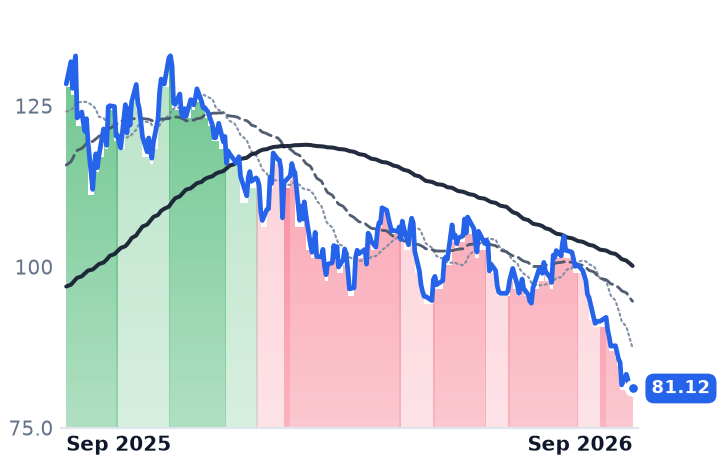
LVS | Las Vegas Sands | Integrated Resorts | 🔴 Cont. Bear | −14.7% | −26.7% |
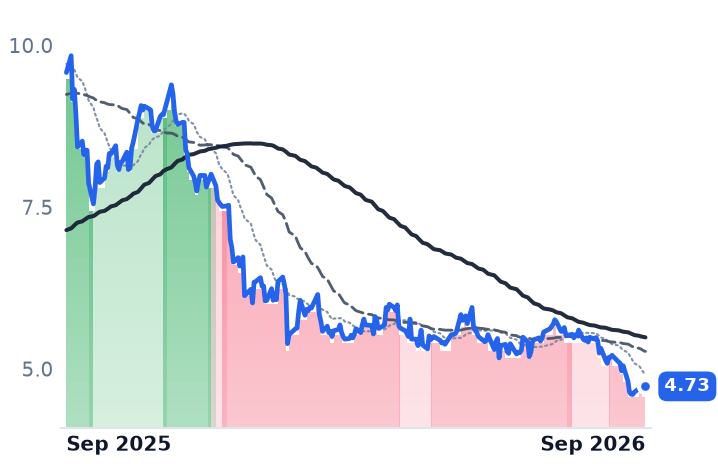
NAVN | Navan | Business Travel & Expense | 🟢 Cont. Bull | −35.0% | −2.9% |
GBTG | Global Business Travel | Business Travel & Expense | 🟢 Cont. Bull | +0.4% | +16.7% |
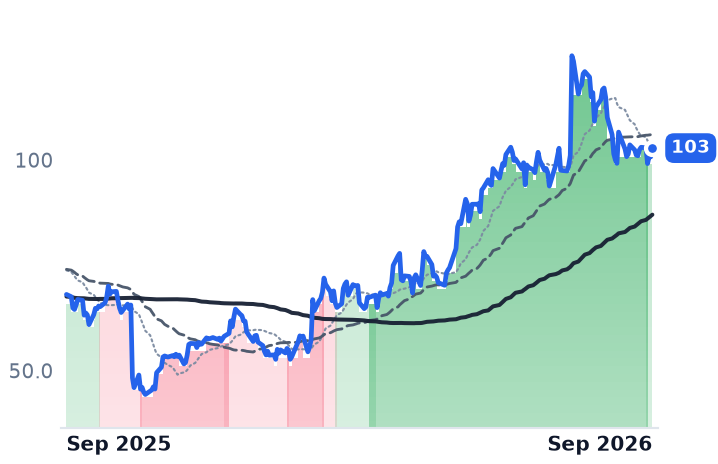
AIR | AAR | Aftermarket & MRO Services | 🟢 Cont. Bull | −14.7% | +34.5% |
VSEC | VSE | Aftermarket & MRO Services | 🟢 Cont. Bull | −18.5% | +10.1% |
SPY | State Street SPDR S&P 500 ETF Trust | Asset Management | 🟢 Cont. Bull | +0.1% | +17.2% |
MGM | MGM Resorts International | Integrated Resorts | 🟢 Cont. Bull | −24.7% | −8.5% |
WYNN | Wynn Resorts | Integrated Resorts | 🔴 Cont. Bear | −15.3% | −36.8% |
MLCO | Melco Resorts & Entertainment | Integrated Resorts | 🔴 Cont. Bear | −9.8% | −50.6% |
VAC | Marriott Vacations Worldwide | Vacation Ownership & Timeshares | 🟢 Cont. Bull | −10.5% | +51.0% |
12-month price & trend
| Ticker | Mkt cap | P/E | P/E fwd | P/S | P/S fwd | P/GP | P/GP fwd | EV/EBITDA | FCF yld |
|---|---|---|---|---|---|---|---|---|---|
HGV | $2.8B | 16.6x | 7.4x | 0.5x | 0.5x | 0.8x | 0.8x | 8.0x | 15.0% |
LVS | $25.3B | 15.1x | 12.6x | 1.8x | 1.8x | 3.6x | 3.6x | 8.0x | 11.0% |
NAVN | $4.6B | n/m | 74.0x | 5.6x | 5.0x | 7.7x | 6.9x | n/m | 0.9% |
| Ticker | Mkt cap | P/E | P/E fwd | P/S | P/S fwd | P/GP | P/GP fwd | EV/EBITDA | FCF yld |
|---|---|---|---|---|---|---|---|---|---|
GBTG | $5.0B | 59.4x | 41.3x | 1.6x | 1.5x | 2.7x | 2.5x | 17.1x | 2.1% |
AIR | $4.6B | 23.8x | 20.2x | 1.4x | 1.3x | 7.4x | 6.7x | 14.1x | 1.1% |
VSEC | $5.1B | 65.7x | 26.6x | 3.7x | 2.8x | 26.7x | 20.0x | 34.0x | -0.0% |
| Ticker | Mkt cap | P/E | P/E fwd | P/S | P/S fwd | P/GP | P/GP fwd | EV/EBITDA | FCF yld |
|---|---|---|---|---|---|---|---|---|---|
SPY | $773.0B | — | — | — | — | — | — | — | — |
MGM | $9.5B | 51.8x | 20.5x | 0.5x | 0.5x | 1.2x | 1.2x | 23.0x | 18.3% |
WYNN | $9.9B | 26.2x | 20.0x | 1.4x | 1.3x | 3.7x | 3.6x | 11.5x | 7.0% |
| Ticker | Mkt cap | P/E | P/E fwd | P/S | P/S fwd | P/GP | P/GP fwd | EV/EBITDA | FCF yld |
|---|---|---|---|---|---|---|---|---|---|
MLCO | $2.1B | 9.3x | 9.9x | 0.4x | 0.4x | 1.2x | 1.2x | 6.8x | 0.0% |
VAC | $2.4B | n/m | 9.6x | 0.5x | 0.5x | 2.0x | 1.7x | n/m | -1.4% |
Consensus projections
| Ticker | FY2026E | FY2027E | FY2028E | |
|---|---|---|---|---|
HGV | Revenue | +5.9% | +4.4% | +2.2% |
| EPS | +104.4% | +8.7% | +31.5% | |
LVS | Revenue | +8.8% | +5.1% | +3.8% |
| EPS | +6.1% | +13.2% | +5.0% | |
NAVN | Revenue | +12.1% | +35.6% | +24.0% |
| EPS | −94.4% | −215.0% | +52.3% | |
GBTG | Revenue | +25.0% | +10.1% | −5.1% |
| EPS | −9.4% | +108.7% | −16.7% | |
AIR | Revenue | +20.4% | +11.9% | +7.1% |
| EPS | +30.9% | +17.3% | +14.0% | |
VSEC | Revenue | +64.6% | +21.4% | +8.4% |
| EPS | +87.1% | +18.1% | +13.0% | |
MGM | Revenue | +1.5% | +1.4% | +2.5% |
| EPS | −29.1% | +19.8% | +32.2% | |
WYNN | Revenue | +5.1% | +3.8% | +4.1% |
| EPS | +8.1% | +12.3% | +16.5% | |
MLCO | Revenue | +3.6% | +4.5% | +4.2% |
| EPS | +28.3% | +30.0% | +32.6% | |
VAC | Revenue | +4.1% | +2.6% | +1.1% |
| EPS | +8.9% | +12.0% | +2.4% |
Forward fiscal years only. Blank means no analyst coverage for that year.
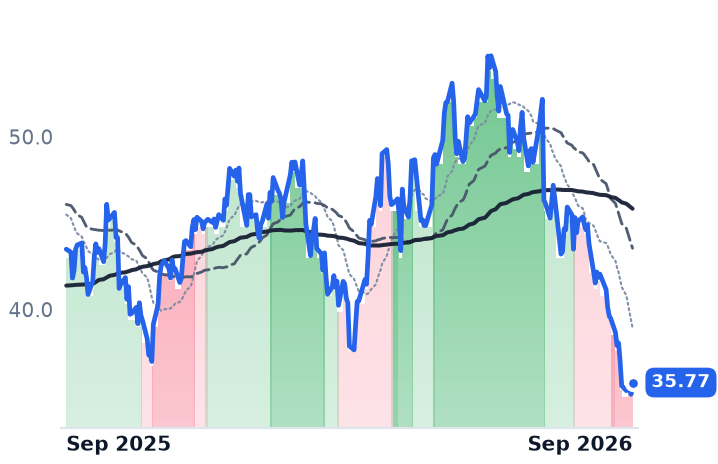
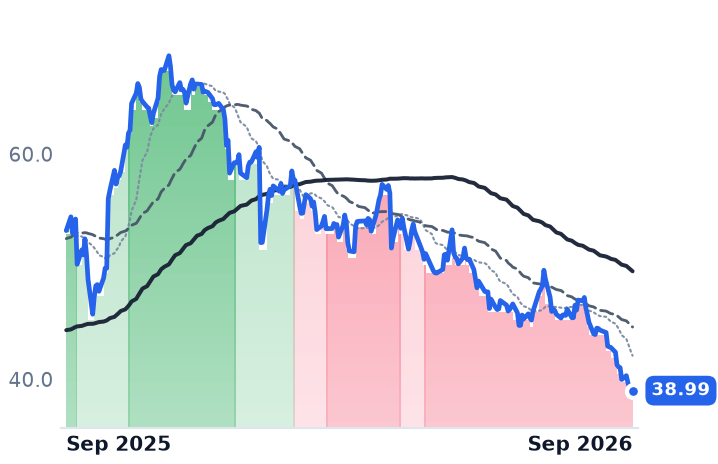
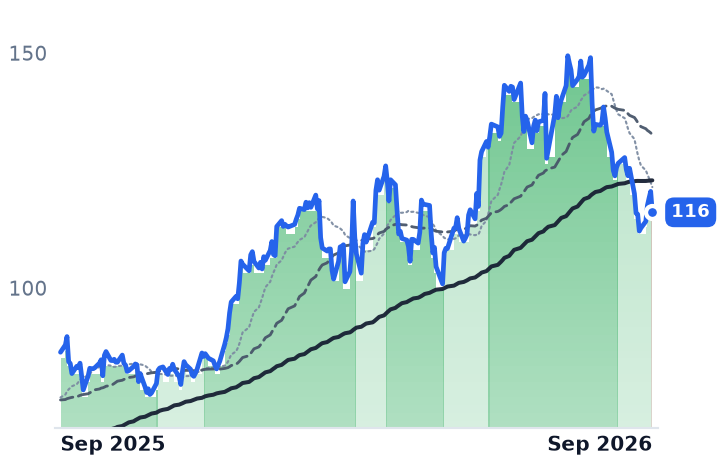
Hilton Grand Vacations sells timeshare weeks and then lends most buyers the purchase price, which makes it half resort developer and half consumer finance company. In the June quarter it ran 239,000 sales tours, up 6% and the fourth consecutive quarter of tour growth. Its shares have lost a third of their value since late June.
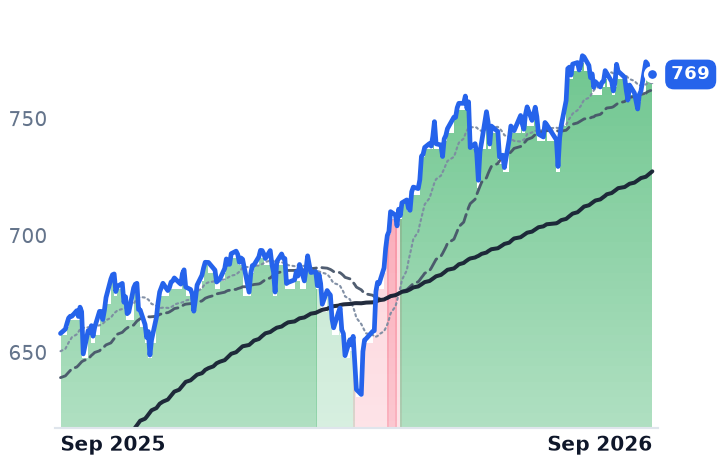
That pairing is the shape of the whole travel complex. Over the thirty days to September 25, casino, timeshare and aircraft-parts shares fell between 12% and 25% — MGM 24.9%, Hilton Grand Vacations 20.3%, Wynn 17.8%, Las Vegas Sands 17.5% — while the S&P 500 tracking fund rose 0.8%. These businesses are paid in incompatible ways for the same trip: per financed timeshare interval, per booked transaction, per unit of gaming win. Read one meter at a time, and only one of them shows a customer walking away.
Per interval: the credit line has not cracked
Hilton Grand Vacations' honest top line is contract sales, and they slipped $24m to $810m against the June 2025 quarter — with tours up 6.1% and volume per guest down 8.6%. That is a price-per-tour problem. "[S]ales execution fell short of our expectation, which weighed on overall sales productivity," chief executive Mark Wang told investors on the July 30 call, pointing at high-volume Bluegreen locations in Orlando and Myrtle Beach. Management trimmed full-year volume-per-guest guidance to a low-to-mid single-digit decline, from flat to slightly down, and missed on adjusted EBITDA, $265m against $291m expected.
The credit book, where a genuine consumer break would show first, did not cooperate with the bear case. The loan-loss provision ran near 17% of contract sales, the high end of the mid-teens target, but the company attributed it to a higher borrowing propensity and more trust-product mix, with delinquencies stable or improving at Bluegreen after underwriting changes. Shares trade at 8.0 times trailing earnings before interest, taxes, depreciation and amortization, a 15% trailing free-cash-flow yield, and 16.6 times trailing earnings against 7.4 times forward — a forward figure resting on consensus 2026 earnings of $4.85 a share versus $0.89 actually reported in 2025. What the company does pay for directly is the rate: it securitizes its own receivables, and the ten-year Treasury note closed September 25 at 5.17%, its highest since June 2007, with swaps pricing three more quarter-point increases.
Per transaction: volumes grew and the loss grew faster
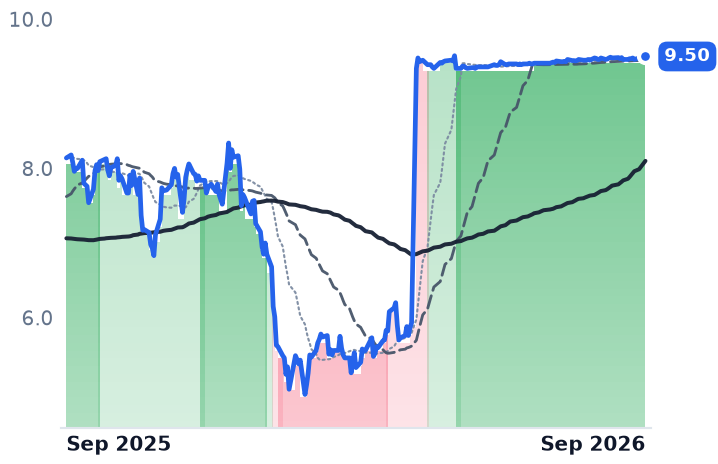
The supposed collapse in corporate-travel software is one stock. Global Business Travel Group has been pinned in a 1.2% range since July because it sits under a definitive all-cash merger at $9.50 a share with Long Lake Management agreed May 4; its June-quarter transactions grew 45% with 95% customer retention.
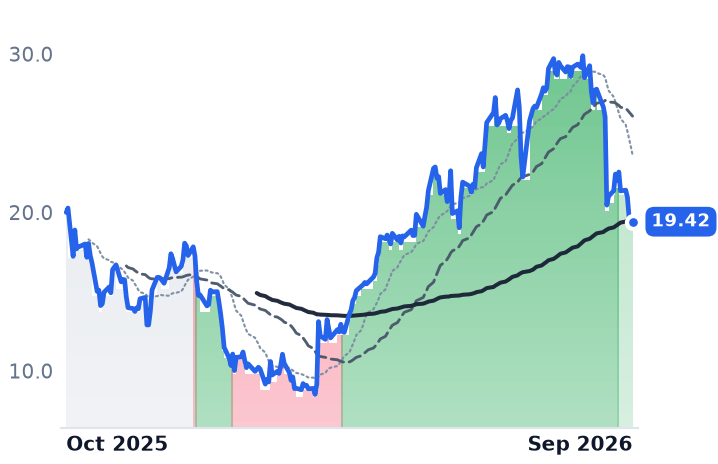
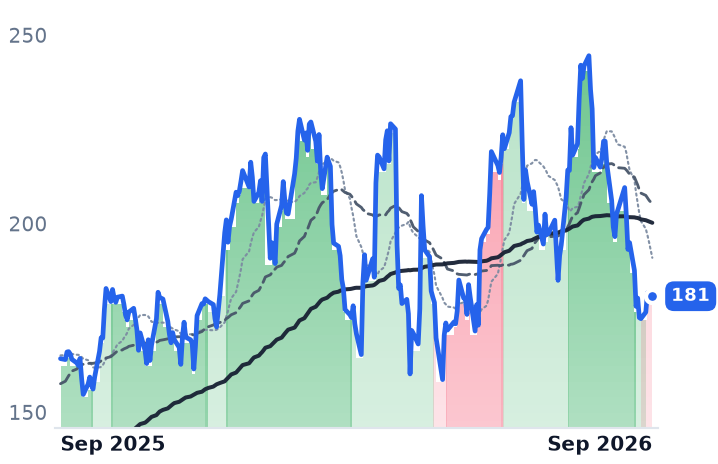
The 33.6% faller is Navan, which sells artificial-intelligence-driven travel and expense software to corporate finance departments. "This quarter, total GBV, this is travel bookings on the platform, grew by 45% year-over-year to more than $3 billion," chief executive Ariel Cohen said on the September 9 call, adding that requests for proposals had tripled year on year in the first half. Revenue rose 35.4% to $232.8m, guidance went up for the second time, to $927–933m for the year — and the operating loss widened to $27.6m from $12.3m as costs outran the revenue beat. At about 5.0 times forward sales against 5.6 trailing, that is a margin verdict on a growing book of trips.
Per unit of win: the one real deceleration
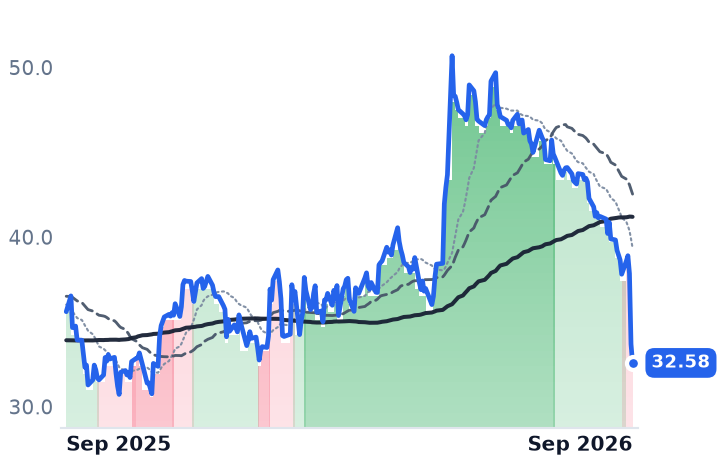
Las Vegas Sands is the exception. Revenue fell 0.7% in the June quarter after four quarters of 24–26% growth, operating income dropped 22.8%, and the market it is paid by has turned: Macau gross gaming revenue fell 1.2% in August, a third straight monthly decline. Even here the quarter was partly luck — Sands China's mass gaming revenue grew 8% against a 4% market, and Macau earnings were dented by a record-low 1.35% VIP hold worth roughly $87m while rolling volumes rose 73%. "[T]he customers are there and the productivity is there if the product is right," chief executive Patrick Dumont said on the July 22 call, reaffirming a $700m quarterly Macau earnings target. Sell-side estimates have started to follow the regulator's prints down: Morgan Stanley cut its 2026 Macau forecast and Citi looks for September down about 2%, while consensus still carries 8.8% revenue growth for the year. At 15.1 times trailing earnings and 12.6 forward, most of that de-rating is done.
The parts business says seats are still full
If trips were disappearing, aircraft maintenance would show it first. AAR, which distributes aerospace parts and performs airframe and landing-gear overhauls, grew fiscal 2026 revenue 19.0% to $3.31bn with a 23.0% final quarter, and its decline is characterized as a valuation reset rather than deteriorating fundamentals — 20.2 times forward earnings against 23.8 trailing. VSE, the aviation-parts distributor and repair shop, grew June-quarter revenue 65.0% with gross margin up to 17.0% from 11.4%, and had the most multiple to surrender: 65.7 times trailing earnings compressing to 26.6 forward. Neither company's revenue estimates were cut during the slide. The threat to them is forward flight hours, priced by fuel: jet fuel near $4.56 a gallon is roughly double its pre-war level with the Strait of Hormuz effectively shut, and United alone guides to about $6bn of extra fuel cost this year.
What the businesses earn and what they do not
One of these five sell-offs is earned by the operating record. Las Vegas Sands is falling because the monthly number it is publicly graded against is going down, and a third of its profit shortfall was hold rather than volume. The other four fell while volumes compounded, credit held and guidance went up rather than down — which points at the discount rate on long-dated cyclical cash flow, and at a fuel bill that raises the price of every trip without yet reducing the number of them. For Hilton Grand Vacations, that rate is not an abstraction but the cost of funding its own receivables; for AAR and VSE it is simply the arithmetic of a high multiple meeting a 5% ten-year.
Macau publishes its September gaming revenue in the first days of October. It is the only meter in this group that can validate the market's verdict on schedule; the rest are waiting on the bond market to say something different.