

FS KKR Wrote Its Book Down for a Tenth Quarter; Capital Southwest's Held at $16.61
Hypothesis Opus 5 · Research Opus 5 · Writing Opus 5 · Prompt v1.6
The Federal Reserve raised its target range on 16 September for the first time in more than three years, and every one of the 19 listed middle-market lenders fell over the following weeks — even though a higher base rate lifts what their floating-rate loans earn. What it damages is the borrower: Fitch put the trailing US private-credit default rate at a record 6.3% at the end of August.
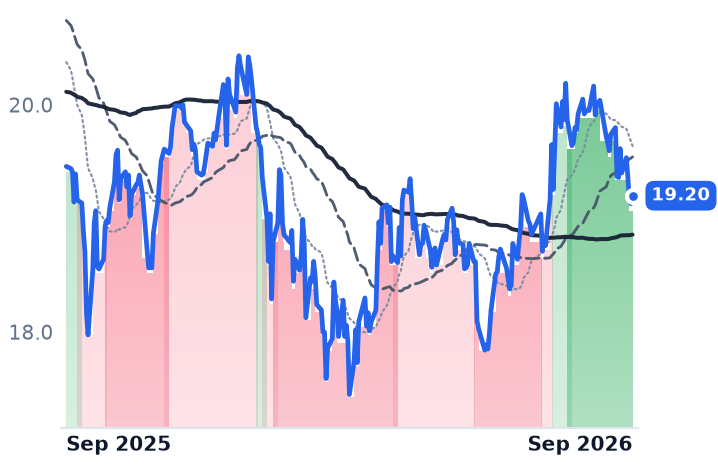
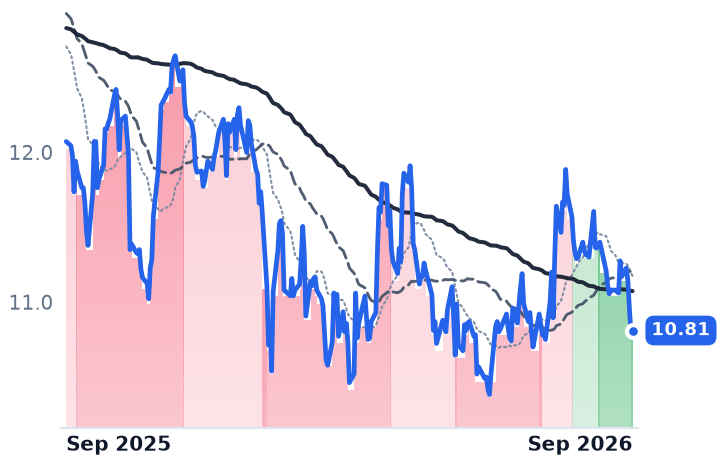
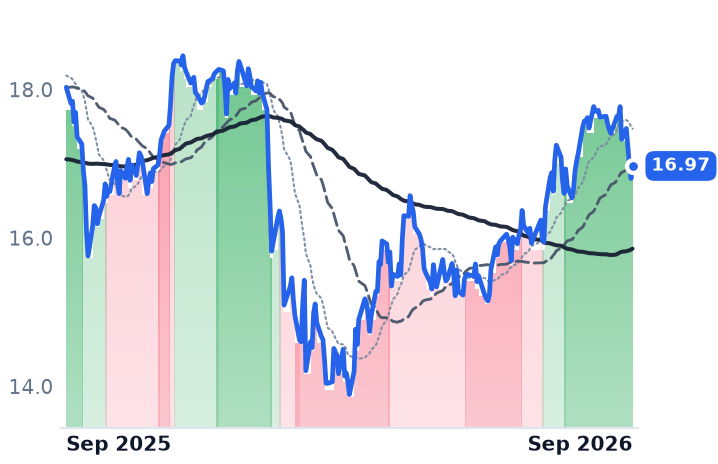
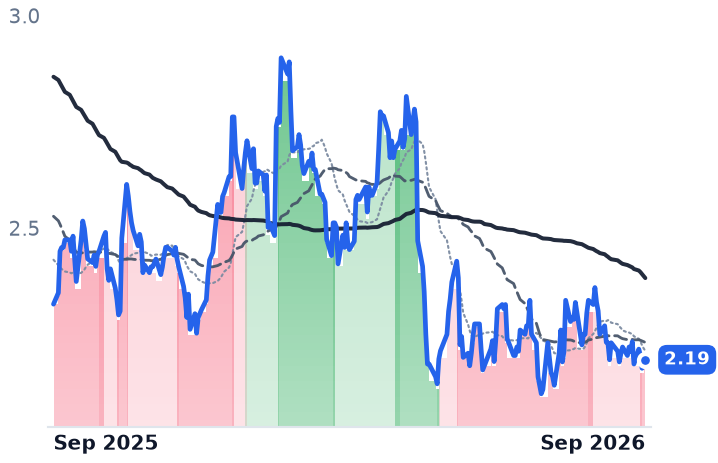
The books are now splitting, hard. FS KKR carries loans on non-accrual at 7.1% of cost and trades at 0.61 times net asset value. Ares Capital's non-accruals are 2.4% at cost and it trades at book. Capital Southwest, the smallest and the one most exposed to deferred-interest structures, grew June-quarter revenue 14.4% and trades 39% above book. The discount is credit-specific, and FS KKR's is earned.
| Ticker | Company | Segment | Trend · 13mo | 30D | 1Y |
|---|---|---|---|---|---|
| The subject · what this brief is about | |||||
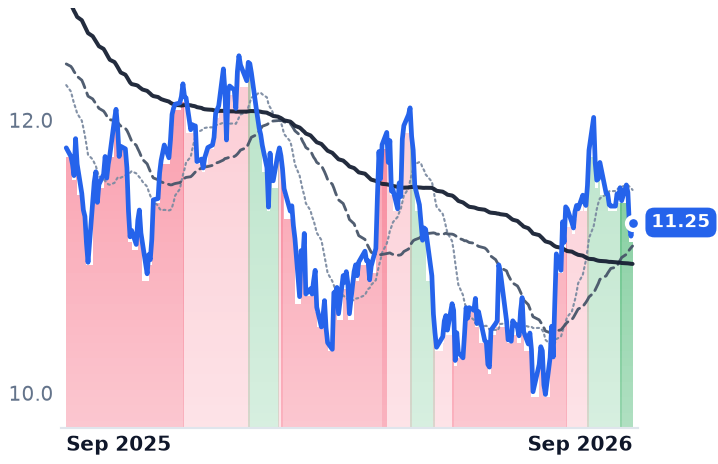
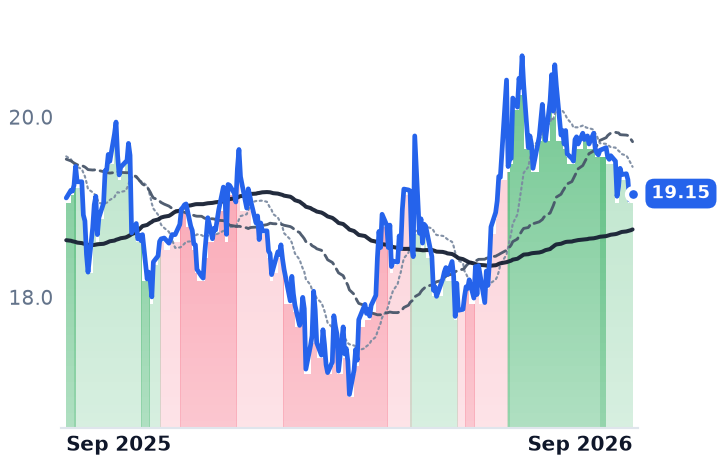
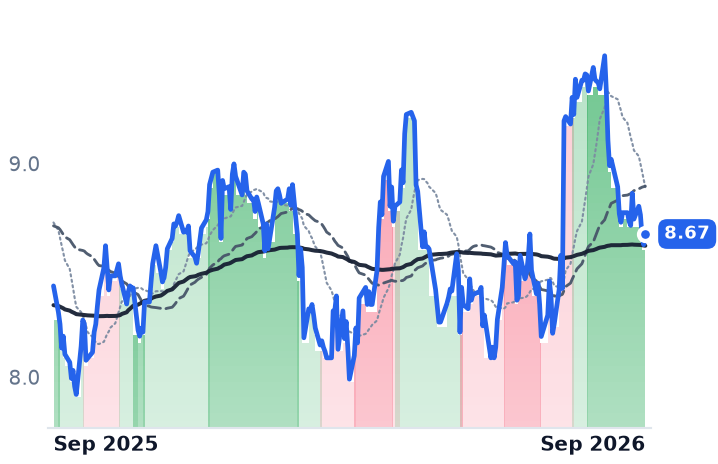
ARCC | Ares Capital | Middle Market Credit | 🌱 Emerging Bull | −3.8% | −1.3% |
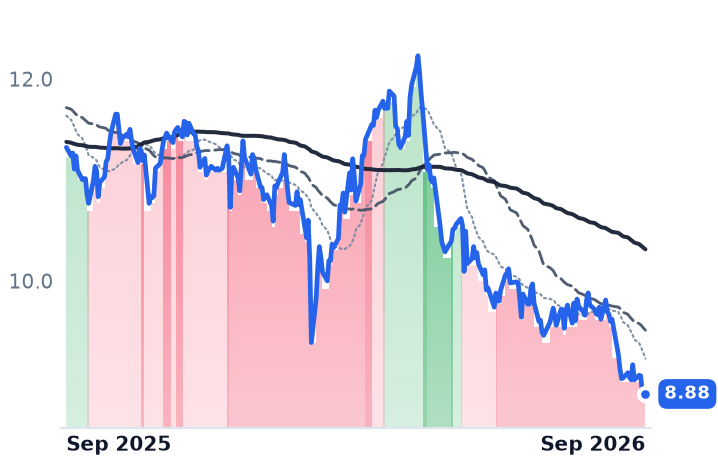
FSK | FS KKR Capital | Middle Market Credit | 🌱 Emerging Bull | −8.2% | −18.6% |
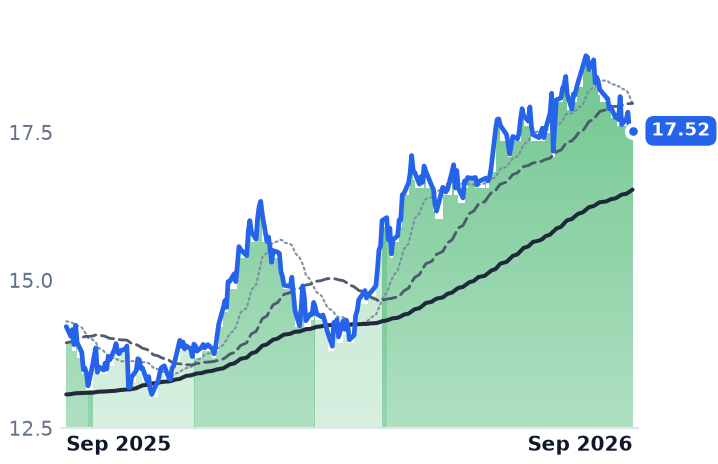
CSWC | Capital Southwest | Middle Market Credit | 🟢 Cont. Bull | −8.9% | +11.6% |
| Compared against · context, not the story | |||||
BCSF | Bain Capital Specialty Finance | Middle Market Credit | 🔴 Cont. Bear | −7.9% | −16.8% |
CGBD | Carlyle Secured Lending | Middle Market Credit | 🌱 Emerging Bull | −2.3% | −4.6% |
FDUS | Fidus Investment | Middle Market Credit | 🌱 Emerging Bull | −3.2% | +0.3% |
GAIN | Gladstone Investment | Middle Market Credit | 🟢 Cont. Bull | −3.9% | +19.3% |
MAIN | Main Street Capital | Middle Market Credit | 🌱 Emerging Bull | −6.1% | −9.9% |
OBDC | Blue Owl Capital | Business Development & Specialty Finance | 🌱 Emerging Bull | −4.5% | −10.4% |
HTGC | Hercules Capital | Middle Market Credit | 🌱 Emerging Bull | −3.7% | −5.9% |
PSEC | Prospect Capital | Middle Market Credit | 🔴 Cont. Bear | −5.0% | −5.6% |
TSLX | Sixth Street Specialty Lending | Middle Market Credit | 🌱 Emerging Bull | −3.8% | −16.5% |
GBDC | Golub Capital BDC | Other | 🌱 Emerging Bull | −4.9% | −4.5% |
NMFC | New Mountain Finance | Middle Market Credit | 🔴 Cont. Bear | −8.5% | −22.5% |
OCSL | Oaktree Specialty Lending | Business Development & Specialty Finance | 🌱 Emerging Bull | −7.1% | −1.0% |
SLRC | SLR Investment | Middle Market Credit | 🔴 Cont. Bear | −6.6% | −20.0% |
TRIN | Trinity Capital | Other | 🟢 Cont. Bull | −6.6% | +23.3% |
MFIC | MidCap Financial Investment | Other | 🔴 Cont. Bear | −8.8% | −21.6% |
BBDC | Barings BDC | Business Development & Specialty Finance | 🟢 Cont. Bull | −7.6% | +2.9% |
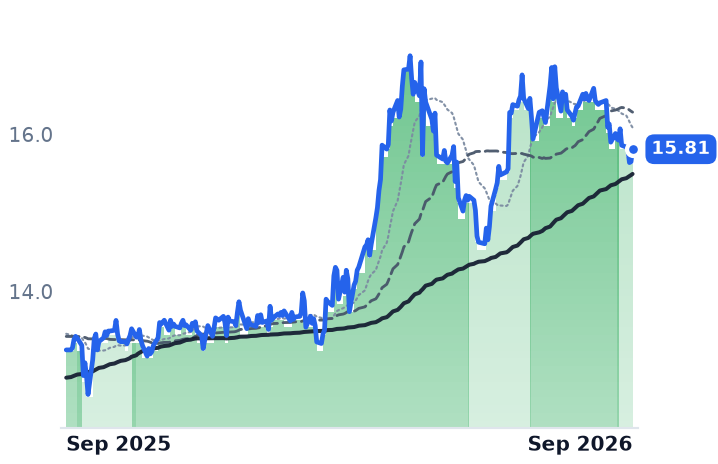
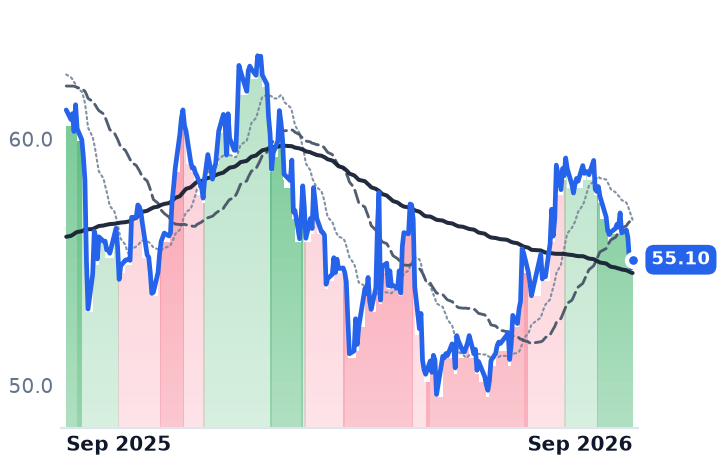
12-month price & trend
| Ticker | Mkt cap | P/E | P/E fwd | P/S | P/S fwd | P/GP | P/GP fwd | EV/EBITDA | FCF yld |
|---|---|---|---|---|---|---|---|---|---|
ARCC | $13.8B | 14.2x | 10.1x | 6.0x | 4.5x | 8.9x | 6.6x | 17.9x | 7.7% |
FSK | $3.2B | n/m | 6.9x | 3.3x | 2.8x | 5.5x | 4.6x | 226.5x | 42.1% |
CSWC | $1.4B | 12.1x | 10.0x | 6.3x | 5.4x | 7.5x | 6.5x | 11.8x | -12.4% |
| Ticker | Mkt cap | P/E | P/E fwd | P/S | P/S fwd | P/GP | P/GP fwd | EV/EBITDA | FCF yld |
|---|---|---|---|---|---|---|---|---|---|
BCSF | $866.6M | 11.8x | 8.0x | 4.4x | 3.4x | 7.2x | 5.5x | 23.5x | 10.5% |
CGBD | $778.4M | 15.4x | 8.1x | 3.6x | 3.1x | 4.8x | 4.2x | 19.9x | 5.9% |
FDUS | $713.2M | 8.6x | 8.9x | 5.4x | 4.0x | 7.2x | 5.4x | 9.5x | -11.8% |
| Ticker | Mkt cap | P/E | P/E fwd | P/S | P/S fwd | P/GP | P/GP fwd | EV/EBITDA | FCF yld |
|---|---|---|---|---|---|---|---|---|---|
GAIN | $653.5M | 3.4x | 18.9x | 5.8x | 6.0x | 10.1x | 10.4x | 9.0x | 4.0% |
MAIN | $5.5B | 11.9x | 15.4x | 7.8x | 9.4x | 9.2x | 11.0x | 17.5x | 3.1% |
OBDC | $5.5B | 19.9x | 8.6x | 3.9x | 3.5x | 5.8x | 5.2x | 13.9x | 20.7% |
| Ticker | Mkt cap | P/E | P/E fwd | P/S | P/S fwd | P/GP | P/GP fwd | EV/EBITDA | FCF yld |
|---|---|---|---|---|---|---|---|---|---|
HTGC | $3.1B | 8.0x | 8.6x | 5.4x | 5.4x | 6.0x | 6.0x | 12.4x | 2.9% |
PSEC | $1.1B | n/m | 4.7x | 11.0x | 1.7x | — | — | n/m | 37.8% |
TSLX | $1.7B | 15.6x | 10.1x | 5.0x | 4.4x | 6.8x | 6.0x | n/m | 8.6% |
| Ticker | Mkt cap | P/E | P/E fwd | P/S | P/S fwd | P/GP | P/GP fwd | EV/EBITDA | FCF yld |
|---|---|---|---|---|---|---|---|---|---|
GBDC | $3.5B | 24.1x | 9.6x | 4.8x | 4.5x | 6.5x | 6.0x | 20.3x | 26.6% |
NMFC | $764.1M | n/m | 7.4x | 3.4x | 3.0x | 4.8x | 4.2x | 24.5x | 88.5% |
OCSL | $1.1B | 21.5x | 8.0x | 3.7x | 3.7x | 4.8x | 4.7x | 19.4x | 1.2% |
| Ticker | Mkt cap | P/E | P/E fwd | P/S | P/S fwd | P/GP | P/GP fwd | EV/EBITDA | FCF yld |
|---|---|---|---|---|---|---|---|---|---|
SLRC | $721.8M | 8.0x | 9.8x | 4.0x | 3.6x | 6.2x | 5.7x | 17.4x | -12.7% |
TRIN | $1.3B | 9.1x | 8.1x | 4.6x | 3.4x | 5.7x | 4.2x | 13.3x | 6.9% |
MFIC | $907.7M | 165.4x | 8.0x | 3.7x | 3.3x | 3.6x | 3.1x | 16.9x | 29.9% |
| Ticker | Mkt cap | P/E | P/E fwd | P/S | P/S fwd | P/GP | P/GP fwd | EV/EBITDA | FCF yld |
|---|---|---|---|---|---|---|---|---|---|
BBDC | $900.5M | 10.1x | 8.7x | 4.1x | 3.6x | 6.1x | 5.3x | 16.6x | 18.2% |
Consensus projections
| Ticker | FY2026E | FY2027E | FY2028E | |
|---|---|---|---|---|
ARCC | Revenue | +1.3% | +3.1% | −1.3% |
| EPS | −4.5% | +1.5% | −3.7% | |
FSK | Revenue | −25.7% | −5.5% | −9.8% |
| EPS | −31.0% | −6.9% | −14.9% | |
CSWC | Revenue | +15.1% | +12.9% | +13.6% |
| EPS | −6.1% | −3.0% | +3.8% | |
BCSF | Revenue | −6.1% | −5.1% | −1.2% |
| EPS | −11.4% | −11.4% | −6.3% | |
CGBD | Revenue | −2.7% | +0.4% | −11.7% |
| EPS | −9.1% | +2.8% | −0.5% | |
FDUS | Revenue | +16.1% | +2.5% | −5.9% |
| EPS | +1.0% | −6.9% | −8.3% | |
GAIN | Revenue | +10.0% | +8.4% | +4.9% |
| EPS | −51.9% | +114.3% | +6.6% | |
MAIN | Revenue | +3.4% | +7.4% | +9.8% |
| EPS | −4.9% | +3.3% | +4.4% | |
OBDC | Revenue | −15.3% | −1.6% | −0.6% |
| EPS | −15.4% | −0.8% | −6.1% | |
HTGC | Revenue | +8.5% | +7.1% | +9.9% |
| EPS | +0.2% | +0.9% | −1.4% | |
PSEC | Revenue | −12.0% | −8.5% | −1.0% |
| EPS | −14.7% | −23.9% | −8.6% | |
TSLX | Revenue | −11.1% | +3.0% | −2.2% |
| EPS | −19.1% | +3.5% | −1.5% | |
GBDC | Revenue | −12.1% | −3.7% | −0.3% |
| EPS | −11.8% | −6.9% | −5.2% | |
NMFC | Revenue | −21.8% | −2.2% | −2.7% |
| EPS | −14.0% | −4.3% | −5.0% | |
OCSL | Revenue | −9.4% | −0.7% | −1.5% |
| EPS | −13.7% | −6.3% | −2.2% | |
SLRC | Revenue | −9.0% | −0.1% | −3.7% |
| EPS | −15.3% | −0.2% | −4.2% | |
TRIN | Revenue | +28.6% | +13.0% | −8.8% |
| EPS | +0.4% | +0.6% | −11.4% | |
MFIC | Revenue | −13.1% | −7.4% | −12.5% |
| EPS | −8.6% | −6.3% | −2.0% | |
BBDC | Revenue | −11.0% | −1.1% | −7.8% |
| EPS | −11.7% | −2.2% | −7.9% |
Forward fiscal years only. Blank means no analyst coverage for that year.
A rate rise is supposed to be good news for a lender whose loans reprice every ninety days. Business development companies — listed funds that make first-lien loans to mid-sized private companies at a coupon struck as a spread over three-month SOFR — were sold after the Federal Open Market Committee voted 12-0 on 16 September to lift the federal funds target to 3.75%-4.00%, its first increase in over three years, and signalled another. Futures now price roughly 4.3% by December. The rally that carried this group from March into August was a bet on cuts. The cuts are not coming.
That reverses which side of the loan agreement is under strain. A rising base rate mechanically raises the interest a floating-rate lender collects; it also raises what the private-equity-owned borrower has to pay out of unchanged cash flow. Fitch put the trailing-twelve-month default rate across roughly 1,300 US private-credit borrowers at a record 6.3% at the end of August, up from 6.1% a month earlier, and KBRA counts about 40% of private-credit borrowers now running negative free cash flow, against 25% in 2021. The question for these funds is no longer yield compression. It is which of them financed the companies that cannot service the new rate.
Three books, three answers
Ares Capital, the $13.8bn lender that writes $10m-$400m checks to companies with up to $250m of EBITDA and usually leads its own deals, is the one showing no damage yet. Its weighted-average yield on debt investments fell from 11.1% to 10.3% over the year to end-2025 and then held at 10.3% through June; new senior loan commitments in the quarter carried spreads 20 basis points wider than in late 2025, with upfront fees half a point higher. Loans on non-accrual were 2.4% of investments at cost and 1.4% at fair value, below the firm's own roughly 3% average since the financial crisis. "We are not seeing the same kind of spikes in non-accruals and further weakening that maybe some of our competitors are seeing," chief executive Kort Schnabel said on the 29 July call. Net asset value slipped $0.24 to $19.35 a share, core earnings were flat at $0.47, and the declared third-quarter dividend is $0.48 — covered because the company carries $1.38 a share of spillover income forward.
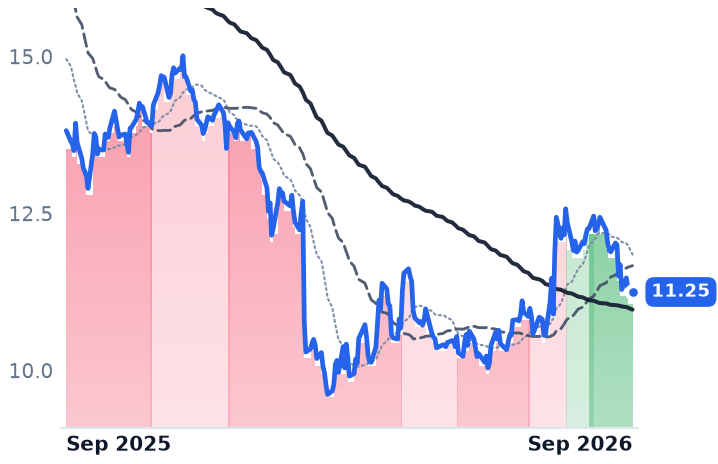
FS KKR, the $3.2bn NYSE-listed fund lending to upper-middle-market borrowers, is the book that is cracking. Net asset value fell to $18.30 a share at 30 June from $23.64 at the end of 2024 — a 22.6% write-down across ten consecutive declining quarters. Non-accruals are 7.1% at cost and 3.8% at fair value, roughly three times Ares Capital's, on the lowest portfolio yield of the three at 9.8%. Its distribution has already been tested: cut to $0.42 for the June quarter from $0.64, with $0.44 declared for the third against net investment income of exactly $0.44. Chief investment officer Dan Pietrzak told investors on the August call the market had "toggled to what I call more of a lender-friendly environment versus a borrower-friendly environment," and that the fund expects to get smaller as it rotates out of second-lien and junior debt. Consensus has revenue down 25.7% this year.
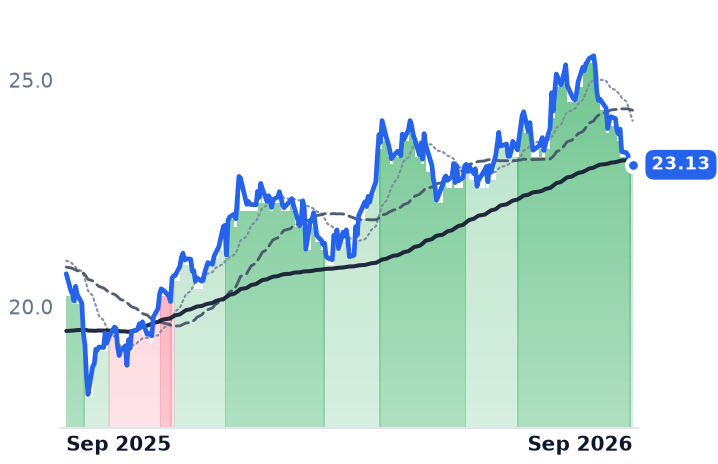
Capital Southwest is the surprise. The internally managed Dallas lender — 36 employees, $5m-$20m loans to companies with under $15m of EBITDA, plus minority equity alongside them — has the highest yield of the three at 10.9% on a credit book that is 99% first-lien and marked with non-accruals of 1.1% at fair value, lower than Ares Capital's. Net asset value was $16.61 against $16.69 a quarter earlier. June-quarter revenue rose 14.4% year on year with operating margin at 71%, against 56.7% a year earlier, and net investment income of $0.58-$0.59 covered the $0.58 regular dividend plus a $0.06 supplemental. It also priced $350m of 6.75% notes due 2031 for mid-September settlement, leaving about four points of gross spread on incremental funding.
What the prices say
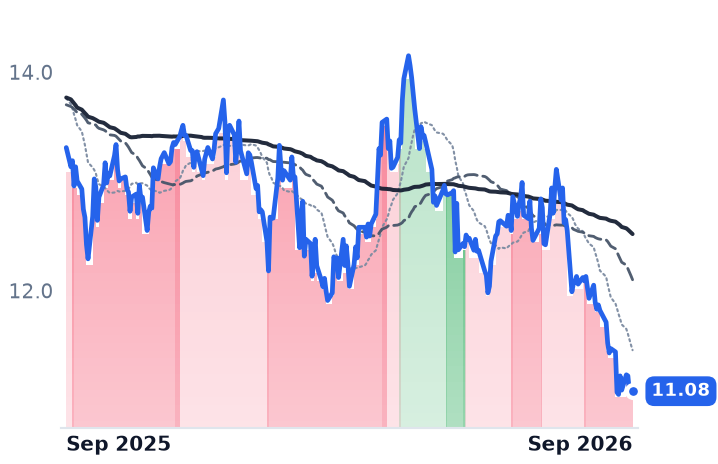
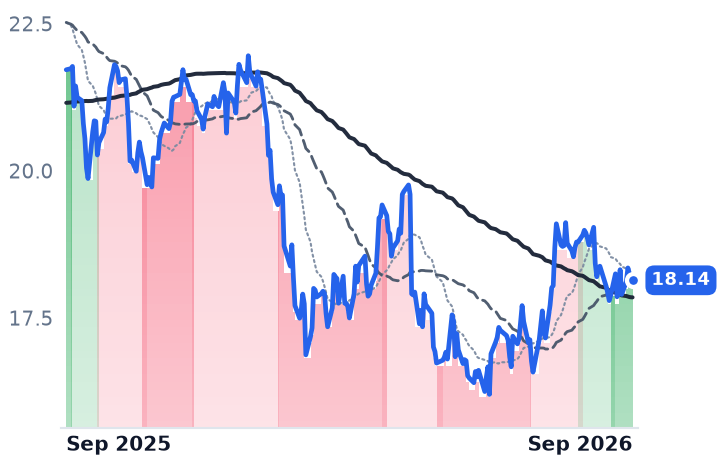
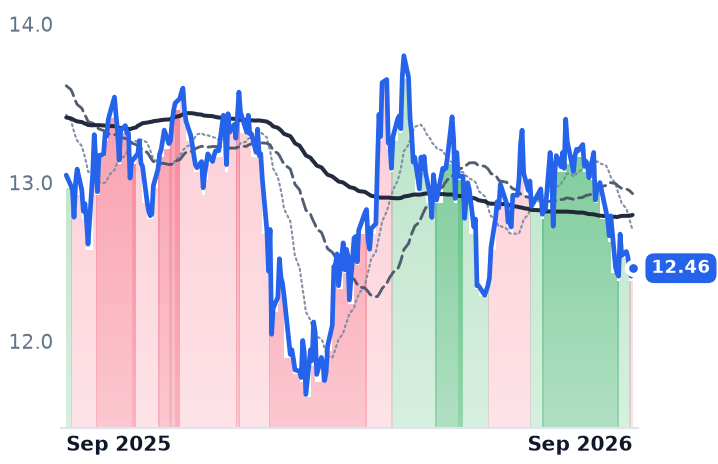
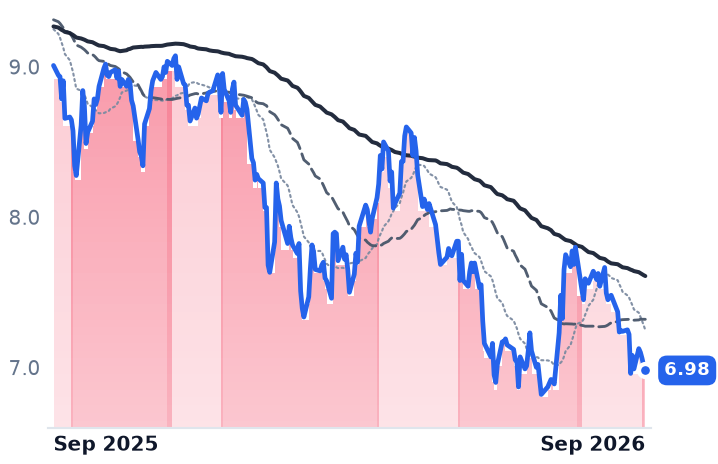
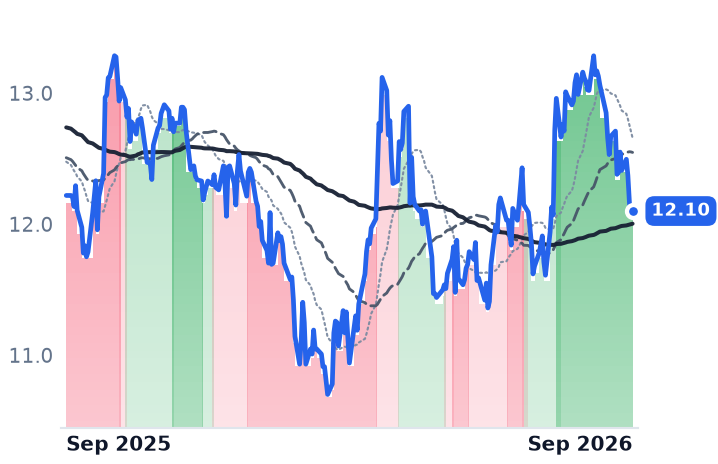
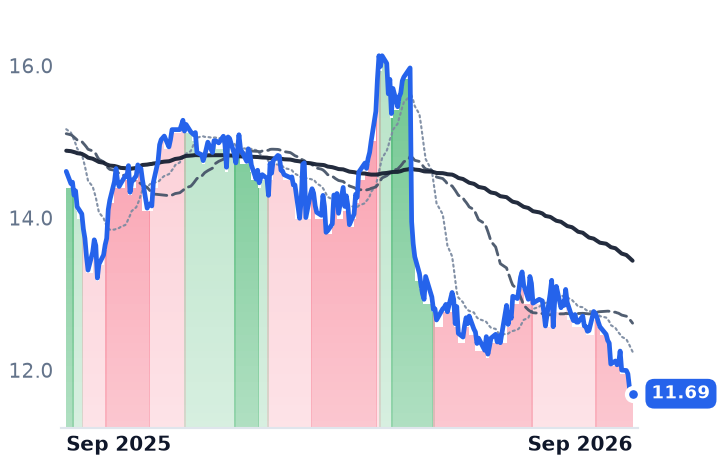
All 19 listed lenders with price history fell over the thirty days to 25 September, an average of 5.9%: Ares Capital 3.8%, FS KKR 7.5%, Capital Southwest 8.8%. But the same group rose 3.2% over three months, and the twelve-month picture is dispersion rather than drift — FS KKR down 25.9% while Capital Southwest is up 2.7%. Because a BDC marks its whole asset base to fair value quarterly, reported earnings swing on marks — FS KKR's trailing price-to-earnings is negative and meaningless — so book value is the comparable measure. On it, Ares Capital trades at 0.99 times its June NAV, FS KKR at 0.61 and Capital Southwest at 1.39. That is a 2.3-fold spread inside one business model, up from a segment median of roughly 0.74 times forward NAV in late March.
So the September selling is not one discount applied to twenty-one identical books. FS KKR's de-rating is earned: 0.61 times book prices a further large write-down against a portfolio management itself says will shrink, and consensus EPS falling from $2.36 in 2025 toward $1.52 in 2027. Ares Capital's fall is the one its own meters do not explain — yield flat, credit better than its long-run norm — though the anchor is drifting and 2026 consensus earnings are down 4.5%, with the dividend leaning on accumulated spillover rather than on the quarter. Capital Southwest's business is the healthiest of the three and its multiple the richest; that premium is also the thing that funds it, since a lender trading above book can issue stock accretively, which is why shareholders approved more authorized shares on 1 September, and a lender at 0.61 times book cannot.
Third-quarter reports are due late October and early November. They will be the first to cover a quarter in which the base rate went up — the first quarter, in other words, in which the borrowers pay for it rather than the lenders.