

Kinder Morgan's 96% Take-or-Pay Contract Book Became the Reason Its Shares Fell 7%
Hypothesis Opus 5 · Research Opus 5 · Writing Opus 5 · Prompt v1.6
The safest-looking way to own data-center power demand was pipeline capacity already under contract. This quarter it behaved like the exposure instead. Kinder Morgan's June-quarter operating income rose 17.8%, it raised full-year guidance, and its $9.6bn project backlog — 92% natural gas, more than 60% tied to power and local-distribution load — cleared a major federal permit three months early on 8 September. The shares fell anyway.
DT Midstream, contracted harder still at roughly 95% demand-based revenue, fell furthest, and there the business cooperated: revenue growth halved to 11% and consensus now prices essentially no 2026 earnings expansion. Targa, the one paid partly on a share of commodity proceeds it does not set, rose. Regulated utilities fell harder than either pipeline; the midstream partnerships did not fall at all. A 30-year Treasury at 5.53% explains the direction, not the split.
| Ticker | Company | Segment | Trend · 13mo | 30D | 1Y |
|---|---|---|---|---|---|
| The subject · what this brief is about | |||||
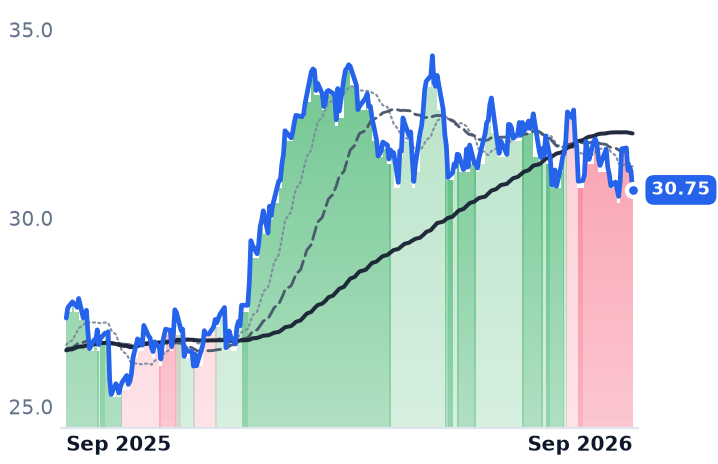
KMI | Kinder Morgan | Natural Gas Pipelines & Transmission | ⚠️ Emerging Bear | −4.0% | +12.4% |
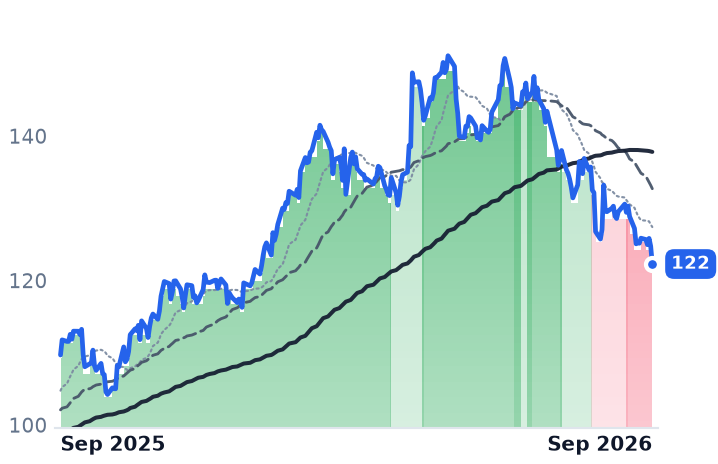
DTM | DT Midstream | Natural Gas Pipelines & Transmission | ⚠️ Emerging Bear | −8.2% | +11.5% |
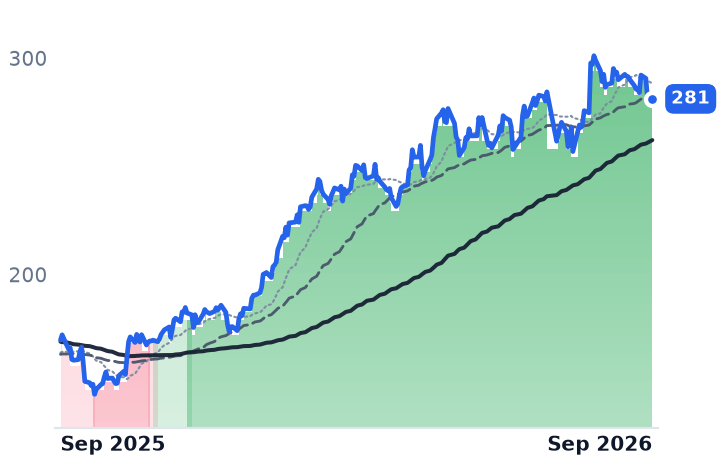
TRGP | Targa Resources | Natural Gas Gathering & Processing | 🟢 Cont. Bull | −3.9% | +65.7% |
| Compared against · context, not the story | |||||
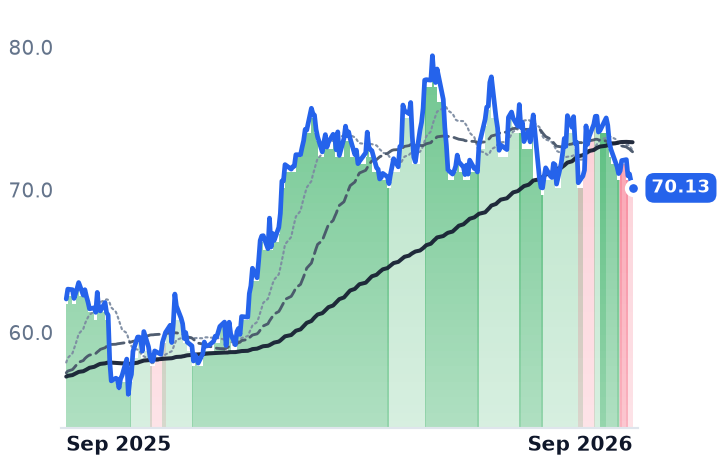
WMB | The Williams Companies | Natural Gas Pipelines & Transmission | ⚠️ Emerging Bear | −5.8% | +12.5% |
ET | Energy Transfer | Natural Gas Pipelines & Transmission | 🟢 Cont. Bull | −4.9% | +20.5% |
TRP | TC Energy | Natural Gas Pipelines & Transmission | ⚠️ Emerging Bear | −5.3% | +11.9% |
EPD | Enterprise Products Partners | Crude Oil & NGL Pipelines | 🟢 Cont. Bull | −5.1% | +20.5% |
MPLX | MPLX | Natural Gas Gathering & Processing | 🟢 Cont. Bull | −3.8% | +15.2% |
OKE | ONEOK | Natural Gas Gathering & Processing | 🟢 Cont. Bull | −6.2% | +24.2% |
SO | The Southern | Vertically Integrated Utilities | ⚠️ Emerging Bear | −8.0% | −10.3% |
NEE | NextEra Energy | Vertically Integrated Utilities | 🔴 Cont. Bear | −9.9% | +3.0% |
AEP | American Electric Power | Vertically Integrated Utilities | ⚠️ Emerging Bear | −4.3% | +11.5% |
DUK | Duke Energy | Vertically Integrated Utilities | ⚠️ Emerging Bear | −7.0% | −5.7% |
SPY | State Street SPDR S&P 500 ETF Trust | Asset Management | 🟢 Cont. Bull | +0.4% | +17.5% |
NG=F | NG=F | — | 🔴 Cont. Bear | +12.4% | +12.6% |
12-month price & trend
| Ticker | Mkt cap | P/E | P/E fwd | P/S | P/S fwd | P/GP | P/GP fwd | EV/EBITDA | FCF yld |
|---|---|---|---|---|---|---|---|---|---|
KMI | $68.5B | 19.7x | 20.0x | 3.8x | 3.7x | 6.9x | 6.8x | 12.5x | 5.6% |
DTM | $12.5B | 26.6x | 25.9x | 9.5x | 9.3x | 15.1x | 14.7x | 14.4x | 3.8% |
TRGP | $59.6B | 26.4x | 24.7x | 3.6x | 3.1x | 9.7x | 8.6x | 16.6x | 1.2% |
| Ticker | Mkt cap | P/E | P/E fwd | P/S | P/S fwd | P/GP | P/GP fwd | EV/EBITDA | FCF yld |
|---|---|---|---|---|---|---|---|---|---|
WMB | $91.2B | 29.6x | 30.4x | 7.5x | 7.4x | 10.2x | 10.1x | 16.3x | -0.2% |
ET | $72.1B | 13.0x | 13.4x | 0.7x | 0.7x | 2.9x | 2.7x | 9.7x | 7.2% |
TRP | $66.2B | 26.6x | 16.9x | 5.8x | 4.1x | 11.2x | 8.0x | 13.8x | 4.4% |
| Ticker | Mkt cap | P/E | P/E fwd | P/S | P/S fwd | P/GP | P/GP fwd | EV/EBITDA | FCF yld |
|---|---|---|---|---|---|---|---|---|---|
EPD | $81.7B | 13.1x | 13.0x | 1.4x | 1.4x | 10.5x | 10.6x | 7.9x | 1.8% |
MPLX | $59.7B | 12.6x | 13.6x | 4.6x | 4.7x | 8.9x | 8.9x | 11.5x | 7.4% |
OKE | $58.8B | 16.1x | 16.2x | 1.5x | 1.4x | 6.8x | 6.3x | 11.6x | 4.9% |
| Ticker | Mkt cap | P/E | P/E fwd | P/S | P/S fwd | P/GP | P/GP fwd | EV/EBITDA | FCF yld |
|---|---|---|---|---|---|---|---|---|---|
SO | $106.6B | 22.2x | 20.2x | 3.5x | 3.5x | 8.1x | 8.0x | 12.7x | 2.4% |
NEE | $165.4B | 17.7x | 19.7x | 5.7x | 5.3x | 7.9x | 7.4x | 15.4x | -6.2% |
AEP | $67.8B | 21.4x | 19.5x | 3.0x | 2.9x | 6.1x | 5.9x | 14.1x | 13.2% |
| Ticker | Mkt cap | P/E | P/E fwd | P/S | P/S fwd | P/GP | P/GP fwd | EV/EBITDA | FCF yld |
|---|---|---|---|---|---|---|---|---|---|
DUK | $93.7B | 18.1x | 17.9x | 2.8x | 2.8x | 4.1x | 4.1x | 11.4x | 1.6% |
SPY | $773.0B | — | — | — | — | — | — | — | — |
NG=F | — | — | — | — | — | — | — | — | — |
Consensus projections
| Ticker | FY2026E | FY2027E | FY2028E | |
|---|---|---|---|---|
KMI | Revenue | +8.6% | +1.6% | +5.1% |
| EPS | +19.8% | −0.0% | +9.0% | |
DTM | Revenue | +7.9% | +4.6% | +9.9% |
| EPS | +7.7% | +6.0% | +11.9% | |
TRGP | Revenue | +11.6% | +25.6% | +13.5% |
| EPS | +32.1% | +9.4% | +21.4% | |
WMB | Revenue | +7.8% | +13.8% | +14.7% |
| EPS | +15.6% | +5.5% | +17.7% | |
ET | Revenue | +35.3% | +1.9% | +4.9% |
| EPS | +16.7% | +3.6% | +7.4% | |
TRP | Revenue | +6.7% | +4.4% | +5.3% |
| EPS | +7.3% | +5.4% | +6.2% | |
EPD | Revenue | +12.8% | +5.4% | +5.7% |
| EPS | +11.6% | +9.6% | +8.3% | |
MPLX | Revenue | −1.0% | +6.7% | +5.0% |
| EPS | −6.7% | +11.9% | +6.5% | |
OKE | Revenue | +27.2% | −5.3% | +1.1% |
| EPS | +6.8% | +8.2% | +11.3% | |
SO | Revenue | +7.7% | +5.5% | +6.1% |
| EPS | +6.8% | +7.5% | +9.2% | |
NEE | Revenue | +9.4% | +9.7% | +8.9% |
| EPS | +9.0% | +9.1% | +8.5% | |
AEP | Revenue | +9.5% | +5.9% | +7.6% |
| EPS | +7.9% | +7.6% | +10.6% | |
DUK | Revenue | +5.8% | +4.6% | +4.2% |
| EPS | +6.3% | +6.9% | +7.0% |
Forward fiscal years only. Blank means no analyst coverage for that year.
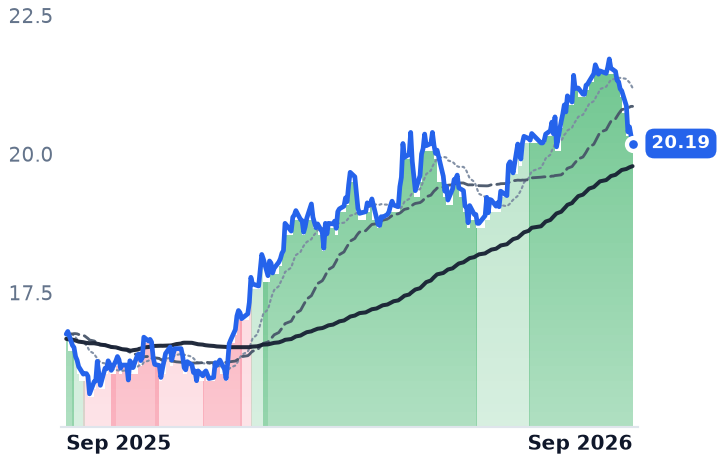
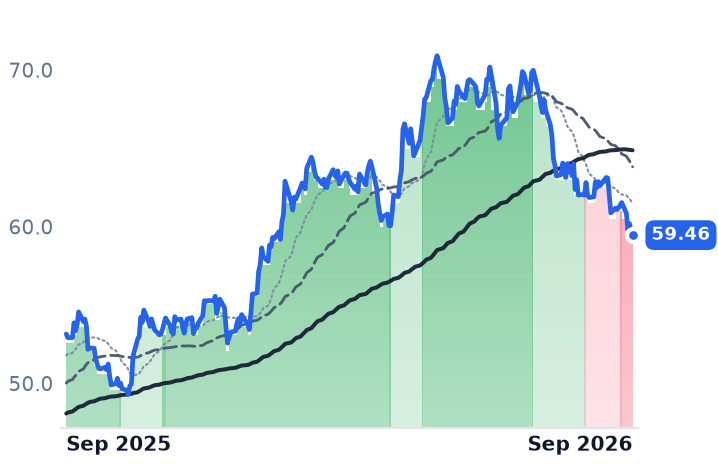
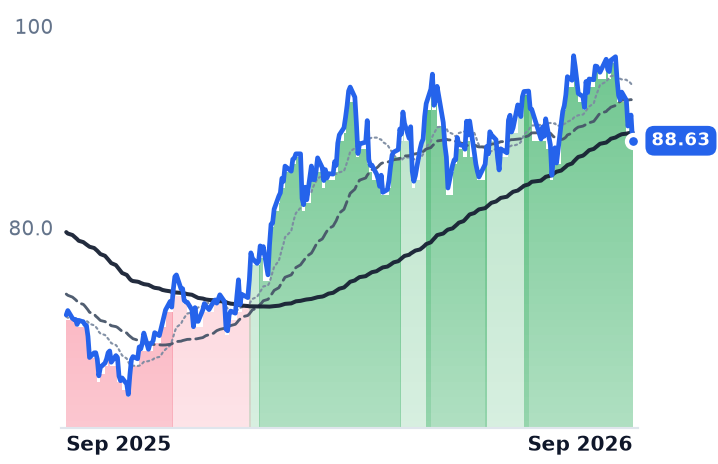
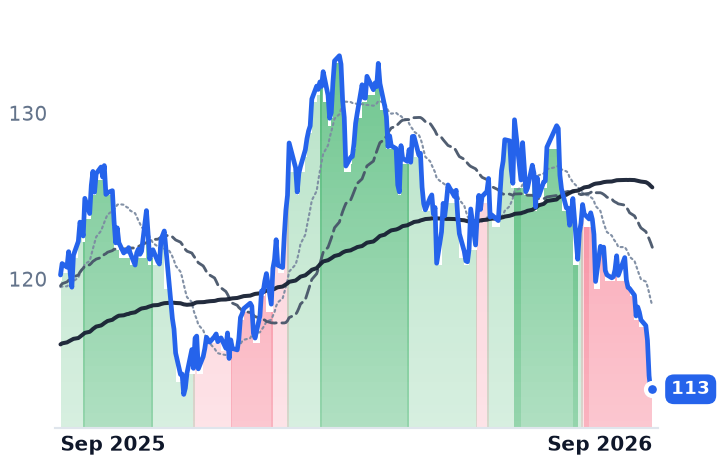
Kinder Morgan's largest new Gulf Coast gas line cleared federal permitting three months ahead of schedule — and the shares spent the month going the other way. The Federal Permitting Improvement Steering Council announced on 8 September that the $1.7bn Mississippi Crossing project, 208 miles of large-diameter pipe built to move up to 2.1 billion cubic feet a day into Alabama with service as early as the second quarter of 2028, had finished its federal review early. Kinder Morgan's 50-day average price slipped below its 200-day on 21 August and has stayed there since; DT Midstream's crossed on 9 September.
That matters because of how these companies are actually paid. Kinder Morgan does not sell gas to data centers; it sells reserved capacity. Its own disclosure puts 96% of 2026 budgeted cash flow in take-or-pay, fee-based or hedged form — 65% take-or-pay, which bills whether a molecule moves or not — on remaining contract terms averaging 3.3 to 14.7 years. A book like that is a bond with pipes attached, and the 30-year Treasury yield topped 5.53% on 24 September, its highest since 2004, from under 5% in early July. The longer the contracted stream, the harder it re-prices.
The business improved while the price fell
Kinder Morgan's second-quarter revenue rose 10.8% to $4.48bn, operating income 17.8% to $1.35bn, and operating margin reached 30.1% against 28.3% a year earlier. Adjusted earnings before interest, taxes, depreciation and amortization hit a record $2.20bn, up 12%, and the company raised full-year guidance. The backlog fell $500m to $9.6bn in the quarter because more than $650m of projects went into service, not because anything was cancelled; the remaining $8.5bn is expected to earn back its cost at roughly 5.6 times first-full-year project cash earnings. Chief executive Kimberly Dang told investors on the 22 July call that additions from a more than $10bn opportunity set should more than offset the roughly $1bn entering service in the second half, with nearly $400m already under contingent board approval. The stock now trades at 12.5 times enterprise value to EBITDA, the cheapest of the three, and 19.7 times trailing earnings against 21.7 times in May.
Where the de-rating is earned
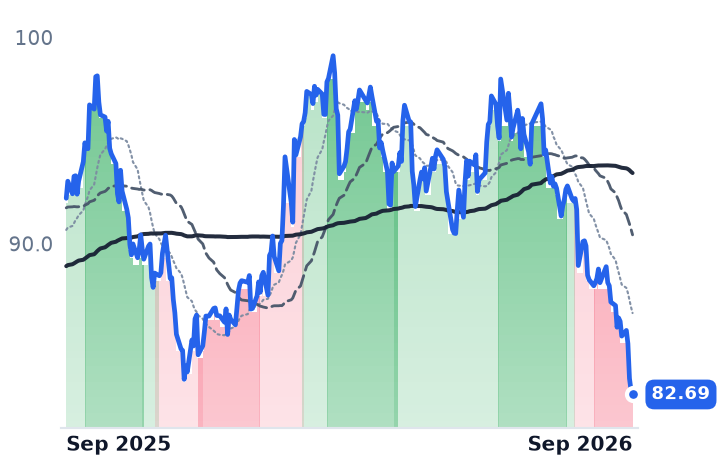
DT Midstream is the purer version of the same idea and the weaker case. It is about 95% demand-based with an average tenor near eight years, and in 2024 roughly 92% of pipeline revenue came from firm service. But revenue growth halved from 27.3% in the fourth quarter of 2025 to 11.0% in the second quarter of 2026, and operating-income growth decelerated from 38% to 11.6%. Its forward earnings multiple of 25.9 sits barely below a trailing 26.6 — consensus expects almost no 2026 expansion — while the revenue growth is back-loaded to 19.1% in 2029 and 30.7% in 2030, precisely the shape a 5.5% long bond punishes. The commercial momentum is real: chief executive David Slater said on the 30 July call that "our entire asset footprint is kind of lit up like a Christmas tree right now, and we've never seen that before while we've owned these assets," and the company took a final investment decision on $300m of projects including a 380 million cubic feet a day interconnect feeding an Ohio data center's power plant. Analysts split rather than converged in September: Jefferies cut its target to $145 while Morgan Stanley upgraded the shares.
Targa Resources, which gathers and processes Permian gas and fractionates natural gas liquids, is the one whose contracts are least protective — about 80% fee-based, with the balance on percent-of-proceeds terms that hand it a share of commodity sales. It has held an unbroken uptrend since 12 December 2025 and rose over the same three months the others fell. Its quarter was genuinely strong — operating income up 52.7%, adjusted EBITDA up 38% with full-year guidance moved to the top of the range — and buybacks do not explain the share price: $80m repurchased in the quarter against a $59.6bn market value. It is also the most expensive of the three at 16.6 times EV/EBITDA, on a trailing free cash flow yield of 1.2% against Kinder Morgan's 5.7%.
What nothing explains
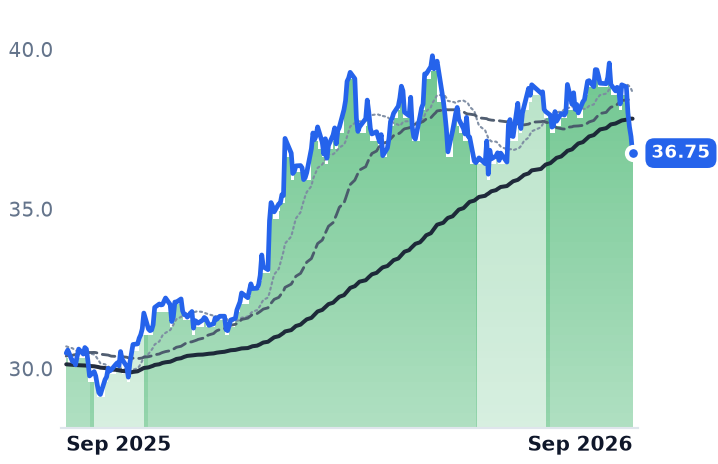
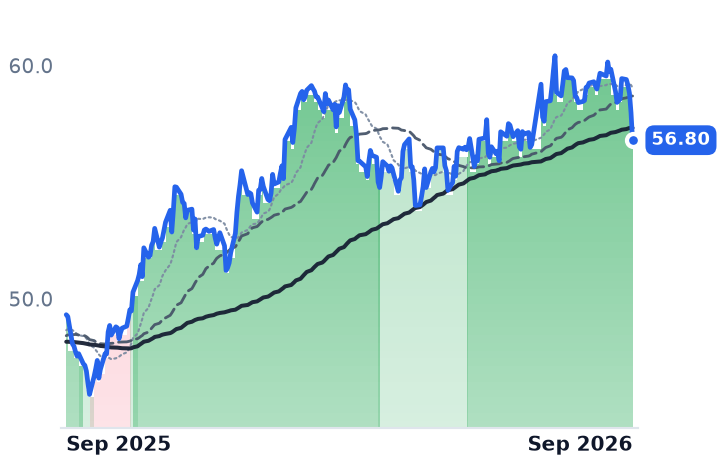
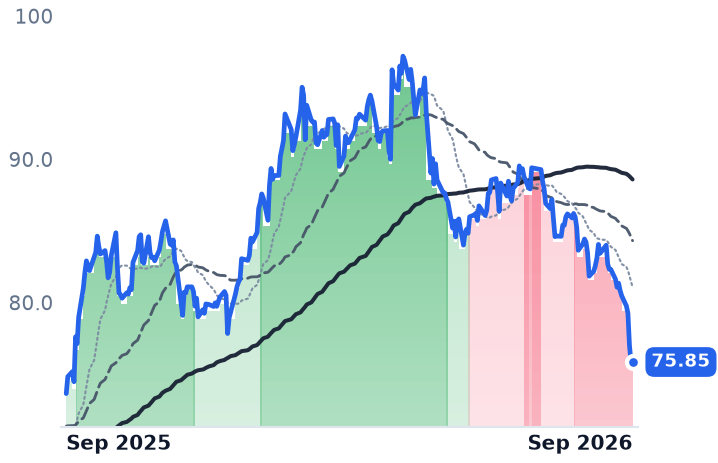
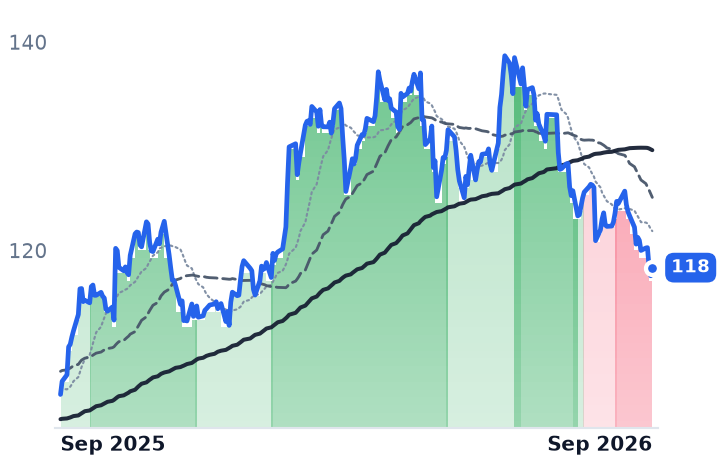
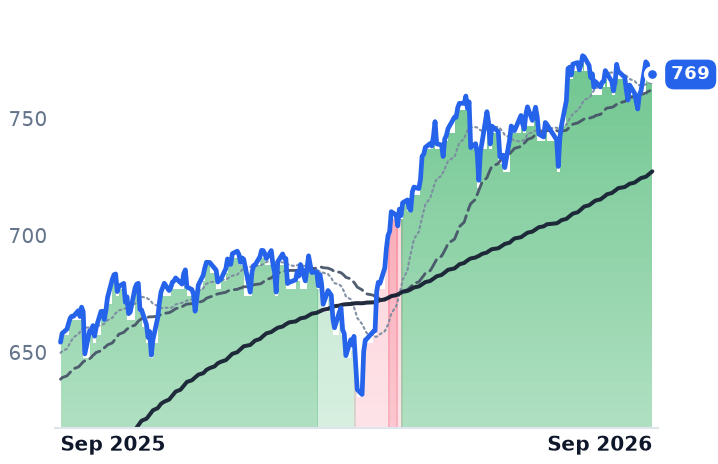
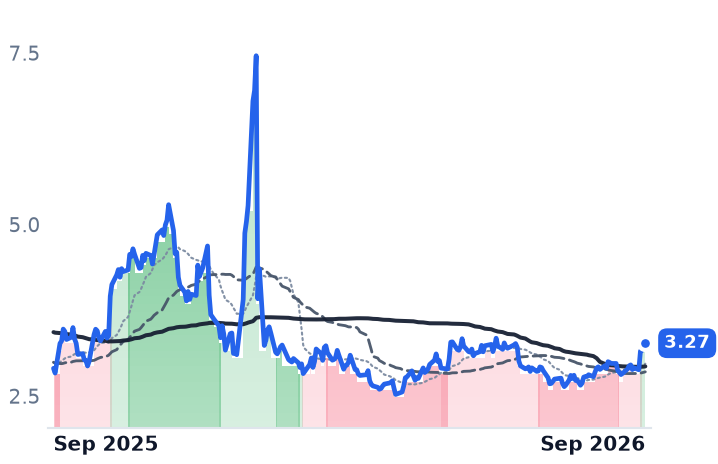
Rates carried the direction. Regulated utilities fell harder over the same three months — Southern down 14.9%, NextEra 14.4%, American Electric Power 14.2% — while the S&P 500 rose. But rates are not the whole answer: Enterprise Products, MPLX and ONEOK, sitting in the identical bond market and the identical gas market, all rose, and Henry Hub gas itself gained 12.4% in thirty days to $3.27 per million British thermal units. Same discount rate, same commodity, opposite outcome.
So the split resolves against the comfortable reading. DT Midstream's de-rating is paid for by its own numbers — decelerating growth and cash flows that arrive at the end of the decade. Kinder Morgan's is not: revenue, margin, guidance and permitting all moved its way, and the decline is a re-pricing of duration rather than of performance. And the defense investors thought they were buying — capacity locked under multi-decade take-or-pay terms — is now the feature being discounted, while the name carrying commodity margin it does not control is the one holding. An optics of safety has inverted.
Kinder Morgan reports third-quarter results on 21 October. The test is not the earnings line but whether the newly signed firm capacity Dang promised actually lands in the backlog — because for now, being paid regardless of flow is worth less, not more.