

Liberty Energy Ordered Turbines for 2029 While Its Frac Business Earned a 1.07% Margin
Hypothesis Opus 5 · Research Opus 5 · Writing Opus 5 · Prompt v1.6
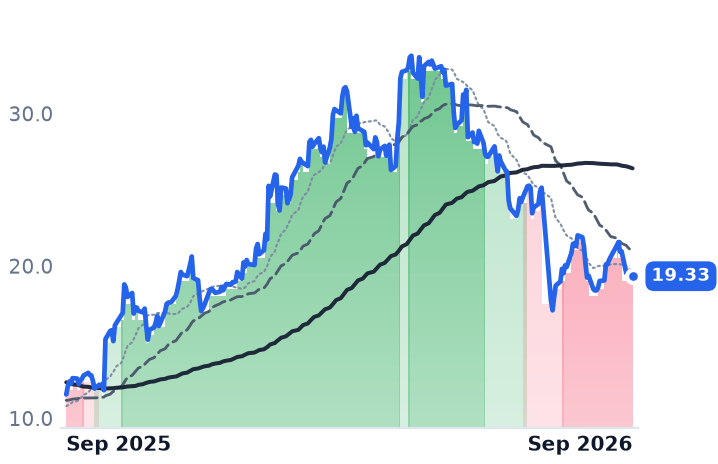
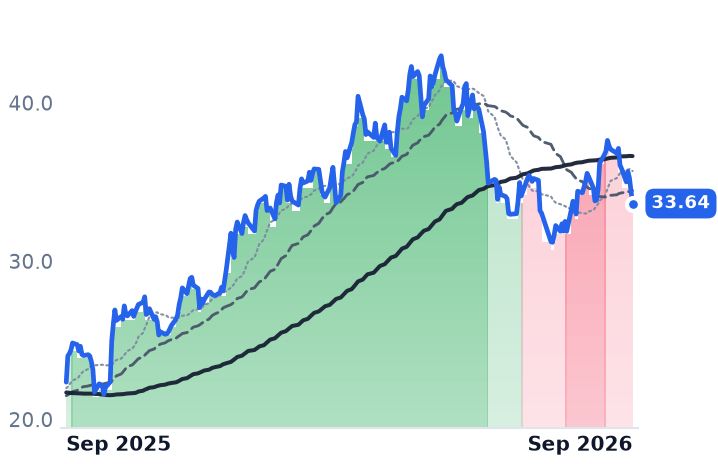
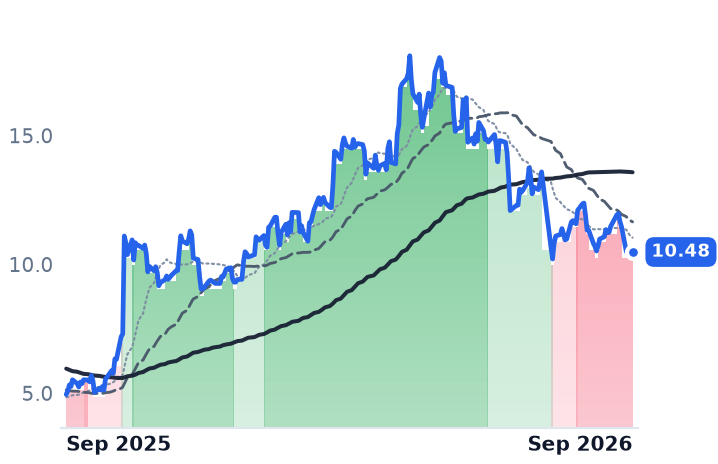
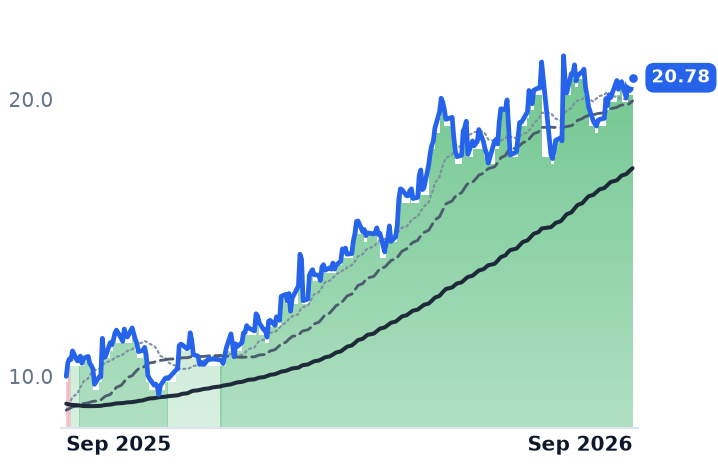
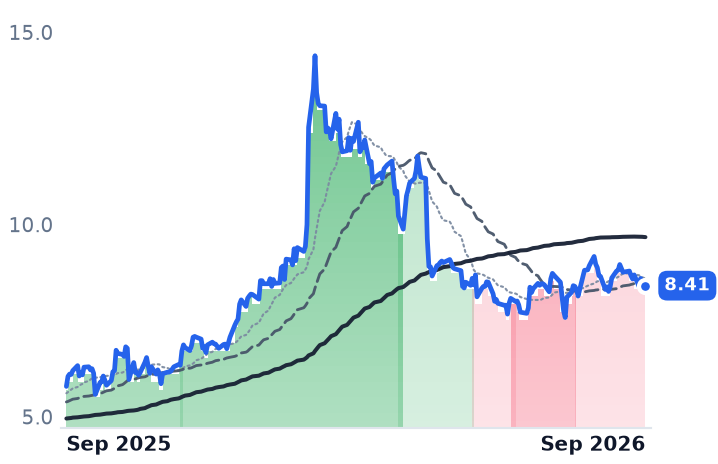
The meter that counts American frac crews turned back up — Primary Vision's spread count rose two consecutive weeks to 187 by 18 September, against 169 working a year earlier — and the two pure-play pumpers kept falling through it. Liberty Energy and ProPetro are each down about 29% over three months; the diversified oilfield names are roughly flat over the same span.
Liberty's pumping business improved rather than deteriorated: June-quarter gross margin nearly doubled to 17.5%. What the market is pricing sits below that line — a $1.5bn capital budget against $602m of consensus 2026 cash profit, with no signed energy services agreement behind the power it is building. Halliburton, guiding its completion margin higher on flat-to-lower completion revenue, is on the other side of the split; ProPetro, with an operating loss and three power dollars budgeted per frac dollar, is not.
| Ticker | Company | Segment | Trend · 13mo | 30D | 1Y |
|---|---|---|---|---|---|
| The subject · what this brief is about | |||||
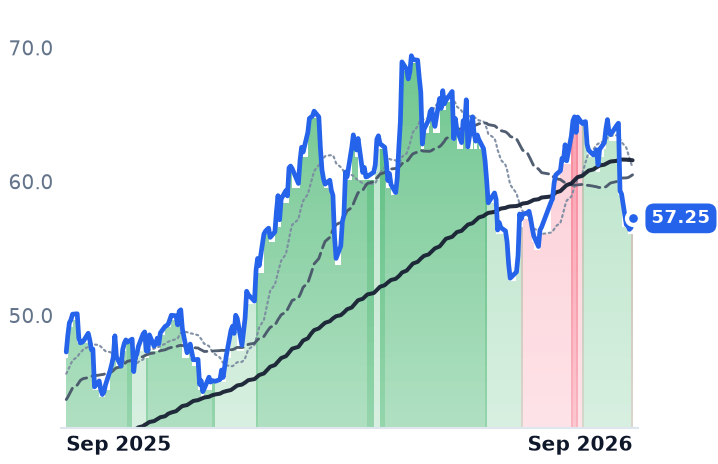
LBRT | Liberty Energy | Well Services & Stimulation | ⚠️ Emerging Bear | +4.6% | +67.1% |
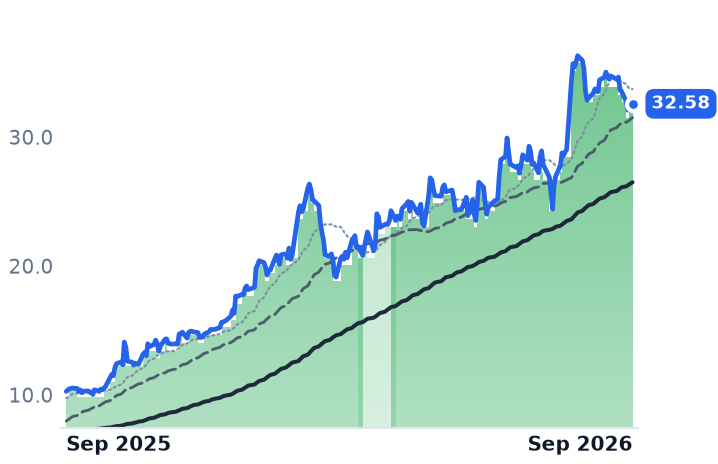
HAL | Halliburton | Well Services & Stimulation | ⚠️ Emerging Bear | −2.9% | +50.5% |
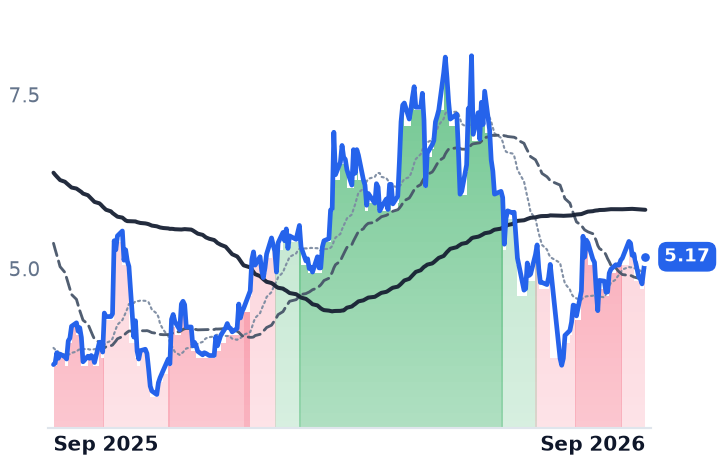
PUMP | ProPetro | Well Services & Stimulation | ⚠️ Emerging Bear | −3.1% | +111.7% |
| Compared against · context, not the story | |||||
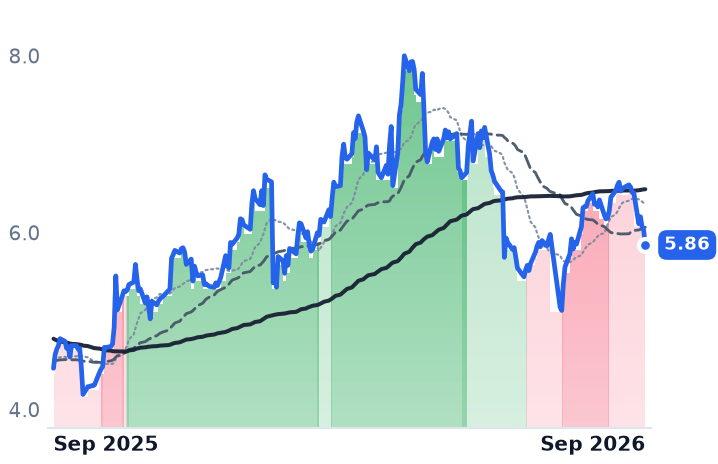
SLB | Slb | Well Services & Stimulation | 🟢 Cont. Bull | −5.3% | +52.8% |
BKR | Baker Hughes | Well Services & Stimulation | ⚠️ Emerging Bear | −7.6% | +21.1% |
NESR | National Energy Services Reunited | Well Services & Stimulation | 🟢 Cont. Bull | −2.5% | +217.2% |
ACDC | ProFrac | Well Services & Stimulation | ⚠️ Emerging Bear | +7.3% | +42.8% |
RES | RPC | Well Services & Stimulation | ⚠️ Emerging Bear | −5.5% | +31.2% |
WTTR | Select Water Solutions | Water Services & Energy Solutions | 🟢 Cont. Bull | +8.2% | +107.8% |
OIS | Oil States International | Oilfield Equipment & Tools | 🔴 Cont. Bear | +1.2% | +45.3% |
12-month price & trend
| Ticker | Mkt cap | P/E | P/E fwd | P/S | P/S fwd | P/GP | P/GP fwd | EV/EBITDA | FCF yld |
|---|---|---|---|---|---|---|---|---|---|
LBRT | $3.2B | 25.6x | 69.9x | 0.8x | 0.7x | 5.8x | 5.3x | 6.8x | -10.0% |
HAL | $28.1B | 17.6x | 14.4x | 1.3x | 1.3x | 8.3x | 8.3x | 8.3x | 6.1% |
PUMP | $1.3B | n/m | — | 1.1x | 1.0x | 13.4x | 12.6x | 8.1x | -1.7% |
| Ticker | Mkt cap | P/E | P/E fwd | P/S | P/S fwd | P/GP | P/GP fwd | EV/EBITDA | FCF yld |
|---|---|---|---|---|---|---|---|---|---|
SLB | $75.9B | 24.6x | 20.6x | 2.1x | 2.1x | 12.6x | 12.4x | 12.0x | 6.0% |
BKR | $62.0B | 19.9x | 23.7x | 2.2x | 2.2x | 9.5x | 9.4x | 13.2x | 5.0% |
NESR | $2.6B | 39.7x | 15.9x | 1.8x | 1.4x | 16.0x | 12.4x | 11.0x | 4.9% |
| Ticker | Mkt cap | P/E | P/E fwd | P/S | P/S fwd | P/GP | P/GP fwd | EV/EBITDA | FCF yld |
|---|---|---|---|---|---|---|---|---|---|
ACDC | $902.8M | n/m | — | 0.5x | 0.5x | 11.1x | 9.9x | 15.8x | -6.7% |
RES | $1.5B | 65.8x | 26.8x | 0.8x | 0.8x | 8.6x | 8.4x | 6.1x | 2.7% |
WTTR | $2.3B | 76.7x | 31.7x | 1.6x | 1.5x | 8.4x | 7.7x | 10.7x | -3.6% |
| Ticker | Mkt cap | P/E | P/E fwd | P/S | P/S fwd | P/GP | P/GP fwd | EV/EBITDA | FCF yld |
|---|---|---|---|---|---|---|---|---|---|
OIS | $542.3M | n/m | 15.4x | 0.8x | 0.8x | 6.0x | 5.9x | 12.8x | 12.5% |
Consensus projections
| Ticker | FY2026E | FY2027E | FY2028E | |
|---|---|---|---|---|
LBRT | Revenue | +19.1% | +8.5% | +14.5% |
| EPS | −534.7% | −46.7% | +353.3% | |
HAL | Revenue | +2.0% | +5.4% | +4.3% |
| EPS | +3.1% | +23.2% | +16.1% | |
PUMP | Revenue | −2.0% | +16.8% | +11.7% |
| EPS | −37.4% | −1139.2% | +85.2% | |
SLB | Revenue | +4.1% | +7.8% | +6.7% |
| EPS | −13.9% | +28.6% | +15.5% | |
BKR | Revenue | +2.3% | +10.9% | +7.5% |
| EPS | +6.7% | +14.6% | +20.0% | |
NESR | Revenue | +41.8% | +22.0% | +18.3% |
| EPS | +111.9% | +47.6% | +29.2% | |
ACDC | Revenue | +4.6% | +10.8% | −4.3% |
| EPS | −22.0% | −44.0% | −78.7% | |
RES | Revenue | +12.5% | +2.1% | +2.7% |
| EPS | −15.0% | +4.1% | +35.2% | |
WTTR | Revenue | +12.0% | +4.8% | +6.2% |
| EPS | +169.0% | +11.4% | +59.6% | |
OIS | Revenue | −0.1% | +8.6% | — |
| EPS | +91.0% | +32.9% | — |
Forward fiscal years only. Blank means no analyst coverage for that year.
The meter turned back up
American frac crews went back to work in the first half of September. Primary Vision's count of active fracturing spreads, which had fallen four straight weeks to 178 in the week to 4 September, recovered to 184 and then 187 by 18 September — fifteen more crews than were working a year earlier. Over the same eight trading sessions Liberty Energy, the Denver pressure pumper that fracs and wirelines North American land wells and owns two Permian sand mines, lost 9.5% of its market value, and ProPetro, the Midland-based Permian frac and cementing specialist, lost 12.1%.
It is the second time this year the two pure plays have moved against their own activity meter, and the reason is not in their completions businesses. Both have spent the past year committing frac cash flow to gas-fired generation for data centers — capacity whose megawatts arrive between 2027 and 2029 while the deposits leave now. What the market is arguing about at Liberty is no longer what it charges per stage.
What the pumping dollar did
Liberty's June-quarter revenue rose 14% to $1.19bn and gross margin recovered to 17.5%, from 9.7% a year earlier and 6.2% in the March quarter. Chief executive Ron Gusek credited equipment mix rather than the cycle on the July 23 call: "we didn't give up as much price on that next-generation equipment over time. That had real durability to it," he told analysts.
Below the gross line the picture inverts. Operating income fell 70% to $12.7m, a 1.07% operating margin, because depreciation and maintenance on a fixed horsepower base consume almost everything the pumping hour earns. Liberty's annual operating margin has now compressed three years running — 16.0% in 2023, 8.9% in 2024, 2.0% in 2025 — on revenue that fell from $4.75bn to $4.01bn.
The power bill
Against $602m of consensus 2026 cash profit, Liberty is spending roughly $1.5bn of capital this year, most of the July increase being deposits on engines and turbines. It has locked three gigawatts of generating equipment through 2029 from Bergen Engines and Wärtsilä, targeting 17-18% unlevered returns funded through special-purpose vehicles, and ended June with $559m of cash against $736m of net debt. The $332.6m Wärtsilä supply contract signed on 22 June does not begin delivering until 2029.
What it does not have is a firm offtake. Its most contract-like commitment remains a January partnership with Vantage Data Centers anchored on a 400-megawatt reservation for 2027, and a separate 330-megawatt reservation was cancelled by the developer, with Liberty collecting termination fees. Barclays analyst Eddie Kim cut his target to $23 from $32 after the second quarter, writing that "the company has no energy service agreement or firm contract, which is what investors had been hoping for".
Halliburton prices the same stages
Halliburton — completion and production on one side, drilling fluids, bits and wireline on the other — is the test of whether per-stage economics are rolling over. Its Completion and Production unit earned $474m on $3.2bn of revenue in the June quarter, a 15% margin, up 8% sequentially, with North American revenue flat year on year but up 7% from the March quarter. For the third quarter it guided that segment's revenue flat to down 2% with margins up 125 to 175 basis points — expanding completion margins on shrinking completion revenue. Chief executive Jeff Miller told the July 21 call that pricing traction and filled white space in North America land supported that trajectory.
ProPetro is the counter-example among the pure plays. Revenue fell 6.2% to $305.8m, a fourth consecutive year-on-year decline, and it posted a $4.8m operating loss. Its power arm is further along than Liberty's — contracted capacity rose to about 350 megawatts from 240, including a 60-megawatt behind-the-meter hyperscaler site already generating positive earnings — but it is budgeting $400-450m for power against $125-145m for completions equipment. "We believe the outlook for our completions business continues to improve as market fundamentals tighten and pricing momentum builds," chief executive Sam Sledge said with the second-quarter results.
What the discount is actually for
Liberty is the cheapest of the three on enterprise value to trailing cash profit, at 6.83x against Halliburton's 8.26x and ProPetro's 8.11x, and trades at 0.75x trailing sales versus 1.36x in mid-May. That cheapness is an artifact of a measure that ignores the $1.5bn: on forward earnings Liberty is at 69.9x against 25.6x trailing, because consensus has earnings per share falling from $0.89 to $0.28, and its trailing free cash flow yield is minus 10%. Halliburton's forward multiple of 14.4x sits below its 17.6x trailing with a positive 6.1% cash yield. ProPetro is the richest of the three measured against gross profit, at 13.4x, while losing money at the operating line.
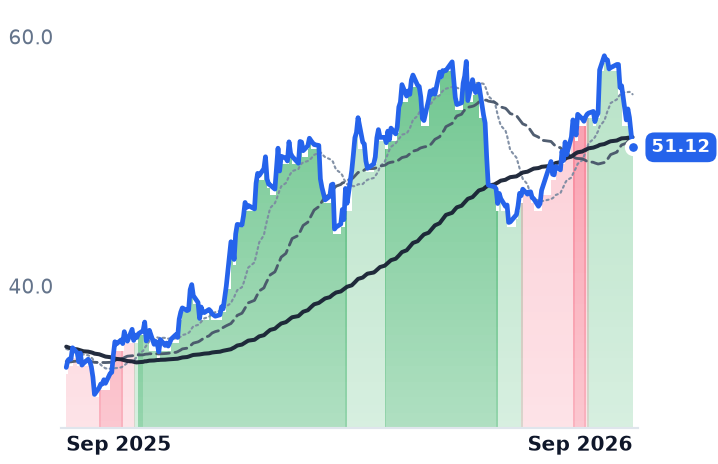
The two legs of the fade should not be conflated. Over three months the damage was specific — Liberty down 28.9% and ProPetro 29.0% while Halliburton slipped 3.7% and SLB rose 6.3% — and it is dated to a power budget without a contract. The last eight sessions were shared: SLB fell 11.5%, Baker Hughes 10.8%, Halliburton 8.6%, after the International Energy Agency on 11 September cut its 2026 world oil demand forecast a further 940,000 barrels a day to an annual decline of 2.5m. That leg belongs to crude. Neither leg is an indictment of the per-stage business, which by Halliburton's own guidance is getting better.
Liberty's first Wärtsilä engines are due in 2029. The pumping business has to pay for them every quarter between now and then.