

Planet Labs Grew Revenue 58% but Guided Down as Defense Buyers Await 2027 Funding
Hypothesis Opus 5 · Research Opus 5 · Writing Opus 5 · Prompt v1.6
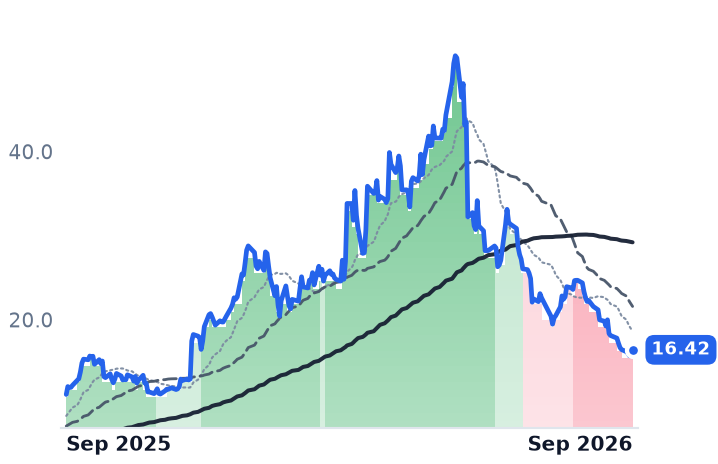
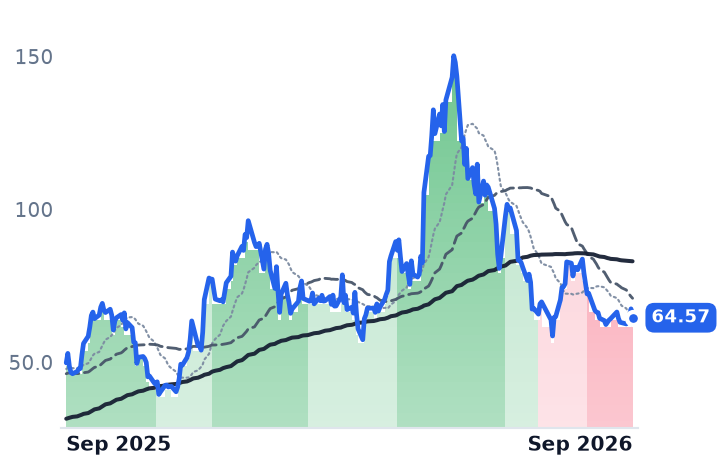
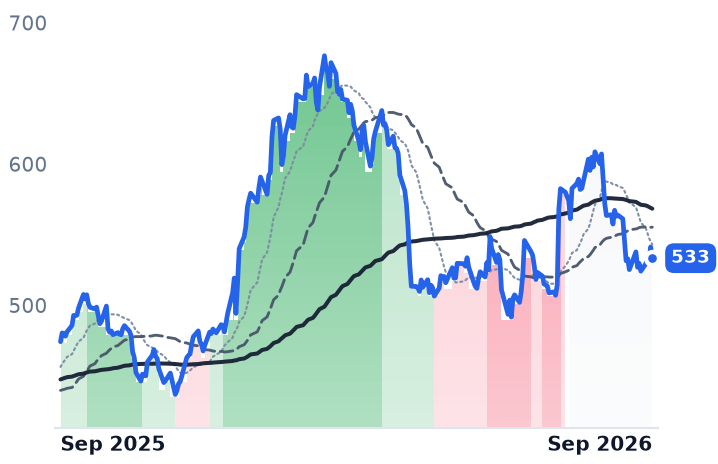
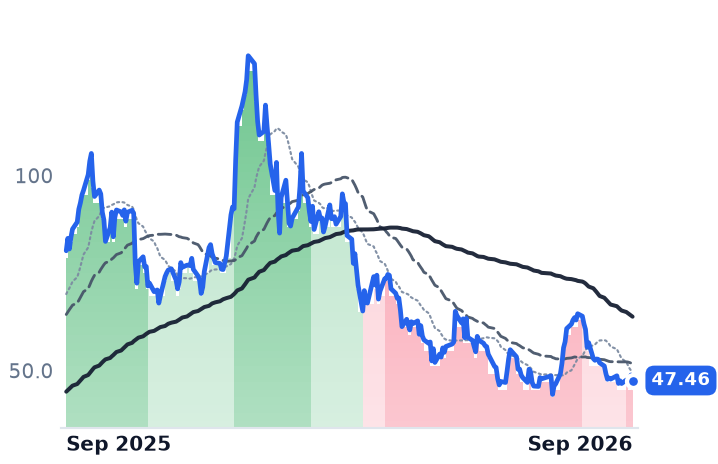
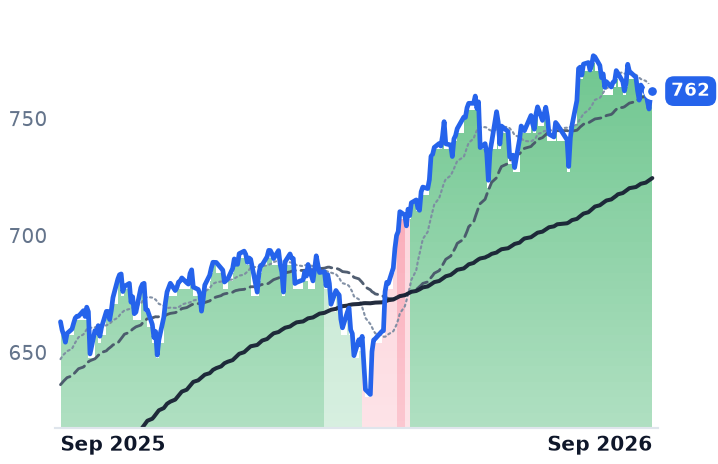
The fastest-growing company in commercial Earth imaging just had its worst month, and its own accounts do not explain it. Planet Labs' July-quarter revenue reached $116.1m and its operating loss narrowed to 11.6% of revenue from 24.5% a year earlier, yet the shares have fallen on eight of the nine sessions since the September 3 print and sit 68% below their May high.
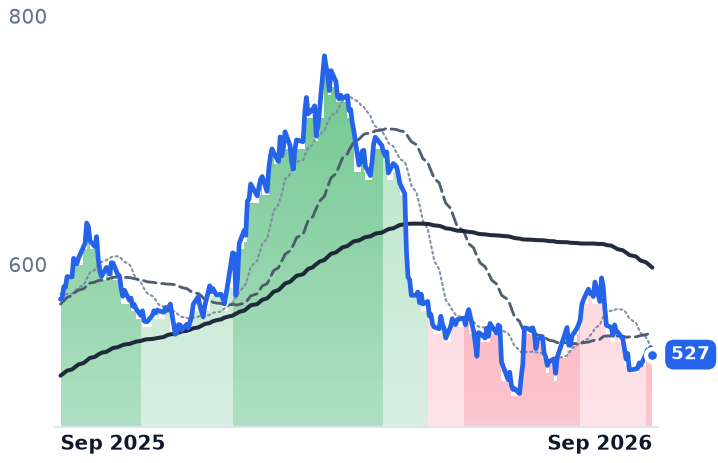
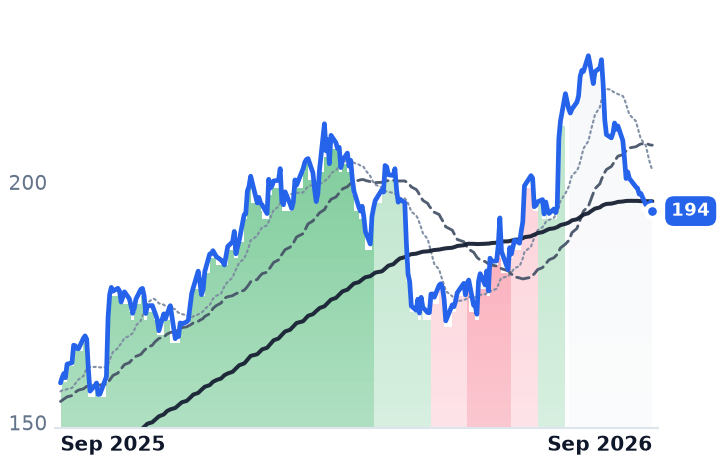
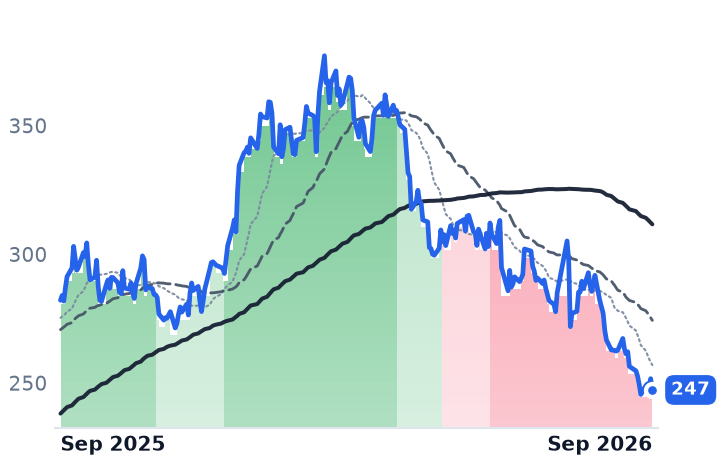
What moved alongside them was not other imagery names but the defense complex: Lockheed Martin, RTX and L3Harris all fell between 9% and 12% over the same thirty sessions while the S&P 500 was flat. Traders are pricing the risk that fiscal 2027 appropriations slip past the November midterms — and BlackSky told investors in August that its US subscription revenue was flat while international grew 150%.
The demand break is not visible; the composition wobble is. Planet's backlog grew 11% to roughly $815m and next quarter is guided below this one.
| Ticker | Company | Segment | Trend · 13mo | 30D | 1Y |
|---|---|---|---|---|---|
| The subject · what this brief is about | |||||
PL | Planet Labs PBC | Unmanned Systems & ISR | ⚠️ Emerging Bear | −26.3% | +47.8% |
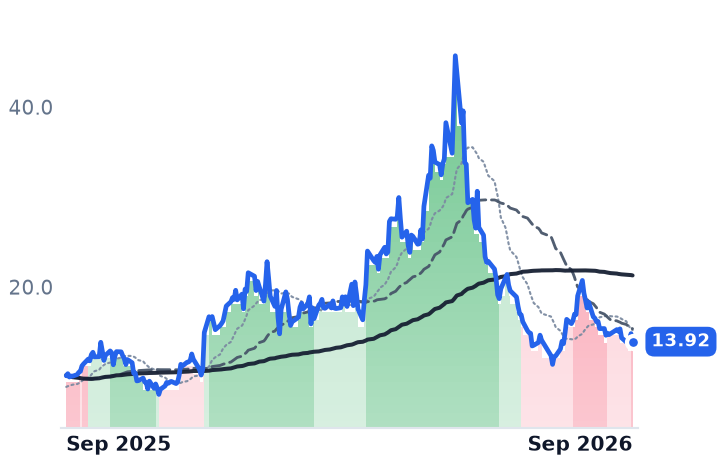
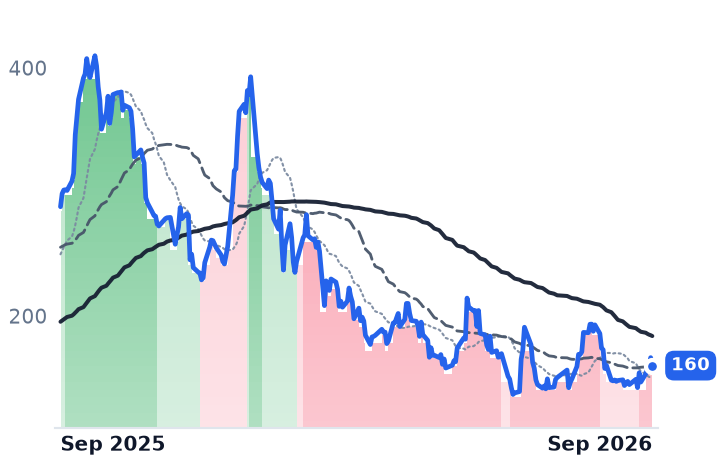
BKSY | BlackSky Technology | Specialty Manufacturing & Components | ⚠️ Emerging Bear | −21.9% | +3.7% |
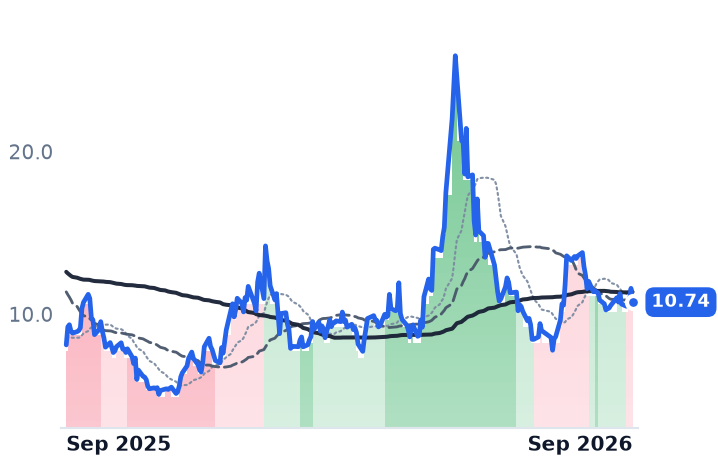
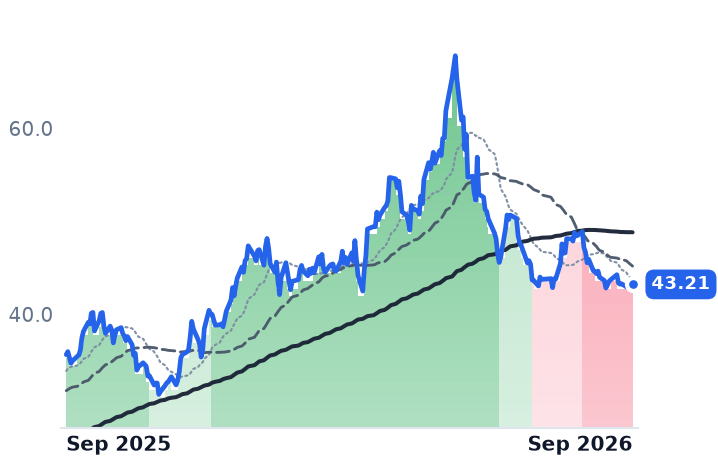
SATL | Satellogic | Specialty Manufacturing & Components | ⚠️ Emerging Bear | −10.7% | +40.4% |
| Compared against · context, not the story | |||||
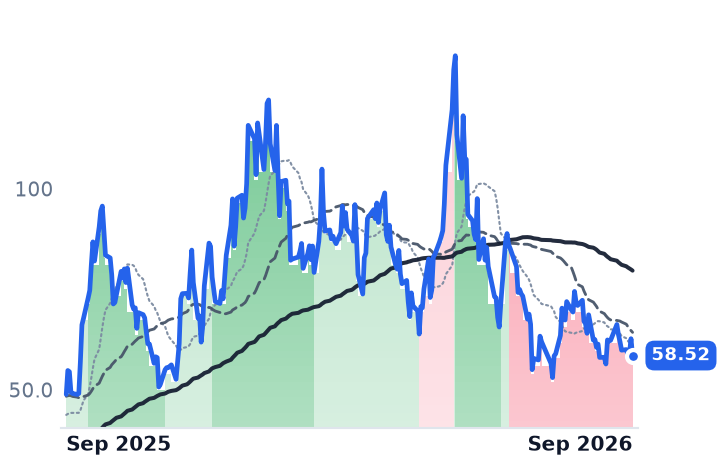
SPIR | Spire Global | Specialized Services | ⚠️ Emerging Bear | −18.2% | −0.1% |
RKLB | Rocket Lab USA | Unmanned Systems & ISR | ⚠️ Emerging Bear | −11.0% | +29.6% |
LUNR | Intuitive Machines | Space Systems & Launch | ⚠️ Emerging Bear | −24.0% | +37.4% |
RDW | Redwire | Space Systems & Launch | 🔴 Cont. Bear | −10.6% | +32.4% |
ASTS | AST SpaceMobile | Satellite & Broadband Services | ⚠️ Emerging Bear | −14.8% | +19.8% |
LMT | Lockheed Martin | Large Diversified Primes | ⚠️ Emerging Bear | −5.4% | +12.5% |
NOC | Northrop Grumman | Large Diversified Primes | ⚠️ Emerging Bear | −4.3% | −7.8% |
RTX | RTX | Large Diversified Primes | ⚠️ Emerging Bear | −7.6% | +22.6% |
LHX | L3Harris Technologies | Avionics & Electronic Systems | ⚠️ Emerging Bear | −7.3% | −12.4% |
KTOS | Kratos Defense & Security Solutions | Missiles, Weapons & Fire Control | ⚠️ Emerging Bear | −17.0% | −41.2% |
AVAV | AeroVironment | Unmanned Systems & ISR | 🔴 Cont. Bear | −0.2% | −44.5% |
UFO | Procure Space ETF | Asset Management | ⚠️ Emerging Bear | −5.9% | +21.2% |
ARKX | ARK Space & Defense Innovation ETF | Asset Management | ⚠️ Emerging Bear | −3.4% | +14.8% |
SPY | State Street SPDR S&P 500 ETF Trust | Asset Management | 🟢 Cont. Bull | −0.5% | +14.9% |
12-month price & trend
| Ticker | Mkt cap | P/E | P/E fwd | P/S | P/S fwd | P/GP | P/GP fwd | EV/EBITDA | FCF yld |
|---|---|---|---|---|---|---|---|---|---|
PL | $5.5B | n/m | — | 14.5x | 12.5x | 26.1x | 22.5x | n/m | 0.4% |
BKSY | $886.8M | n/m | — | 8.1x | 6.3x | 20.1x | 15.5x | n/m | -7.9% |
SATL | $703.4M | n/m | — | 22.0x | 15.0x | 27.9x | 19.0x | n/m | -6.0% |
| Ticker | Mkt cap | P/E | P/E fwd | P/S | P/S fwd | P/GP | P/GP fwd | EV/EBITDA | FCF yld |
|---|---|---|---|---|---|---|---|---|---|
SPIR | $367.0M | n/m | — | 5.9x | 4.6x | 15.6x | 12.2x | n/m | -29.6% |
RKLB | $72.2B | n/m | — | 106.3x | 79.7x | 290.7x | 218.0x | n/m | -0.4% |
LUNR | $2.3B | n/m | — | 4.7x | 2.5x | 17.1x | 9.1x | n/m | -8.3% |
| Ticker | Mkt cap | P/E | P/E fwd | P/S | P/S fwd | P/GP | P/GP fwd | EV/EBITDA | FCF yld |
|---|---|---|---|---|---|---|---|---|---|
RDW | $2.5B | n/m | — | 6.0x | 5.3x | 29.6x | 26.6x | n/m | -4.1% |
ASTS | $27.3B | n/m | — | 236.7x | 171.8x | — | — | n/m | -6.0% |
LMT | $119.0B | 24.8x | 17.2x | 1.6x | 1.5x | 16.1x | 15.3x | 17.0x | 4.8% |
| Ticker | Mkt cap | P/E | P/E fwd | P/S | P/S fwd | P/GP | P/GP fwd | EV/EBITDA | FCF yld |
|---|---|---|---|---|---|---|---|---|---|
NOC | $76.8B | 16.8x | 19.3x | 1.8x | 1.7x | 8.8x | 8.5x | 12.2x | 4.3% |
RTX | $285.3B | 36.8x | 29.2x | 3.1x | 3.0x | 15.0x | 14.6x | 19.7x | 4.2% |
LHX | $51.6B | 27.8x | 23.2x | 2.3x | 2.2x | 8.8x | 8.6x | 16.5x | 5.4% |
| Ticker | Mkt cap | P/E | P/E fwd | P/S | P/S fwd | P/GP | P/GP fwd | EV/EBITDA | FCF yld |
|---|---|---|---|---|---|---|---|---|---|
KTOS | $9.8B | 302.5x | 62.0x | 6.4x | 5.5x | 29.1x | 24.8x | 71.8x | -1.3% |
AVAV | $7.5B | n/m | 45.6x | 3.8x | 3.4x | 15.0x | 13.5x | n/m | -1.6% |
UFO | $177.4M | — | — | — | — | — | — | — | — |
| Ticker | Mkt cap | P/E | P/E fwd | P/S | P/S fwd | P/GP | P/GP fwd | EV/EBITDA | FCF yld |
|---|---|---|---|---|---|---|---|---|---|
ARKX | $543.3M | — | — | — | — | — | — | — | — |
SPY | $773.0B | — | — | — | — | — | — | — | — |
Consensus projections
| Ticker | FY2026E | FY2027E | FY2028E | |
|---|---|---|---|---|
PL | Revenue | +21.9% | +46.7% | +30.2% |
| EPS | −55.9% | −40.8% | −129.2% | |
BKSY | Revenue | +30.1% | +36.6% | +32.8% |
| EPS | −33.0% | −69.4% | −156.1% | |
SATL | Revenue | +206.4% | +35.8% | +48.3% |
| EPS | +207.0% | −96.5% | −257.1% | |
SPIR | Revenue | +12.4% | +24.6% | — |
| EPS | −48.5% | −61.6% | — | |
RKLB | Revenue | +51.0% | +39.0% | +27.0% |
| EPS | −41.8% | −100.1% | +68844.3% | |
LUNR | Revenue | +322.6% | +23.3% | +21.2% |
| EPS | +69.3% | −67.8% | −152.9% | |
RDW | Revenue | +44.6% | +18.7% | +21.2% |
| EPS | −55.6% | −52.4% | −57.9% | |
ASTS | Revenue | +172.1% | +330.7% | +167.9% |
| EPS | +37.1% | −48.4% | −180.2% | |
LMT | Revenue | +6.1% | +5.4% | +5.5% |
| EPS | +38.4% | +7.1% | +6.2% | |
NOC | Revenue | +5.1% | +6.7% | +6.1% |
| EPS | +7.2% | +7.9% | +8.6% | |
RTX | Revenue | +10.5% | +7.4% | +7.2% |
| EPS | +16.7% | +9.1% | +10.9% | |
LHX | Revenue | +3.2% | +7.3% | +7.0% |
| EPS | −18.5% | +12.2% | +13.9% | |
KTOS | Revenue | +34.7% | +23.3% | +21.7% |
| EPS | +57.7% | +34.4% | +28.7% | |
AVAV | Revenue | +140.3% | +15.9% | +15.0% |
| EPS | −5.6% | +13.3% | +37.2% |
Forward fiscal years only. Blank means no analyst coverage for that year.
Planet Labs reported the fastest revenue growth of its public life on September 3, and its shares closed that session lower, then fell on eight of the nine sessions that followed. Nothing the company disclosed in those two weeks was bad. What changed was who is expected to sign the checks.
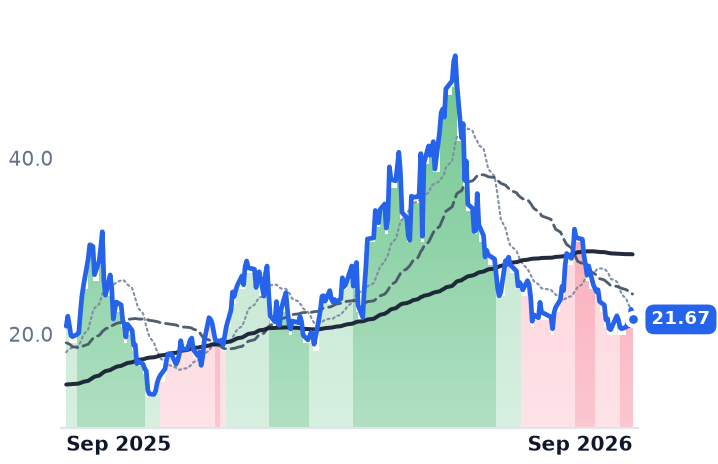
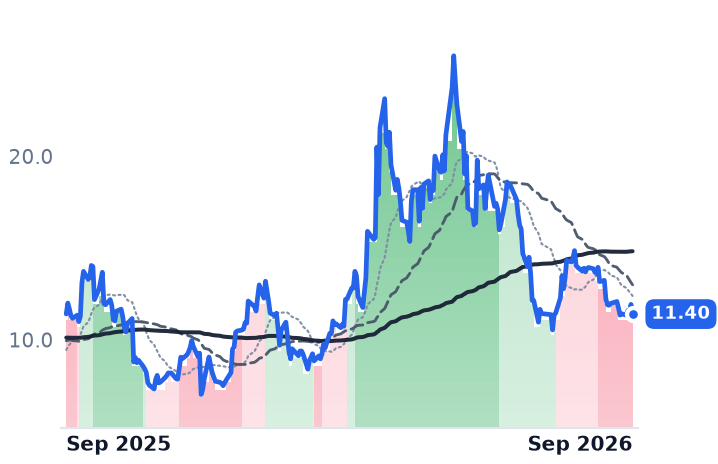
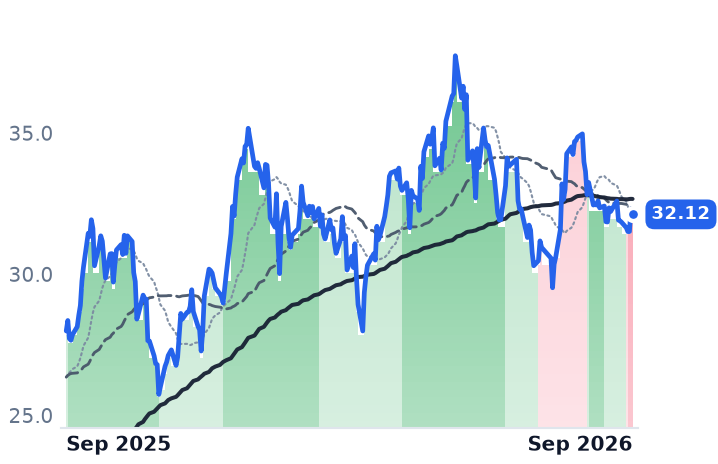
Over the thirty sessions to September 18, Planet — which operates the largest commercial Earth-imaging constellation and sells daily global coverage on subscription — fell 27.4%, and BlackSky, which sells tasked high-resolution imagery and analytics to government intelligence customers, fell 22.3%. The S&P 500 was flat. But so was almost nothing else in defense: Lockheed Martin and Northrop Grumman each fell 9.5%, RTX 12.0%, L3Harris 10.8%, Kratos 21.6%. Bloomberg reported on September 17 that traders are positioning for protracted negotiations and funding delays should Democrats take one or both houses in November, with the S&P Composite 1500 Aerospace & Defense index down 13% since February 27 against a near-10% gain in the broad market. Without a finalized appropriations bill, signed agreements cannot be fully funded — and Planet and BlackSky both hold ten-year National Reconnaissance Office imagery contracts structured as five-year bases plus one-year options running to 2032. Option years are exactly the line item a budget delay touches first.
What Planet's quarter actually said
Revenue growth has accelerated for four straight quarters, from 32.6% to 58.1%, producing a record $116.1m. The net loss shrank to $9.4m from $22.6m and the company posted its first adjusted profit, then raised fiscal 2027 guidance to $430m-$441m and capital spending to $100m-$115m for Pelican satellites and manufacturing.
The soft spot is composition. Roughly $30m of the quarter was a Swedish Armed Forces satellite handed over a quarter early — point-in-time revenue hit 12% of the total against 1% a year earlier — while remaining performance obligations grew about 9% and estimated backlog about 11%, to roughly $815m. Management guided the October quarter down sequentially to $101m-$105m, about 27% year-on-year growth. Demand for the data itself is not the issue: "No one has a sufficient number of Earth imaging satellites in the right kind of plane and all that to do a daily scan," chief executive Will Marshall told investors on September 3. "We're the only game in town."
BlackSky supplied the tell
BlackSky's June quarter grew 50% to $33.3m with adjusted EBITDA of $4.7m, and its subscription business crossed a $100m annualized run rate. Its deployment is on schedule — a fifth Gen-3 satellite reached first light in under 20 hours after launch on September 11, against a target of eight on orbit by year-end — and awards are being won, including a $99m Air Force Research Laboratory contract. What management said on August 6 matters more: international subscription revenue grew 150% and now exceeds 80% of funded backlog, US subscriptions were flat, and while fiscal 2026 government funding is visible, the fiscal 2027 outlook is not.
The part the decline has already priced
Gross margins differ too widely across these names for sales multiples to compare Planet with peers, so Planet is measured on gross profit: 26x trailing and roughly 23x forward, against 70x on May 3, while trailing gross profit grew about 21%. That is a 63% de-rating in four and a half months — but from a peak, and 26x gross profit is not cheap. BlackSky's reported June-quarter cost of revenue does not reconcile with its own description of expanded margins, so sales is the usable measure there: 8.1x trailing and 6.3x forward, against 10.9x in May.
Dilution is the other half. Planet's 26% single-day fall on June 5 was the day it filed a $1.5bn at-the-market shelf — around 27% of today's $5.47bn market value in authorized issuance, on top of a diluted share count already up 18.2% year on year. Some of that was drawn at $31.96, roughly double the current price. BlackSky raised $150m the same way and issued 21.5% more shares. With $865m of cash at Planet and above $325m of liquidity at BlackSky, the question is ownership, not survival.
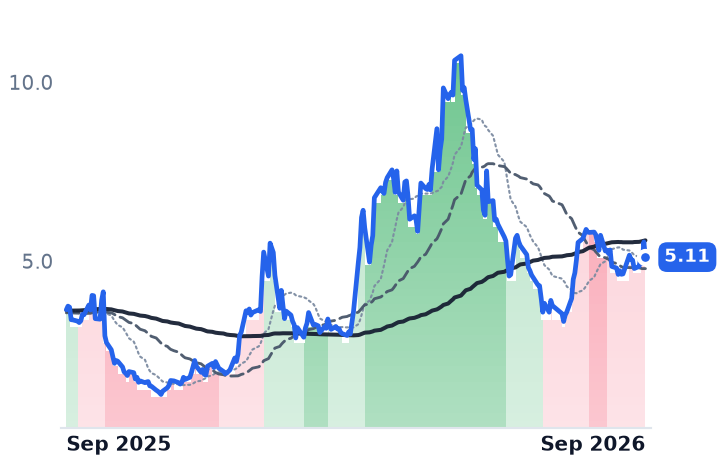
So the honest split: the guide-down and the 11% backlog growth earn part of Planet's fall, and the shelf earns the June gap. Nothing in either company's accounts earns the September grind, which tracked the primes almost session for session. Satellogic, which sells whole satellites rather than subscriptions, fell only 7.6% over the same stretch — the drawdown followed the government customer, not the orbital camera.
Planet's answer to the budget question has so far been to sell somewhere else: European defense work drove the record quarter, and Swedish and German contracts carried the growth that American subscriptions did not. The next print will show whether that is a hedge or the same trade denominated in euros.