

Intercontinental Exchange's Profit Grew 53% While Its Shares Fell 11% on Deal Spending
Hypothesis Opus 5 · Research Opus 5 · Writing Opus 5 · Prompt v1.6
One of the two largest American exchange owners is being priced as though its fee stream broke; its accounts say the opposite. Intercontinental Exchange's June-quarter revenue grew 10.7% year on year with operating income up more than half, recurring revenue reached a record near $1.35bn — roughly half the total — and consensus has earnings per share up 17% this year to $8.10. The shares are lower than a year ago.
What the market objected to is dated and specific: on July 30 ICE paired record results with a $5.7bn cash purchase of MarketAxess and heavier spending, and the stock slipped that day. Trailing earnings are now capitalized at 21.9 times against roughly 31 times at the end of 2024.
CME, the counterexample, is up over the same year: record first half, market-data revenue up 20%. The compression sits in ratings and analytics names — S&P Global and Morningstar — not in venues that clear contracts.
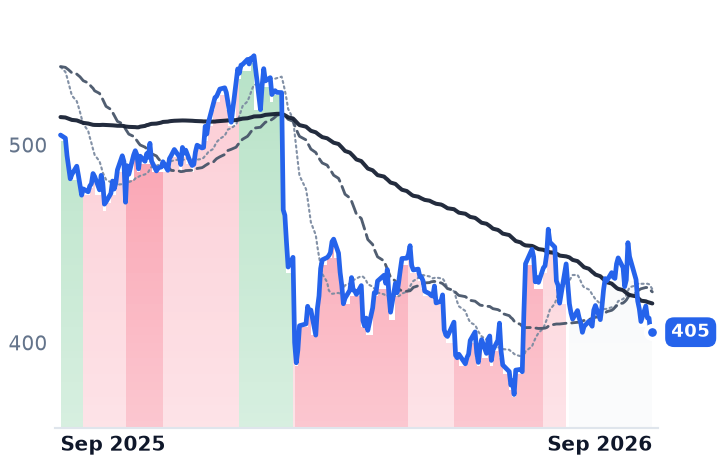
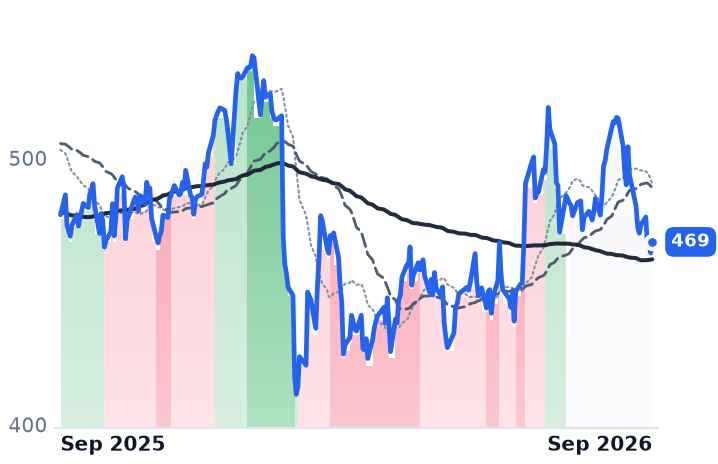
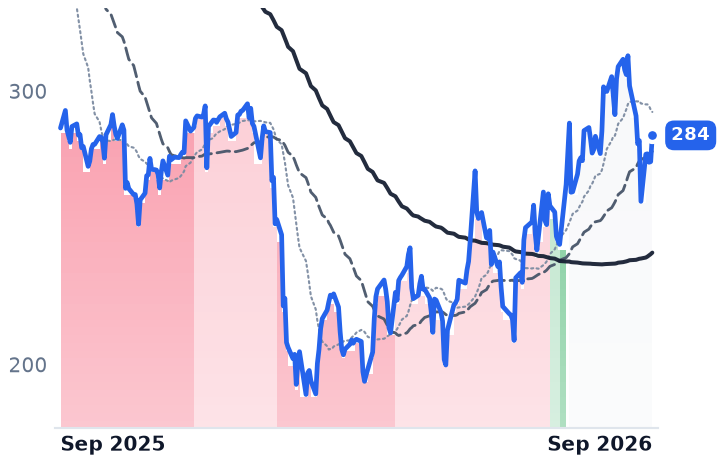
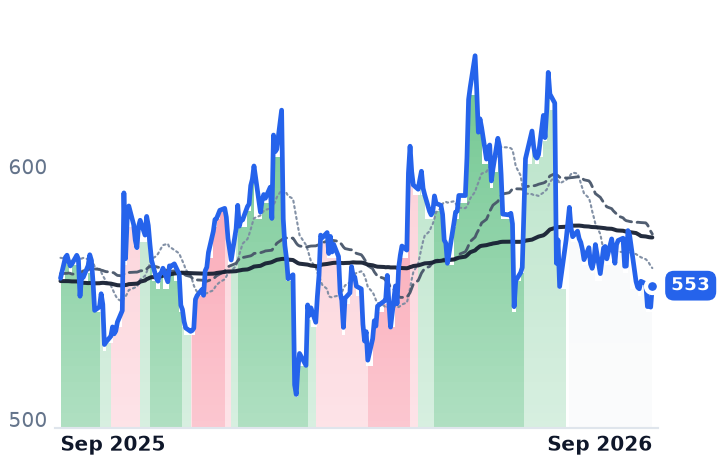
| Ticker | Company | Segment | Trend · 13mo | 30D | 1Y |
|---|---|---|---|---|---|
| The subject · what this brief is about | |||||
ICE | Intercontinental Exchange | Exchange & Clearing | 🔴 Cont. Bear | −2.0% | −7.9% |
CME | CME | Exchange & Clearing | ⚠️ Emerging Bear | +1.9% | +8.6% |
| Compared against · context, not the story | |||||
TW | Tradeweb Markets | Trading Platforms & Market Infrastructure | 🔴 Cont. Bear | −2.0% | −7.0% |
MORN | Morningstar | Investment Data & Analytics | 🌱 Emerging Bull | −5.4% | −12.7% |
SPGI | S&P Global | Credit Ratings | 🔴 Cont. Bear | −6.3% | −19.7% |
MCO | Moody's | Credit Ratings | 🌱 Emerging Bull | −6.1% | −2.1% |
FDS | FactSet Research Systems | Investment Data & Analytics | 🌱 Emerging Bull | −5.4% | −0.9% |
MSCI | MSCI | Investment Data & Analytics | 🟢 Cont. Bull | −2.7% | −0.5% |
NDAQ | Nasdaq | Exchange & Clearing | ⚠️ Emerging Bear | −4.7% | +5.1% |
12-month price & trend
| Ticker | Mkt cap | P/E | P/E fwd | P/S | P/S fwd | P/GP | P/GP fwd | EV/EBITDA | FCF yld |
|---|---|---|---|---|---|---|---|---|---|
ICE | $87.3B | 21.9x | 19.2x | 6.5x | 7.9x | 8.9x | 10.8x | 15.3x | 5.6% |
CME | $99.2B | 23.3x | 22.5x | 14.7x | 14.1x | 17.9x | 17.3x | 18.7x | 4.2% |
TW | $22.1B | 24.8x | 25.9x | 10.0x | 9.4x | 14.7x | 13.9x | 13.3x | 4.8% |
| Ticker | Mkt cap | P/E | P/E fwd | P/S | P/S fwd | P/GP | P/GP fwd | EV/EBITDA | FCF yld |
|---|---|---|---|---|---|---|---|---|---|
MORN | $7.6B | 19.2x | 16.6x | 3.0x | 2.9x | 4.8x | 4.6x | 11.2x | 6.5% |
SPGI | $119.3B | 25.1x | 20.5x | 7.6x | 7.2x | 10.8x | 10.3x | 16.8x | 4.7% |
MCO | $74.9B | 30.4x | 25.7x | 9.5x | 9.1x | 13.7x | 13.0x | 20.4x | 4.0% |
| Ticker | Mkt cap | P/E | P/E fwd | P/S | P/S fwd | P/GP | P/GP fwd | EV/EBITDA | FCF yld |
|---|---|---|---|---|---|---|---|---|---|
FDS | $10.6B | 19.5x | 16.8x | 4.3x | 4.3x | 8.5x | 8.4x | 12.4x | 6.7% |
MSCI | $41.1B | 31.1x | 28.7x | 12.3x | 11.7x | 14.9x | 14.1x | 23.1x | 3.9% |
NDAQ | $51.5B | 27.0x | 23.2x | 6.2x | 8.9x | 11.4x | 16.3x | 19.4x | 3.9% |
Consensus projections
| Ticker | FY2026E | FY2027E | FY2028E | |
|---|---|---|---|---|
ICE | Revenue | +11.5% | +5.8% | +6.5% |
| EPS | +17.0% | +8.8% | +11.9% | |
CME | Revenue | +7.7% | +5.1% | +6.5% |
| EPS | +9.6% | +5.5% | +7.3% | |
TW | Revenue | +14.0% | +11.8% | +10.2% |
| EPS | +16.7% | +13.8% | +13.5% | |
MORN | Revenue | +9.0% | +5.7% | +6.0% |
| EPS | +30.6% | +13.2% | +17.9% | |
SPGI | Revenue | +7.7% | +7.2% | +7.3% |
| EPS | +9.9% | +13.3% | +14.0% | |
MCO | Revenue | +7.2% | +7.6% | +7.7% |
| EPS | +13.5% | +11.6% | +11.0% | |
FDS | Revenue | +6.5% | +5.8% | +6.3% |
| EPS | +4.2% | +10.2% | +11.5% | |
MSCI | Revenue | +12.0% | +8.7% | +8.6% |
| EPS | +14.5% | +14.0% | +13.7% | |
NDAQ | Revenue | +10.2% | +8.4% | +8.0% |
| EPS | +14.6% | +12.7% | +14.1% |
Forward fiscal years only. Blank means no analyst coverage for that year.
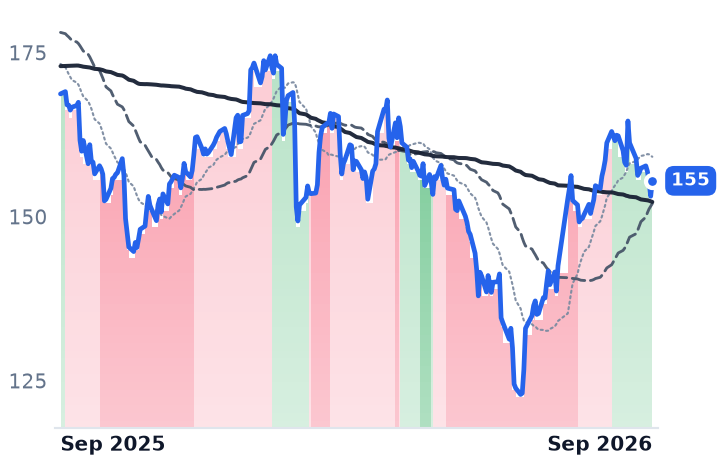
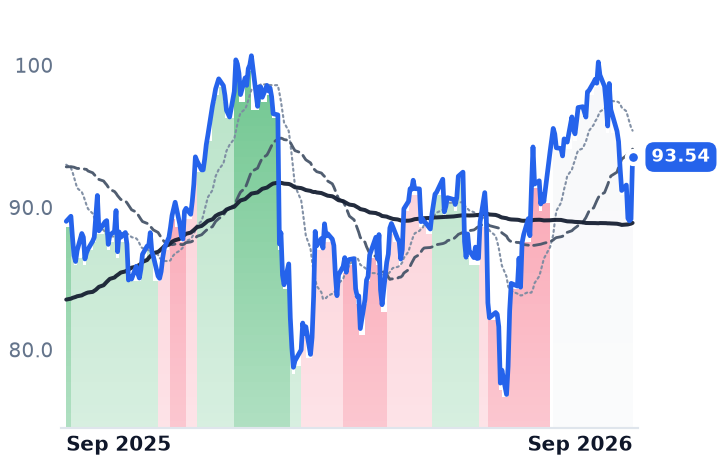
Intercontinental Exchange, which owns the New York Stock Exchange, a fixed-income data franchise and the Encompass mortgage-origination platform, earned more in the June quarter than in any quarter of its history and still trades below where it did a year ago. Revenue grew 10.7% year on year and operating income grew 53%, lifting the operating margin to 55.0% from 39.8%. The shares are down about 11% over twelve months.
That gap is not an argument about the fee stream. It is an argument about what ICE is doing with the cash the fee stream produces, and it has a date: on July 30 the company reported adjusted earnings of $1.90 a share against $1.88 expected and, in the same breath, agreed to buy MarketAxess for $167 a share in cash — a 33% premium, about $5.7bn of enterprise value. ICE fell 1.3% that session, with elevated spending plans and the size of the deal cited as the objections.
What ICE actually sells
Of $2.7bn in second-quarter net revenue, a record roughly $1.35bn was recurring and grew 8% in constant currency: exchange data and connectivity of $416m, up 10%, and Fixed Income and Data Services recurring revenue of $531m, also up 10%. Guidance is for 7% to 8% recurring growth in the data segment.
The per-loan meter is the part that should be broken and isn't quite. Mortgage Technology revenue reached $557m, up 5%, with transaction revenue up 11% as Encompass closed-loan revenue outran industry origination volumes and customers exceeded contractual minimums — share taken in a frozen market rather than a refinancing wave. There is no wave coming soon: the Federal Reserve raised rates in September for the first time since 2023, and the 30-year fixed mortgage averaged 6.95%.
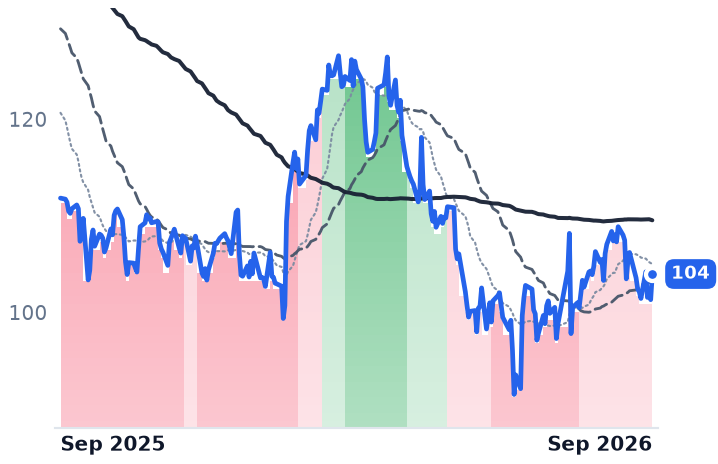
MarketAxess was acquirable because it was losing. In June 2026 it fell behind Tradeweb in US credit electronic-trading share for the first time. "We were late to getting into the execution of fixed income securities," founder and chief executive Jeffrey Sprecher said on the July 30 call, per Markets Media. Tradeweb, the rival that gains a better-capitalized competitor, grew revenue 9.0% to $558.9m last quarter at a 43.9% operating margin and is capitalized at 24.8 times trailing earnings — richer than the acquirer.
CME did not de-rate
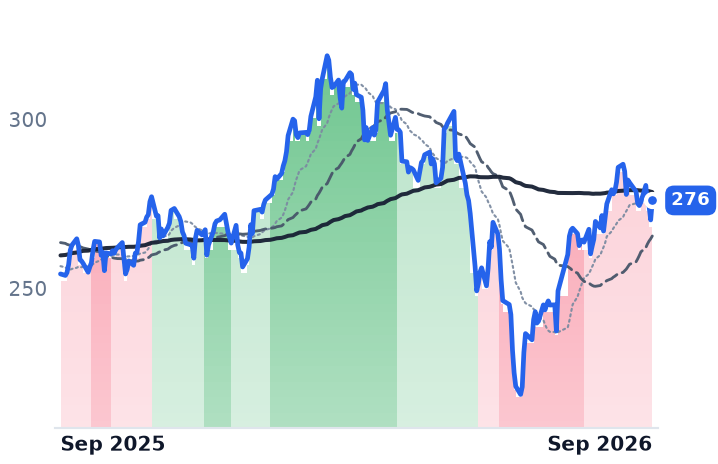
CME Group, which runs the futures markets and clearing houses for interest rates, equity indexes, energy and agriculture, is up 5.2% over the same twelve months. Second-quarter volume averaged 29.8 million contracts a day, the second-highest second quarter on record, and market data — billed per screen and per license — was the fastest-growing line at a record $238m, up 20%. The average fee earned per contract was $0.678, down from $0.690 a year earlier but up from $0.652 in the March quarter, which CME attributes to volume tiering and member mix. Investment income on the cash collateral members must post fell 6%, on a lower average rate of return against higher balances — a headwind that a hiking Fed reverses.
"The first half of 2026 was the strongest in CME Group's history," chairman and chief executive Terry Duffy told investors on the July 22 call; chief financial officer Lynne Fitzpatrick, who becomes CEO in March 2027, put first-half volume 10% ahead and revenue up 8%. CME trades at 23.3 times trailing and 22.5 times forward earnings, against 24.0 times its 2024 earnings at that year's close — its price has roughly tracked its earnings, which grew 14.1% on a trailing basis.
Where the de-rating really sits
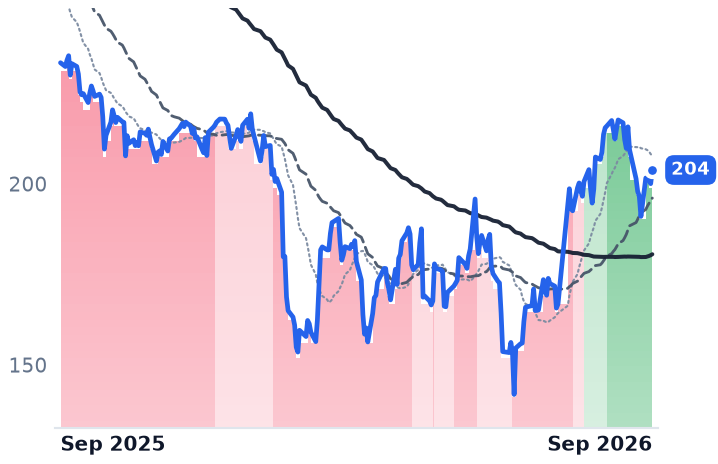
It is not in everything that sells a data feed. Over twelve months S&P Global is down 25.1%, Morningstar 20.7% and FactSet 17.8%, while Nasdaq is up 1.1%. The catalyst is identifiable: S&P Global fell as much as 13% on 2026 guidance of $19.40 to $19.65 a share against $19.96 expected, dragging peers with it. Morningstar, whose PitchBook and research subscriptions grew revenue 9.6% to $663.2m with operating margin widening to 24.2%, is capitalized at 16.6 times forward earnings. Subscription analytics got marked down on client spending; venues that clear contracts did not.
So ICE's operating record earns the 26.5% recovery from its June 29 low of $122.91. What nothing in the accounts explains is the remaining distance to its own history — 19.2 times this year's expected earnings against 28.1 times at the end of 2025. The honest reading is that the market is charging ICE today for leverage of about 3.4 times gross that arrives only when MarketAxess closes, and discounting a trailing earnings base flattered by one unusually high-margin March quarter. Both objections are dated, and both expire.
The deal is not expected to complete until the first half of 2027. Until then ICE is being priced on a balance sheet it does not yet have.