

US Frac Crews Fell a Fourth Week to 178 Even as Crude Rallied 40%
Hypothesis Opus 5 · Research Opus 5 · Writing Opus 5 · Prompt v1.6
The physical business of fracking American wells kept shrinking through an oil rally that should have turned it around, and the four companies most exposed to it have gained ground since late August on contracts to sell electricity instead.
Primary Vision's crew count fell for a fourth straight week in the week to September 4, the fewest since May, while Permian drilled-but-uncompleted wells are down about 32% from a year ago to 783. Atlas Energy Solutions sold proppant at $17.70 a ton against $12.39 of plant cost and guided third-quarter profit below what it had just delivered. Solaris Energy Infrastructure now takes 72% of revenue from power.
The judgment: none of the recent share gains is earned by fracking, and consensus dates the payoff on Liberty's and ProPetro's power spending to 2028.
| Ticker | Company | Segment | Trend · 13mo | 30D | 1Y |
|---|---|---|---|---|---|
| The subject · what this brief is about | |||||
LBRT | Liberty Energy | Well Services & Stimulation | ⚠️ Emerging Bear | −1.6% | +97.6% |
PUMP | ProPetro | Well Services & Stimulation | ⚠️ Emerging Bear | −1.1% | +145.7% |
| Compared against · context, not the story | |||||
AESI | Atlas Energy Solutions | Proppant & Logistics | 🔴 Cont. Bear | +18.6% | +31.3% |
SEI | Solaris Energy Infrastructure | Proppant & Logistics | ⚠️ Emerging Bear | +11.4% | +123.6% |
HAL | Halliburton | Well Services & Stimulation | ⚠️ Emerging Bear | +7.7% | +61.6% |
SLB | Slb | Well Services & Stimulation | ⚠️ Emerging Bear | +7.0% | +58.9% |
BKR | Baker Hughes | Well Services & Stimulation | 🟢 Cont. Bull | −10.0% | +24.3% |
NESR | National Energy Services Reunited | Well Services & Stimulation | 🟢 Cont. Bull | −6.1% | +228.4% |
ACDC | ProFrac | Well Services & Stimulation | 🔴 Cont. Bear | −3.1% | +39.7% |
RES | RPC | Well Services & Stimulation | ⚠️ Emerging Bear | +2.9% | +46.9% |
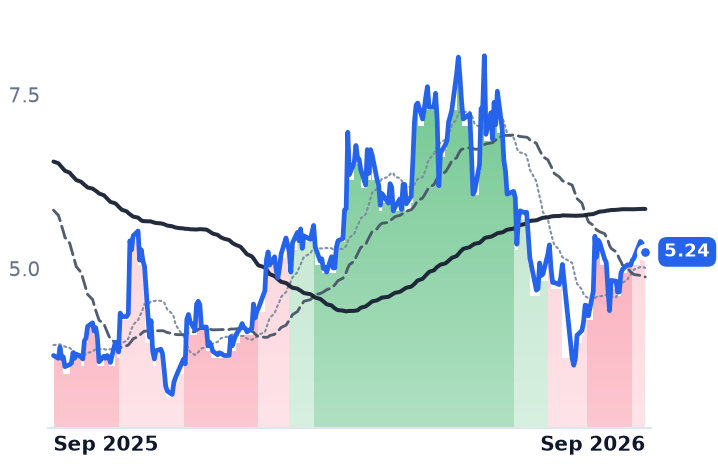
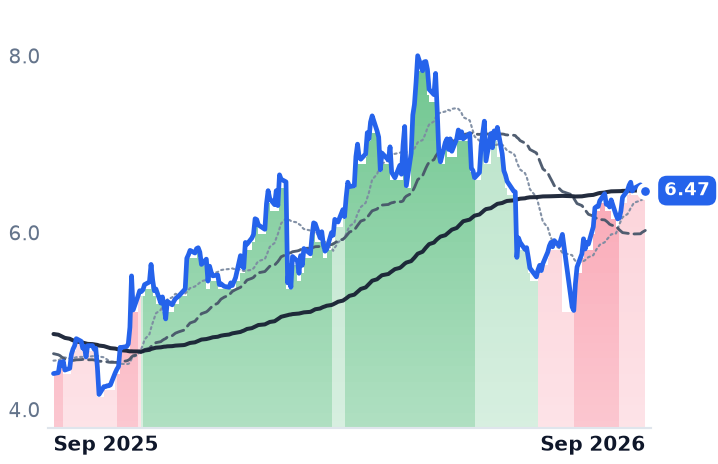
12-month price & trend
| Ticker | Mkt cap | P/E | P/E fwd | P/S | P/S fwd | P/GP | P/GP fwd | EV/EBITDA | FCF yld |
|---|---|---|---|---|---|---|---|---|---|
LBRT | $3.4B | 27.8x | 75.9x | 0.8x | 0.7x | 6.3x | 5.8x | 7.3x | -9.3% |
PUMP | $1.4B | n/m | — | 1.2x | 1.1x | 14.6x | 13.7x | 8.8x | -1.6% |
AESI | $1.8B | n/m | — | 1.7x | 1.6x | 39.8x | 38.2x | 23.1x | -10.4% |
| Ticker | Mkt cap | P/E | P/E fwd | P/S | P/S fwd | P/GP | P/GP fwd | EV/EBITDA | FCF yld |
|---|---|---|---|---|---|---|---|---|---|
SEI | $4.1B | 66.0x | 59.2x | 5.4x | 4.7x | 13.3x | 11.4x | 23.7x | -17.6% |
HAL | $29.3B | 18.3x | 14.9x | 1.3x | 1.3x | 8.7x | 8.7x | 8.5x | 5.9% |
SLB | $79.5B | 25.7x | 21.6x | 2.2x | 2.2x | 13.2x | 13.0x | 12.5x | 5.7% |
| Ticker | Mkt cap | P/E | P/E fwd | P/S | P/S fwd | P/GP | P/GP fwd | EV/EBITDA | FCF yld |
|---|---|---|---|---|---|---|---|---|---|
BKR | $62.0B | 19.9x | 23.7x | 2.2x | 2.2x | 9.5x | 9.4x | 13.2x | 5.0% |
NESR | $2.6B | 39.7x | 15.9x | 1.8x | 1.4x | 16.0x | 12.4x | 11.0x | 4.9% |
ACDC | $902.8M | n/m | — | 0.5x | 0.5x | 11.1x | 9.9x | 15.8x | -6.7% |
| Ticker | Mkt cap | P/E | P/E fwd | P/S | P/S fwd | P/GP | P/GP fwd | EV/EBITDA | FCF yld |
|---|---|---|---|---|---|---|---|---|---|
RES | $1.5B | 65.8x | 26.8x | 0.8x | 0.8x | 8.6x | 8.4x | 6.1x | 2.7% |
Consensus projections
| Ticker | FY2026E | FY2027E | FY2028E | |
|---|---|---|---|---|
LBRT | Revenue | +19.1% | +8.7% | +15.3% |
| EPS | −534.1% | −39.9% | +311.7% | |
PUMP | Revenue | −2.1% | +17.8% | +11.4% |
| EPS | −79.2% | −3223.9% | +224.7% | |
AESI | Revenue | +2.5% | +14.8% | +18.8% |
| EPS | +109.2% | −80.1% | −299.1% | |
SEI | Revenue | +46.0% | +56.2% | +35.5% |
| EPS | +2.5% | +101.2% | +102.7% | |
HAL | Revenue | +2.0% | +5.5% | +4.2% |
| EPS | +3.2% | +23.5% | +16.0% | |
SLB | Revenue | +4.0% | +7.6% | +6.1% |
| EPS | −13.9% | +29.2% | +16.0% | |
BKR | Revenue | +2.3% | +10.9% | +7.5% |
| EPS | +6.7% | +14.6% | +20.0% | |
NESR | Revenue | +41.8% | +22.0% | +18.3% |
| EPS | +111.9% | +47.6% | +29.2% | |
ACDC | Revenue | +4.6% | +10.8% | −4.3% |
| EPS | −22.0% | −44.0% | −78.7% | |
RES | Revenue | +12.5% | +2.1% | +2.7% |
| EPS | −15.0% | +4.1% | +35.2% |
Forward fiscal years only. Blank means no analyst coverage for that year.
American oil is quoted near $96 a barrel and American completion crews are being laid down anyway. Primary Vision counted 178 active frac spreads in the week ending September 4, a fourth consecutive weekly decline and the lowest reading since May. Crude has rallied roughly 40% on the Iran war over the same stretch.
That decoupling is the mechanism worth understanding. What buys a frac crew is not the oil price but a producer's willingness to spend, the stock of wells already drilled and waiting, and — for gas-directed work — Henry Hub, quoted at $2.87 per million British thermal units on September 9. Permian drilled-but-uncompleted wells stand at 783, down about 32% from July 2025: the buffer that let crews work without new drilling has been consumed. Every company selling into that market has responded the same way — by putting its capital into power generation.
The sand tells it plainly
Atlas Energy Solutions, which mines and delivers Permian proppant, sold sand at an average $17.70 a ton in the second quarter against plant operating costs of $12.39, on volumes of 5.6m tons that were flat sequentially. It guided third-quarter adjusted profit to $30-45m after delivering $49.5m. Gross margin went from 18.06% a year earlier to 5.92%, and the quarter carried an operating loss of $20m.
Chief financial officer Blake McCarthy told investors on the August 3 call that nameplate capacity across the industry overstates what can actually be produced after years of deferred maintenance: "What we're trying to do... is shine a light on the true productive capacity of the market... Some customers may prioritize the lowest cost option on paper, which, in our opinion, will highlight the difference between the service providers who can deliver and those who simply cannot." Atlas has also signed a 120-megawatt power purchase agreement at Socorro, Texas, for about $190m of project capital and roughly $55m of expected annualized free cash flow.
The pumpers are already power companies
Liberty Energy, the Denver pressure pumper that also owns two Permian sand mines, grew second-quarter revenue 14% to $1.19bn — and earned an operating margin of 1.07% doing it, with operating income down 70% to $12.7m. Over three years its annual operating margin has gone 15.96%, 8.90%, 2.03%. Trailing free cash flow yield is -9.26%; 2026 capital spending of about $1.5bn sits against the $607m of EBITDA consensus models for the year, and the board still declared a $0.09 dividend payable September 18.
Chief executive Ron Gusek, on the July 23 call, said the equipment mix matters more than the cycle: "we didn't give up as much price on that next-generation equipment over time. That had real durability to it." Liberty has committed to Wärtsilä and Bergen engine orders and a joint venture with PowerBridge behind a 3-gigawatt target for 2029.
ProPetro, the Midland pumper, has posted four straight year-on-year revenue declines and a second-quarter operating loss of $4.8m — while its deployed fleet count went 11 to 12 to 13 and adjusted profit rose 23% sequentially to $45m. Its 2026 budget allocates $400-450m to the PROPWR power arm against $125-145m for completions equipment, and contracted power capacity rose from 240 to 350 megawatts in the quarter. Management said on the July 29 call that Permian frac capacity is "basically spoken for" and that most contracted horsepower renews within six to nine months.
Solaris Energy Infrastructure has completed the journey. Power Solutions delivered $158m of its $219.4m of second-quarter revenue, with 2.3 gigawatts under long-term contract, while legacy sand logistics fell 10%. On September 8 it raised third-quarter guidance to $110-130m and initiated first-quarter 2027 guidance of $200-240m; the shares rose 16.5% that day.
What the shares have done, and what earns it
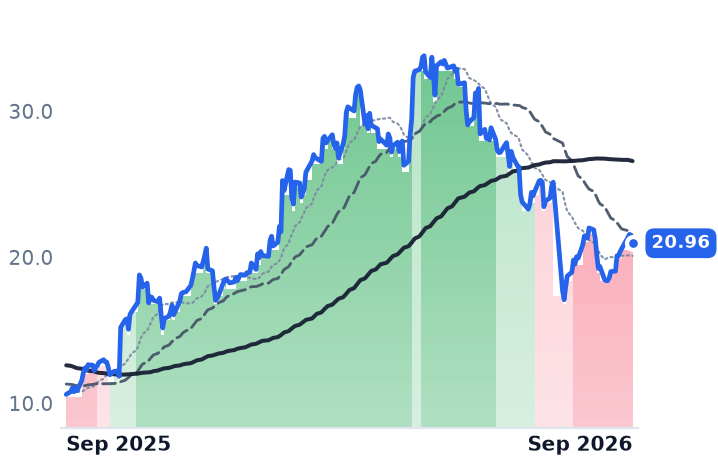
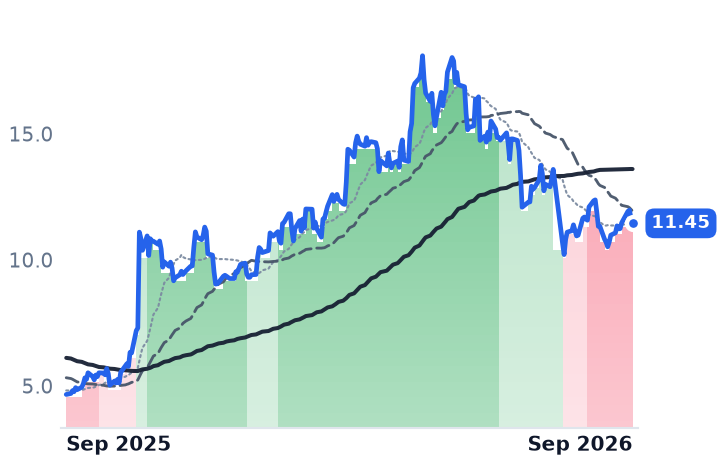
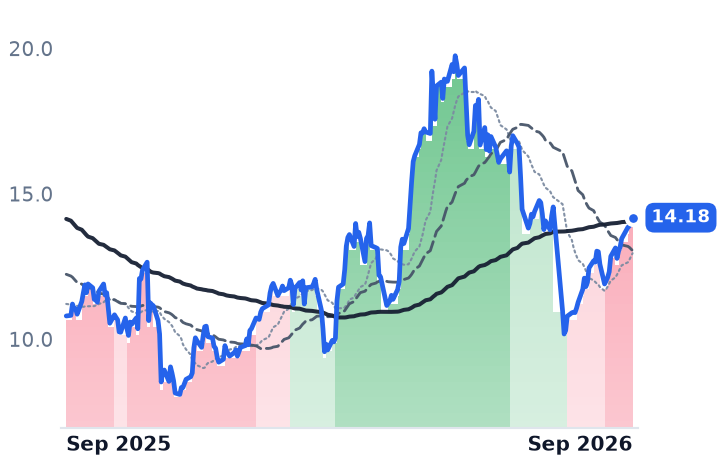
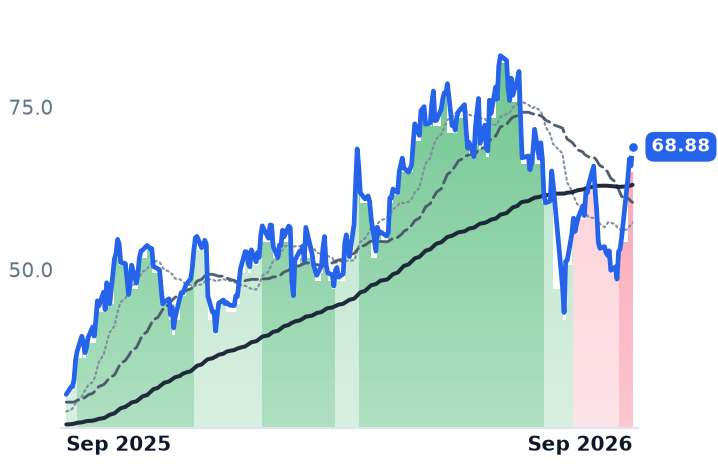
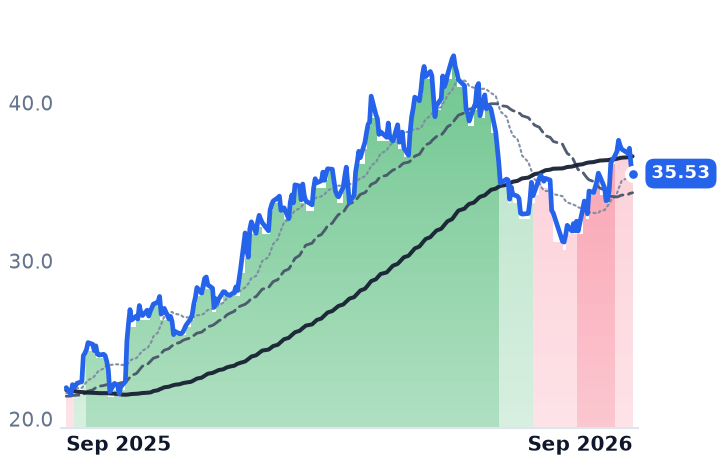
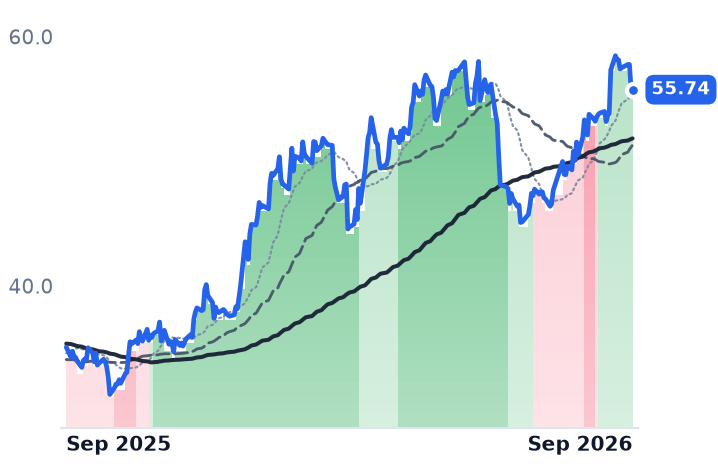
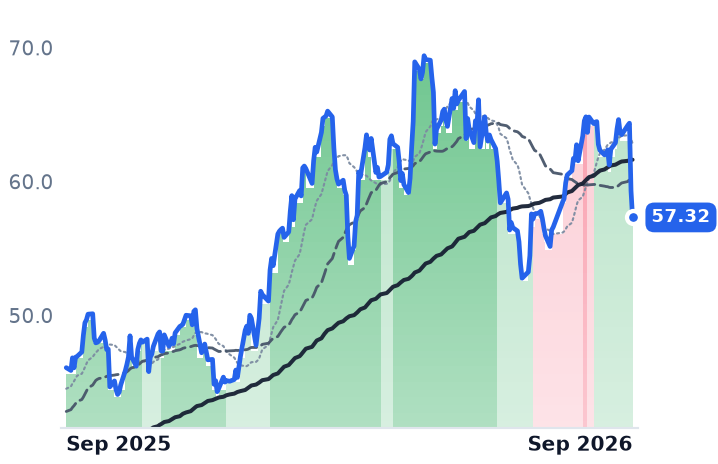
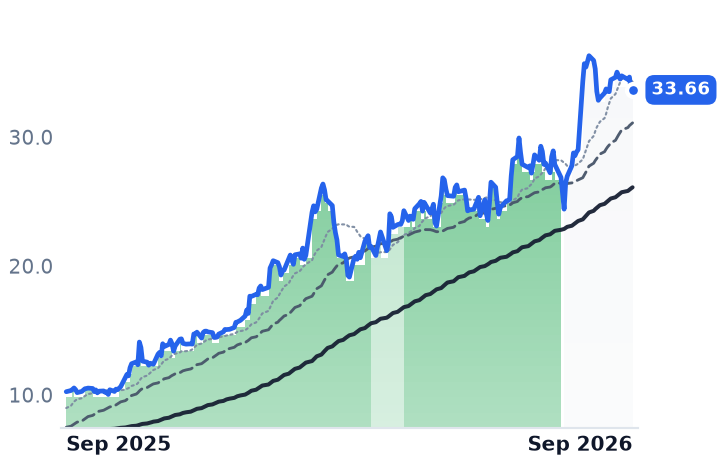
Liberty is down 25.2% over three months and ProPetro 22.5%, both gapping lower in late July when Liberty raised its capital budget. But all four bottomed in the last three weeks: Liberty is 13.9% above its August 26 low, ProPetro 8.8%, Atlas 19.2%, Solaris 41.9%.
None of that rebound is fracking. Stage counts are still falling, sand pricing is still compressing, and crude at $96 has not changed either. What rebid these shares is contracted megawatts — and only Solaris and Atlas have contracts with revenue already attached. Liberty and ProPetro are spending now against consensus that puts the step-up in 2028: Liberty's modeled EBITDA falls from $607m this year to $573m next before reaching $994m, and ProPetro's goes $189m to $204m to $383m. On enterprise value to EBITDA the pumpers trade at 7.26x and 8.82x, the loss-maker at the premium, while Atlas and Solaris carry 23.1x and 23.7x on the strength of power books that are mostly still ahead of them.
The Permian's 783 remaining drilled-but-uncompleted wells are the one number here that cannot be contracted forward. When that inventory is gone, a stage has to be drilled before it can be pumped, and no data-center offtake changes the order of operations.