

Venture Global's Capacity Roughly Doubles by 2027; Consensus Cuts Its Earnings 52%
Hypothesis Opus 5 · Research Opus 5 · Writing Opus 5 · Prompt v1.6
Venture Global is earning its best margins on cargoes it is not yet contractually obliged to deliver, and the forecasts say that ends. The company lifted 2026 consolidated adjusted EBITDA guidance to $8.7–9.1bn struck explicitly against a market liquefaction fee of $12.50–13.50 per million British thermal units — a spot spread, not a toll. A $1 move in that fee is worth $180–210m to this year's EBITDA and $650–700m to 2027's.
Consensus already prices the conversion: FY2027 revenue falling 13.8% and earnings per share falling to $0.807 even as Plaquemines and CP2 roughly double physical capacity. Cheniere is the control on the same gas price — under 1 million tonnes unsold for 2026, and a $1 margin move worth less than $50m. The shares moved the other way: Venture Global up 16.1% in thirty days, Cheniere up 3.6%.
| Ticker | Company | Segment | Trend · 13mo | 30D | 1Y |
|---|---|---|---|---|---|
| The subject · what this brief is about | |||||
VG | Venture Global | LNG Export & Infrastructure | 🌱 Emerging Bull | +11.6% | +13.3% |
LNG | Cheniere Energy | LNG Export & Infrastructure | 🌱 Emerging Bull | +3.0% | +17.8% |
CQP | Cheniere Energy Partners | LNG Export & Infrastructure | 🟢 Cont. Bull | +0.7% | +33.2% |
| Compared against · context, not the story | |||||
NEXT | Nextdecade | LNG & Energy Transition | 🌱 Emerging Bull | +14.1% | +1.9% |
EQT | EQT | Appalachian Shale Gas | ⚠️ Emerging Bear | +0.1% | +6.8% |
AR | Antero Resources | Appalachian Shale Gas | ⚠️ Emerging Bear | +5.3% | +20.2% |
RRC | Range Resources | Appalachian Shale Gas | ⚠️ Emerging Bear | +2.4% | +17.8% |
CNX | CNX Resources | Appalachian Shale Gas | ⚠️ Emerging Bear | +3.8% | +24.0% |
ATO | Atmos Energy | Natural Gas Distribution | ⚠️ Emerging Bear | −2.5% | +0.4% |
NI | NiSource | Natural Gas Distribution | ⚠️ Emerging Bear | −1.4% | +2.2% |
SR | Spire | Natural Gas Distribution | ⚠️ Emerging Bear | −0.3% | +9.0% |
NJR | New Jersey Resources | Natural Gas Distribution | 🟢 Cont. Bull | −2.9% | +15.9% |
OGS | ONE Gas | Natural Gas Distribution | ⚠️ Emerging Bear | −1.7% | +4.8% |
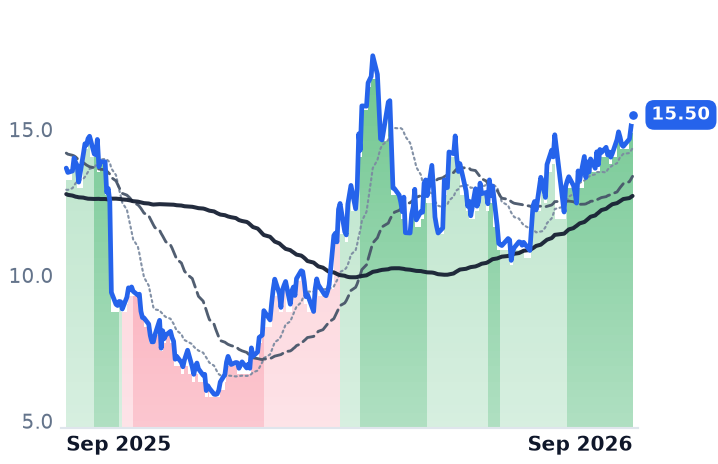
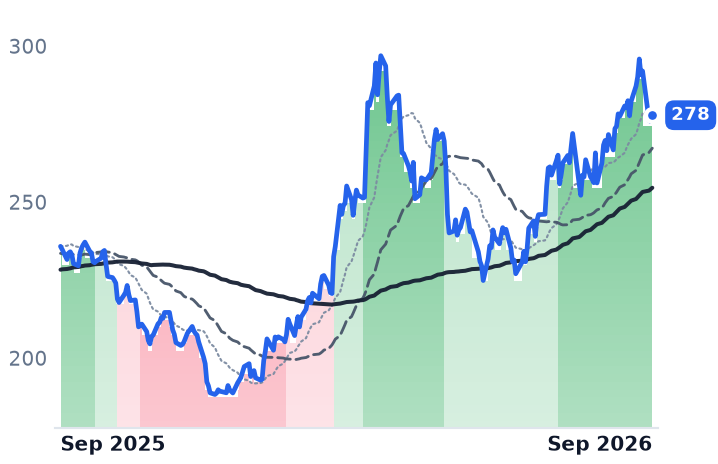
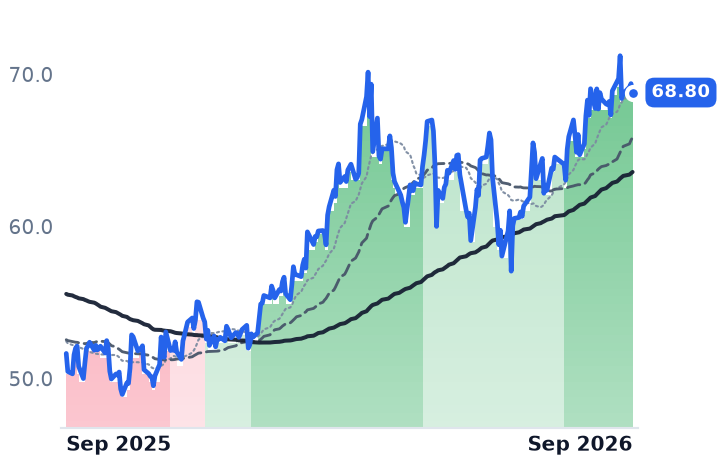
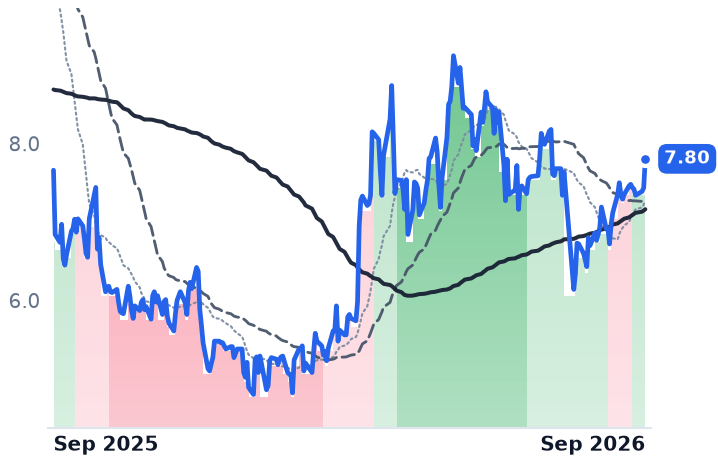
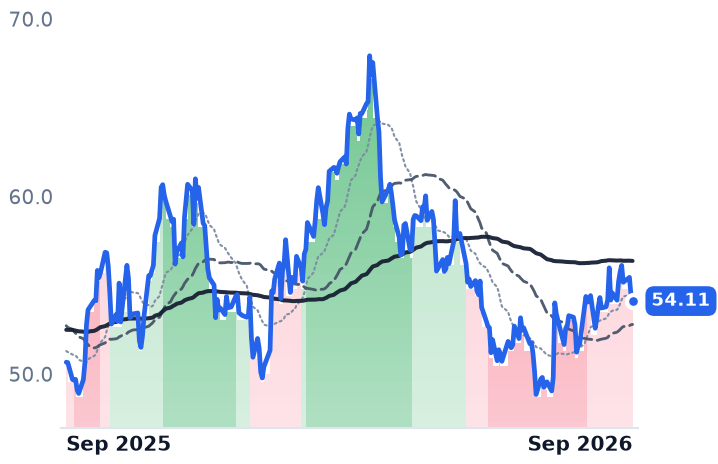
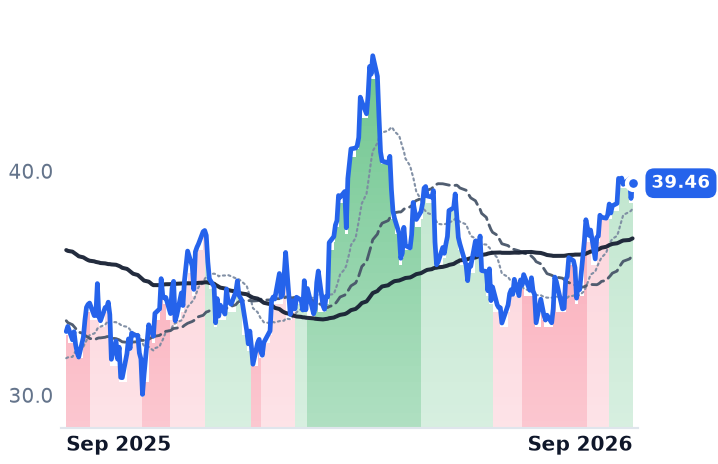
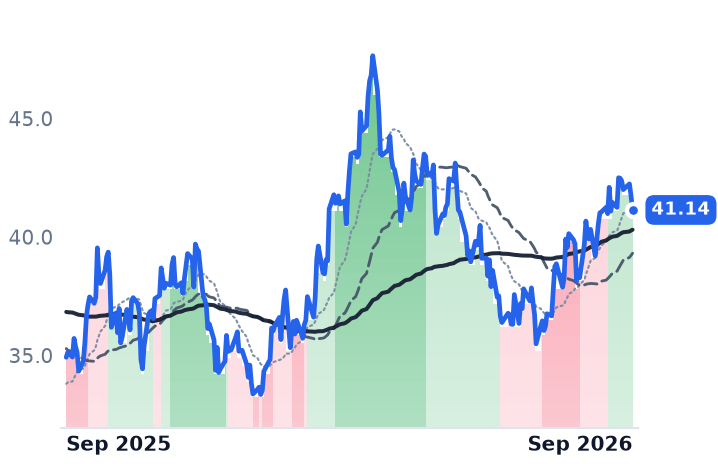
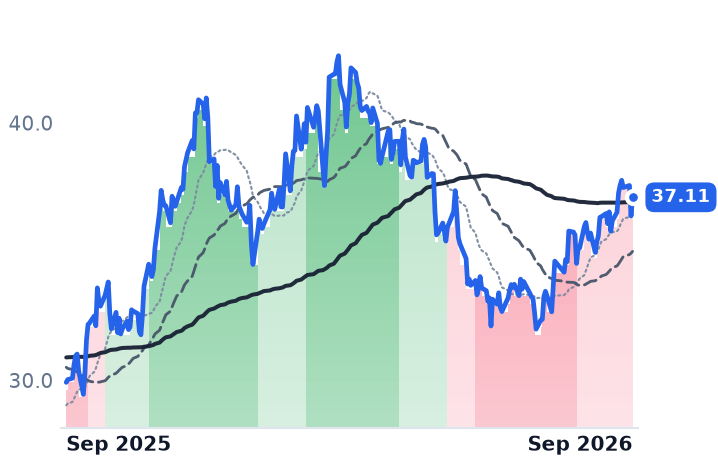
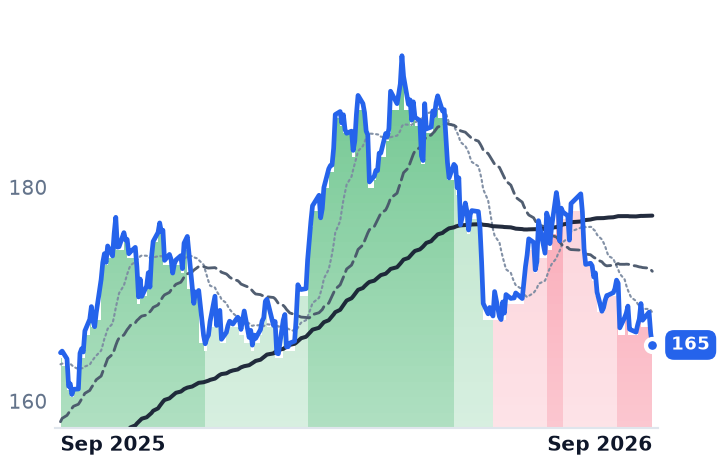
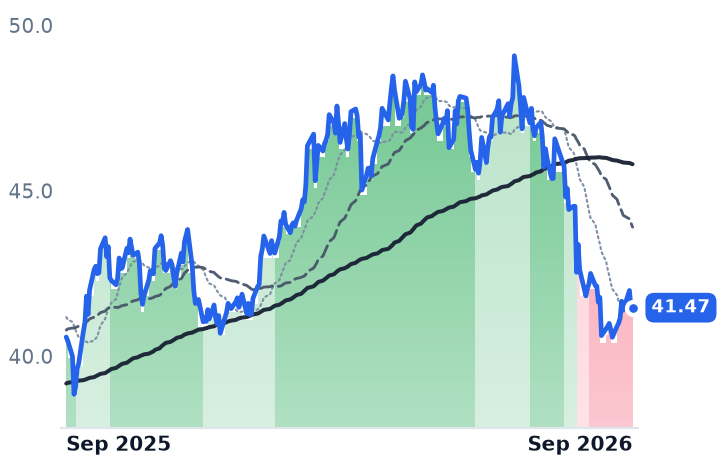
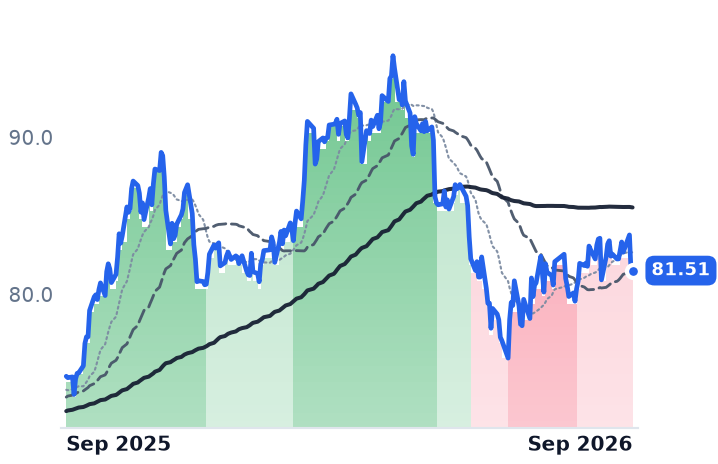
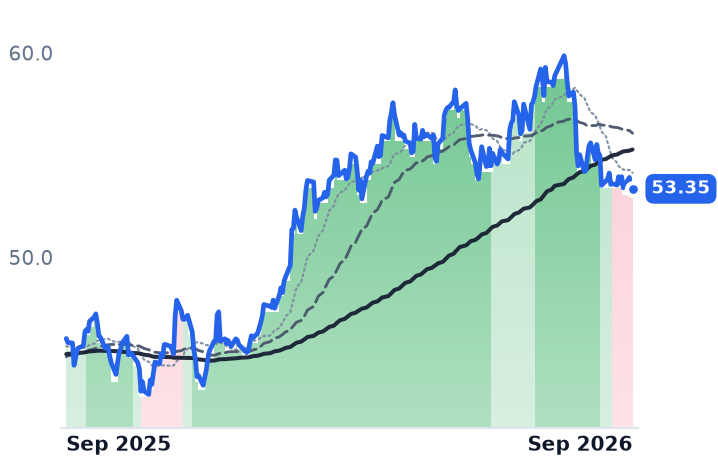
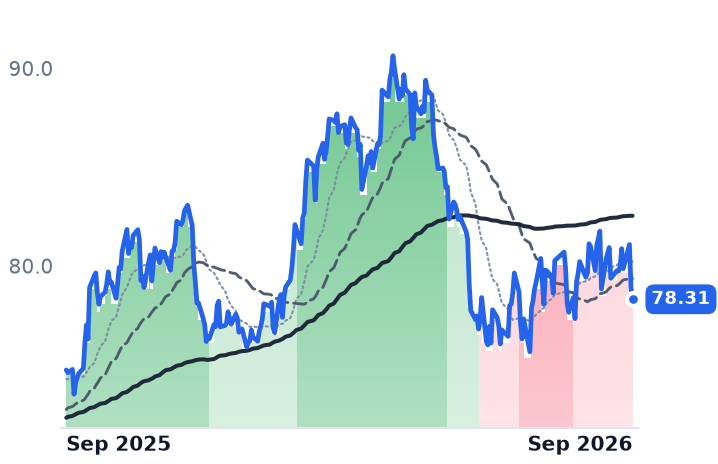
12-month price & trend
| Ticker | Mkt cap | P/E | P/E fwd | P/S | P/S fwd | P/GP | P/GP fwd | EV/EBITDA | FCF yld |
|---|---|---|---|---|---|---|---|---|---|
VG | $37.8B | 11.4x | 9.2x | 2.2x | 2.0x | 4.7x | 4.3x | 10.6x | -24.9% |
LNG | $58.2B | 20.6x | 50.5x | 2.6x | 2.5x | 4.9x | 4.8x | 10.2x | 12.1% |
CQP | $33.3B | 11.5x | 14.7x | 2.9x | 2.8x | 7.8x | 7.6x | 11.2x | 9.8% |
| Ticker | Mkt cap | P/E | P/E fwd | P/S | P/S fwd | P/GP | P/GP fwd | EV/EBITDA | FCF yld |
|---|---|---|---|---|---|---|---|---|---|
NEXT | $1.9B | n/m | — | n/m | 6.1x | — | — | n/m | -201.3% |
EQT | $34.5B | 12.1x | 13.5x | 3.7x | 3.7x | 5.4x | 5.4x | 6.5x | 10.9% |
AR | $12.1B | 11.2x | 9.3x | 2.2x | 1.8x | 8.3x | 6.9x | 7.0x | 11.6% |
| Ticker | Mkt cap | P/E | P/E fwd | P/S | P/S fwd | P/GP | P/GP fwd | EV/EBITDA | FCF yld |
|---|---|---|---|---|---|---|---|---|---|
RRC | $9.8B | 11.5x | 10.3x | 3.0x | 2.8x | 6.2x | 5.8x | 7.6x | 12.0% |
CNX | $5.3B | 5.2x | 11.5x | 2.2x | 2.4x | 4.4x | 4.8x | 4.1x | 9.9% |
ATO | $28.0B | 19.8x | 19.8x | 5.7x | 5.4x | 9.3x | 8.9x | 14.1x | -7.2% |
| Ticker | Mkt cap | P/E | P/E fwd | P/S | P/S fwd | P/GP | P/GP fwd | EV/EBITDA | FCF yld |
|---|---|---|---|---|---|---|---|---|---|
NI | $19.7B | 21.7x | 20.0x | 2.9x | 2.8x | 5.6x | 5.5x | 11.6x | -5.5% |
SR | $4.8B | 9.1x | 20.3x | 1.9x | 1.9x | 5.8x | 5.7x | 5.6x | -4.2% |
NJR | $5.4B | 14.7x | 14.9x | 2.4x | 2.4x | 8.5x | 8.6x | 11.7x | 1.4% |
| Ticker | Mkt cap | P/E | P/E fwd | P/S | P/S fwd | P/GP | P/GP fwd | EV/EBITDA | FCF yld |
|---|---|---|---|---|---|---|---|---|---|
OGS | $5.0B | 17.2x | 16.3x | 2.2x | 2.0x | 2.9x | 2.7x | 10.7x | -3.4% |
Consensus projections
| Ticker | FY2026E | FY2027E | FY2028E | |
|---|---|---|---|---|
VG | Revenue | +36.1% | −13.8% | +27.3% |
| EPS | +104.3% | −52.2% | +65.3% | |
LNG | Revenue | +15.4% | +2.1% | +3.8% |
| EPS | −65.4% | +214.6% | −8.0% | |
CQP | Revenue | +10.8% | −1.0% | +3.5% |
| EPS | +13.7% | −6.9% | +1.6% | |
NEXT | Revenue | — | +267.6% | +129.4% |
| EPS | +25.3% | −62.3% | −17.3% | |
EQT | Revenue | +11.4% | −1.0% | +11.1% |
| EPS | +39.1% | −5.5% | +38.0% | |
AR | Revenue | +31.0% | −0.2% | +8.5% |
| EPS | +134.9% | +2.7% | +27.8% | |
RRC | Revenue | +17.7% | +2.5% | +8.1% |
| EPS | +40.2% | −4.7% | +21.6% | |
CNX | Revenue | +6.9% | +0.7% | +5.8% |
| EPS | +42.1% | +37.2% | +18.2% | |
ATO | Revenue | +6.8% | +7.7% | +8.7% |
| EPS | +14.2% | +6.8% | +8.4% | |
NI | Revenue | +15.3% | +5.6% | +6.3% |
| EPS | +9.0% | +9.7% | +10.2% | |
SR | Revenue | +1.8% | +12.4% | +4.9% |
| EPS | −11.0% | +36.6% | +12.3% | |
NJR | Revenue | +12.2% | −2.8% | +4.5% |
| EPS | +10.1% | −5.1% | +8.2% | |
OGS | Revenue | −3.2% | +3.5% | +2.9% |
| EPS | +11.8% | +3.3% | +8.4% |
Forward fiscal years only. Blank means no analyst coverage for that year.
Venture Global exported 127 cargoes from its Gulf Coast terminals in the June quarter at a 54% EBITDA margin, and then raised its earnings forecast on the assumption it keeps getting paid that way. The company — an Arlington, Virginia developer that builds and runs modular liquefaction plants at Calcasieu Pass, Plaquemines and the unfinished CP2 — lifted 2026 consolidated adjusted earnings before interest, taxes, depreciation and amortization guidance to $8.7–9.1bn from $8.2–8.5bn, struck against a market liquefaction fee of $12.50–13.50 per million British thermal units.
That number is a spread, not a fee schedule. Venture Global disclosed that a $1 change in it moves 2026 EBITDA by $180–210m and 2027 EBITDA by $650–700m — the second figure larger because the volume behind it is larger. Cheniere, the Houston operator of Sabine Pass and Corpus Christi and the only US exporter with a longer record, disclosed the mirror image on its August 6 call: under 1 million tonnes of 2026 output is unsold, and a $1 move in market margins is worth less than $50m of full-year EBITDA. One company rents machines at $2.50–3.00 per million British thermal units of fixed liquefaction fee for twenty years. The other sells the gas.
Why the spread is open
The reason Venture Global's realized fee is quadruple Cheniere's contracted one is physical. Iranian strikes on Qatar's Ras Laffan complex in March 2026 destroyed two trains totaling 12.8 million tonnes a year, and Qatar extended force majeure on European and Asian deliveries again in late August as the Strait of Hormuz stayed shut. The feedgas side is cheap at the same time: the Energy Information Administration cut its 2026 Henry Hub forecast to $3.44 per million British thermal units in its August outlook, from $3.67.
Selling into that gap is policy, not accident. Chief executive Michael Sabel told investors the portfolio aims at a median liquefaction fee that historical data suggests is "nearly twice that of a 20-year contract price," and said the company has "several years of commissioning cargoes from CP2 and bolt-on projects coming." Venture Global's own filings put Plaquemines Phase 1 in service in the fourth quarter and asked regulators to extend its in-service deadline to the end of 2027, which lengthens the commissioning window.
The bill for the first round of this arrived last October, when an arbitration panel found the company had failed to declare commercial operations at Calcasieu Pass in timely fashion. BP is now seeking at least $3.7bn and potentially more than $6bn; a Venture Global spokesperson called the claim "unserious and not supported by evidence or controlling law." A separate panel went the company's way against Shell, and a New York court refused to overturn that award in March. The next Calcasieu Pass hearing is in late November.
What conversion costs
The estimates already answer the question the model poses. Consensus has Venture Global's 2027 revenue falling 13.8% to $16.02bn and earnings per share falling 52% to $0.807, while Plaquemines Phase 2 and CP2 roughly double what it can produce. On that 2027 number the $15.50 share is 19.2x, against a forward 9.18x on 2026 that flatters a single year. Trailing free cash flow yield is -24.9% — the arithmetic of a construction program.
Cheniere is the opposite balance sheet and the duller story: guidance raised twice, to $7.9–8.4bn, June-quarter revenue up 26.3%, and a price-to-gross-profit of 4.94x against 5.37x in early May, so the shares got cheaper on that measure as they rose. Its headline earnings are unreadable — a $3,502m net loss in the March quarter sat above $1,973m of operating income — because gas-supply contracts were marked to market; three-quarters of those volumes moved to normal-purchase accounting in mid-June.
Cheniere Energy Partners, the partnership that owns Sabine Pass, is the group's best twelve-month performer at +29.5% on the weakest business: June-quarter revenue growth decelerated to 5.2%, consensus has 2026 EBITDA down 1.5%, and distribution guidance of $3.10–3.40 per unit was reconfirmed rather than raised. It is the only one of the three whose forward earnings multiple, 14.67x, sits above its trailing 11.51x.
The verdict divides cleanly. Cheniere's advance is earned by contracted volume and is indifferent to the Qatari outage. Venture Global's is earned too — but by the outage itself, and the same delay that produced the margin produced the damages claim. Leadership inside the group flipped in a month: the partnership led thirty days of trading in mid-August and now trails it, up 2.3% against Venture Global's 16.1%.
The hearing in November and the Plaquemines commercial operations date fall within weeks of each other. One of them ends the commissioning window; the other prices what it already cost.