

Every $5m SailPoint Shifts From Licenses to Cloud Subscriptions Costs $10m of Revenue
Hypothesis Opus 5 · Research Opus 5 · Writing Opus 5 · Prompt v1.6
SailPoint's fastest-growing meter is the one its income statement does not carry. The July quarter, reported on 9 September, put annual recurring revenue at $1.231bn, up 25%, and the cloud portion at $847m, up 36% — while reported revenue rose 16.8% because contracts moved from up-front term licenses to ratable subscriptions. Management sizes that swap at roughly two dollars of recognized revenue lost for every dollar of mix shifted.
The shares fell on the print and sit well below their 52-week high. Okta, whose revenue grew about 11% last quarter and whose bookings meter is guided to slow again, has taken all of the sector's re-rating. One of these two prices is wrong, and the split is about which number investors are willing to read.
| Ticker | Company | Segment | Trend · 13mo | 30D | 1Y |
|---|---|---|---|---|---|
| The subject · what this brief is about | |||||
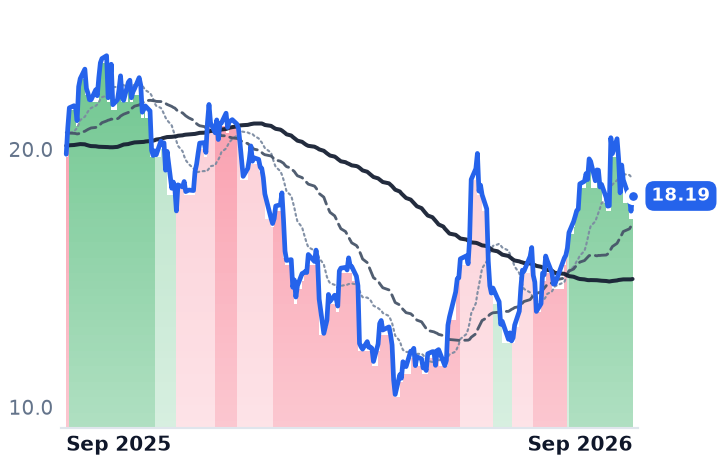
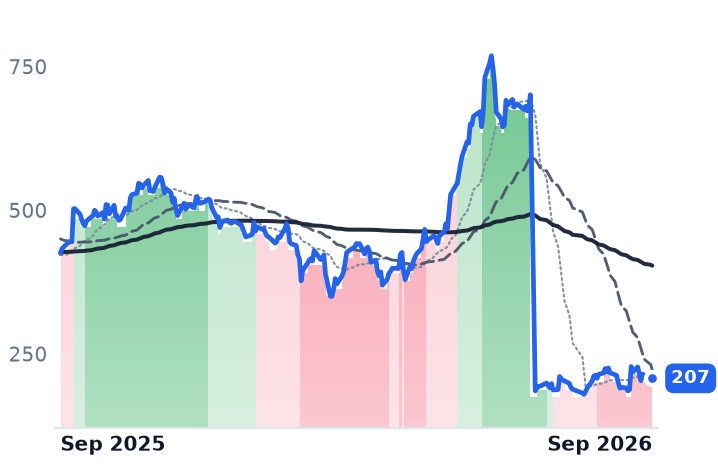
SAIL | SailPoint | Identity & Access Management | 🌱 Emerging Bull | −4.6% | −8.2% |
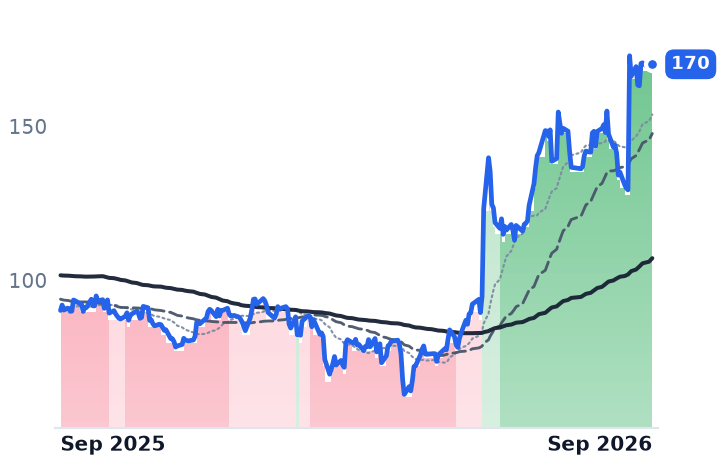
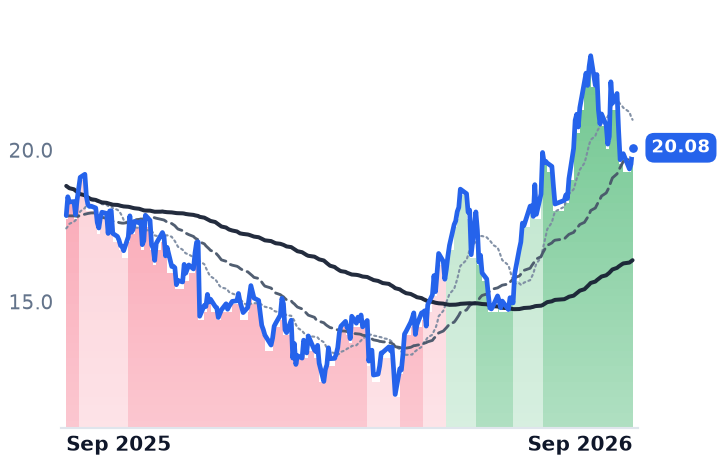
OKTA | Okta | Identity & Access Management | 🌱 Emerging Bull | +13.0% | +88.6% |
| Compared against · context, not the story | |||||
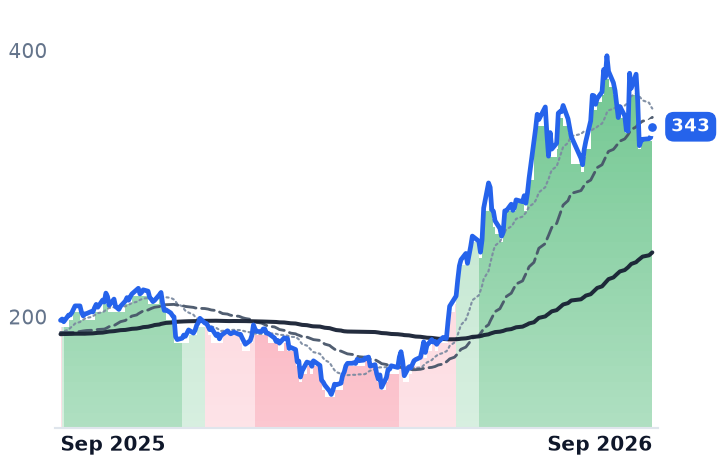
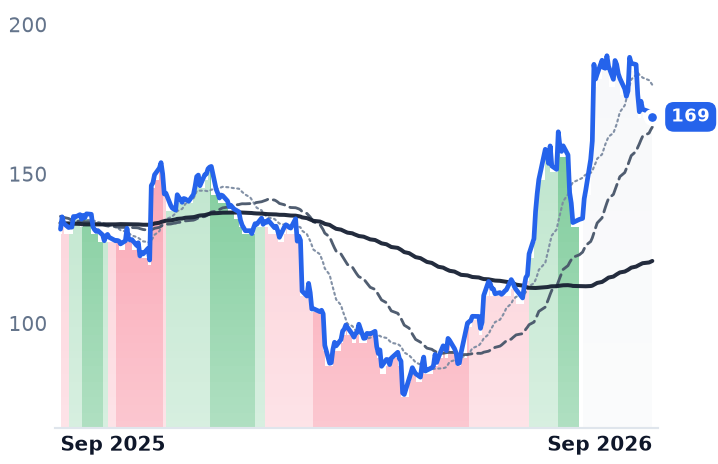
PANW | Palo Alto Networks | Cybersecurity & Threat Protection | 🌱 Emerging Bull | −11.1% | +73.7% |
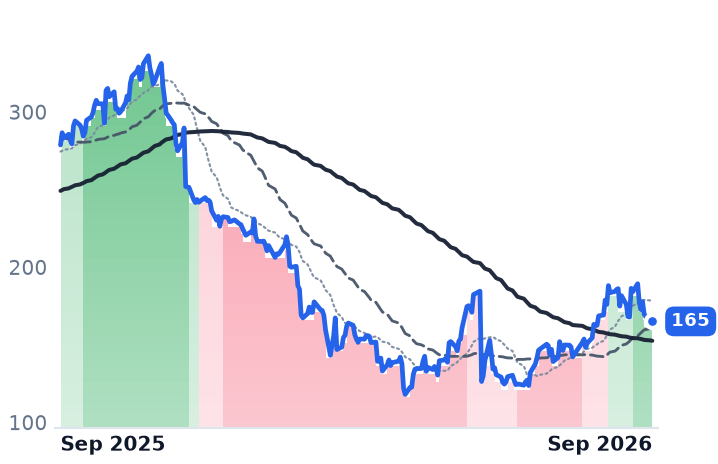
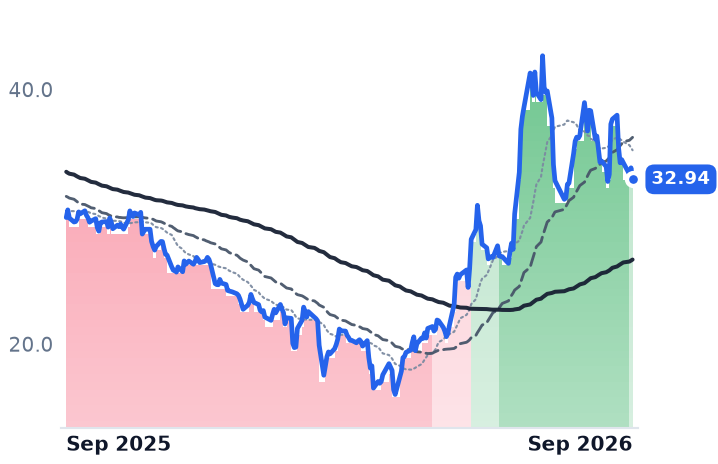
ZS | Zscaler | AI & Data Intelligence | 🔴 Cont. Bear | −7.0% | −40.3% |
CRWD | CrowdStrike | Cybersecurity & Threat Protection | 🔴 Cont. Bear | −5.0% | −49.8% |
S | SentinelOne | Cybersecurity & Threat Protection | 🌱 Emerging Bull | −10.9% | +12.5% |
TENB | Tenable | Cybersecurity & Threat Protection | 🌱 Emerging Bull | −13.0% | +10.0% |
QLYS | Qualys | Cybersecurity & Threat Protection | 🌱 Emerging Bull | −8.9% | +28.6% |
FTNT | Fortinet | Network Security Appliances | 🌱 Emerging Bull | −1.6% | +101.3% |
NET | Cloudflare | Network & Application Delivery | 🟢 Cont. Bull | −0.4% | +38.6% |
RBRK | Rubrik | Other | 🌱 Emerging Bull | −6.2% | +12.6% |
MSFT | Microsoft | Cloud Infrastructure & Platforms | 🌱 Emerging Bull | −1.9% | −1.1% |
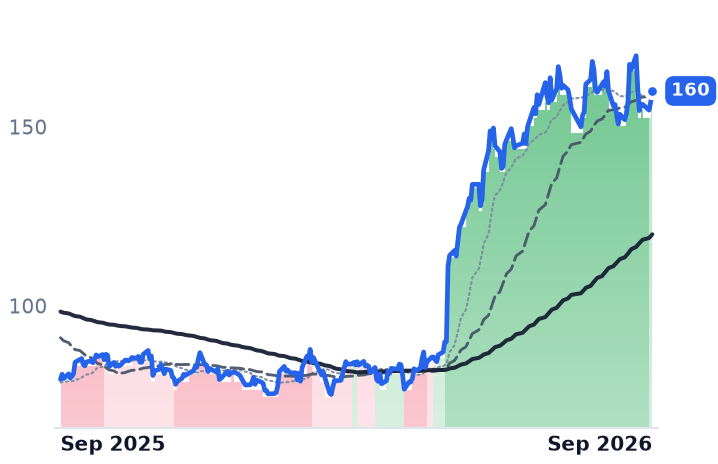
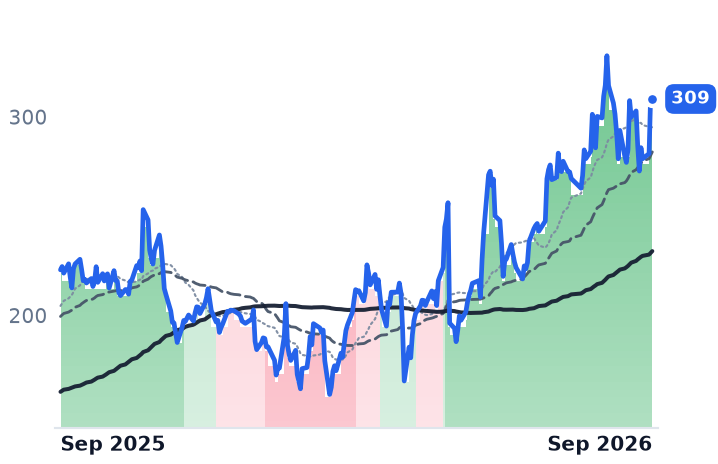
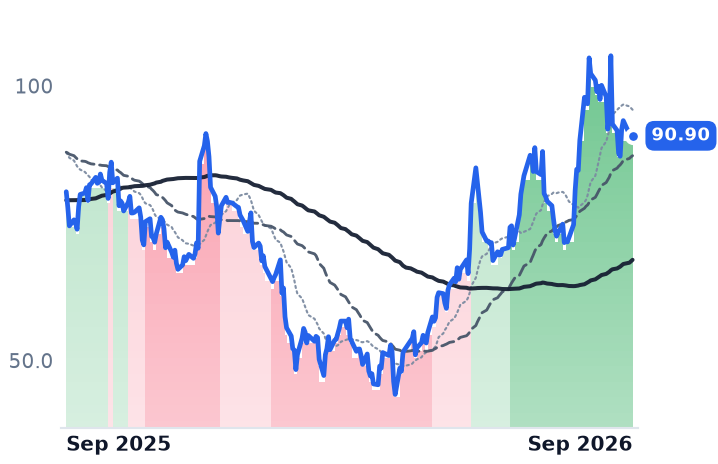
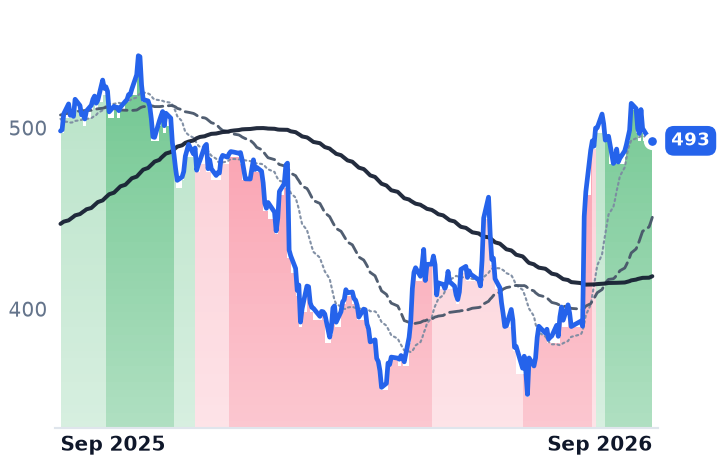
12-month price & trend
| Ticker | Mkt cap | P/E | P/E fwd | P/S | P/S fwd | P/GP | P/GP fwd | EV/EBITDA | FCF yld |
|---|---|---|---|---|---|---|---|---|---|
SAIL | $10.0B | n/m | — | 8.6x | — | 13.4x | — | n/m | 1.8% |
OKTA | $28.4B | 101.2x | 43.6x | 9.2x | 8.8x | 11.8x | 11.3x | 70.3x | 3.4% |
PANW | $271.6B | 724.5x | 79.6x | 23.7x | 19.2x | 33.6x | 27.3x | 506.7x | 1.6% |
| Ticker | Mkt cap | P/E | P/E fwd | P/S | P/S fwd | P/GP | P/GP fwd | EV/EBITDA | FCF yld |
|---|---|---|---|---|---|---|---|---|---|
ZS | $27.5B | n/m | 35.0x | 8.2x | 7.0x | 10.7x | 9.1x | 152.2x | 3.1% |
CRWD | $217.0B | — | 170.1x | 40.2x | 36.2x | 53.4x | 48.0x | 487.1x | 0.7% |
S | $7.2B | n/m | 61.3x | 6.9x | 6.0x | 9.3x | 8.1x | n/m | 0.6% |
| Ticker | Mkt cap | P/E | P/E fwd | P/S | P/S fwd | P/GP | P/GP fwd | EV/EBITDA | FCF yld |
|---|---|---|---|---|---|---|---|---|---|
TENB | $2.4B | n/m | 11.0x | 2.3x | 2.2x | 3.0x | 2.8x | 23.3x | 11.1% |
QLYS | $3.2B | 15.9x | 11.9x | 4.6x | 4.4x | 5.6x | 5.3x | 11.4x | 9.2% |
FTNT | $114.7B | 54.6x | 45.3x | 15.2x | 14.1x | 19.0x | 17.6x | 38.8x | 2.7% |
| Ticker | Mkt cap | P/E | P/E fwd | P/S | P/S fwd | P/GP | P/GP fwd | EV/EBITDA | FCF yld |
|---|---|---|---|---|---|---|---|---|---|
NET | $109.9B | n/m | 245.4x | 43.7x | 38.3x | 60.3x | 52.8x | — | 0.3% |
RBRK | $19.3B | n/m | 189.1x | 12.5x | 11.4x | 15.6x | 14.2x | n/m | 1.7% |
MSFT | $3.8T | 28.6x | 26.1x | 11.5x | 9.8x | 17.0x | 14.4x | 19.0x | 1.7% |
Consensus projections
| Ticker | FY2026E | FY2027E | FY2028E | |
|---|---|---|---|---|
OKTA | Revenue | +12.0% | +10.9% | +9.9% |
| EPS | +24.3% | +14.1% | +10.6% | |
PANW | Revenue | +24.3% | +23.8% | +14.3% |
| EPS | +15.5% | +10.7% | +16.7% | |
ZS | Revenue | +25.2% | +17.8% | +16.4% |
| EPS | +29.2% | +17.6% | +15.5% | |
CRWD | Revenue | +22.2% | +24.9% | +22.6% |
| EPS | −1.2% | +34.9% | +27.4% | |
S | Revenue | +22.4% | +19.9% | +17.6% |
| EPS | +723.4% | +83.7% | +43.0% | |
TENB | Revenue | +8.4% | +7.1% | +6.9% |
| EPS | +27.0% | +10.5% | +10.1% | |
QLYS | Revenue | +8.6% | +7.0% | +6.6% |
| EPS | +8.6% | +9.2% | +5.3% | |
FTNT | Revenue | +20.1% | +11.4% | +11.1% |
| EPS | +28.0% | +9.4% | +13.1% | |
NET | Revenue | +33.7% | +28.4% | +27.1% |
| EPS | +38.0% | +32.6% | +35.1% | |
RBRK | Revenue | +48.7% | +31.9% | +21.4% |
| EPS | −90.5% | −384.9% | +54.4% | |
MSFT | Revenue | +18.0% | +18.6% | +19.5% |
| EPS | +26.7% | +16.0% | +19.0% |
Forward fiscal years only. Blank means no analyst coverage for that year.
SailPoint reported its July quarter on 9 September, and the contracted book it steers by grew roughly eight points faster than the revenue on its income statement. The identity-governance company — Austin-founded, run by co-founder Mark McClain, selling software that decides which employees, contractors and machine accounts may reach which applications and data — put annual recurring revenue at $1.231bn, up 25%, against reported revenue of $308.8m, up 17%. It raised its full-year recurring-revenue target to $1.38bn. The shares closed lower that day.
The gap is not noise. SailPoint is still converting a book sold as up-front term licenses into cloud subscriptions recognized ratably, and management quantified the toll: every $5m of mix moved from term license to subscription costs roughly $10m of recognized revenue, about a $5m headwind in the quarter. Cloud mix is guided at 90-95% of net new recurring revenue for the fiscal year. Until that conversion finishes, reported revenue is a lagging, structurally understated read on what the company sold.
What the book says
Cloud recurring revenue reached $847m, up 36%, and accounted for 97% of net new recurring revenue against a guided 90-95%. Dollar-based net revenue retention was 113%. Remaining performance obligations rose 30% to $1.9bn and the portion due within a year 27% to $931m — a book growing faster than the revenue it will become, which management attributed to larger deals rather than longer contract terms. Average recurring revenue per cloud customer passed $400,000, up 17%.
The demand story management tells is agent governance. Recurring revenue tied to artificial-intelligence products passed $70m, ahead of a $100m full-year target and more than 30% of net new recurring revenue, with customers that adopt those products spending over 60% more. "The EU AI Act contains specific human oversight and audit logging requirements, which are scheduled to become enforceable as early as 2027," McClain told investors on 9 September. "We believe regulators will increasingly ask who is accountable for this agent and its actions."
What it costs
The blemish is in the cost line. Gross margin fell to 59.0% from 67.3% a year earlier, so gross profit grew 2.4% on 16.8% revenue growth — the disclosure does not explain the drop. The GAAP operating loss widened to $54.7m from $40.8m. Adjusted operating margin was 20.3% in the quarter but is guided down to 17.7% for the current one, carrying costs from the Entro Security acquisition, which extended discovery to more than 1,200 types of non-human identity. Free cash flow was $37m, with about $200m expected for the year.
The comparison doing the pricing
Okta, the independent single-sign-on and access-management vendor that competes with SailPoint in governance, is the reason this matters now. Its July quarter grew 10.6% — a third straight deceleration — and it guided current-quarter bookings growth back to 11-12% from 14%. Yet Okta trades at 11.84x trailing gross profit, against 5.97x in early May, and 43.6x forward earnings while consensus carries sub-11% revenue growth for two years. SailPoint, at a $10.0bn market value, is about 8.1x its recurring revenue base growing 25%, with no forward earnings multiple to quote because it loses money on a GAAP basis. Sell-side targets straddle the price: Cantor Fitzgerald at $25, Evercore ISI at $22, Mizuho at $19 and Neutral.
So the market is paying a premium for operating leverage it can see on Okta's income statement and discounting growth it cannot see on SailPoint's. Some of that discount is earned — the gross-margin fall is real, the losses are widening, and Thoma Bravo held roughly 86% of the stock after the February 2025 relisting, a float that can expand at the sponsor's choosing and has no dated trigger. But the part of the discount attributable to a suppressed revenue line is an accounting artifact with a stated exchange rate, and it runs out.
When cloud mix stops rising, reported revenue converges on the book and the two numbers say the same thing. At that point the argument for the discount has to be the control stake, or nothing.