

Paycom Grew Profit 50% Without Billing More Workers; Workday's Backlog Slowed to 8%
Hypothesis Opus 5 · Research Opus 5 · Writing Opus 5 · Prompt v1.6
Two payroll and human-resources software companies just posted the best margins of their lives while the number of workers underneath them stopped growing — and the market paid up for both.
Paycom's June-quarter operating income reached $168.5m on revenue of $531.2m, lifting operating margin to 31.7% from 23.2%, on automation that removed service work and a diluted share count 18.5% smaller. Employee records on the platform grew 5%; the chief executive called client employment stable. Workday's twelve-month subscription backlog grew 14.2%, but its multi-year backlog halved its growth rate, and its biggest session of the quarter followed a takeover report rather than a bookings number.
Paycom now trades at 19.2x forward earnings against roughly 9.4x implied at the April low on the identical estimate.
| Ticker | Company | Segment | Trend · 13mo | 30D | 1Y |
|---|---|---|---|---|---|
| The subject · what this brief is about | |||||
PAYC | Paycom Software | HR & Workforce Management | 🌱 Emerging Bull | +9.3% | +3.8% |
WDAY | Workday | Enterprise Resource Planning | 🌱 Emerging Bull | +7.7% | −15.5% |
| Compared against · context, not the story | |||||
ADP | Automatic Data Processing | HCM Software & Payroll | 🌱 Emerging Bull | +2.0% | −5.1% |
INTU | Intuit | Enterprise Resource Planning | 🔴 Cont. Bear | +0.5% | −50.1% |
NOW | ServiceNow | Specialized Enterprise Solutions | 🌱 Emerging Bull | +10.8% | −24.8% |
DOCU | DocuSign | Specialized Enterprise Solutions | 🌱 Emerging Bull | +13.9% | −16.3% |
BILL | Bill.com | Fintech & Digital Finance | 🌱 Emerging Bull | −0.2% | −2.1% |
MNDY | monday.com | Other | 🔴 Cont. Bear | +3.6% | −52.2% |
PCTY | Paylocity | HR & Workforce Management | 🔴 Cont. Bear | +2.1% | −12.0% |
PAYX | Paychex | HCM Software & Payroll | 🌱 Emerging Bull | +1.2% | −7.1% |
SPY | State Street SPDR S&P 500 ETF Trust | Asset Management | 🟢 Cont. Bull | −0.5% | +19.7% |
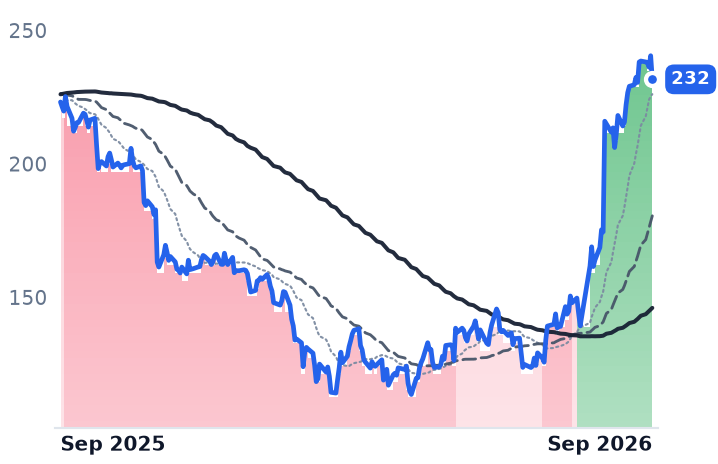
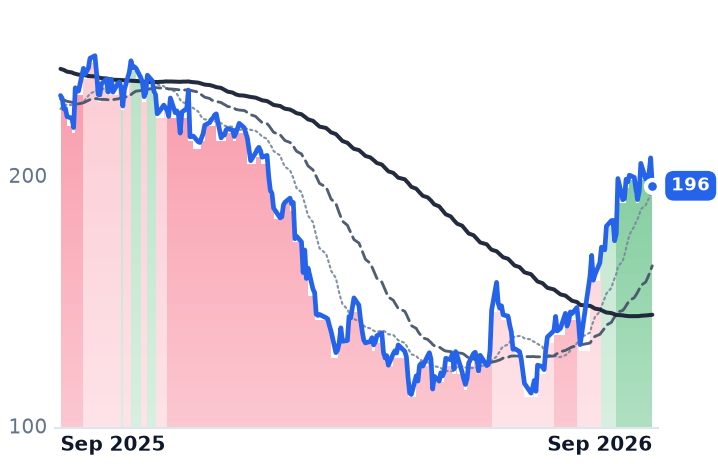
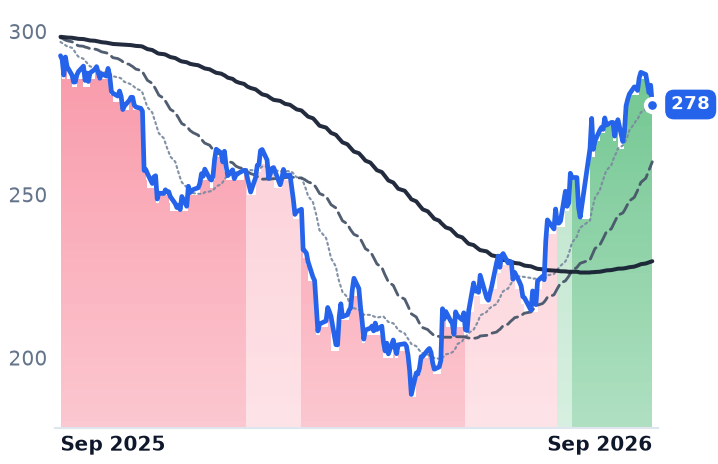
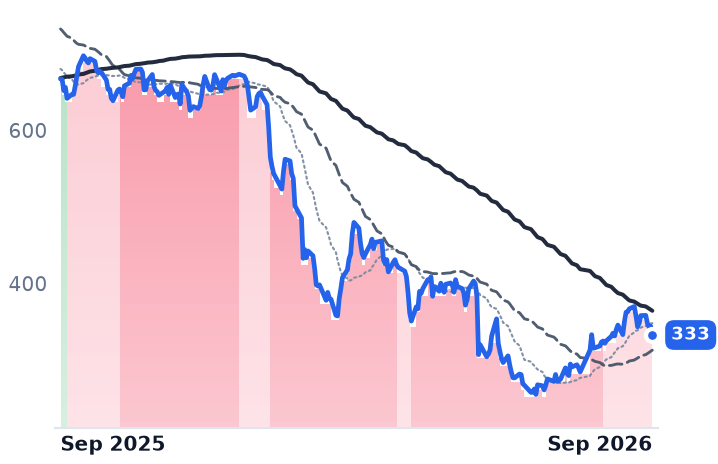
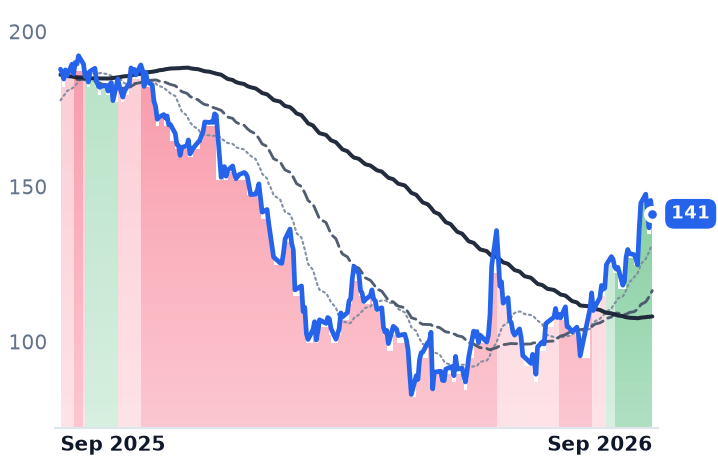
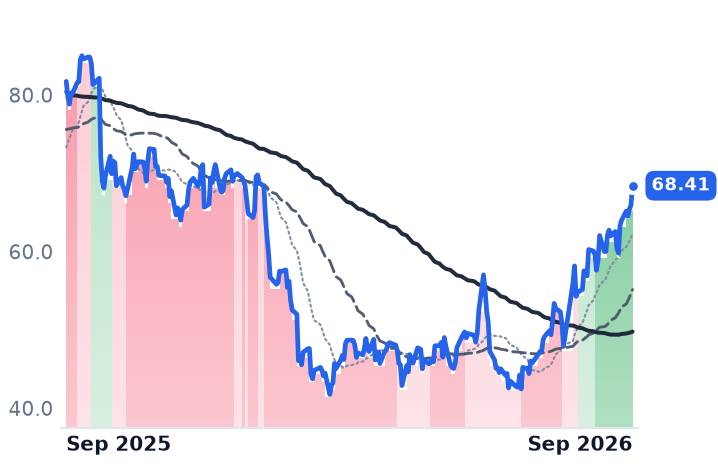
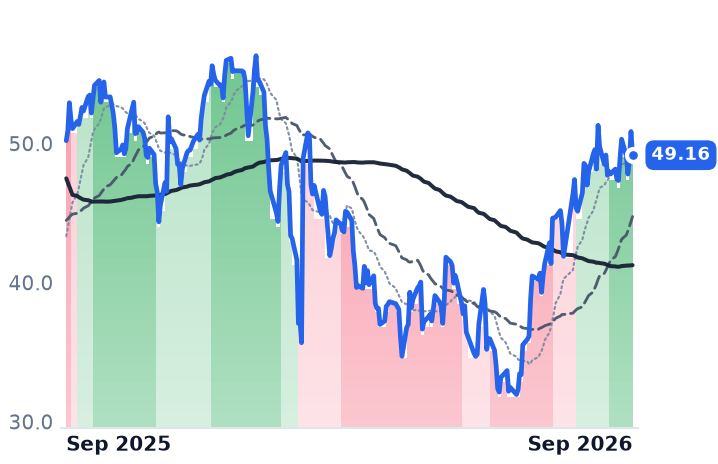
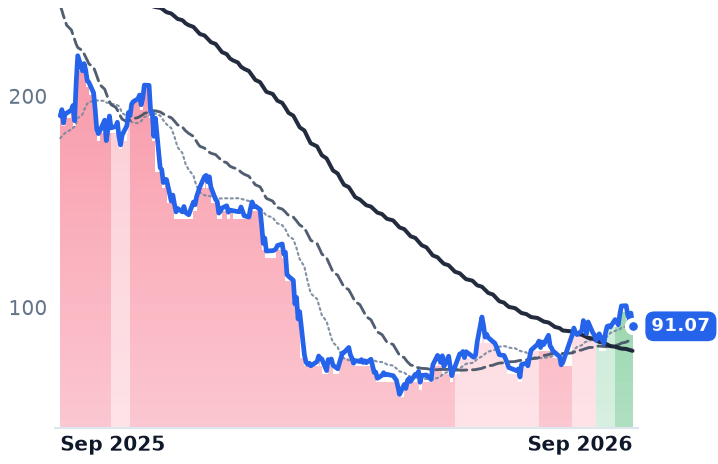
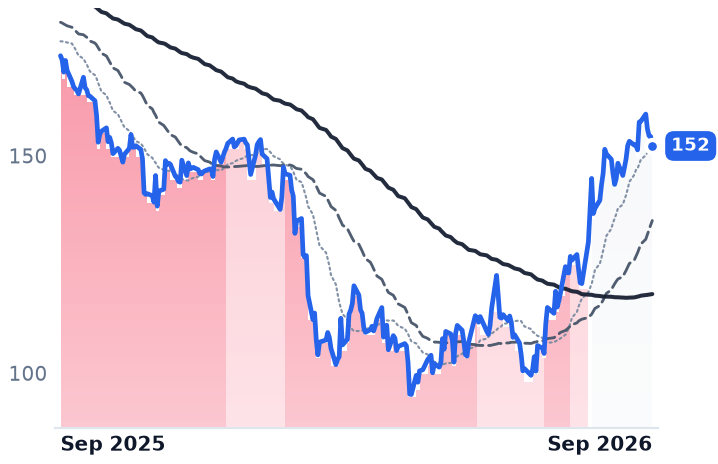
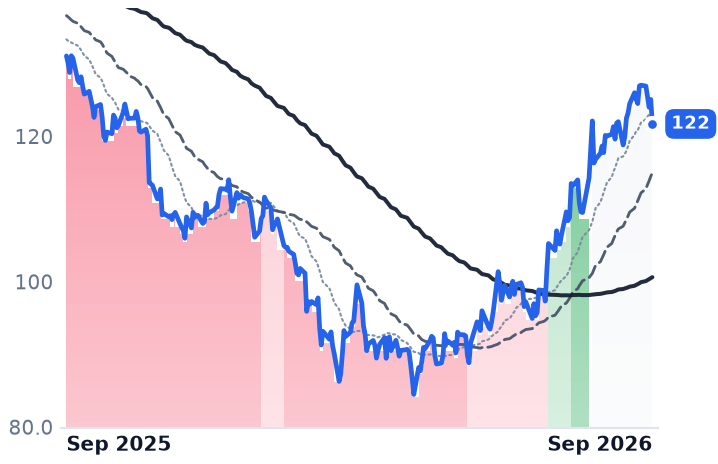
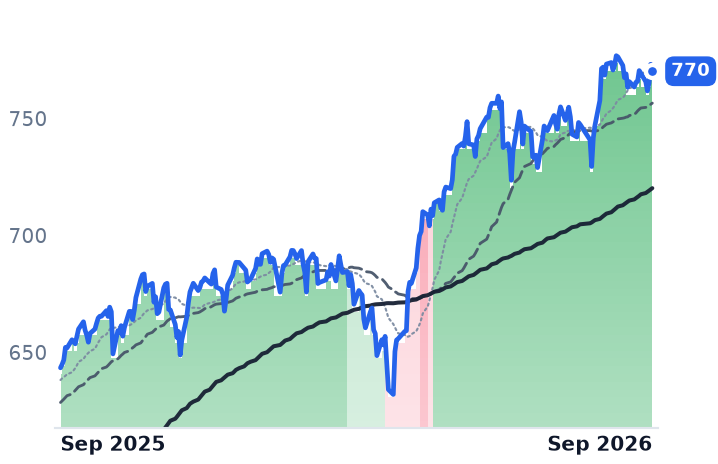
12-month price & trend
| Ticker | Mkt cap | P/E | P/E fwd | P/S | P/S fwd | P/GP | P/GP fwd | EV/EBITDA | FCF yld |
|---|---|---|---|---|---|---|---|---|---|
PAYC | $10.4B | 24.6x | 19.2x | 4.9x | 4.7x | 6.1x | 5.9x | 12.5x | 7.2% |
WDAY | $51.3B | 39.6x | 17.7x | 5.0x | 4.8x | 6.7x | 6.3x | 32.6x | 5.5% |
ADP | $113.3B | 25.8x | 23.1x | 5.2x | 4.9x | 10.7x | 10.1x | 18.0x | 4.4% |
| Ticker | Mkt cap | P/E | P/E fwd | P/S | P/S fwd | P/GP | P/GP fwd | EV/EBITDA | FCF yld |
|---|---|---|---|---|---|---|---|---|---|
INTU | $97.9B | 21.7x | 14.8x | 4.6x | 4.2x | 5.6x | 5.1x | 14.8x | 8.8% |
NOW | $132.8B | 79.8x | 31.6x | 9.0x | 8.2x | 12.1x | 11.0x | 39.8x | 3.4% |
DOCU | $11.5B | 38.4x | 13.3x | 3.5x | 3.3x | 4.4x | 4.1x | 17.2x | 9.7% |
| Ticker | Mkt cap | P/E | P/E fwd | P/S | P/S fwd | P/GP | P/GP fwd | EV/EBITDA | FCF yld |
|---|---|---|---|---|---|---|---|---|---|
BILL | $5.0B | n/m | 13.4x | 3.0x | 2.7x | 3.8x | 3.5x | 58.7x | 9.6% |
MNDY | $3.8B | 38.1x | 16.7x | 2.8x | 2.6x | 3.2x | 2.9x | 34.3x | 7.8% |
PCTY | $8.5B | 31.6x | 17.9x | 4.8x | 4.5x | 6.9x | 6.5x | 16.6x | 5.3% |
| Ticker | Mkt cap | P/E | P/E fwd | P/S | P/S fwd | P/GP | P/GP fwd | EV/EBITDA | FCF yld |
|---|---|---|---|---|---|---|---|---|---|
PAYX | $45.2B | 25.9x | 21.3x | 6.9x | 6.6x | 9.3x | 8.9x | 16.1x | 5.1% |
SPY | $773.0B | — | — | — | — | — | — | — | — |
Consensus projections
| Ticker | FY2026E | FY2027E | FY2028E | |
|---|---|---|---|---|
PAYC | Revenue | +7.7% | +7.2% | +8.3% |
| EPS | +30.9% | +15.5% | +11.1% | |
WDAY | Revenue | +13.4% | +11.8% | +10.5% |
| EPS | +26.5% | +21.9% | +19.5% | |
ADP | Revenue | +7.0% | +5.9% | +5.7% |
| EPS | +11.0% | +10.7% | +9.2% | |
INTU | Revenue | +13.9% | +9.7% | +9.4% |
| EPS | +18.5% | +1.9% | +13.1% | |
NOW | Revenue | +22.4% | +18.7% | +18.6% |
| EPS | +17.1% | +23.2% | +21.4% | |
DOCU | Revenue | +8.4% | +8.9% | +7.6% |
| EPS | +6.9% | +19.5% | +12.6% | |
BILL | Revenue | +13.2% | +11.3% | +10.5% |
| EPS | +26.1% | +41.5% | +17.6% | |
MNDY | Revenue | +19.8% | +15.1% | +14.6% |
| EPS | +27.8% | +22.3% | +19.1% | |
PCTY | Revenue | +11.1% | +7.5% | +7.6% |
| EPS | +15.4% | +9.0% | +9.7% | |
PAYX | Revenue | +16.5% | +5.5% | +5.5% |
| EPS | +10.1% | +8.6% | +7.5% |
Forward fiscal years only. Blank means no analyst coverage for that year.
Paycom's operating profit grew 50% in the June quarter on revenue up 9.8%, and the extra dollars did not come from more workers on the platform it bills. Paycom Software sells single-database payroll, time, benefits and talent software to small and mid-sized American employers, and it is paid largely per employee per month — a meter that only moves when clients hire. Operating income reached $168.5m on revenue of $531.2m, lifting operating margin to 31.7% from 23.2% a year earlier.
The margin came from inside the company. Gross margin rose to 83.2% from 81.9%; management told the August 5 call that the 2025 build-out of its own data centers now yields more than $100m of annual research savings plus over $30m less in third-party artificial-intelligence token fees. Below that, the diluted share count fell 18.5% to 45.9m after $1.4bn of repurchases year to date. That is why consensus has Paycom's earnings per share up 30.9% this year to $12.09 while revenue grows 7.7% — and the company guided 2026 revenue to $2.197–2.212bn, or 7–8% growth, slower than the quarter just reported.
The meter underneath
Paycom stored 7.4 million employee records at the end of 2025, up 5%, across roughly 20,300 parent-company clients. Chief executive Chad Richison told investors on the August 5 call that "client employment growth would have just been stable, same, consistent with -- as it's been every year in the past with the exception of when it went down about 14% during COVID." Stable is the operative word: Paycom's automation products deliberately remove the service work it once billed for, and the same 10-K that lists ADP, Paychex, Paylocity, Dayforce, Oracle, SAP, UKG and Workday as competitors rests the defense on that automation rather than on price.
The other high-margin dollar is float. Paycom holds client tax withholdings and payroll cash for days and invests it, earning $26.0m of interest in the quarter on an average daily balance near $2.9bn, with about $105m guided for the year. That is 15.4% of quarterly operating income. A quarter-point of easing costs roughly $7m annualized — under 1% of consensus operating income, real but second-order. ADP, the industry's largest processor, shows why the direction is not automatic: it guides fiscal 2027 interest on client funds up to $1.54–1.56bn on a portfolio yielding about 3.7%, because a laddered book keeps rolling old low-coupon paper higher even as the front end falls, while guiding the workers it actually bills to 0–1% growth.
Workday's two backlogs disagree
Workday, which leads enterprise human-capital software buyer consideration at 41.9% against SAP's SuccessFactors at 32.3%, reported subscription revenue up 13.9% and twelve-month subscription backlog of $9.03bn, up 14.2%. Its total subscription backlog, the multi-year commitment, grew 8.0% against 17.6% a year earlier, and fiscal 2028 subscription growth is pre-guided to about 11% with margin doing the work. Chief executive Aneel Bhusri said on the August 27 call that "AI products alone drove more than 100 million of new ACV, which accounted for more than 25% of all new ACV closed in the quarter" — new annual contract value — though only 200 customers had signed the flex-credit contracts that meter agent work, against 5,500 already running agents. Headcount stayed flat at 20,900 and a $5bn buyback finished six months early.
What was paid for it
Since the April 10 low Paycom has doubled and Workday risen 74%; over twelve months the group is still down about 18%, with Workday off 15%. Paycom's August 6 gap of 23.8%, the session after its print, did more than the rest of the last 30 sessions combined. Workday's quarter compresses into a late-July rotation, the report that Silver Lake was in take-private talks that moved the shares 12.5% on August 14, and a 5.8% post-results session; the drift between was negative.
So the businesses earn part of this. Paycom's 8.5 points of margin expansion are cash, and its cost program is documented. Workday's shorter meter is steady. What neither earns is the price change: Paycom at 19.2x forward earnings against 24.6x trailing, versus roughly 9.4x implied in April on the same $12.09 estimate, and Workday at 17.7x forward against 39.6x trailing — against ADP's 23.1x forward, the mature comparison. Workday now costs 6.66 times its trailing gross profit, against 4.31 times on May 3, while that gross profit grew 13.2%.
Both companies are being paid a growth price for doing more with the same number of employees underneath them. Cost programs lap, share counts can only shrink once, and the August employment report counted 22,000 new jobs. The next quarter has to come from somewhere the meter can see.