

ServiceNow's AI Contract Value Passed $1bn and Its Gross Margin Fell to 70.7%
Hypothesis Opus 5 · Research Opus 5 · Writing Opus 5 · Prompt v1.6
Enterprise software is supposed to be the rung of the artificial-intelligence stack that collects the money without buying the hardware. ServiceNow's June quarter is the first large-cap evidence that the inference bill arrives anyway, inside cost of revenue.
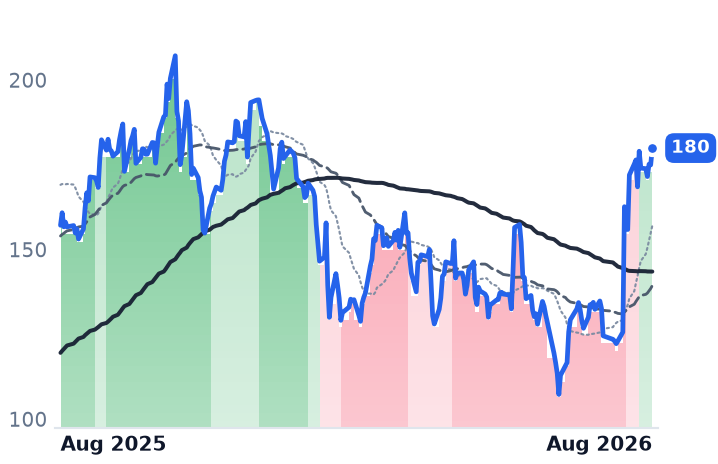
Revenue grew 24% to $3.99bn and contract value attached to AI products crossed $1bn, with net-new AI bookings up 40% from the prior quarter. But gross margin gave up 6.8 points year over year, so gross profit grew only 13.1%, and operating income fell 55% to $162m. The shares rose 34.6% in a month regardless, almost entirely on multiple expansion.
Salesforce is the opposite pairing: gross margin unchanged at 76.9% with revenue growth accelerating a third straight quarter. It reports August 26; Snowflake follows September 2.
| Ticker | Company | Segment | Trend · 13mo | 30D | 1Y |
|---|---|---|---|---|---|
| The subject · what this brief is about | |||||
NOW | ServiceNow | Specialized Enterprise Solutions | 🔴 Cont. Bear | +16.1% | −27.0% |
CRM | Salesforce | Customer Experience & CRM | 🔴 Cont. Bear | +15.2% | −15.1% |
SNOW | Snowflake | Data & Analytics Platforms | 🟢 Cont. Bull | +23.1% | +70.9% |
| Compared against · context, not the story | |||||
WDAY | Workday | Enterprise Resource Planning | 🌱 Emerging Bull | +25.2% | −10.5% |
TEAM | Atlassian | Developer Tools & DevOps | 🔴 Cont. Bear | +71.8% | +1.9% |
MDB | MongoDB | Data Management & Analytics | 🟢 Cont. Bull | +38.7% | +97.2% |
ADBE | Adobe | Design & Content Creation | 🔴 Cont. Bear | +10.5% | −24.2% |
MSFT | Microsoft | Cloud Infrastructure & Platforms | 🔴 Cont. Bear | +22.9% | −3.8% |
HUBS | HubSpot | Customer Experience & CRM | 🔴 Cont. Bear | +0.8% | −48.7% |
ORCL | Oracle | Cloud Infrastructure & Platforms | 🔴 Cont. Bear | +22.1% | −37.3% |
DDOG | Datadog | Data & Analytics Platforms | 🟢 Cont. Bull | −6.1% | +83.5% |
CRWD | CrowdStrike | Cybersecurity & Threat Protection | ⚠️ Emerging Bear | +5.6% | −54.2% |
PLTR | Palantir Technologies | AI & Data Intelligence | ⚠️ Emerging Bear | +45.7% | +14.5% |
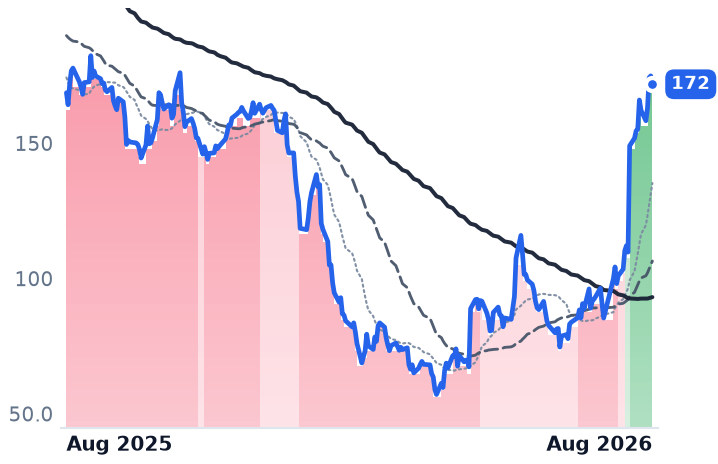
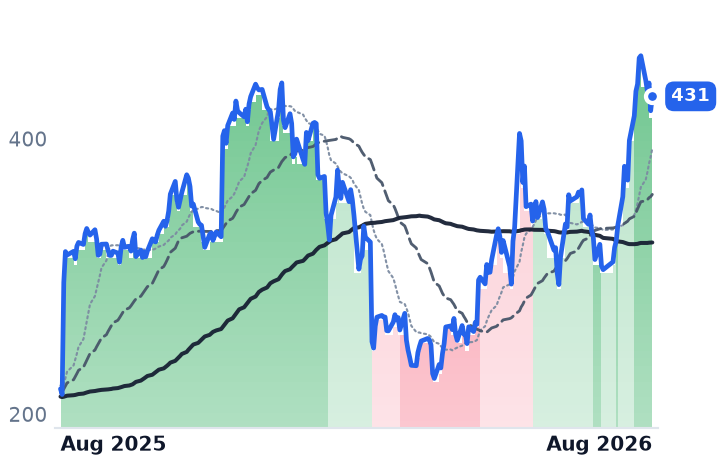
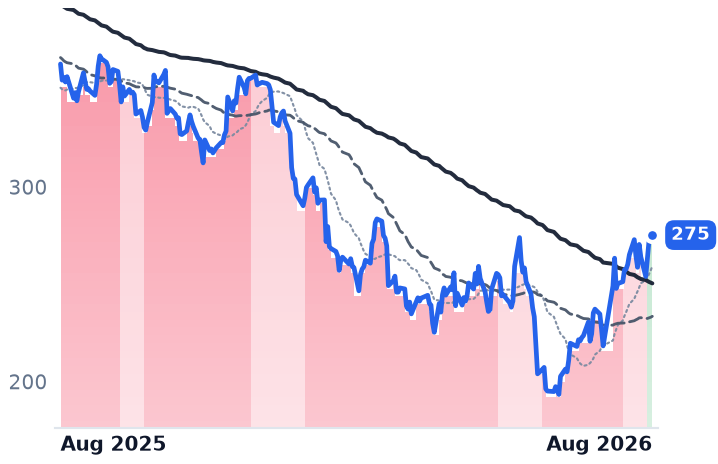
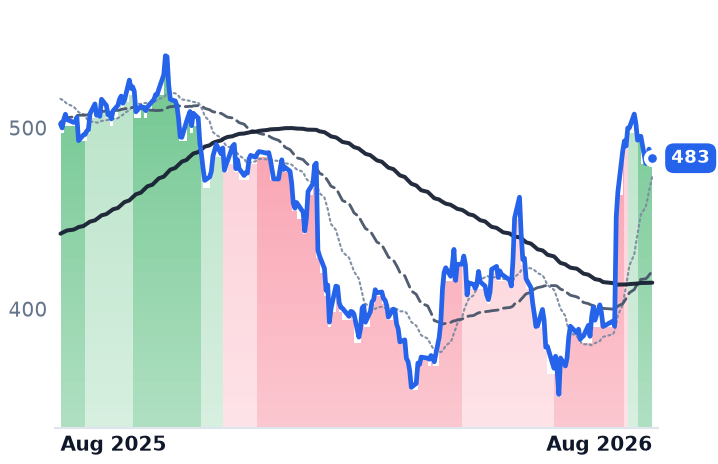
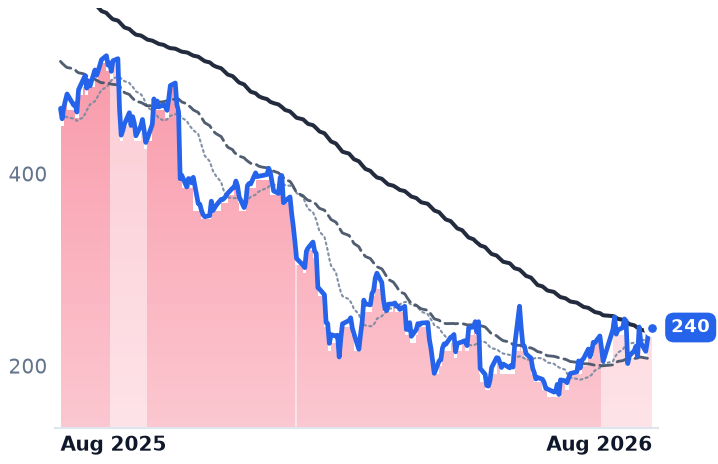
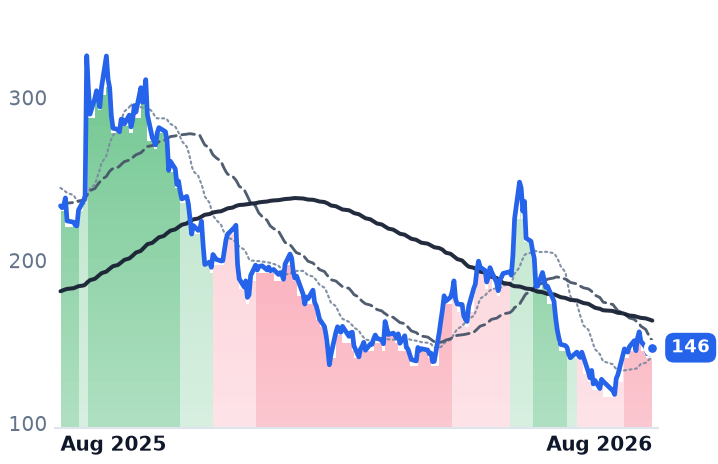
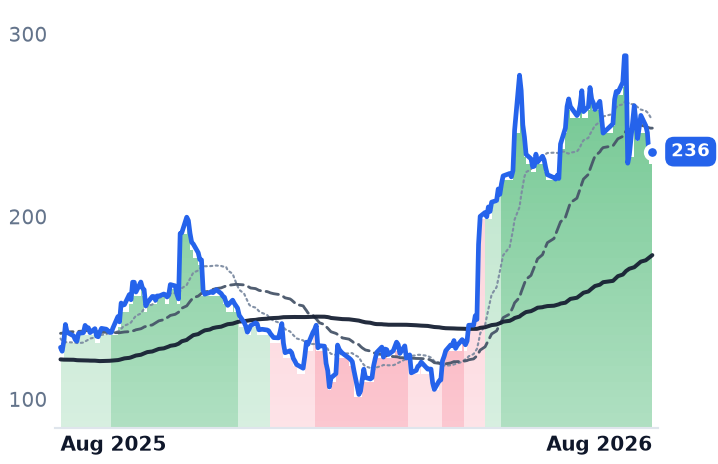
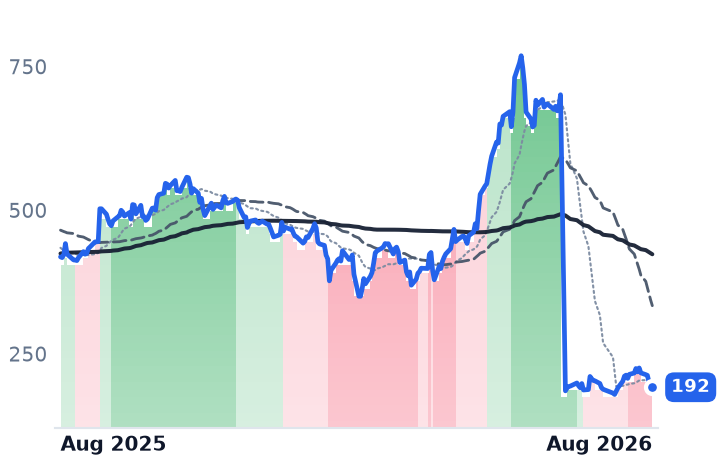
12-month price & trend
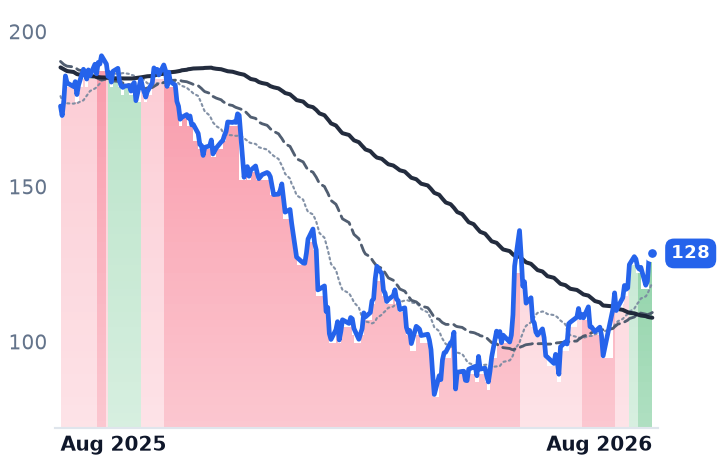
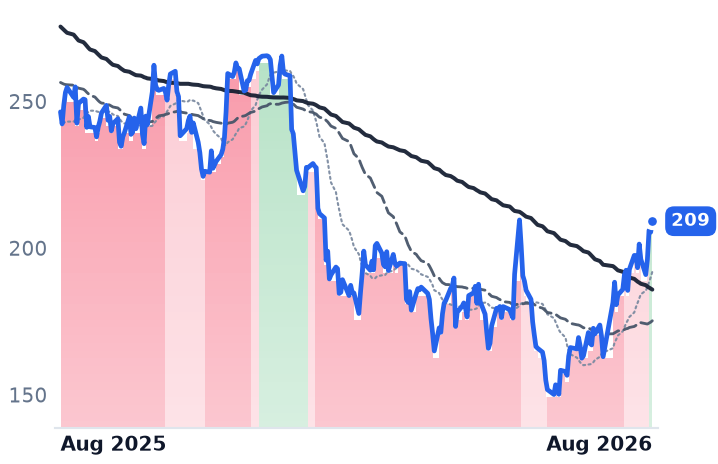
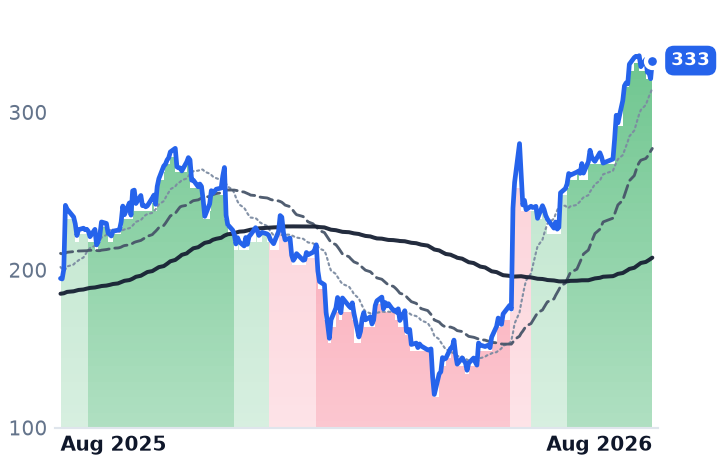
| Ticker | Mkt cap | P/E | P/E fwd | P/S | P/S fwd | P/GP | P/GP fwd | EV/EBITDA | FCF yld |
|---|---|---|---|---|---|---|---|---|---|
NOW | $132.8B | 79.8x | 31.6x | 9.0x | 8.2x | 12.1x | 11.0x | 39.8x | 3.4% |
CRM | $171.3B | 24.1x | 14.8x | 4.0x | 3.7x | 5.2x | 4.8x | 14.6x | 8.6% |
SNOW | $115.3B | n/m | 171.9x | 22.9x | 18.9x | 34.1x | 28.1x | n/m | 1.0% |
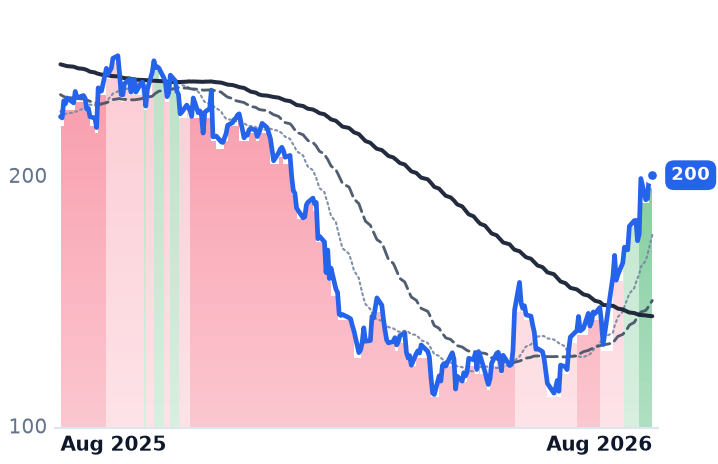
| Ticker | Mkt cap | P/E | P/E fwd | P/S | P/S fwd | P/GP | P/GP fwd | EV/EBITDA | FCF yld |
|---|---|---|---|---|---|---|---|---|---|
WDAY | $52.4B | 62.1x | 18.6x | 5.3x | 4.9x | 7.0x | 6.5x | 33.2x | 5.7% |
TEAM | $45.1B | n/m | 31.3x | 6.9x | 6.0x | 8.1x | 7.1x | 298.8x | 2.9% |
MDB | $34.7B | n/m | 70.4x | 13.3x | 11.7x | 18.5x | 16.2x | — | 1.7% |
| Ticker | Mkt cap | P/E | P/E fwd | P/S | P/S fwd | P/GP | P/GP fwd | EV/EBITDA | FCF yld |
|---|---|---|---|---|---|---|---|---|---|
ADBE | $109.4B | 15.7x | 11.3x | 4.3x | 4.1x | 4.9x | 4.6x | 11.2x | 9.7% |
MSFT | $3.7T | 27.5x | 25.2x | 11.1x | 9.4x | 16.3x | 13.9x | 18.2x | 1.8% |
HUBS | $12.3B | 84.8x | 18.1x | 3.6x | 3.3x | 4.3x | 4.0x | 40.8x | 6.2% |
| Ticker | Mkt cap | P/E | P/E fwd | P/S | P/S fwd | P/GP | P/GP fwd | EV/EBITDA | FCF yld |
|---|---|---|---|---|---|---|---|---|---|
ORCL | $433.0B | 25.3x | 18.7x | 6.4x | 4.8x | 9.8x | 7.3x | 17.4x | -5.5% |
DDOG | $83.9B | 473.9x | 93.2x | 21.1x | 18.8x | 26.6x | 23.6x | 321.8x | 1.4% |
CRWD | $195.5B | n/m | 155.9x | 38.4x | 32.9x | 51.1x | 43.8x | 572.8x | 0.7% |
| Ticker | Mkt cap | P/E | P/E fwd | P/S | P/S fwd | P/GP | P/GP fwd | EV/EBITDA | FCF yld |
|---|---|---|---|---|---|---|---|---|---|
PLTR | $394.9B | 136.5x | 108.2x | 64.2x | 48.6x | 75.7x | 57.3x | 126.8x | 0.9% |
Consensus projections
| Ticker | FY2026E | FY2027E | FY2028E | |
|---|---|---|---|---|
NOW | Revenue | +22.4% | +18.7% | +18.6% |
| EPS | +17.1% | +23.2% | +21.4% | |
CRM | Revenue | +9.3% | +11.1% | +9.4% |
| EPS | +17.4% | +20.2% | +10.4% | |
SNOW | Revenue | +29.4% | +31.0% | +25.9% |
| EPS | +72.3% | +59.7% | +42.0% | |
WDAY | Revenue | +13.4% | +11.8% | +11.0% |
| EPS | +26.5% | +18.6% | +17.3% | |
TEAM | Revenue | +24.7% | +15.4% | +14.7% |
| EPS | +55.5% | −0.1% | +21.6% | |
MDB | Revenue | +23.1% | +21.6% | +18.0% |
| EPS | +59.1% | +27.0% | +19.7% | |
ADBE | Revenue | +12.0% | +9.1% | +8.8% |
| EPS | +17.2% | +12.7% | +14.2% | |
MSFT | Revenue | +18.0% | +18.2% | +19.6% |
| EPS | +26.7% | +15.4% | +18.5% | |
HUBS | Revenue | +18.2% | +14.2% | +14.0% |
| EPS | +38.2% | +25.7% | +18.6% | |
ORCL | Revenue | +17.8% | +33.2% | +45.5% |
| EPS | +25.3% | +7.6% | +35.6% | |
DDOG | Revenue | +31.7% | +22.3% | +22.9% |
| EPS | +25.3% | +17.0% | +22.2% | |
CRWD | Revenue | +22.2% | +23.7% | +21.8% |
| EPS | −1.2% | +32.6% | +26.5% | |
PLTR | Revenue | +86.1% | +49.3% | +48.2% |
| EPS | +122.1% | +42.4% | +50.3% |
Forward fiscal years only. Blank means no analyst coverage for that year.
ServiceNow ended its June quarter with more than $1bn of annual contract value attached to artificial-intelligence products — the first time the workflow-software company has disclosed crossing that line. Serving those contracts cost it more than half its operating income.
That pairing is the news, because the application layer of the AI trade rests on an assumption: that software vendors selling agents collect the revenue while somebody else buys the accelerators. ServiceNow, which sells the Now Platform for information-technology service management, security operations and human-resources workflow to roughly 85% of the Fortune 500 on top of a configuration database that is painful to rip out, is the first large platform vendor to publish what agentic work costs to serve. The answer showed up in cost of revenue, not capital expenditure, and it showed up faster than the revenue did.
The demand side is not in question
June-quarter revenue rose 24.0% to $3.99bn, with subscription revenue of $3.877bn beating the top of guidance by about 1.5 percentage points. Net-new annual contract value from AI products grew 40% from the prior quarter. Customers running agentic AI in production grew ninefold over nine months, deals containing five or more AI products grew more than fivefold, and the company closed 123 deals worth over $1m in net-new contract value, up 40% year over year. Current remaining performance obligation of $13.2bn was up 21.5%, and the renewal rate held at 98%.
Nor is this relabeled renewal money. ServiceNow's AI Pro tiers carry a 30% price uplift, its AI-native products 20% to 30%, and roughly half of new business is now sold on something other than a seat. Every business process in every industry is "being refactored for agentic AI," chief executive Bill McDermott told analysts on the July 22 call. He also said cybersecurity "will be bigger than ServiceNow is in next few years," after the Vesa and Armis deals built a security business already past $1bn.
The cost side is
Gross margin under generally accepted accounting principles fell to 70.68% from 77.48% a year earlier — 6.8 points surrendered in twelve months. Gross profit therefore grew 13.1% against 24.0% revenue growth, and operating income fell 54.7%, to $162m from $358m. Management attributes the pressure to greater use of hyperscaler capacity and to accelerating AI inference consumption, and guided full-year non-GAAP subscription gross margin to 81%, framing the cost as a near-term headwind that becomes a tailwind as hyperscaler prices fall and token use is optimized. It raised full-year subscription revenue guidance by $15m — after a beat management said was roughly half an on-premise pull-forward from the September quarter on federal timing.
The shares rose 34.6% over the 30 sessions to August 21 anyway. Trailing gross profit rose about 3% in that window, so roughly nine-tenths of the move was multiple: from about 9.3x trailing gross profit to 12.06x. Two sessions carried most of it. On July 27 ServiceNow jumped 8%, Salesforce 7% and Workday 10% on rotation out of falling chip stocks; on August 19 ServiceNow rose 6.5% and Salesforce 5.1% while the SOXX semiconductor fund fell 2.2%. The likelier trigger is reporting on softer AI revenue projections and off-balance-sheet AI commitments at the large hardware buyers. It was not a duration trade: the 30-year Treasury yield sat at a 19-year high above 5.28% on August 18, the same week the longest-duration equities in the market re-rated.
Two vendors who have not shown the same bill
Salesforce, which sells the Customer 360 suite largely per licensed user, has the opposite pairing: revenue growth accelerating three straight quarters to 13.3%, gross margin unchanged at 76.9%, operating margin up to 21.8%. It disclosed $3.4bn of combined Agentforce and Data 360 annual recurring revenue in May, Agentforce alone at $1.2bn and up 205%, alongside 28.6 trillion tokens processed. Its agents sit on separate price books — $500 per 100,000 Flex Credits, about ten cents a standard agent action — layered on a seat the customer still buys. At 5.15x trailing gross profit against roughly 7.71x a year ago, and 14.8x forward earnings versus 24.1x trailing, it is the cheapest of the three.
Snowflake, billed by consumption rather than by seat, never de-rated at all. Product revenue grew 34% in the April quarter, net revenue retention was 126%, and gross margin held flat at 66.6%. It trades at 34.13x trailing gross profit against about 23.7x a year ago — the only one of the three above its own year-ago mark.
So the verdict splits. The AI dollars at the application layer are real, disclosed in dollars, and growing faster than the seat base beneath them; that part the businesses have earned. What none of the three earned in the past month is the re-rating itself, which arrived without a single new financial disclosure at Salesforce or Snowflake. And ServiceNow alone has published the price of winning the demand argument. The question is no longer whether agent work can be billed. It is at what margin.
Salesforce reports fiscal second-quarter results on Wednesday, its first new numbers since May, and Snowflake follows on September 2. Between them they will say whether the cost curve ServiceNow just showed is a ServiceNow problem or the industry's.