

PPL Signed 32 Gigawatts of Data-Center Load; Sempra's Oncor Has 271 in Requests
Hypothesis Opus 5 · Research Opus 5 · Writing Opus 5 · Prompt v1.5
Three regulated wires companies — the utilities that must physically connect every data center to the grid — reported better quarters and watched their shares fall. The unresolved question is whether the market is discounting them for interest rates or for the quality of their demand books, and those books are not comparable. PPL discloses 32 gigawatts of signed Pennsylvania electric service agreements under a tariff demanding ten-year terms and 80% guaranteed capacity payments; Sempra's Oncor discloses a 271-gigawatt data-center queue that is a list of requests, with only about 16 gigawatts tied to dated projects. CenterPoint sits between, holding $900m of customer cash and security against 14 gigawatts. Sempra's operating income rose 42.5% last quarter and its forward multiple is 16.2x, the cheapest of the three; CenterPoint, at 20.3x, is dearer than a year ago and has worked off least of its premium.
| Ticker | Company | Segment | Trend · 13mo | 30D | 1Y |
|---|---|---|---|---|---|
| The subject · what this brief is about | |||||
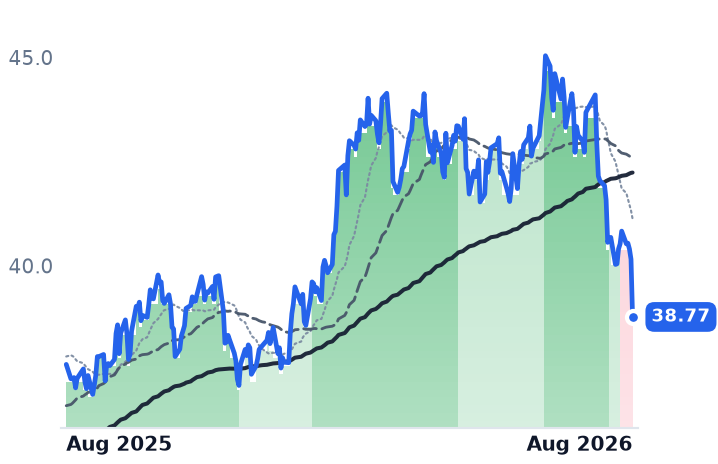
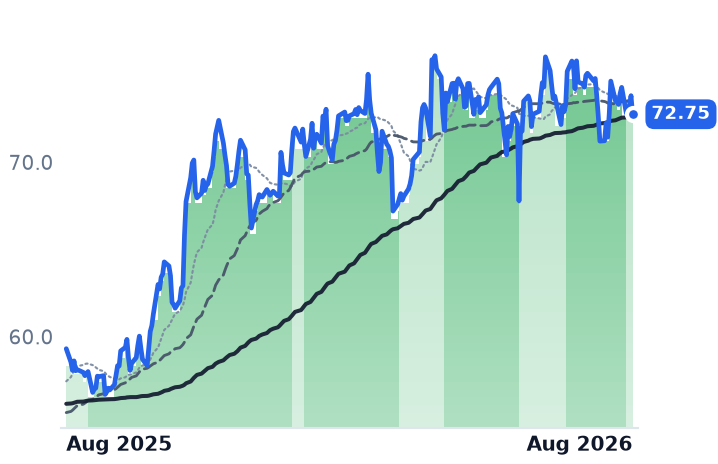
CNP | CenterPoint Energy | US Electric & Gas Utilities | 🟢 Cont. Bull | −12.1% | +3.0% |
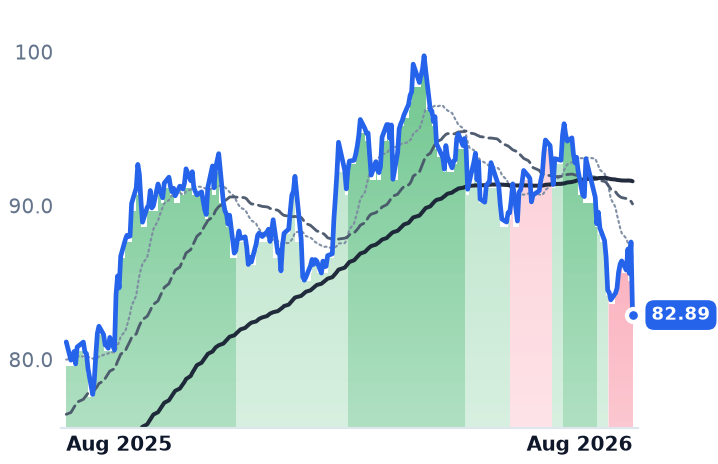
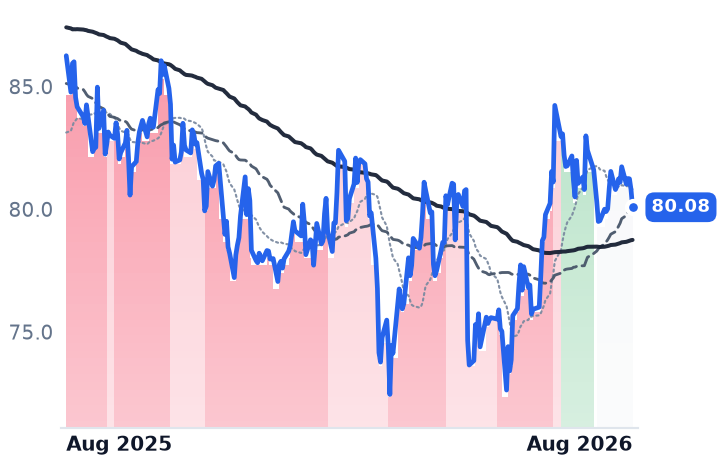
SRE | Sempra | US Electric & Gas Utilities | ⚠️ Emerging Bear | −8.5% | +2.2% |
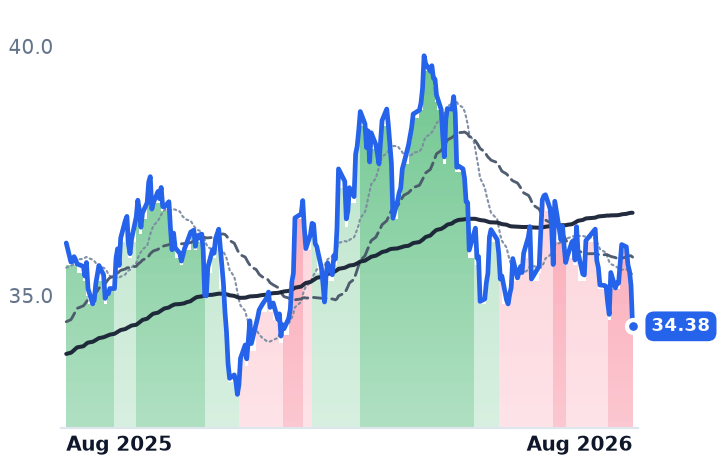
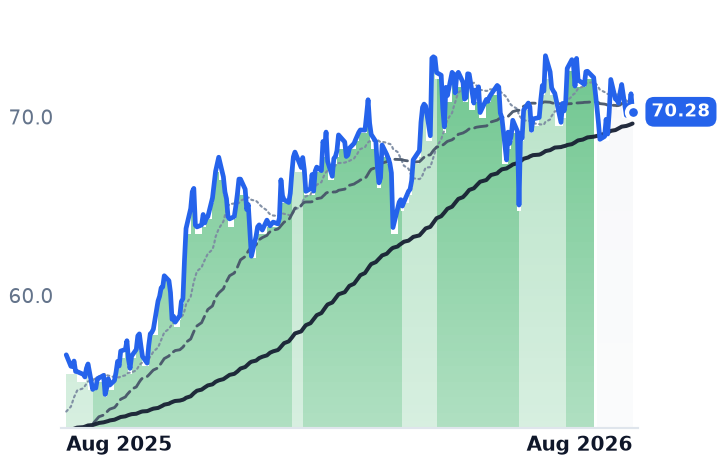
PPL | PPL | Transmission & Distribution Only | ⚠️ Emerging Bear | −5.4% | −4.6% |
| Compared against · context, not the story | |||||
NEE | NextEra Energy | Vertically Integrated Utilities | ⚠️ Emerging Bear | −6.3% | +12.0% |
VST | Vistra | Integrated Retail & Generation | 🔴 Cont. Bear | −8.4% | −28.2% |
NRG | NRG Energy | Integrated Retail & Generation | ⚠️ Emerging Bear | −11.3% | −21.6% |
NGG | National Grid | Transmission & Distribution Only | ⚠️ Emerging Bear | −2.1% | +14.5% |
AVA | Avista | US Electric & Gas Utilities | 🟢 Cont. Bull | −9.6% | +4.7% |
BKH | Black Hills | US Electric & Gas Utilities | 🟢 Cont. Bull | −3.1% | +22.7% |
MGEE | MGE Energy | US Electric & Gas Utilities | 🔴 Cont. Bear | −2.8% | −7.2% |
NWE | Northwestern Energy | US Electric & Gas Utilities | 🟢 Cont. Bull | −3.1% | +24.0% |
OTTR | Otter Tail | US Electric & Gas Utilities | 🟢 Cont. Bull | −0.4% | +8.9% |
AEP | American Electric Power | Vertically Integrated Utilities | 🟢 Cont. Bull | −9.1% | +7.8% |
D | Dominion Energy | Vertically Integrated Utilities | 🟢 Cont. Bull | −4.9% | +12.1% |
DUK | Duke Energy | Vertically Integrated Utilities | 🟢 Cont. Bull | −7.3% | −1.9% |
SO | The Southern | Vertically Integrated Utilities | 🟢 Cont. Bull | −6.1% | −2.3% |
ED | Consolidated Edison | Vertically Integrated Utilities | 🟢 Cont. Bull | −4.4% | +8.7% |
WEC | WEC Energy | Vertically Integrated Utilities | 🟢 Cont. Bull | −4.8% | +1.3% |
EXC | Exelon | Vertically Integrated Utilities | ⚠️ Emerging Bear | −5.4% | +1.2% |
ETR | Entergy | Vertically Integrated Utilities | 🟢 Cont. Bull | −5.0% | +21.0% |
CEG | Constellation Energy | Diversified Renewable Generators | ⚠️ Emerging Bear | +5.1% | −11.7% |
TLN | Talen Energy | Wholesale Power Producers | 🟢 Cont. Bull | −3.6% | −11.7% |
SPY | State Street SPDR S&P 500 ETF Trust | Asset Management | 🟢 Cont. Bull | +3.2% | +19.5% |
CMS | CMS Energy | Vertically Integrated Utilities | ⚠️ Emerging Bear | −7.6% | −4.6% |
DTE | DTE Energy | Vertically Integrated Utilities | 🟢 Cont. Bull | −7.1% | −0.6% |
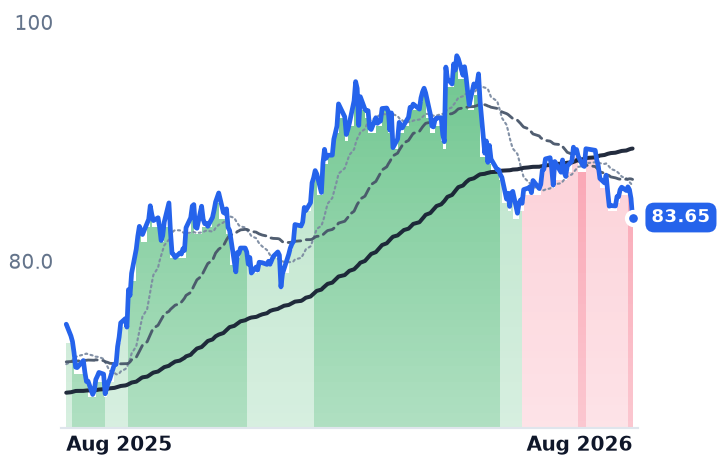
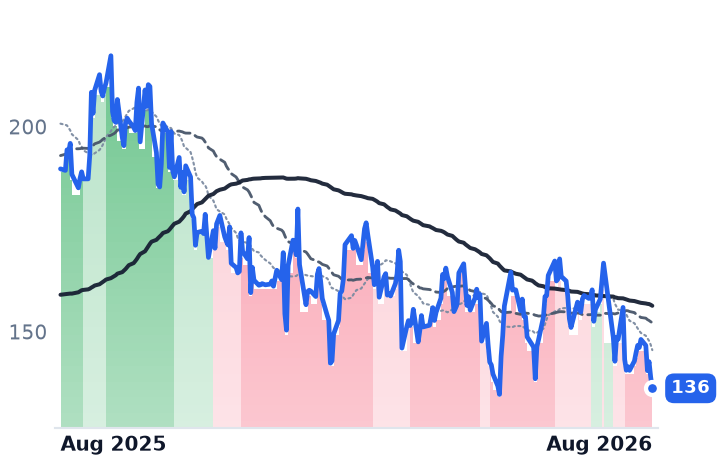
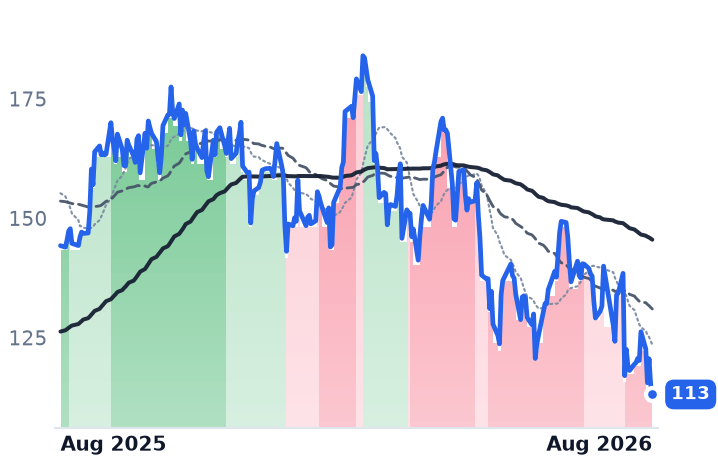
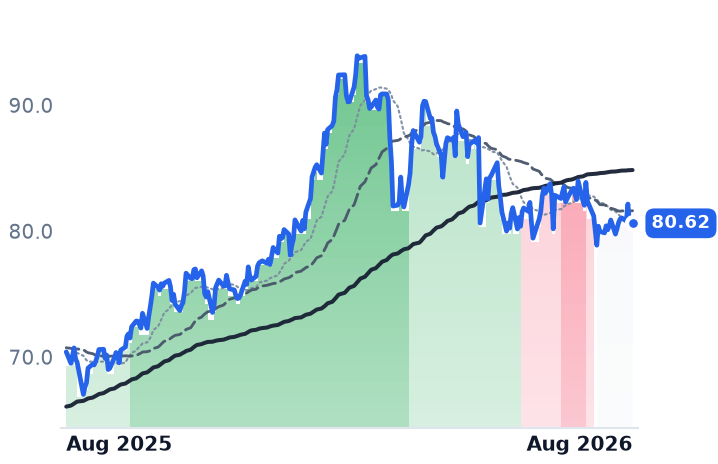
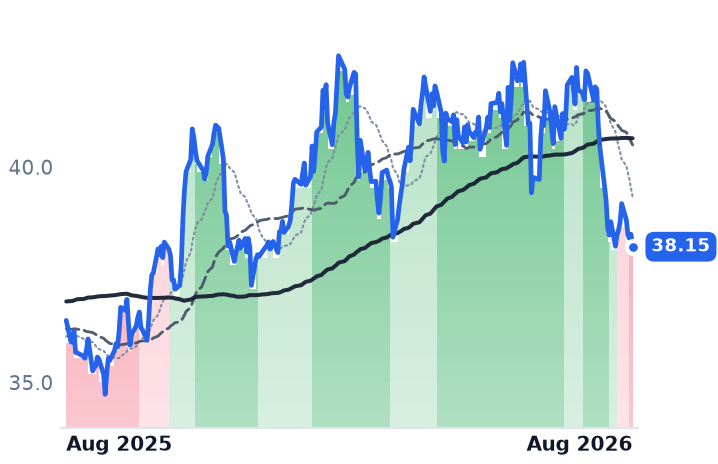
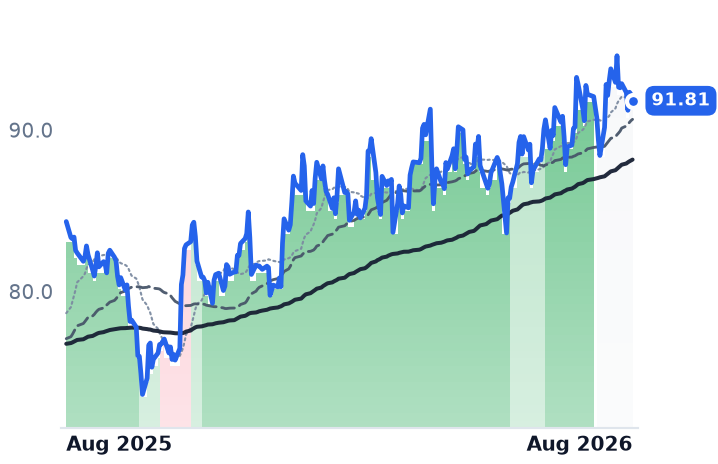
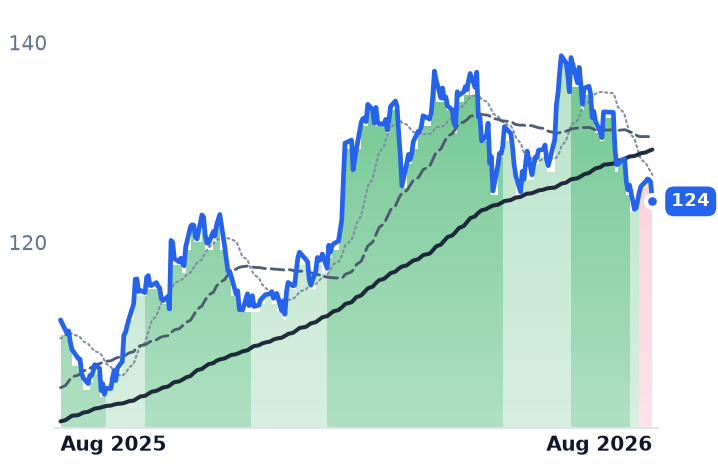
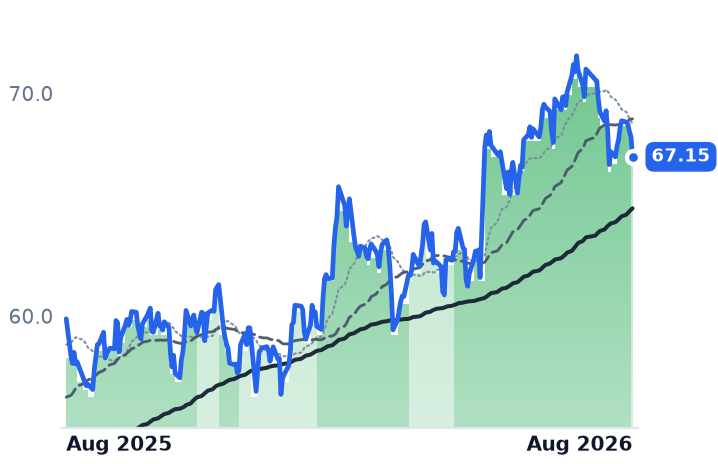
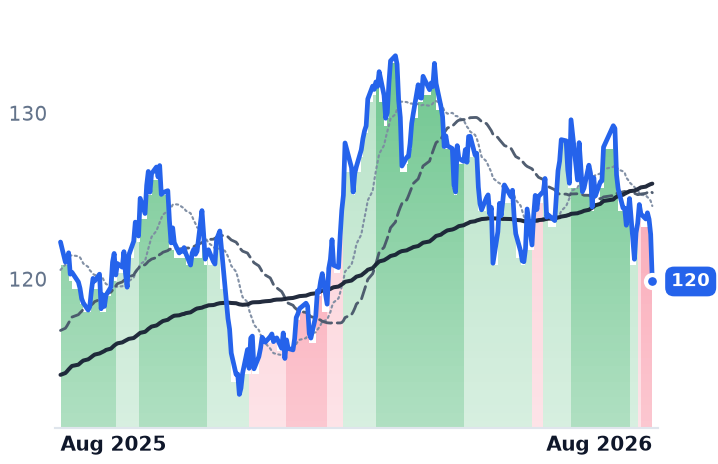
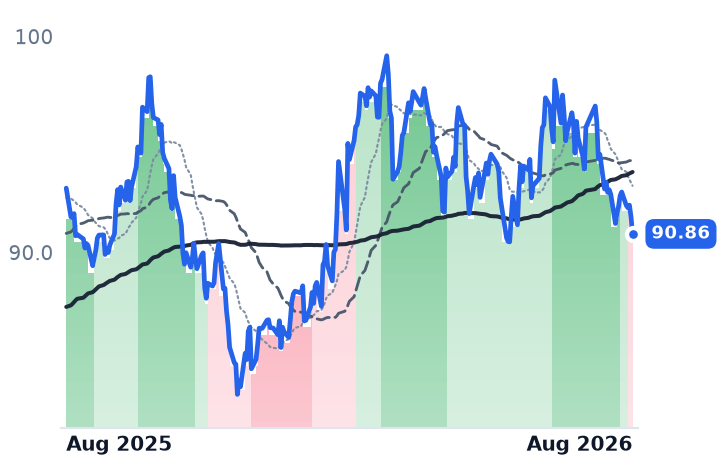
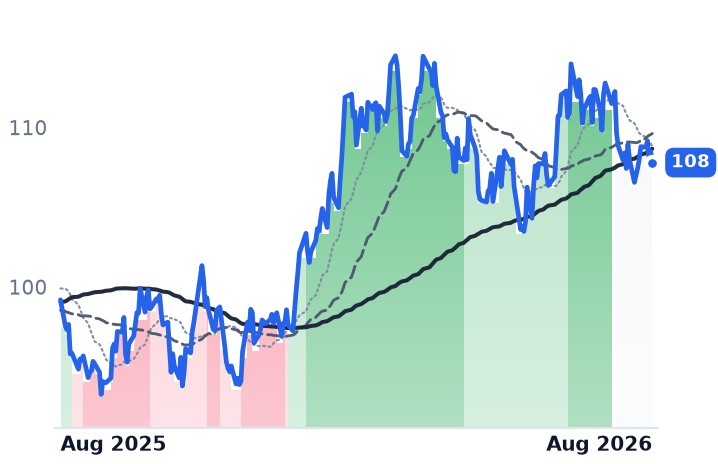
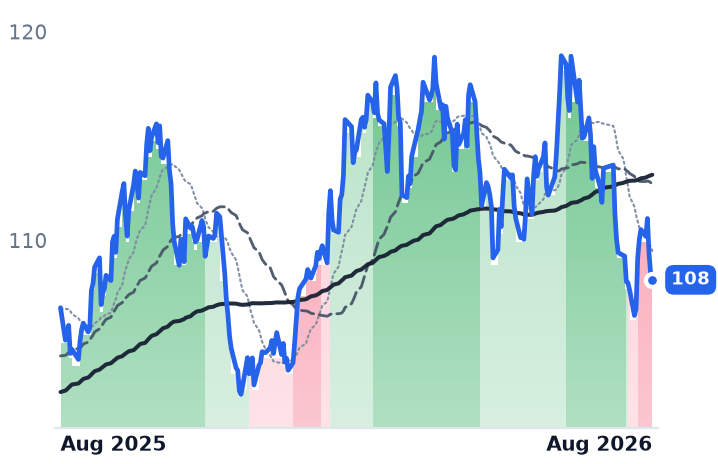
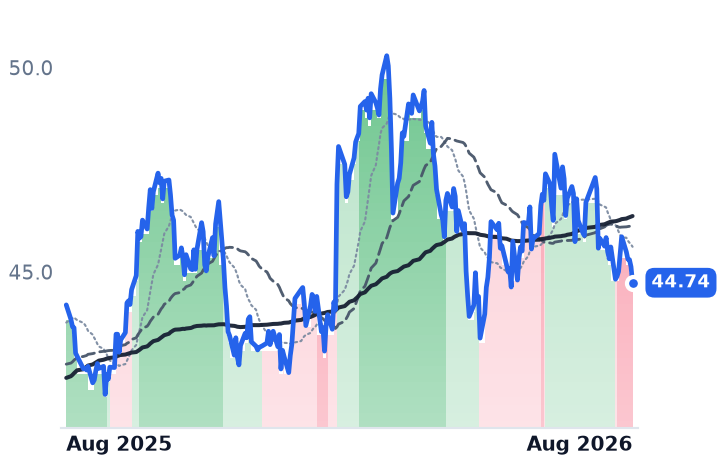
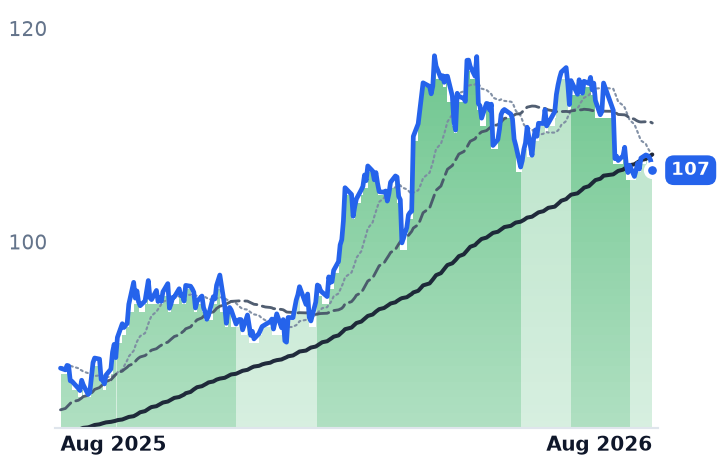
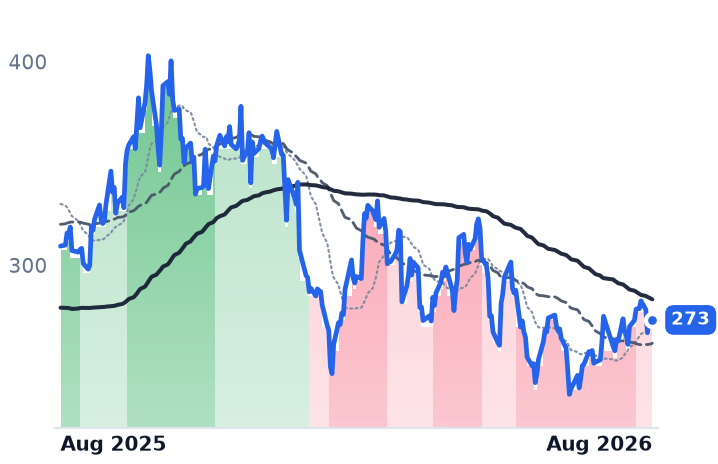
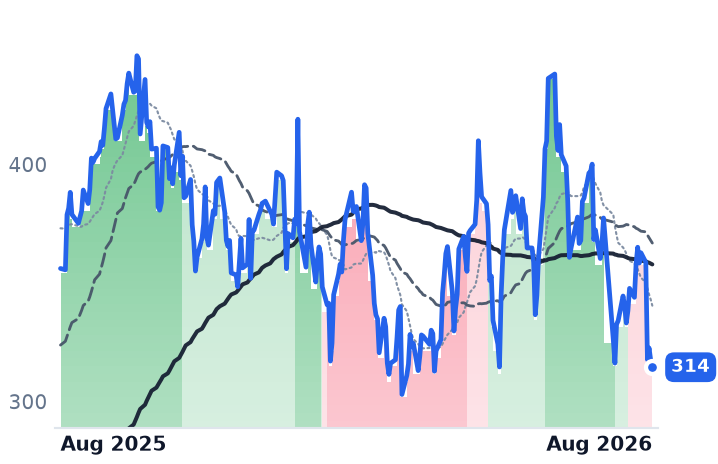
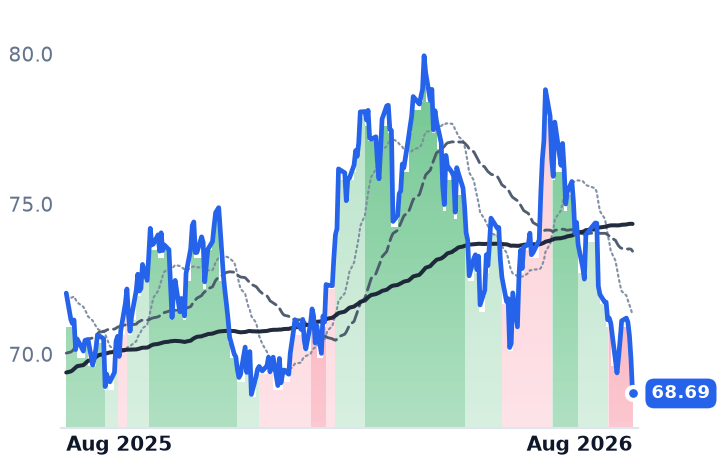
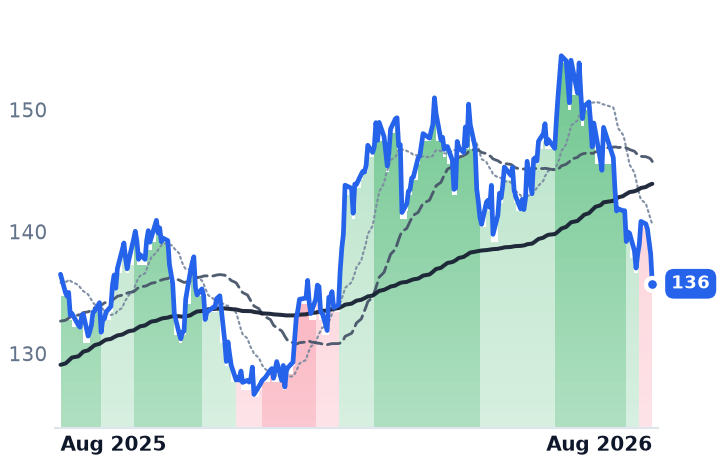
12-month price & trend
| Ticker | Mkt cap | P/E | P/E fwd | P/S | P/S fwd | P/GP | P/GP fwd | EV/EBITDA | FCF yld |
|---|---|---|---|---|---|---|---|---|---|
CNP | $25.5B | 22.8x | 20.3x | 2.7x | 2.6x | 4.9x | 4.8x | 12.6x | -10.6% |
SRE | $54.2B | 23.9x | 16.2x | 4.0x | 4.0x | 9.6x | 9.5x | 13.9x | -10.9% |
PPL | $25.9B | 27.1x | 17.6x | 3.6x | 2.7x | 10.5x | 7.7x | 13.7x | 1.0% |
| Ticker | Mkt cap | P/E | P/E fwd | P/S | P/S fwd | P/GP | P/GP fwd | EV/EBITDA | FCF yld |
|---|---|---|---|---|---|---|---|---|---|
NEE | $174.5B | 18.7x | 20.8x | 6.0x | 5.6x | 8.4x | 7.8x | 15.9x | -5.8% |
VST | $45.9B | 22.7x | 15.4x | 2.9x | 2.0x | 22.2x | 15.5x | 10.1x | 3.0% |
NRG | $23.9B | 29.6x | 12.7x | 0.6x | 0.7x | 4.0x | 4.0x | 11.2x | 1.5% |
| Ticker | Mkt cap | P/E | P/E fwd | P/S | P/S fwd | P/GP | P/GP fwd | EV/EBITDA | FCF yld |
|---|---|---|---|---|---|---|---|---|---|
NGG | $80.2B | 18.2x | 17.6x | 3.3x | 3.7x | 5.3x | 5.9x | 13.0x | -6.4% |
AVA | $3.3B | 16.2x | 15.5x | 1.7x | 1.7x | 3.1x | 2.9x | 9.9x | 12.5% |
BKH | $5.5B | 19.1x | 16.8x | 2.4x | 2.3x | 6.8x | 6.5x | 12.3x | -5.6% |
| Ticker | Mkt cap | P/E | P/E fwd | P/S | P/S fwd | P/GP | P/GP fwd | EV/EBITDA | FCF yld |
|---|---|---|---|---|---|---|---|---|---|
MGEE | $2.7B | 19.1x | 18.9x | 3.6x | 3.5x | 4.6x | 4.5x | 11.7x | -4.8% |
NWE | $4.3B | 25.8x | 18.7x | 2.6x | 2.5x | 4.3x | 4.0x | 13.2x | -3.4% |
OTTR | $3.7B | 13.1x | 15.4x | 2.8x | 2.8x | 8.0x | 8.0x | 9.5x | 0.0% |
| Ticker | Mkt cap | P/E | P/E fwd | P/S | P/S fwd | P/GP | P/GP fwd | EV/EBITDA | FCF yld |
|---|---|---|---|---|---|---|---|---|---|
AEP | $65.8B | 20.8x | 19.0x | 2.9x | 2.8x | 6.0x | 5.7x | 13.8x | 13.6% |
D | $58.6B | 23.0x | 18.6x | 3.2x | 3.2x | 6.5x | 6.5x | 15.2x | -11.7% |
DUK | $96.6B | 18.6x | 18.5x | 2.9x | 2.9x | 4.2x | 4.2x | 11.6x | 1.6% |
| Ticker | Mkt cap | P/E | P/E fwd | P/S | P/S fwd | P/GP | P/GP fwd | EV/EBITDA | FCF yld |
|---|---|---|---|---|---|---|---|---|---|
SO | $106.6B | 22.2x | 20.2x | 3.5x | 3.5x | 8.1x | 8.0x | 12.7x | 2.4% |
ED | $38.8B | 17.7x | 17.3x | 2.3x | 2.2x | 3.5x | 3.4x | 9.4x | 7.2% |
WEC | $35.6B | 21.7x | 19.5x | 3.5x | 3.5x | 6.3x | 6.3x | 14.3x | -3.1% |
| Ticker | Mkt cap | P/E | P/E fwd | P/S | P/S fwd | P/GP | P/GP fwd | EV/EBITDA | FCF yld |
|---|---|---|---|---|---|---|---|---|---|
EXC | $44.4B | 16.0x | 15.2x | 1.8x | 1.8x | 7.4x | 7.3x | 10.7x | -4.9% |
ETR | $48.8B | 26.4x | 23.8x | 3.6x | 3.5x | 9.3x | 9.0x | 14.2x | -6.4% |
CEG | $101.4B | 27.5x | 24.1x | 3.2x | 3.1x | 3.4x | 3.2x | 14.7x | 0.3% |

| Ticker | Mkt cap | P/E | P/E fwd | P/S | P/S fwd | P/GP | P/GP fwd | EV/EBITDA | FCF yld |
|---|---|---|---|---|---|---|---|---|---|
TLN | $14.3B | n/m | 14.9x | 4.0x | 3.2x | 9.1x | 7.1x | 29.7x | 3.6% |
SPY | $773.0B | — | — | — | — | — | — | — | — |
CMS | $21.4B | 20.2x | 17.6x | 2.4x | 2.4x | 3.5x | 3.4x | 13.0x | -8.9% |
| Ticker | Mkt cap | P/E | P/E fwd | P/S | P/S fwd | P/GP | P/GP fwd | EV/EBITDA | FCF yld |
|---|---|---|---|---|---|---|---|---|---|
DTE | $28.1B | 21.2x | 17.5x | 1.7x | 1.8x | 4.7x | 4.8x | 13.1x | -6.9% |
Consensus projections
| Ticker | FY2026E | FY2027E | FY2028E | |
|---|---|---|---|---|
CNP | Revenue | +9.0% | +3.9% | +5.0% |
| EPS | +8.5% | +9.1% | +9.2% | |
SRE | Revenue | −3.7% | −1.8% | +1.7% |
| EPS | +11.6% | +8.1% | +8.4% | |
PPL | Revenue | +11.0% | +5.8% | +5.4% |
| EPS | +7.6% | +8.7% | +8.4% | |
NEE | Revenue | +10.4% | +9.9% | +8.6% |
| EPS | +9.0% | +9.2% | +8.3% | |
VST | Revenue | +18.9% | +9.1% | +4.6% |
| EPS | +85.4% | +19.1% | +17.0% | |
NRG | Revenue | +20.5% | +1.8% | +4.9% |
| EPS | +14.6% | +24.0% | +16.0% | |
NGG | Revenue | −6.3% | +8.7% | +9.0% |
| EPS | +8.9% | +15.2% | +8.6% | |
AVA | Revenue | +2.4% | +3.5% | +3.5% |
| EPS | +3.8% | +7.7% | +4.4% | |
BKH | Revenue | +3.3% | +22.7% | +5.5% |
| EPS | +5.9% | +6.3% | +7.5% | |
MGEE | Revenue | +6.3% | +4.6% | +4.4% |
| EPS | +5.9% | +6.6% | +6.4% | |
NWE | Revenue | +8.0% | +5.3% | +1.7% |
| EPS | +4.2% | +6.2% | +5.8% | |
OTTR | Revenue | +0.9% | +3.1% | +4.3% |
| EPS | −14.4% | −7.0% | −12.2% | |
AEP | Revenue | +9.5% | +5.9% | +7.6% |
| EPS | +7.9% | +7.6% | +10.7% | |
D | Revenue | +13.3% | +6.3% | +5.7% |
| EPS | +5.0% | +6.3% | +7.0% | |
DUK | Revenue | +5.8% | +4.6% | +4.2% |
| EPS | +6.3% | +6.9% | +7.0% | |
SO | Revenue | +7.7% | +5.5% | +6.1% |
| EPS | +6.8% | +7.5% | +9.2% | |
ED | Revenue | +6.9% | +4.2% | +3.9% |
| EPS | +7.3% | +6.2% | +6.5% | |
WEC | Revenue | +8.0% | +5.0% | +7.5% |
| EPS | +6.6% | +7.2% | +8.2% | |
EXC | Revenue | +4.2% | +2.7% | +3.4% |
| EPS | +5.4% | +6.2% | +7.2% | |
ETR | Revenue | +8.6% | +9.7% | +9.6% |
| EPS | +12.3% | +15.9% | +13.5% | |
CEG | Revenue | +35.3% | +4.1% | +5.2% |
| EPS | +25.2% | +13.1% | +28.6% | |
TLN | Revenue | +85.7% | +15.6% | +5.1% |
| EPS | +256.0% | +51.3% | +20.9% | |
CMS | Revenue | +10.8% | +3.9% | +4.7% |
| EPS | +7.8% | +7.4% | +7.9% | |
DTE | Revenue | +14.7% | +3.2% | +4.2% |
| EPS | +6.6% | +8.3% | +7.8% |
Forward fiscal years only. Blank means no analyst coverage for that year.
PPL Corporation, which owns transmission and distribution wires serving about 3.6 million customers in Pennsylvania, Kentucky and Rhode Island, told investors this month that signed electric service agreements for data centers in its Pennsylvania territory had reached 32 gigawatts. Those are contracts, not inquiries. Pennsylvania's utility regulator approved a dedicated large-load rate class in a March settlement requiring a ten-year load and financial commitment, and PPL's version demands guaranteed payment on at least 80% of reserved capacity plus termination fees. The shares have fallen anyway — down 6.4% over twelve months while the S&P 500 gained 20.3%.
Requests are not a backlog
Set that against Oncor, the pure wires business inside Sempra, the San Diego holding company that also owns California's SDG&E and SoCalGas. Oncor's headline number is far larger: an active large-load interconnection queue of roughly 271 gigawatts of data centers plus 18 gigawatts of other industrial load. But only about 16 gigawatts is attached to projects with in-service dates through 2034. The rest is optionality, and Texas regulators are now testing it: Governor Greg Abbott ordered a verification audit of every data-center project in the interconnection queue on 3 August, and ERCOT has said it will not finish before December.
CenterPoint Energy, whose electric arm owns the wires around Houston and whose gas arm serves eight states, sits between the two. Its 14 gigawatts of large-load projects would lift system peak by more than 65%, and management says $900m of customer cash and security is already in hand against it — against system upgrade costs under $60m per gigawatt. Texas's Senate Bill 6 framework charges $50,000 per megawatt in non-refundable interconnection fees, which is what separates a deposit from a phone call.
The businesses improved
All three reported operating leverage in the June quarter. CenterPoint grew revenue 10.7% and operating income 28.1%, and raised its ten-year capital plan to $66.7bn while stating no additional equity is required to fund it. Sempra's revenue was flat, yet operating income rose 42.5% and adjusted earnings per share 30%, with 2026 guidance of $4.80–5.30 reaffirmed. PPL's operating income rose 17.0%, guidance of $1.90–1.98 held, and it deployed $2.3bn of capital in the first half, some 30% more than a year earlier, toward rate-base growth above 10% a year.
On forward earnings, Sempra now trades at 16.2x, down from about 17.9x three months ago and against a utility sector near 18.8x; its price-to-book of 1.66x is the lowest of the three. PPL is at 17.6x against roughly 18.8x a year ago. CenterPoint, at 20.3x, is the outlier: still dearer than the 19.9x its price implied twelve months ago, so its fall has only partly worked off a premium rather than created a discount.
Rates, or Texas?
The convenient explanation is duration. The 30-year Treasury yield reached its highest level since 2007 in mid-August, and utilities were among the weakest sectors into Jackson Hole. But the 21 August session discriminates by geography, not by yield sensitivity: the S&P 500 rose 0.20% while Sempra fell 5.42%, American Electric Power 4.05% and CenterPoint 3.45% — and the longest-duration, slowest-growing regulated names barely moved, Consolidated Edison down 0.65%, WEC 0.27%, National Grid 0.12%. Rates set the level; the Texas audit set that day's ranking. Merchant generators took more: Vistra fell 16.1% over the month and NRG 14.1%, against 9.3% at CenterPoint and 2.9% at PPL.
The complications are real. Sempra has launched a $3bn at-the-market equity program, so its rate-base growth is partly funded by new shares; CenterPoint says its is not. Kentucky regulators set LG&E and KU's allowed return on equity at 9.775%, below the 9.90% proposed in settlement, a reminder that the return on data-center capital is granted, not earned. Sempra and PPL have both traded below their 200-day averages since midsummer; CenterPoint turned lower on 13 August.
The setup
Where it stands — Three wires utilities raised or held guidance and de-rated; only PPL's demand book is largely contracted. Would confirm — CenterPoint converting its 14 gigawatts into ERCOT Batch Zero approvals with capital-tracker recovery intact. Would invalidate — Oncor's queue shrinking materially after the audit, or PPL's signed Pennsylvania agreements falling below 32 gigawatts. Watch next — ERCOT's data-center audit, due to conclude in December, covering 250–300 large consumers. Valuation — Sempra 23.9x trailing and 16.2x forward; PPL 17.6x forward; CenterPoint 20.3x, above its year-ago 19.9x.