

TD Synnex's Hyperscaler Business Earns Better Margins Than Distribution — and Burns Cash
Hypothesis Opus 5 · Research Opus 5 · Writing Opus 5 · Prompt v1.5
The standard description of TD Synnex's hyperscaler unit is that it converts expensive graphics processors and memory into low-margin revenue that ties up cash rather than earning it. Half of that is now wrong. Hyve, the unit that designs and builds data-center racks to order, ran a 3.3% non-GAAP operating margin last quarter against 2.0% at the distribution arm — the hyperscaler book is the richer one, and gross billings there more than doubled to $5.5bn.
The cash half holds. Net working capital jumped from $4.2bn to $4.9bn in a single quarter, free cash flow went negative, and the trailing free-cash-flow yield is 1.87% against 8.34% at Arrow Electronics and 9.50% at Insight Enterprises. TD Synnex has re-rated to 4.20x trailing gross profit from roughly 3.4x a year ago. Arrow and Insight, growing gross profit just as fast, did not.
| Ticker | Company | Segment | Trend · 13mo | 30D | 1Y |
|---|---|---|---|---|---|
| The subject · what this brief is about | |||||
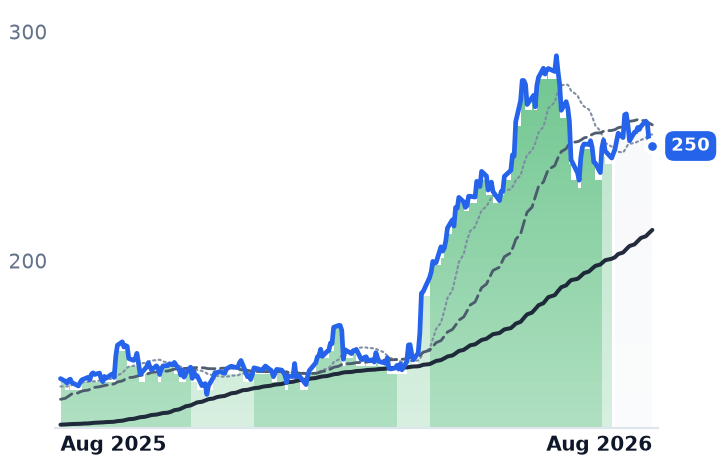
SNX | TD Synnex | Broad IT Infrastructure | 🟢 Cont. Bull | +0.9% | +68.4% |
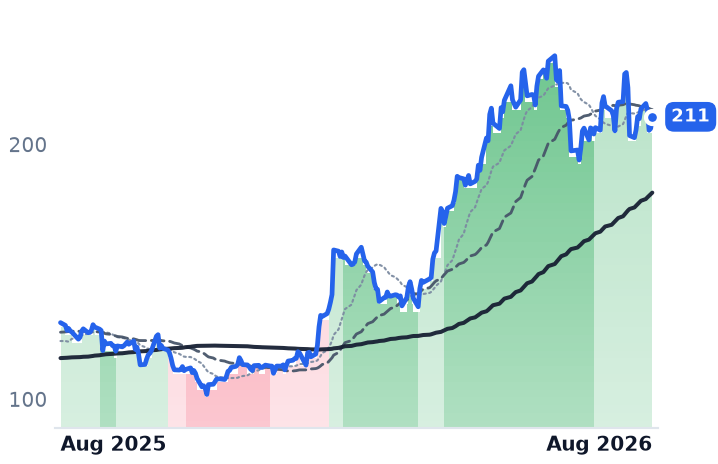
ARW | Arrow Electronics | Enterprise IT Solutions | 🟢 Cont. Bull | −2.0% | +62.1% |
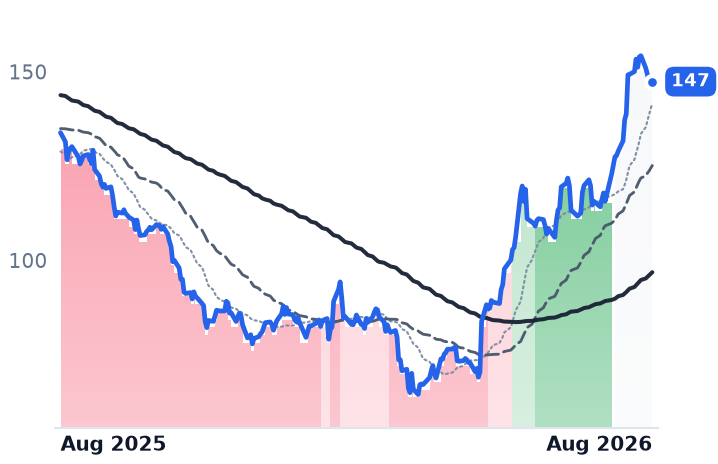
NSIT | Insight Enterprises | Enterprise IT Solutions | 🌱 Emerging Bull | +27.4% | +10.1% |
| Compared against · context, not the story | |||||
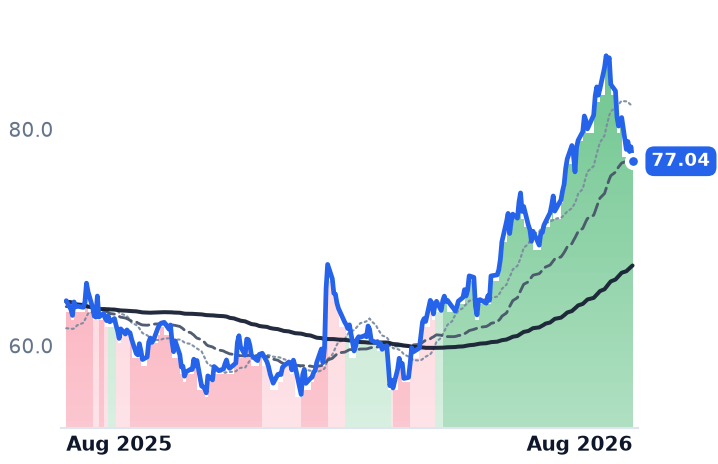
CNXN | PC Connection | Enterprise IT Solutions | 🌱 Emerging Bull | −3.7% | +20.1% |
CDW | CDW | IT Infrastructure & Operations | 🌱 Emerging Bull | +5.4% | −16.7% |
CLS | Celestica | Electronic Manufacturing Services | 🟢 Cont. Bull | −15.3% | +57.0% |
SMCI | Super Micro Computer | Server & Infrastructure Systems | 🌱 Emerging Bull | +30.9% | −15.1% |
INGM | Ingram Micro | IT Infrastructure & Operations | 🟢 Cont. Bull | −7.0% | +38.0% |
12-month price & trend
| Ticker | Mkt cap | P/E | P/E fwd | P/S | P/S fwd | P/GP | P/GP fwd | EV/EBITDA | FCF yld |
|---|---|---|---|---|---|---|---|---|---|
SNX | $20.0B | 17.8x | 13.2x | 0.3x | 0.3x | 4.2x | 3.9x | 10.6x | 1.9% |
ARW | $10.8B | 13.4x | 9.7x | 0.3x | 0.3x | 2.7x | 2.4x | 9.9x | 8.3% |
NSIT | $4.5B | 21.5x | 11.8x | 0.5x | 0.5x | 2.3x | 2.3x | 12.2x | 9.5% |

| Ticker | Mkt cap | P/E | P/E fwd | P/S | P/S fwd | P/GP | P/GP fwd | EV/EBITDA | FCF yld |
|---|---|---|---|---|---|---|---|---|---|
CNXN | $2.0B | 20.5x | 18.6x | 0.7x | 0.6x | 3.5x | 3.3x | 12.9x | 1.7% |
CDW | $17.6B | 16.5x | 12.6x | 0.7x | 0.7x | 3.5x | 3.4x | 12.7x | 6.3% |
CLS | $34.1B | 30.5x | 25.9x | 2.2x | 1.6x | 18.8x | 14.1x | 22.8x | 1.5% |

| Ticker | Mkt cap | P/E | P/E fwd | P/S | P/S fwd | P/GP | P/GP fwd | EV/EBITDA | FCF yld |
|---|---|---|---|---|---|---|---|---|---|
SMCI | $24.1B | 10.2x | 8.6x | 0.6x | 0.4x | 5.7x | 3.3x | 7.7x | -28.9% |
INGM | $6.3B | 14.8x | 8.0x | 0.1x | 0.1x | 1.7x | 1.6x | 7.5x | -3.7% |
Consensus projections
| Ticker | FY2026E | FY2027E | FY2028E | |
|---|---|---|---|---|
SNX | Revenue | +20.5% | +7.0% | +8.9% |
| EPS | +44.9% | +12.9% | +15.9% | |
ARW | Revenue | +32.1% | +7.6% | +7.9% |
| EPS | +109.8% | +12.5% | +10.8% | |
NSIT | Revenue | +6.7% | +3.8% | +6.2% |
| EPS | +28.5% | +6.0% | +16.6% | |
CNXN | Revenue | +7.0% | +2.4% | — |
| EPS | +22.8% | +6.9% | — | |
CDW | Revenue | +8.9% | +3.7% | +2.8% |
| EPS | +10.5% | +9.2% | +8.9% | |
CLS | Revenue | +70.0% | +71.6% | +32.3% |
| EPS | +91.5% | +73.4% | +34.8% | |
SMCI | Revenue | +77.7% | +69.8% | +17.7% |
| EPS | +33.5% | +54.8% | +23.3% | |
INGM | Revenue | +11.6% | +3.5% | +4.3% |
| EPS | +19.9% | +10.6% | +11.3% |
Forward fiscal years only. Blank means no analyst coverage for that year.
TD Synnex buys hardware, software and cloud services from vendors and resells them to the value-added resellers, integrators and managed service providers who serve corporate and government buyers. That is the boring half. The other half is Hyve, which designs and builds data-center racks to hyperscaler specification, and in the quarter ended 31 May it booked $5.5bn of gross billings there, up 117% year over year after 95% growth the quarter before. Hyve now runs programs with each of the five largest American hyperscalers, including Amazon Web Services, Microsoft Azure and Google Cloud.
The assumption attached to that kind of work is that it is a pass-through: you buy the graphics processors and the memory at whatever the market demands, add a sliver, and ship. The company's own segment disclosure says otherwise. Hyve's non-GAAP operating margin was 3.3% in the quarter, against 2.0% in distribution — and the blended margin expanded 22 basis points precisely because the hyperscaler book grew as a share of the mix. Hyve's own margin did fall 50 basis points on ramp inefficiency, while distribution's rose 34.
At the consolidated level the same thing is visible. Revenue reached $19.57bn, up 31.0%, and gross profit grew faster still, up 33.3% to $1.339bn. Gross margin widened to 6.84% from 6.73%. Gross billings of $28.9bn rose 33.4%, dead level with gross profit growth — the channel is holding its take rate while the dollar value of what passes through it inflates. That inflation is real and mechanical: conventional memory contract prices rose 90-95% in a single quarter early this year because AI data centers are expected to absorb roughly 70% of high-end DRAM in 2026 and manufacturers are steering wafers toward higher-margin high-bandwidth memory.
What the ramp costs
The bill arrives on the balance sheet. Net working capital went from $4.2bn to $4.9bn in one quarter and free cash flow turned negative, on accelerated investment in Hyve capacity. The gross cash conversion cycle barely moved, at 17 days, so this is scale rather than deterioration — but scale has to be funded. TD Synnex extended its trade receivables securitization facility to January 2028 and launched a new €650m European receivables facility in June. The cost of that funding is going the wrong way: the 30-year Treasury yield topped 5.33% on 18 August, a 19-year high.
The trailing free-cash-flow yield is 1.87%. And Hyve does not compete with other distributors for this revenue — it bids against Taiwanese contract manufacturers Quanta, Wiwynn, Wistron and Foxconn, plus Celestica and Supermicro, which hold a structural cost advantage in build-to-spec racks.
The price of the same growth, three ways
Because gross margins run 6.84% at TD Synnex, 11.26% at Arrow and 21.74% at Insight, price per dollar of gross profit is the only figure that compares them. TD Synnex trades at 4.20x trailing, up from roughly 3.4x twelve months ago. It is the most expensive of the three on that measure and the thinnest on cash return.
Arrow Electronics, which distributes semiconductors and passive components and separately sells data-center and security infrastructure through resellers, grew revenue 31.8% to $9.99bn and nearly doubled operating income to $377.3m. Its enterprise computing backlog is up more than 75% to a record. It trades at 9.67x forward earnings against 13.35x trailing — but consensus FY2026 earnings of $21.81 a share sit almost exactly on the 2022 cyclical peak of $21.80, which is why the shares fell 8.45% the day after that quarter.
Insight Enterprises, which sources, configures and manages technology for enterprises across 25 countries, is the one name that got cheaper on its own growth: price per gross-profit dollar fell to 2.35x from about 2.50x while trailing gross profit rose roughly 10%. Cloud gross profit grew 39% to $171m and services 21% to $95m; hardware gross margin fell 110 basis points, so the 60-basis-point blended expansion came entirely from the non-hardware side.
The chart and the guide
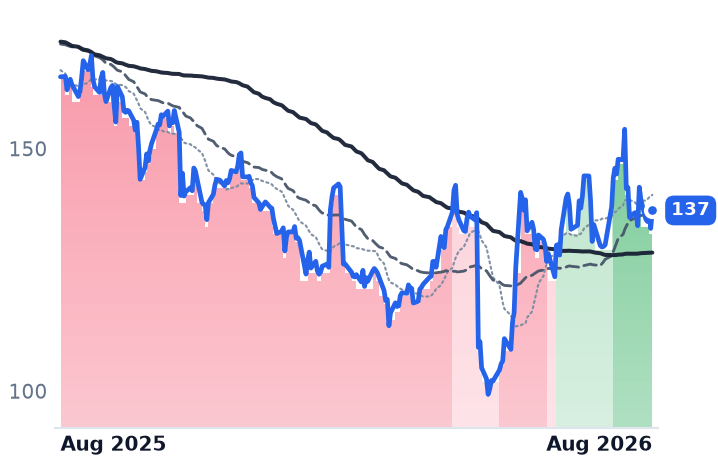
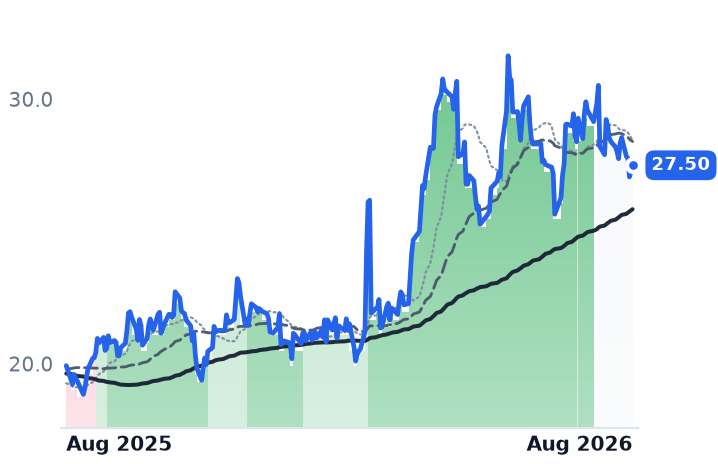
TD Synnex shares did nothing from August 2025 into March, then repriced violently — the monthly average close went from $157.40 in March to $277.08 in June, with a 16% two-session jump around the March quarter. They peaked at $290.14 on 23 June and have fallen 13.8% since, roughly flat over the past month. The turn came with the guide: management pointed to about $18.6bn of revenue and $4.50 of adjusted earnings for the current quarter, both below the $19.6bn and $4.85 just delivered. Consensus has revenue growth dropping from 20.5% this year to 7.0% next.
The setup
Where it stands — Hyve is the higher-margin segment and doubling, but funding it has taken free cash flow negative and the multiple has already expanded. Would confirm — Hyve gross billings growing above 50% year over year in the October-quarter report with segment operating margin holding near 3%. Would invalidate — A second consecutive quarter of negative free cash flow without a corresponding step-up in Hyve billings. Watch next — TD Synnex reports fiscal third-quarter results in late September, against guidance of $18.6bn and $4.50. Valuation — 4.20x trailing and 3.92x forward gross profit, against roughly 3.4x a year ago and 2.68x at Arrow.