

Sanmina Paid AMD $2.55bn for Its Server Factories. Margins Rose, Not Fell.
Hypothesis Opus 5 · Research Opus 5 · Writing Opus 5 · Prompt v1.5
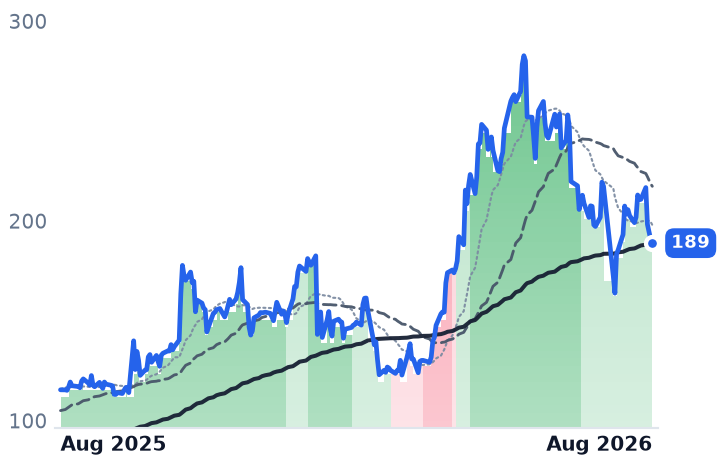
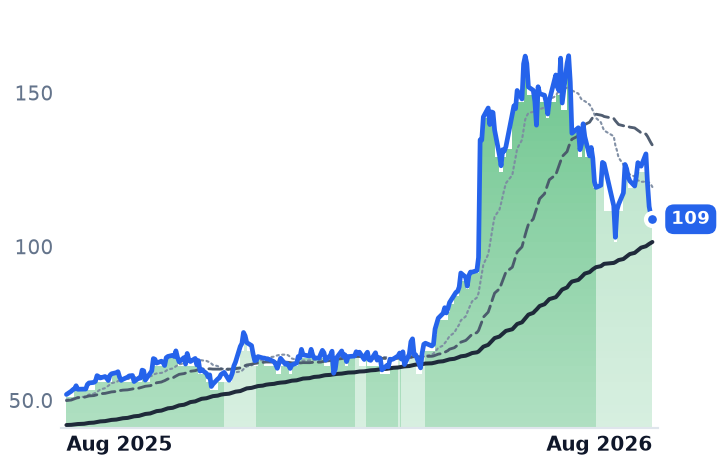
The standard objection to contract manufacturers in the artificial-intelligence build is that they add labor, not value: gigantic racks of graphics processors pass through their plants, and the cost inflation passes straight through with them. Sanmina's first full quarter owning ZT Systems, the data-center assembly business it bought from Advanced Micro Devices for $2.55bn in cash, tests that directly — and rejects it. Gross margin in the manufacturing segment that absorbed ZT rose 270 basis points to 10.2%, with revenue up 79%. The same pattern shows at Celestica, whose cloud segment margin widened to 8.7%, and at Flex, whose cloud-and-power unit earned 9.7% on 35% growth — roughly double its parent. All three shares fell over the past three months. Sanmina now trades at 15.6x forward earnings against 33.1x trailing, the widest gap in the group.
| Ticker | Company | Segment | Trend · 13mo | 30D | 1Y |
|---|---|---|---|---|---|
| The subject · what this brief is about | |||||
SANM | Sanmina | Electronic Manufacturing Services | 🟢 Cont. Bull | +9.5% | +63.6% |
CLS | Celestica | Electronic Manufacturing Services | 🟢 Cont. Bull | −15.3% | +57.0% |
FLEX | Flex | Electronic Manufacturing Services | 🟢 Cont. Bull | −2.5% | +112.7% |
| Compared against · context, not the story | |||||
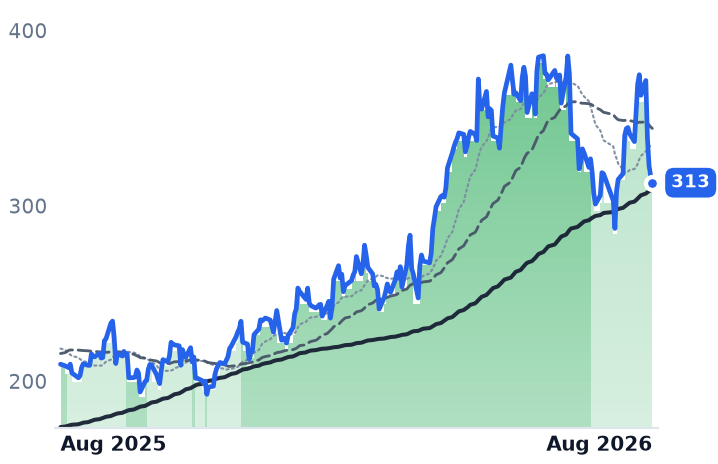
DELL | Dell Technologies | Enterprise Storage & Software | 🟢 Cont. Bull | +12.7% | +241.6% |
HPE | Hewlett Packard Enterprise | Enterprise Storage & Software | 🟢 Cont. Bull | +17.2% | +142.3% |
JBL | Jabil | Electronic Manufacturing Services | 🟢 Cont. Bull | +3.4% | +49.4% |
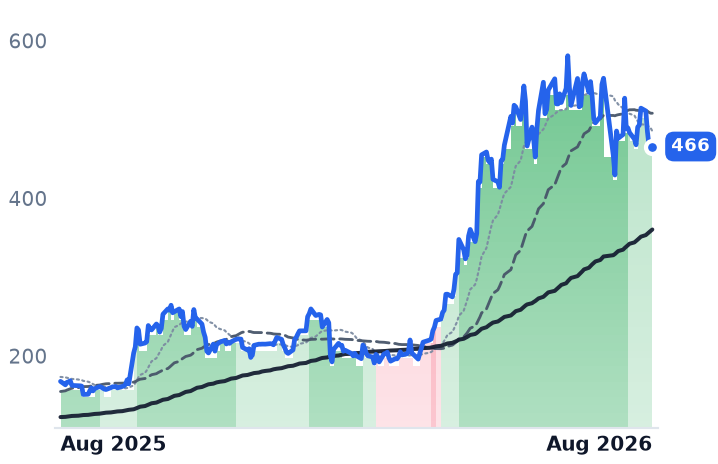
AMD | Advanced Micro Devices | AI & Data Center GPUs | 🟢 Cont. Bull | +2.4% | +177.6% |
NVDA | NVIDIA | AI & Data Center GPUs | 🟢 Cont. Bull | +9.0% | +20.6% |
SMCI | Super Micro Computer | Server & Infrastructure Systems | 🌱 Emerging Bull | +30.9% | −15.1% |
NTAP | NetApp | Enterprise Storage & Software | 🟢 Cont. Bull | +10.2% | +76.5% |
PLXS | Plexus | Electronic Manufacturing Services | 🟢 Cont. Bull | −4.1% | +74.7% |
BHE | Benchmark Electronics | Electronic Manufacturing Services | 🟢 Cont. Bull | −5.6% | +80.6% |
12-month price & trend

| Ticker | Mkt cap | P/E | P/E fwd | P/S | P/S fwd | P/GP | P/GP fwd | EV/EBITDA | FCF yld |
|---|---|---|---|---|---|---|---|---|---|
SANM | $10.1B | 33.1x | 15.6x | 0.8x | 0.7x | 8.8x | 7.9x | 16.0x | 5.9% |
CLS | $34.1B | 30.5x | 25.9x | 2.2x | 1.6x | 18.8x | 14.1x | 22.8x | 1.5% |
FLEX | $40.8B | 42.6x | 23.5x | 1.4x | 1.2x | 14.7x | 12.4x | 23.1x | 2.6% |


| Ticker | Mkt cap | P/E | P/E fwd | P/S | P/S fwd | P/GP | P/GP fwd | EV/EBITDA | FCF yld |
|---|---|---|---|---|---|---|---|---|---|
DELL | $293.6B | 34.5x | 23.5x | 2.2x | 1.7x | 11.5x | 8.9x | 21.2x | 3.2% |
HPE | $70.8B | 49.0x | 15.6x | 1.8x | 1.6x | 5.5x | 4.8x | 21.6x | 5.6% |
JBL | $32.8B | 38.7x | 24.5x | 1.0x | 0.9x | 10.6x | 10.2x | 16.7x | 4.6% |


| Ticker | Mkt cap | P/E | P/E fwd | P/S | P/S fwd | P/GP | P/GP fwd | EV/EBITDA | FCF yld |
|---|---|---|---|---|---|---|---|---|---|
AMD | $771.7B | 120.1x | 61.9x | 18.7x | 15.1x | 35.1x | 28.4x | 71.9x | 1.1% |
NVDA | $5.5T | 34.3x | 25.0x | 21.5x | 13.9x | 29.0x | 18.7x | 28.3x | 2.2% |
SMCI | $24.1B | 10.2x | 8.6x | 0.6x | 0.4x | 5.7x | 3.3x | 7.7x | -28.9% |

| Ticker | Mkt cap | P/E | P/E fwd | P/S | P/S fwd | P/GP | P/GP fwd | EV/EBITDA | FCF yld |
|---|---|---|---|---|---|---|---|---|---|
NTAP | $37.7B | 29.9x | 21.3x | 5.4x | 5.0x | 7.7x | 7.1x | 19.6x | 5.0% |
PLXS | $7.3B | 39.6x | 31.9x | 1.6x | 1.5x | 15.9x | 15.0x | 29.4x | 0.8% |
BHE | $2.6B | 49.1x | 24.6x | 0.9x | 0.9x | 9.0x | 8.5x | 18.0x | 4.8% |
Consensus projections
| Ticker | FY2026E | FY2027E | FY2028E | |
|---|---|---|---|---|
SANM | Revenue | +74.9% | +15.8% | +11.8% |
| EPS | +103.4% | +15.2% | +12.7% | |
CLS | Revenue | +70.0% | +71.6% | +32.3% |
| EPS | +91.5% | +73.4% | +34.8% | |
FLEX | Revenue | +6.8% | +26.3% | +30.0% |
| EPS | +24.2% | +44.7% | +51.5% | |
DELL | Revenue | +16.2% | +54.7% | +15.1% |
| EPS | +27.3% | +88.5% | +22.3% | |
HPE | Revenue | +30.3% | +11.5% | +5.6% |
| EPS | +80.5% | +18.1% | +9.6% | |
JBL | Revenue | +20.2% | +21.8% | +13.4% |
| EPS | +35.9% | +31.6% | +21.6% | |
AMD | Revenue | +49.6% | +73.6% | +36.8% |
| EPS | +92.9% | +105.5% | +42.5% | |
NVDA | Revenue | +65.1% | +84.2% | +43.2% |
| EPS | +59.0% | +91.7% | +42.0% | |
SMCI | Revenue | +77.7% | +69.8% | +17.7% |
| EPS | +33.5% | +54.8% | +23.3% | |
NTAP | Revenue | +4.3% | +10.0% | +5.7% |
| EPS | +10.4% | +12.9% | +11.1% | |
PLXS | Revenue | +20.8% | +13.8% | +9.0% |
| EPS | +19.5% | +15.6% | +12.0% | |
BHE | Revenue | +13.3% | +7.8% | — |
| EPS | +26.7% | +13.0% | — |
Forward fiscal years only. Blank means no analyst coverage for that year.
For a contract manufacturer, buying a chip designer's captive assembly business is a wager that someone else's cost center can be your profit center. Sanmina, the San Jose group that builds circuit boards, backplanes, cable assemblies and enclosures for industrial, medical, defense and telecom customers, placed that wager on ZT Systems, acquiring the data-center infrastructure manufacturing arm from Advanced Micro Devices for $2.55bn in cash plus up to $450m of contingent consideration. AMD kept the systems-design engineers and sold the factories. The first full quarter of ownership is now reported.
The accretion test
Revenue in the quarter ended 27 June reached $3.46bn, up 69.7% from a year earlier. The important number is beneath it. Gross margin expanded 160 basis points to 10.49%, and operating margin rose to 6.43% from 4.70%. Gross profit doubled while revenue grew by two-thirds — the opposite of what pass-through volume does to a book.
Inside the Integrated Manufacturing Solutions segment, where ZT sits, revenue rose 79.4% to $2.96bn and gross margin widened 270 basis points to 10.2%. ZT contributed $1.1bn of that; the legacy Sanmina business grew 14.1% on its own. Management attributed the margin gain to mix including ZT, plus non-recurring engineering work. The acquired factories are earning more per dollar of revenue than the business that bought them, not less.
That matters beyond Sanmina, because it identifies where the value in an artificial-intelligence rack actually settles. Hyperscale buyers increasingly bypass the branded server vendors and contract directly with the manufacturers for full-rack builds — integration, power distribution, thermal work and test. Those are engineering services sold by the rack, not metal bent by the hour.
Two corroborations
Celestica, the Toronto manufacturer that designs and builds switches, interconnects, servers and storage for hyperscalers, reported second-quarter Connectivity and Cloud Solutions revenue of $3.81bn, up 84%, at an 8.7% segment margin against 8.3% a year earlier. Its smaller Advanced Technology Solutions unit added 100 basis points to reach 6.3%. Total revenue grew 62.4% and operating income 68.2% — leverage, not dilution. Celestica now sells its own 1.6-terabit switch designs rather than assembling someone else's, with ten such programs ramping.
Flex, the Singapore-founded group whose plants turn out power supplies, switchgear and busway alongside automotive and medical assemblies, is the diversified control. Its Cloud and Power Infrastructure segment grew 35% to $2.2bn at a 9.7% operating margin — roughly double the company's consolidated 4.94%. Flex raised fiscal 2027 guidance to $33.7-35.2bn of revenue and said it is on track to spin the segment out as a separate public company in the first quarter of calendar 2027. Three companies, three structures, one direction of margin.
What would break it
Sanmina's own management named the fragilities. The non-recurring engineering benefit continues into the fourth quarter and then ramps down. Legacy ZT programs are declining toward zero as the accelerated-compute work replaces them. Working capital will build as that ramp proceeds, pressuring near-term cash flow. And the concentration has migrated from customer to end market: cloud and artificial-intelligence infrastructure is now 62% of revenue, at $2.15bn, against a $1.32bn industrial, medical and defense book growing 4.8%. Sanmina guides fiscal 2026 to $14.0-14.3bn of revenue and diluted earnings of $11.90-12.20, with fiscal 2027 targeted above $16bn. Net leverage is 0.29x.
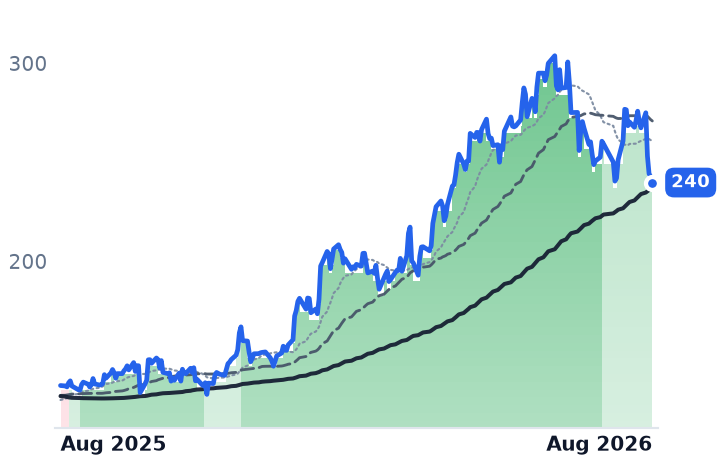
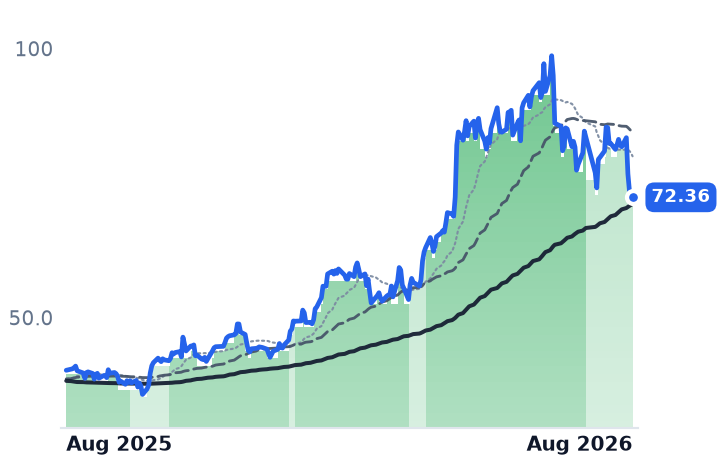
The shares have gone the other way. Sanmina fell 18.3% over three months, Celestica 14.4% and Flex 16.0%, a stretch that includes a 19-year high in the 30-year Treasury yield on 18 August — a discount-rate move that lands hardest on order books dated 2027 and 2028. Sanmina's price against a dollar of trailing gross profit fell from 13.2x in May to 8.8x. At 33.1x trailing and 15.6x forward earnings, it carries the widest gap between the two in this group; consensus has fiscal 2026 earnings at $12.10 against $4.46 delivered last year.
The setup
Where it stands — Sanmina's acquired factories lifted segment gross margin 270 basis points in their first full quarter, while the shares fell 18% in three months. Would confirm — Fourth-quarter IMS gross margin holding at or above 10% after the non-recurring engineering benefit fades. Would invalidate — Fiscal 2027 revenue guidance below the stated $16bn, or IMS gross margin returning toward last year's 7.5%. Watch next — Sanmina's fiscal fourth-quarter results, due late October, the first quarter without the flagged engineering tailwind. Valuation — 33.1x trailing and 15.6x forward earnings; 8.8x trailing gross profit against 13.2x three months ago.