

Blackstone, Apollo and Ares Ended an 11-Month Slide With Multiples No Higher Than May
Hypothesis Opus 5 · Research Opus 5 · Writing Opus 5 · Prompt v1.5
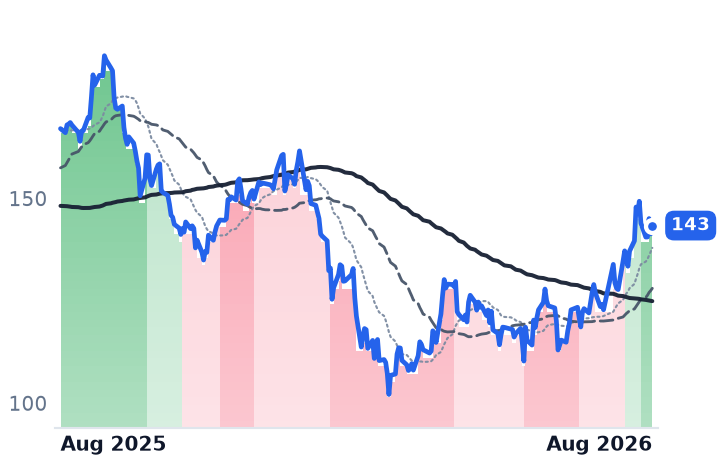
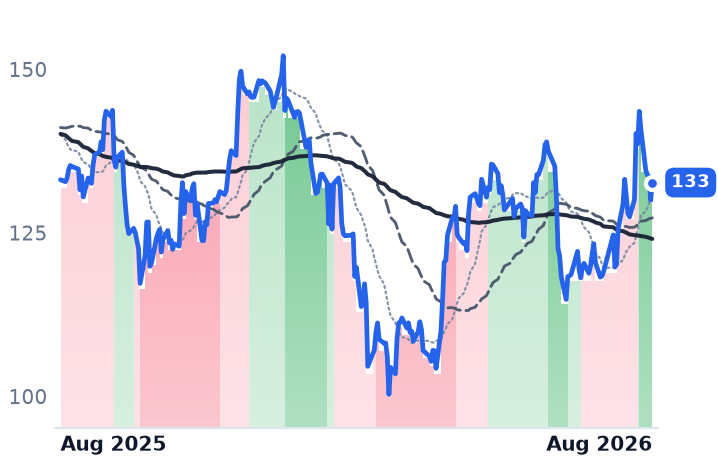
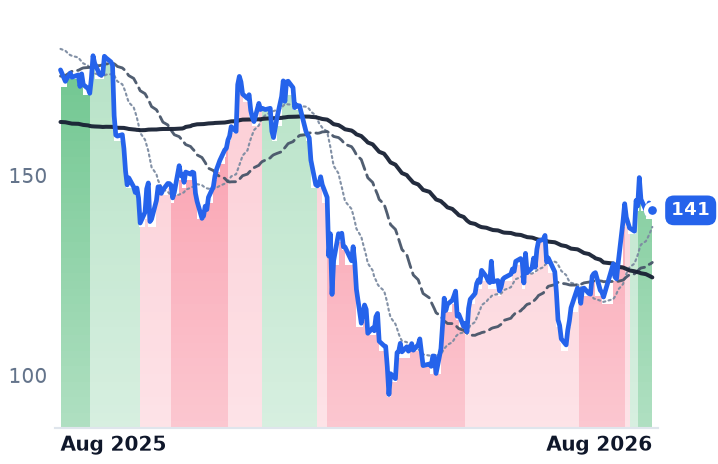
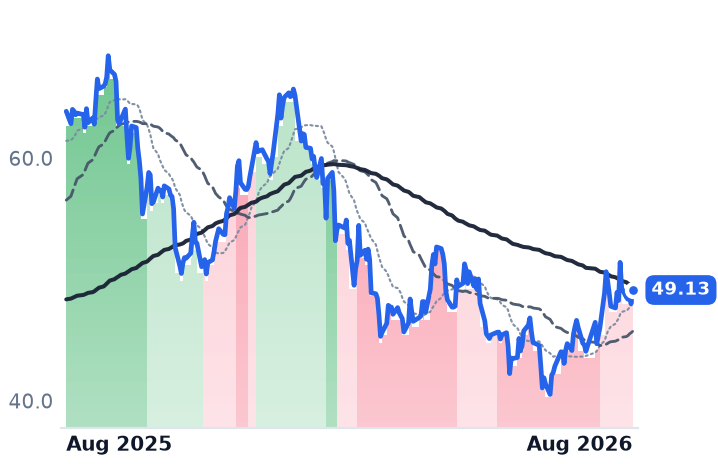
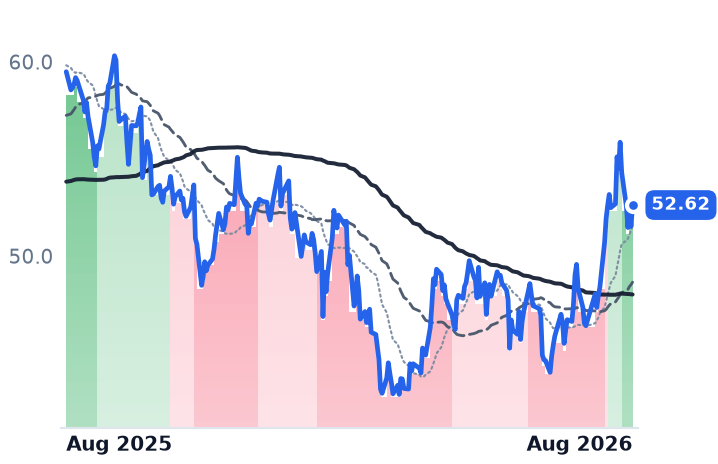
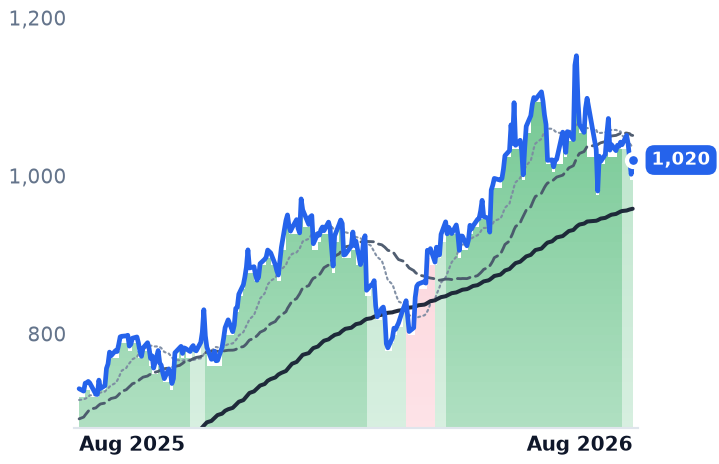
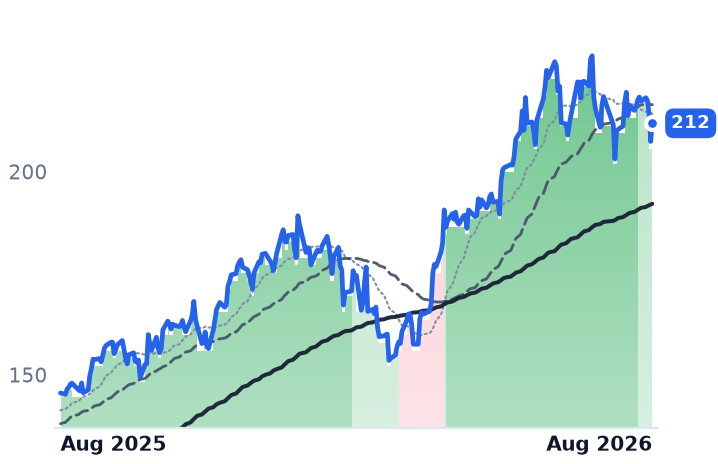
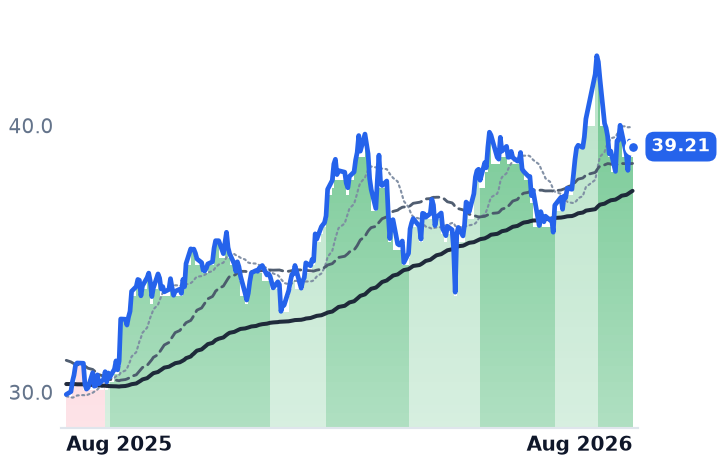
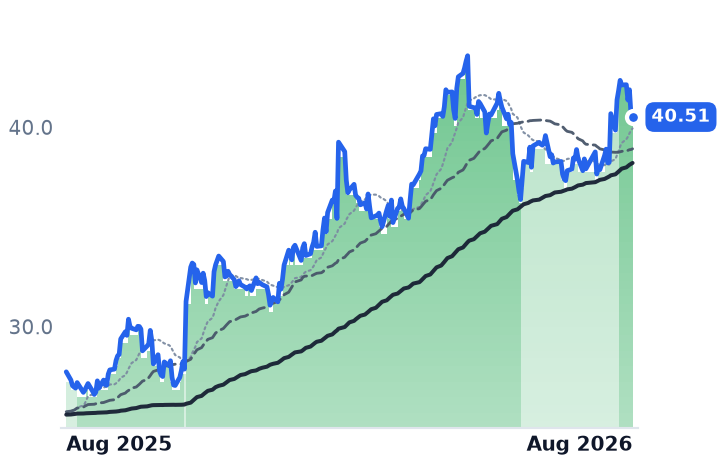
The firms that write the checks behind the AI build spent nearly a year trading as if their business were shrinking. It was not. Blackstone's fee-related earnings rose 22% last quarter and its data-center platform reached $185bn from $130bn in January; Apollo originated a record $74bn and widened Athene's net investment spread to 114 basis points from 97. Yet Blackstone is still 15.9% below where it traded a year ago and Ares 22.0%, against Goldman Sachs up 37.5%.
In the second week of August all three flipped into a sustained uptrend for the first time since last autumn. The unresolved part: trailing multiples today sit at or below where they stood in early May, so earnings — not investor enthusiasm — absorbed the entire rally. Apollo leads on both fees and cheapness; Ares, at 61.7x trailing, is the thinnest case in the group.
| Ticker | Company | Segment | Trend · 13mo | 30D | 1Y |
|---|---|---|---|---|---|
| The subject · what this brief is about | |||||
BX | Blackstone | Alternative & Private Capital | 🔴 Cont. Bear | +7.1% | −14.2% |
APO | Apollo Global Management | Alternative & Private Capital | 🌱 Emerging Bull | +6.4% | −0.3% |
ARES | Ares Management | Alternative & Private Capital | 🔴 Cont. Bear | +10.4% | −19.9% |
| Compared against · context, not the story | |||||
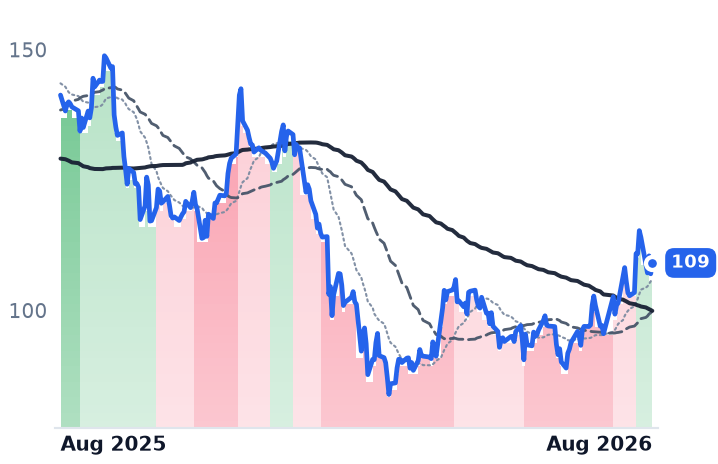
KKR | KKR | Alternative & Private Capital | 🔴 Cont. Bear | +6.3% | −22.8% |
CG | The Carlyle | Alternative & Private Capital | ⚠️ Emerging Bear | +5.7% | −23.1% |
BAM | Brookfield Asset Management | Real Estate & Infrastructure | 🔴 Cont. Bear | +9.5% | −11.5% |
BN | Brookfield | Real Estate & Infrastructure | ⚠️ Emerging Bear | +1.8% | −4.1% |
OWL | Blue Owl Capital | Alternative & Private Capital | 🔴 Cont. Bear | +18.6% | −36.0% |
GS | The Goldman Sachs | Bulge Bracket Investment Banks | 🟢 Cont. Bull | −1.3% | +39.6% |
MS | Morgan Stanley | Bulge Bracket Investment Banks | 🟢 Cont. Bull | +0.2% | +45.6% |
BIP | Brookfield Infrastructure Partners | Infrastructure & Transport Conglomerates | 🟢 Cont. Bull | −6.5% | +31.1% |
HASI | HA Sustainable Infrastructure Capital | Asset Management | 🟢 Cont. Bull | +4.5% | +46.1% |
SPY | State Street SPDR S&P 500 ETF Trust | Asset Management | 🟢 Cont. Bull | +3.2% | +19.5% |
NVDA | NVIDIA | AI & Data Center GPUs | 🟢 Cont. Bull | +9.0% | +20.6% |
AVGO | Broadcom | Semiconductor Subsystems | 🟢 Cont. Bull | −3.3% | +26.0% |
12-month price & trend
| Ticker | Mkt cap | P/E | P/E fwd | P/S | P/S fwd | P/GP | P/GP fwd | EV/EBITDA | FCF yld |
|---|---|---|---|---|---|---|---|---|---|
BX | $173.2B | 31.9x | 24.0x | 10.8x | 11.8x | 12.2x | 13.3x | 21.9x | 2.5% |
APO | $76.4B | 28.7x | 15.1x | 2.1x | 3.3x | 2.5x | 3.9x | 6.7x | 10.5% |
ARES | $46.4B | 61.7x | 24.1x | 7.3x | 8.7x | 11.6x | 13.9x | 23.9x | 1.8% |
| Ticker | Mkt cap | P/E | P/E fwd | P/S | P/S fwd | P/GP | P/GP fwd | EV/EBITDA | FCF yld |
|---|---|---|---|---|---|---|---|---|---|
KKR | $102.4B | 33.9x | 18.4x | 4.8x | 9.7x | 10.4x | 20.8x | 15.1x | 8.3% |
CG | $17.7B | 48.7x | 13.7x | 4.5x | 4.8x | 6.3x | 6.7x | 35.2x | -11.3% |
BAM | $86.7B | 31.2x | 29.5x | 16.0x | 14.2x | 20.0x | 17.8x | 90.0x | 2.5% |
| Ticker | Mkt cap | P/E | P/E fwd | P/S | P/S fwd | P/GP | P/GP fwd | EV/EBITDA | FCF yld |
|---|---|---|---|---|---|---|---|---|---|
BN | $93.3B | 73.4x | 15.1x | 1.2x | 12.3x | 4.2x | 42.8x | 10.3x | -8.9% |
OWL | $19.1B | 102.3x | 13.8x | 6.4x | 6.8x | 10.5x | 11.1x | 24.3x | 6.9% |
GS | $306.6B | 15.8x | 14.9x | 2.6x | 4.3x | 4.5x | 7.5x | 27.4x | -13.5% |
| Ticker | Mkt cap | P/E | P/E fwd | P/S | P/S fwd | P/GP | P/GP fwd | EV/EBITDA | FCF yld |
|---|---|---|---|---|---|---|---|---|---|
MS | $342.8B | 17.5x | 16.9x | 2.7x | 4.2x | 4.5x | 7.0x | 24.1x | -4.6% |
BIP | $18.3B | 55.4x | 36.7x | 0.7x | 1.4x | 2.8x | 5.3x | 7.2x | -3.1% |
HASI | $5.1B | 61.0x | 13.3x | 11.1x | 11.0x | 40.2x | 39.8x | n/m | 4.1% |


| Ticker | Mkt cap | P/E | P/E fwd | P/S | P/S fwd | P/GP | P/GP fwd | EV/EBITDA | FCF yld |
|---|---|---|---|---|---|---|---|---|---|
SPY | $773.0B | — | — | — | — | — | — | — | — |
NVDA | $5.5T | 34.3x | 25.0x | 21.5x | 13.9x | 29.0x | 18.7x | 28.3x | 2.2% |
AVGO | $1.8T | 59.5x | 31.8x | 23.2x | 16.6x | 34.7x | 24.8x | 42.8x | 1.9% |
Consensus projections
| Ticker | FY2026E | FY2027E | FY2028E | |
|---|---|---|---|---|
BX | Revenue | +15.1% | +24.9% | +4.0% |
| EPS | +11.3% | +24.9% | +10.7% | |
APO | Revenue | +26.8% | +16.1% | +14.3% |
| EPS | +10.4% | +22.4% | +15.6% | |
ARES | Revenue | +16.3% | +19.1% | +9.9% |
| EPS | +17.3% | +24.2% | +18.2% | |
KKR | Revenue | +33.9% | +17.8% | +32.9% |
| EPS | +26.0% | +18.0% | +15.7% | |
CG | Revenue | −1.7% | +36.3% | +9.0% |
| EPS | −10.1% | +41.6% | +15.4% | |
BAM | Revenue | +12.2% | +16.1% | +12.9% |
| EPS | +12.9% | +17.8% | +16.8% | |
BN | Revenue | −7.4% | +23.6% | +22.3% |
| EPS | +14.2% | +23.1% | +12.0% | |
OWL | Revenue | +5.9% | +10.5% | +16.1% |
| EPS | +7.9% | +11.4% | +14.5% | |
GS | Revenue | +20.6% | +2.7% | +1.8% |
| EPS | +42.8% | +4.7% | +5.3% | |
MS | Revenue | +16.6% | +5.5% | +5.6% |
| EPS | +30.4% | +5.9% | +8.1% | |
BIP | Revenue | +61.2% | −25.6% | +8.1% |
| EPS | +2.1% | +38.8% | −2.9% | |
HASI | Revenue | +19.3% | +11.0% | +13.4% |
| EPS | +12.0% | +10.3% | +9.4% | |
NVDA | Revenue | +65.1% | +84.2% | +43.2% |
| EPS | +59.0% | +91.7% | +42.0% | |
AVGO | Revenue | +66.8% | +66.1% | +34.5% |
| EPS | +71.8% | +68.7% | +34.8% |
Forward fiscal years only. Blank means no analyst coverage for that year.
Blackstone, the world's largest alternative asset manager, told investors in July that the total value of its data-center platform had reached $185bn, up from $130bn at the start of the year. The firm holds entitled land with secured power for roughly 15 gigawatts of capacity, enough to support about $200bn of development, and expects to lease three times more capacity this year than in any year before. Nine of its ten largest markups in the June quarter were AI-related.
This is the layer of the AI build that rarely gets named: not the chips or the turbines, but the capital that buys them. For eleven months the market treated that layer as a damaged business.
What the three actually reported
Blackstone, which raises third-party money into real estate, credit, private equity and infrastructure funds and earns fees and carry on it, grew June-quarter revenue 28.5% year on year while operating income rose 54.2%. Fee-related earnings reached $1.8bn, up 22%. Assets under management hit a record $1.35tn.
Apollo Global Management is the balance-sheet case. It owns Athene, an annuity writer, and funds lending off that insurance float. Fee-related earnings of $785m set a record, up 25%, and the net spread Athene earns over its cost of funds widened to 114 basis points from 97 the prior quarter. Origination hit $74bn in the quarter — three quarters of it investment grade, averaging BBB+ at 280 basis points over Treasuries.
Ares Management, a direct lender to small and mid-sized companies, is the awkward one. Reported revenue grew just 5.8%, down from 40.8% the prior quarter, and gross profit fell 64.8%. On the fee line it looks nothing alike: fee-related earnings rose 20% to $491m at a 42.3% margin, and the firm raised a record $36bn. Its credit book shows no strain — direct-lending non-accruals below 2%, with borrower EBITDA growing 9%.
Why the money rung matters now
The demand is structural. Coverage on hyperscaler public bond deals collapsed from roughly five times in February to under two times by July, pushing issuers toward private vehicles that banks cannot underwrite at size. In August, Apollo and Blackstone arranged a $35bn financing for Broadcom's AI XPV Platform, a vehicle that buys Google Tensor Processing Units and leases them to Anthropic, with Broadcom guaranteeing residual value on $30bn of the debt. Apollo says it was the only lender able to commit the full amount, closing in weeks. Days earlier Nvidia signed memorandums with Apollo, Blackstone, Brookfield, KKR, BlackRock and Goldman Sachs to mobilize over $500bn of third-party capital — an attempt to make GPUs a borrowable asset class.
What broke them, and what didn't
The damage was not about rates. The worst sessions of the past year fell in February, when retail redemption queues broke: Blue Owl halted withdrawals, Ares capped its Strategic Income Fund at 5% after requests hit 11.6% of assets, and Apollo honored roughly $730m of more than $1.5bn requested at its debt fund in March. Ares fell 11.2% on 5 February. Peak-to-trough, Apollo lost 41%, Blackstone 46%, Ares and KKR 48% each. Credit mix explains the ranking: Apollo holds 86% of fee-earning assets in credit, Ares 66%, Blackstone only 34%.
The rate story inverts on inspection. Through the week the 30-year Treasury touched 5.323%, a 19-year high, on 18 August, Blackstone rose 2.0% and Ares was flat, while Goldman Sachs and Morgan Stanley — the supposed beneficiaries of a steep curve — fell 3.0% and 2.9%.
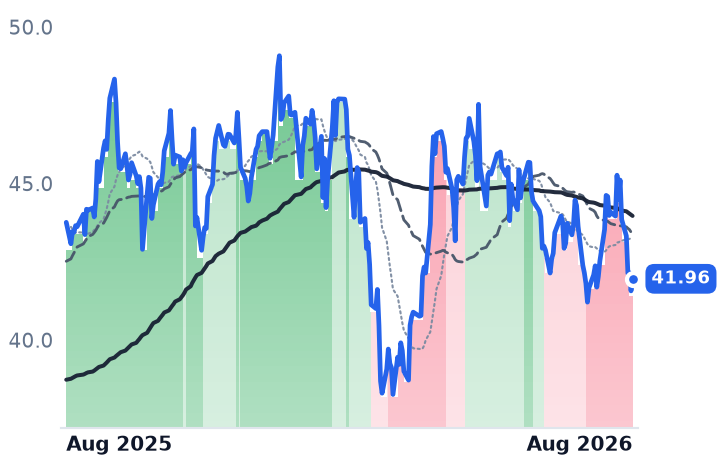
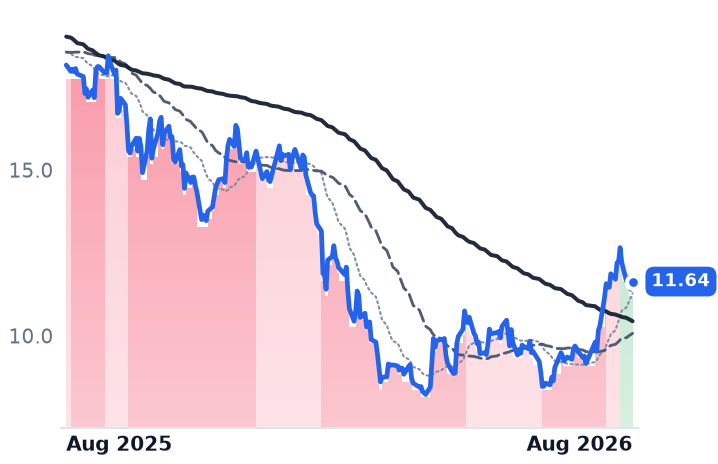
The shares turned on 12–13 August and have held an uptrend for eight sessions, Blackstone's first since October and Ares's since September. Over thirty days Ares is up 18.1% and Blackstone 16.7%. Over twelve months they remain down 22.0% and 15.9%, against Goldman up 37.5% and the S&P 500 up 18.5%.
Whether the price leaves room
Forward earnings is the only lens that compares these three; Apollo consolidates Athene's insurance premiums, which distorts every revenue-based ratio. Blackstone trades at 24.0x forward against 31.9x trailing. Ares trades at 24.1x forward against 61.7x trailing, with a 1.8% free-cash-flow yield — its case depends entirely on consensus GAAP earnings roughly doubling. Apollo is the outlier at 15.1x forward, on a 10.5% free-cash-flow yield.
The telling comparison is against early May, when Blackstone traded at 30.8x trailing, Ares at 64.8x and Apollo at 22.1x. Today's figures are flat to lower while fee earnings compounded above 20%. August's rally re-rated nothing.
The setup
Where it stands — Fee earnings at all three grew above 20% while trailing multiples sit at or below their early-May levels. Would confirm — Apollo delivering its guided 20%-plus full-year fee-related earnings growth with origination above $70bn again in Q3. Would invalidate — Non-traded fund redemption queues reopening above the February peak, or Ares direct-lending non-accruals passing 3%. Watch next — Third-quarter results in late October, with Blackstone's data-center platform value and Ares's Q4 digital-infrastructure fund close. Valuation — Blackstone 24.0x forward vs 31.9x trailing; Ares 24.1x vs 61.7x; Apollo 15.1x vs 28.7x.