

Cohu's Computing Orders Rose 150% and Now Outweigh the Autos That Defined It
Hypothesis Opus 5 · Research Opus 5 · Writing Opus 5 · Prompt v1.5
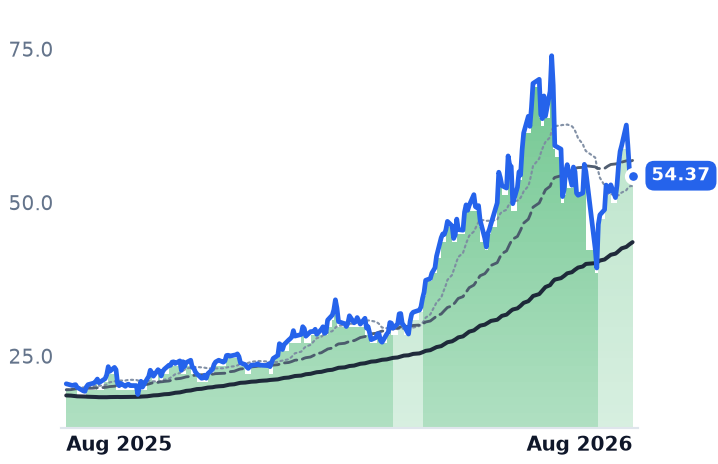
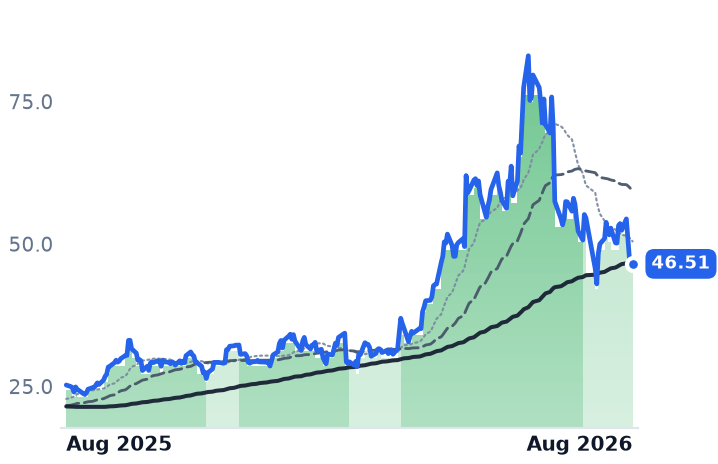
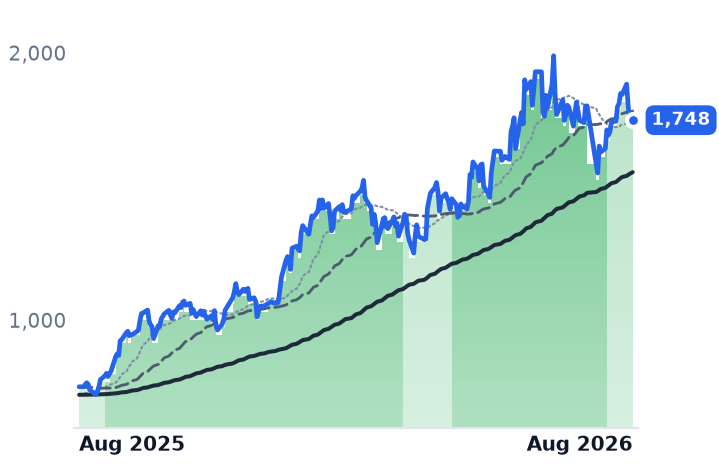
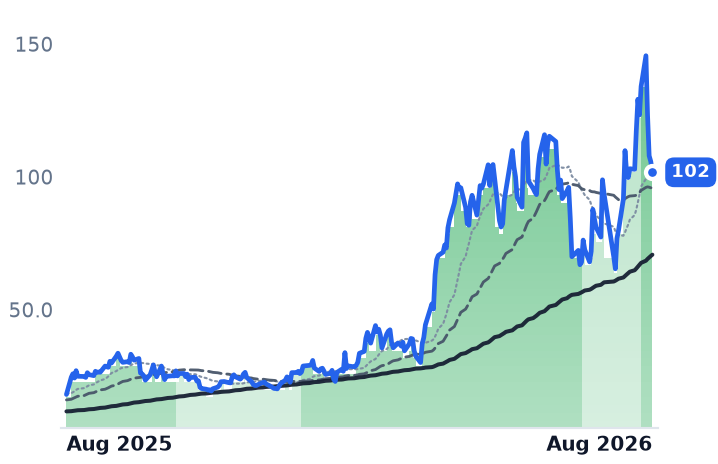
Cohu spent a decade known as the handler supplier to carmakers' chip plants. In the June quarter, orders from computing customers rose 150% from a year earlier to 46% of all system orders, while automotive orders fell 24% — and the company raised full-year revenue guidance to roughly 35% growth. That mix shift is why Cohu is the only member of the advanced-packaging test group meaningfully higher over three months, up 23% while FormFactor slipped and MKS fell.
The catch is that Cohu is the one name that re-rated rather than got cheaper. It trades at 12.5x trailing gross profit against 9.5x in February, on a business that reported GAAP operating income of $0.29m and a small net loss last quarter. FormFactor, growing faster with a 50.7% gross margin, got cheaper on the same lens. Cohu's AI story is real; its profit is not there yet.
| Ticker | Company | Segment | Trend · 13mo | 30D | 1Y |
|---|---|---|---|---|---|
| The subject · what this brief is about | |||||
COHU | Cohu | Semiconduct Equipment | 🟢 Cont. Bull | +28.0% | +165.5% |
FORM | FormFactor | Process Control & Metrology | 🟢 Cont. Bull | +29.4% | +291.5% |
MKSI | MKS | Instrumentation & Test Equipment | 🟢 Cont. Bull | −2.2% | +166.4% |
| Compared against · context, not the story | |||||
ACLS | Axcelis Technologies | Semiconduct Equipment | 🟢 Cont. Bull | +2.5% | +51.3% |
VECO | Veeco Instruments | Semiconduct Equipment | 🟢 Cont. Bull | +1.8% | +84.2% |
ICHR | Ichor | Other | 🟢 Cont. Bull | −11.6% | +231.5% |
GLW | Corning | Display & Optical Materials | 🟢 Cont. Bull | +18.4% | +129.0% |
AMAT | Applied Materials | Semiconduct Equipment | 🟢 Cont. Bull | +2.3% | +200.9% |
ASML | ASML | Semiconduct Equipment | 🟢 Cont. Bull | +10.4% | +132.8% |
LRCX | Lam Research | Semiconduct Equipment | 🟢 Cont. Bull | +14.1% | +208.8% |
KLAC | KLA | Semiconduct Equipment | ⚠️ Emerging Bear | −3.9% | −78.9% |
TER | Teradyne | Semiconduct Equipment | 🟢 Cont. Bull | +14.4% | +218.8% |
AEHR | Aehr Test Systems | Semiconduct Equipment | 🟢 Cont. Bull | +45.3% | +462.0% |
WOLF | Wolfspeed | Discrete & Power | 🌱 Emerging Bull | +17.7% | +16.6% |
AXTI | AXT | Discrete & Power | 🟢 Cont. Bull | +65.4% | +2408.5% |
ONTO | Onto Innovation | Semiconduct Equipment | 🟢 Cont. Bull | +18.8% | +164.8% |
CAMT | Camtek | Process Control & Metrology | ⚠️ Emerging Bear | +3.1% | +75.0% |
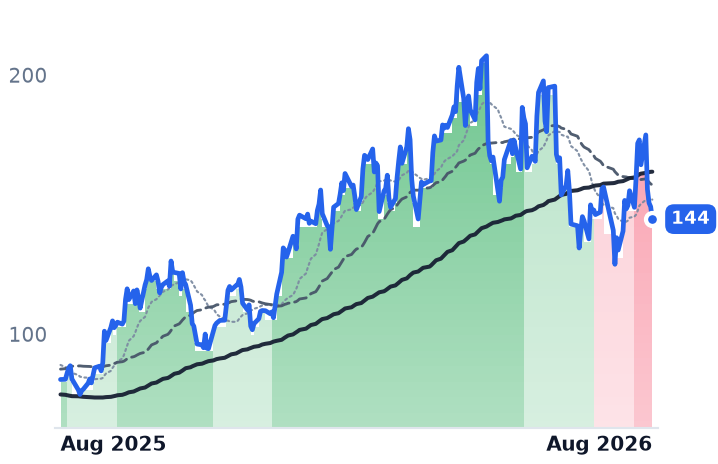
12-month price & trend
| Ticker | Mkt cap | P/E | P/E fwd | P/S | P/S fwd | P/GP | P/GP fwd | EV/EBITDA | FCF yld |
|---|---|---|---|---|---|---|---|---|---|
COHU | $2.6B | n/m | 57.2x | 4.9x | 4.2x | 12.5x | 10.7x | 117.6x | 1.4% |
FORM | $8.9B | 77.1x | 37.5x | 9.9x | 8.6x | 21.6x | 18.9x | 51.5x | 1.5% |
MKSI | $18.9B | 42.7x | 21.3x | 4.3x | 3.7x | 9.8x | 8.4x | 24.0x | 2.4% |
| Ticker | Mkt cap | P/E | P/E fwd | P/S | P/S fwd | P/GP | P/GP fwd | EV/EBITDA | FCF yld |
|---|---|---|---|---|---|---|---|---|---|
ACLS | $3.9B | 42.1x | 33.0x | 4.5x | 4.6x | 10.4x | 10.7x | 29.5x | 1.7% |
VECO | $3.3B | 142.0x | 34.9x | 4.9x | 4.2x | 12.9x | 11.1x | 62.8x | 2.6% |
ICHR | $2.1B | n/m | 38.3x | 2.1x | 1.7x | 20.4x | 16.7x | 318.5x | -1.2% |
| Ticker | Mkt cap | P/E | P/E fwd | P/S | P/S fwd | P/GP | P/GP fwd | EV/EBITDA | FCF yld |
|---|---|---|---|---|---|---|---|---|---|
GLW | $129.0B | 67.8x | 45.7x | 7.6x | 6.7x | 20.9x | 18.5x | 34.8x | 1.9% |
AMAT | $425.0B | 45.9x | 43.6x | 13.8x | 12.7x | 27.9x | 25.7x | 37.3x | 1.5% |
ASML | $725.8B | 56.9x | 49.4x | 17.1x | 16.8x | 32.4x | 31.8x | 43.4x | 1.7% |
| Ticker | Mkt cap | P/E | P/E fwd | P/S | P/S fwd | P/GP | P/GP fwd | EV/EBITDA | FCF yld |
|---|---|---|---|---|---|---|---|---|---|
LRCX | $430.0B | 59.4x | 36.7x | 18.5x | 12.4x | 36.7x | 24.6x | 49.2x | 1.1% |
KLAC | $268.8B | 55.9x | 37.5x | 19.8x | 14.8x | 32.3x | 24.2x | 47.4x | 1.4% |
TER | $59.4B | 51.8x | 41.2x | 13.3x | 11.5x | 22.4x | 19.4x | 40.7x | 1.3% |
| Ticker | Mkt cap | P/E | P/E fwd | P/S | P/S fwd | P/GP | P/GP fwd | EV/EBITDA | FCF yld |
|---|---|---|---|---|---|---|---|---|---|
AEHR | $3.3B | n/m | 134.2x | 65.2x | 24.6x | 188.0x | 70.8x | n/m | -0.2% |
WOLF | $1.3B | n/m | — | 2.0x | 2.1x | — | — | n/m | -21.8% |
AXTI | $3.6B | — | 82.6x | 28.6x | 16.5x | 88.9x | 51.2x | 223.3x | -0.5% |
| Ticker | Mkt cap | P/E | P/E fwd | P/S | P/S fwd | P/GP | P/GP fwd | EV/EBITDA | FCF yld |
|---|---|---|---|---|---|---|---|---|---|
ONTO | $14.6B | 109.5x | 36.2x | 13.0x | 10.2x | 25.9x | 20.3x | 56.0x | 1.7% |
CAMT | $6.8B | 183.5x | 40.6x | 13.5x | 11.5x | 26.9x | 23.1x | 239.3x | 0.0% |
Consensus projections
| Ticker | FY2026E | FY2027E | FY2028E | |
|---|---|---|---|---|
COHU | Revenue | +35.3% | +25.7% | +15.3% |
| EPS | +131844.4% | +94.3% | +38.4% | |
FORM | Revenue | +32.4% | +15.9% | +2.5% |
| EPS | +170.0% | +23.0% | +16.9% | |
MKSI | Revenue | +29.6% | +20.1% | +8.8% |
| EPS | +67.0% | +33.3% | +13.8% | |
ACLS | Revenue | +3.5% | +9.6% | +20.0% |
| EPS | −14.8% | +26.4% | +41.7% | |
VECO | Revenue | +18.6% | +35.6% | — |
| EPS | +17.4% | +101.8% | — | |
ICHR | Revenue | +31.2% | +31.5% | +9.9% |
| EPS | +821.7% | +108.2% | +12.8% | |
GLW | Revenue | +17.4% | +18.7% | +21.5% |
| EPS | +29.9% | +31.8% | +37.3% | |
AMAT | Revenue | +18.3% | +28.9% | +20.8% |
| EPS | +31.2% | +38.7% | +28.8% | |
ASML | Revenue | +33.7% | +27.3% | +20.6% |
| EPS | +54.0% | +37.1% | +28.6% | |
LRCX | Revenue | +27.0% | +49.0% | +18.6% |
| EPS | +41.9% | +64.7% | +25.5% | |
KLAC | Revenue | +12.2% | +33.9% | +19.0% |
| EPS | +14.5% | +47.8% | +21.0% | |
TER | Revenue | +67.0% | +21.3% | +24.5% |
| EPS | +158.9% | +27.6% | +31.5% | |
AEHR | Revenue | −17.7% | +171.0% | +0.0% |
| EPS | −211.4% | −665.7% | +0.0% | |
WOLF | Revenue | +0.7% | −15.2% | +23.7% |
| EPS | +275.2% | −39.2% | −22.4% | |
AXTI | Revenue | +140.9% | +111.3% | +47.0% |
| EPS | −306.1% | +158.9% | +48.5% | |
ONTO | Revenue | +2.2% | +42.2% | +29.3% |
| EPS | −5.1% | +63.1% | +39.9% | |
CAMT | Revenue | +19.8% | +27.3% | +16.5% |
| EPS | +12.9% | +35.3% | +18.8% |
Forward fiscal years only. Blank means no analyst coverage for that year.
Cohu builds the machines that grip a finished chip, drive it to the temperature it will face in the field, and press it onto a bed of contact pins so a tester can decide whether the part ships. For most of the last decade the parts in question went into cars and phones, and Cohu's fortunes moved with automotive inventories. That is no longer where its order book comes from.
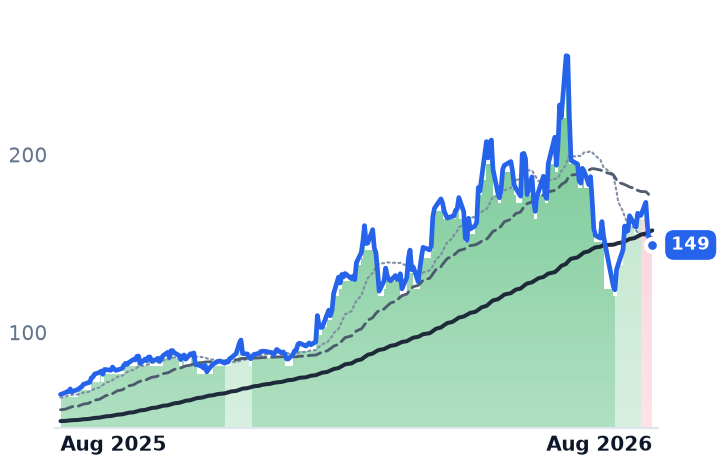
In the June quarter, orders from computing customers rose 150% from a year earlier and accounted for 46% of all system orders. Automotive orders fell 24% over the same span, with utilization at auto and mobile test floors still stuck in the high 70s. Revenue reached $149.0m, up 38.4%, and gross margin came in at 45.4% against 34.4% a year earlier. Management raised full-year guidance to about 35% growth, from 25%, and lifted its high-performance computing revenue target to $100-110m.
What it is actually selling
The product doing the work is Eclipse, a thermal handler built for parts that dissipate serious power — graphics processors and server CPUs whose junction temperature must be held steady while they are tested at full load. Cohu names Han Precision as the incumbent it is taking share from, and argues that one Eclipse platform reconfigures across processor types and device generations, which lowers what a customer risks per capital order. A single customer placed a $26m Eclipse 6 order early in the third quarter, shipping mostly in the fourth. The qualification pipeline behind it runs to roughly $850m of annual customer spending, of which $190m is qualified across four accounts.
The packaging-specific content is smaller and newer: a high-bandwidth-memory inspection system qualified at a Taiwanese assembly-and-test house with an infrared sensor that finds cracks inside the stack, and a first $500,000 booking for optical-engine test.
Why the peers went the other way
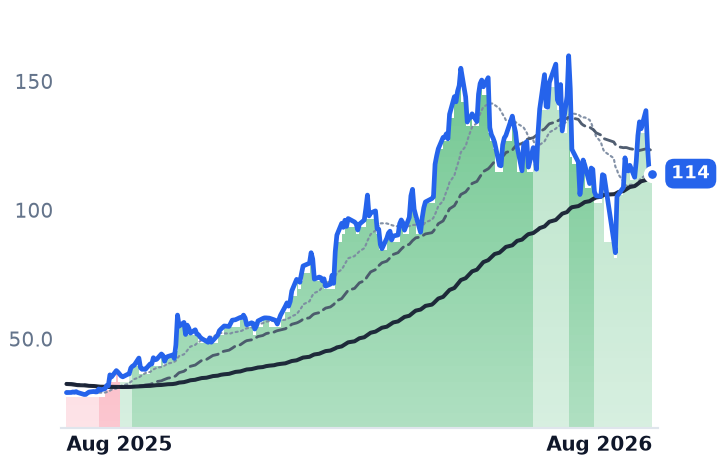
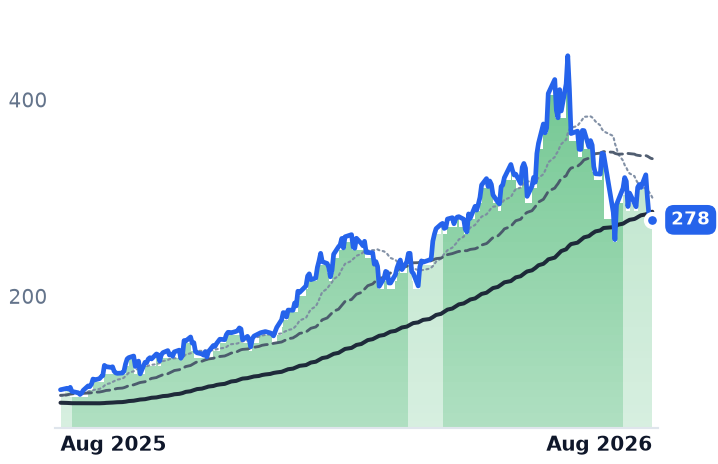
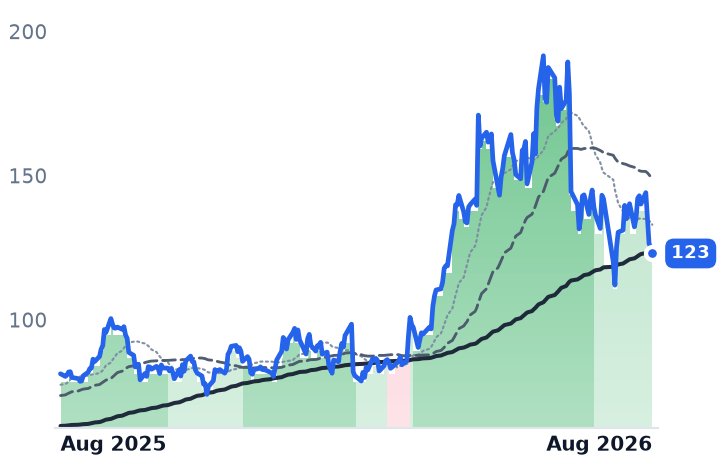
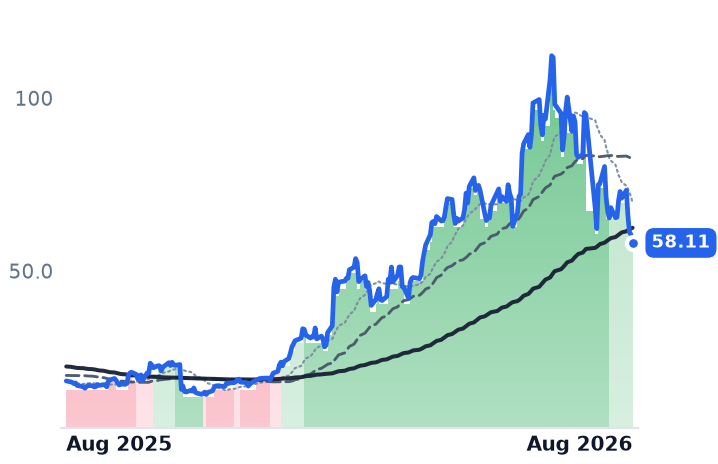
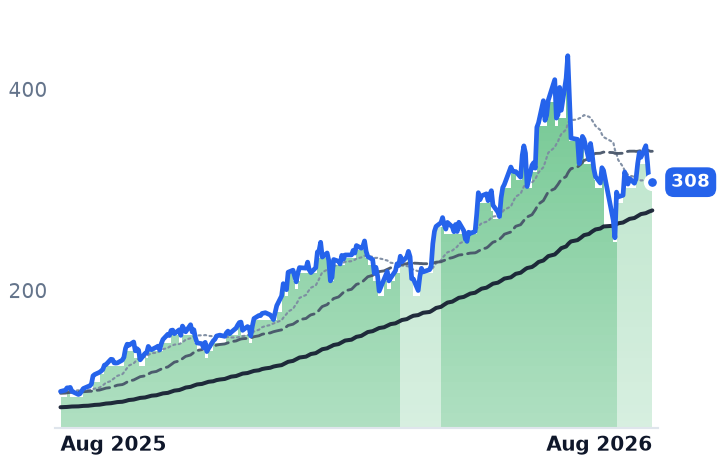
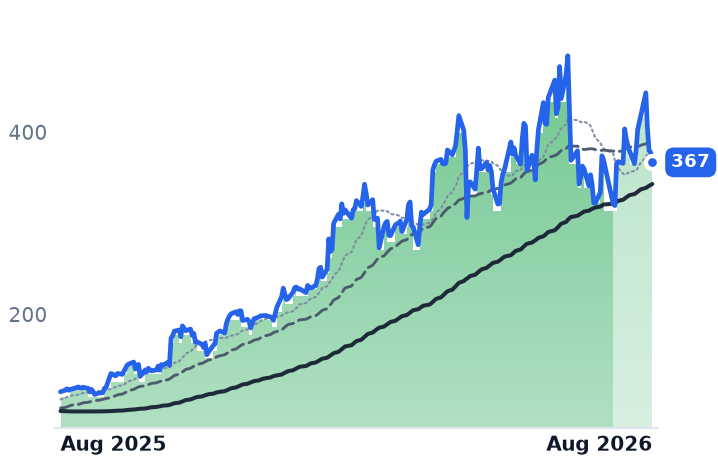
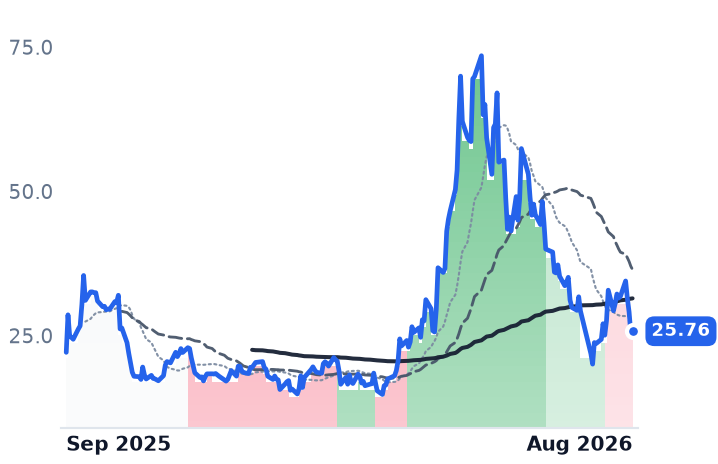
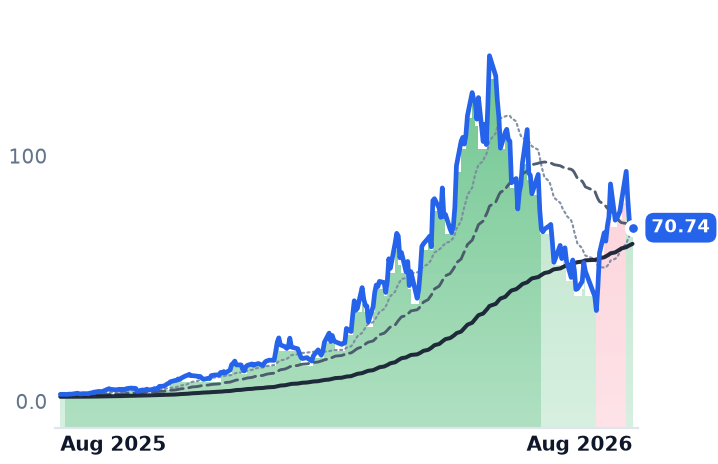
Cohu is up 23% over three months. FormFactor, which makes probe cards — the consumable contact arrays that test chips while still on the wafer — is down 2.8%, and MKS, the supplier of vacuum, laser and electroplating-chemistry equipment behind both the fab and the substrate, is down 5.6%. Axcelis and Veeko, both weighted to mature nodes, fell around 16%.
The business news went the opposite way. FormFactor's gross margin has risen for four straight quarters to 50.7%, from 37.2%, on record DRAM probe-card revenue where high-bandwidth memory is roughly two-thirds of the total. MKS's electronics and packaging arm — the Atotech plating chemistry and laser drilling it bought with debt — grew 44% to $381m, faster than its semiconductor arm, while net leverage fell to 3.0x from 4.0x. Applied Materials, reporting record quarterly revenue of $9.1bn, told investors advanced packaging revenue will grow more than 70% in calendar 2026. The demand is not in dispute.
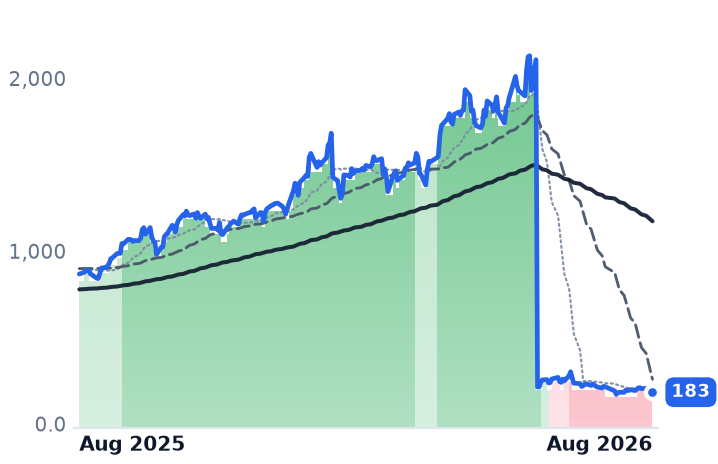
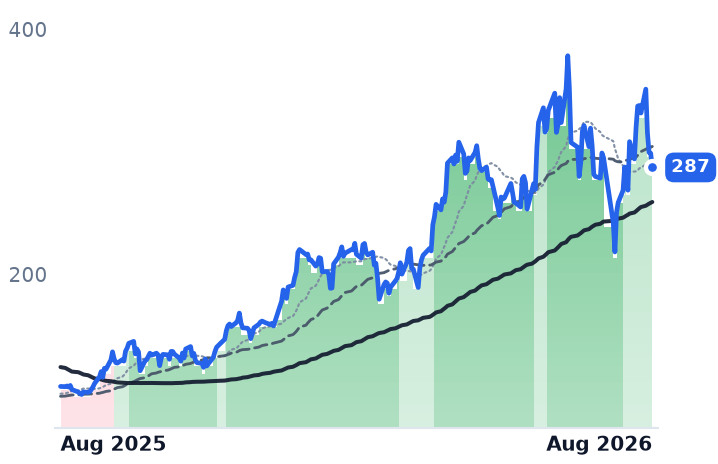
What moved the shares was rates and geopolitics. The 30-year Treasury yield topped 5.33% on 18 August, a 19-year high, repricing order books that sit in 2027 and 2028; days earlier, a report that a Shanghai state-backed firm had begun mass-producing domestic immersion lithography tools knocked ASML, Applied Materials, Lam Research and KLA about 7%. On 19 August FormFactor fell 6% with no company news of its own, alongside Aehr and Teradyne.
Where the price sits
Cohu's three-month gain is one day: the session after its 30 July results, when the shares rose 18.1%. Remove that and one other, and the last 30 days is deeply negative. It is also the only one of the three whose valuation went up. Cohu now costs 12.5x trailing gross profit, against 9.5x in February. FormFactor costs 21.6x, down from 28.7x in May while its trailing gross profit grew 16.5%. MKS costs 9.83x, down from 11.91x.
The difference is earnings. Cohu's trailing profit is negative, so the forward multiple of 57x on 2026 estimates carries the whole case. And the same memory scarcity lifting FormFactor's probe cards is a cost line for Cohu, which is pre-buying components at elevated prices with pass-through talks only beginning.
The setup
Where it stands — Cohu's order mix has flipped to computing, but the re-rating has run ahead of any GAAP profit. Would confirm — Third-quarter revenue near the guided $170m with gross margin around 45% and positive GAAP net income. Would invalidate — Computing orders falling back below 30% of system orders, or gross margin slipping under 43% on memory costs. Watch next — Third-quarter results, due late October, plus conversion of the $250m in active qualification. Valuation — 12.5x trailing gross profit versus 9.5x in February; forward price/earnings 57x, trailing not meaningful.